
Vista Investors
Executive Summary
Our firm’s hallmark investment product will be the Vista Total Market Equity strategy and will be initially offered through a mutual fund that is registered by the U.S. Securities Exchange Commission (SEC). Technological advancements also permit for other economically feasible distribution channels, such as separately managed portfolios for large accounts. The details of our particular investment product offerings are revealed in another section of this plan. However, it’s worth stating up front that we are extremely encouraged by a research piece to be published in the Journal of Portfolio Management, that supports the philosophy behind our primary product offering. Ennis Knupp, a premier institutional investment consulting firm, published a study called, “Failure of the Multiple-Specialist Strategy: The Case for Whole Stock Portfolios.” One of the underlying tenets is that specialization within equity portfolio management has gone too far; thus resulting in sub-optimal portfolios.
VISTA INVESTORS will be structured as a partnership designed to capitalize on industry research performed by one of the founding entrepreneurs, Michael Douglas, during his professional career in investment management research. Last year alone, Mr. Douglas conducted research visits at the investment offices of over 30 firms. In addition, he conducted literally hundreds of meetings with key investment professionals from around the globe either in person or via telephone conference. Mr. Douglas’s team presents this business plan as a “start from scratch” outline of what a successful investment management organization should look like as the industry evolves in response to political, social, technological, and other influences.
VISTA INVESTORS will offer high net worth or “angel” investors opportunity to assume minority ownership positions in exchange for contributions to VISTA INVESTORS’ operating capital and for providing seed assets to establish the investment products described herein. This document alone does not constitute an offer of any type, nor does it provide any guarantee, financial, or otherwise. Risks associated with the VISTA INVESTORS’ business plan are not limited to those detailed in this document.

1.1 Objectives
The purpose of VISTA INVESTORS is to create value for owners, employees, and investors via the establishment of an investment management organization designed for the Third Generation. The Third Generation is defined in a cutting-edge research effort by Merrill Lynch & Co., Inc. and Barra Strategic Consulting Group as a phase in the investment industry requiring a special set of capabilities for success. Our team has drawn upon this study, numerous other studies, and perhaps most importantly, our own experience in the industry, to define a plan for the success of VISTA INVESTORS.
1.2 Mission
Buy and sell decisions are implemented quickly and efficiently across all portfolios. Where applicable, a trading rotation is used to avoid any type of systematic advantage or disadvantage an account may experience. Under virtually no circumstances would we deviate from our discipline.
1.3 Keys to Success
Probably the single most important factor that defines success in the investment management business is performance. Thus, one of our primary goals is the achievement of a rating by Morningstar, an organization widely known by both individual and institutional investors for its marks of accreditation in the mutual fund industry. To be rated by Morningstar, funds must have a minimum performance history of three years.
Company Summary
VISTA INVESTORS will be structured as a partnership designed to capitalize on industry research performed by one of the founding entrepreneurs, Michael Douglas.
This company is unique because it differs substantially from the way most existing investment management firms originated. Most of the firms created in the last 25 years were started by the departure of portfolio managers from the nation’s largest banks, insurance companies, and brokerage firms. Generally, these individuals were deep in investment research talent but novice as it concerns the business and operating side of running an organization. The business plan for VISTA INVESTORS is different. VISTA INVESTORS is to be created by someone deep in knowledge of all aspects concerning investment management organizations. Investment talent will be acquired and retained by offering key individuals competitive compensation to include equity stakes. Biographies for individuals selected for the management team are enclosed.
2.1 Start-up Summary
The following tables and chart show our Start-up requirements and planned funding.
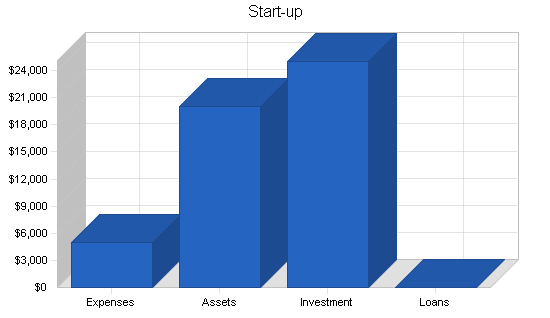
| Start-up Funding | |
| Start-up Expenses to Fund | $5,000 |
| Start-up Assets to Fund | $20,000 |
| Total Funding Required | $25,000 |
| Assets | |
| Non-cash Assets from Start-up | $0 |
| Cash Requirements from Start-up | $20,000 |
| Additional Cash Raised | $0 |
| Cash Balance on Starting Date | $20,000 |
| Total Assets | $20,000 |
| Liabilities and Capital | |
| Liabilities | |
| Current Borrowing | $0 |
| Long-term Liabilities | $0 |
| Accounts Payable (Outstanding Bills) | $0 |
| Other Current Liabilities (interest-free) | $0 |
| Total Liabilities | $0 |
| Capital | |
| Planned Investment | |
| Michael Douglas | $8,334 |
| Mark Haynes | $8,333 |
| Other | $8,333 |
| Additional Investment Requirement | $0 |
| Total Planned Investment | $25,000 |
| Loss at Start-up (Start-up Expenses) | ($5,000) |
| Total Capital | $20,000 |
| Total Capital and Liabilities | $20,000 |
| Total Funding | $25,000 |
| Start-up | |
| Requirements | |
| Start-up Expenses | |
| Legal | $1,000 |
| Stationery etc. | $200 |
| Brochures | $300 |
| SEC filings | $1,200 |
| Insurance | $300 |
| Research and development | $1,500 |
| Other | $500 |
| Total Start-up Expenses | $5,000 |
| Start-up Assets | |
| Cash Required | $20,000 |
| Other Current Assets | $0 |
| Long-term Assets | $0 |
| Total Assets | $20,000 |
| Total Requirements | $25,000 |
Investment Philosophy
VISTA INVESTORS believes the goal of U.S. equity portfolios should be to outperform the broad market, as measured by the Wilshire 5000 or Russell 3000. Exposure to economic sectors will roughly approximate those of the benchmark. Our view is that any deviation from the benchmark represents a bet, or in our case, a calculated risk that will determine over or under performance. Portfolios will also maintain market cap exposure to large cap (>$10 billion), mid cap ($2 billion to $10 billion), and small cap (<$2 billion) securities. Like weightings to economic sectors, the weight of the portfolio allocated to large, medium, or small stocks represents a bet relative to the benchmark. On average, our portfolios will hold roughly 2/3 of their value in large cap stocks, and 1/3 of their value in mid and small cap stocks. This distribution among capitalization ranges represents a modest bet that mid and small cap stocks will outperform, consistent with studies showing small company stocks outperform larger companies in the long run.
We believe our process will be successful in the future for the following reasons:
- It provides the opportunity to outperform the market without taking undue risks.
- It does not concentrate heavily in a narrow segment of the market (e.g. small cap growth stocks, energy stocks, telecom stocks), thus portfolios are more likely to maintain a stable asset base when certain areas rotate out of favor and prompt redemptions.
- It simplifies investor’s portfolios by reducing the number of managers or funds they need in their overall asset allocation.
A recent research piece by Ennis Knupp, a leading institutional investment consultant, provides support for what they call “whole stock” portfolios. They believe manager specialization has gone too far resulting in inefficient structures that provide index-like returns at excessive fees.
The decision-making process is one of consensus. The portfolio management team meets weekly to discuss the portfolio and any changes to it. In rare cases, if we fail to reach a consensus decision, the CIO will act as the arbiter, usually prompting for additional research, but if necessary, providing a final decision. Our investment model is one in which portfolio managers are also analysts. This concept of portfolio managers/analysts making decisions on a team was recognized and adopted for its proven success in a few select firms that have been extremely successful from both an investment and business perspective. Portfolio manager/analyst responsibilities include idea generation, due diligence, and completion of research projects directed by the CIO. While each portfolio manager/analyst has experience in various areas, they are generalists in the sense that they are not assigned specific sector responsibilities. We find this allows individuals to remain stimulated by their jobs. At least one research assignment per month will be that of an in-depth review of an economic sector. We find this provides sufficient coverage per economic sector and enhances the team’s overall coverage of the broad market.

Market Analysis Summary
Much of our analysis focuses on the mutual fund segment of the investment industry because it is such a large component of the overall landscape. We have additionally provided information as it pertains to the management of separately managed portfolios (i.e. “separate accounts”). To understand the data here, one must understand that separate account managers must register their firms with the SEC. Thus, they are known as “Registered Investment Advisors.” For VISTA INVESTORS, the technologies we have selected will enable us to capitalize by utilizing both product types, mutual funds and separate accounts.
Our analysis supports the 20% to 25% projected growth rates by outside sources. Probably the most important aspect to these projections are the factors that will fuel these rates of growth. The following section contains some of the key variables to creating this growth environment. All are expected to have a positive impact on the investment industry for at least the next three years.

| Market Analysis | |||||||
| Year 1 | Year 2 | Year 3 | Year 4 | Year 5 | |||
| Potential Customers | Growth | CAGR | |||||
| Mutual Funds | 20% | 4,500 | 5,400 | 6,480 | 7,776 | 9,331 | 20.00% |
| Separate Accounts | 25% | 1,100 | 1,375 | 1,719 | 2,149 | 2,686 | 25.01% |
| Total | 21.03% | 5,600 | 6,775 | 8,199 | 9,925 | 12,017 | 21.03% |
4.1 Business Participants
The number of participants in the investment industry is large. They range from providers of a single investment product to multi-product firms with literally hundreds, if not thousands, of investment product offerings. The several-trillion-dollar industry certainly has the size to support a large number of firms. However, many participants are not “complete” firms as it pertains to the capabilities required for success in today’s, but more importantly, tomorrow’s environment.
4.2 Target Market Segment Strategy
Our target market will be highly dependent on the stage of our product in its development cycle. Most of the marketing opportunity will occur beyond the first year of product development. However, some initial opportunities do exist. For example, the firm can utilize its transfer agent’s distribution services, which would put the product in a highly visible online platform. Additional opportunities include marketing to programs that invest specifically in “emerging managers.” Furthermore, the high net worth and retail marketplace can be accessed to a limited degree, even in the early stages, through similar creative opportunities and already-established relationships with clients.
Like manufacturing organizations, investment management firms must develop products to provide to their customers. This plan provides substantial market analysis to support the trends expected to occur in the field of investment management and the types of investment products that will be demanded. VISTA INVESTORS’ hallmark product offering will be the Vista Total Market Equity strategy, an investment product offering based on the evidence supporting investor’s desires to outperform the overall market via a single, diversified vehicle and to avoid the need to create complex investment structures such as those employed by institutional investors.
4.3 Positioning Statement
While it’s important to show some level of consistency with the latest trends in the industry, it’s more important to provide a solution that will stand the test of time. The decade of the 1990s is littered with examples in which individual investors have chased past performance and have sought unrealistically high returns by investing in recently hot investment vehicles, often concentrated in niche areas such as technology specific funds (e.g. Internet mutual funds) or style specific funds (e.g. small company growth mutual funds). The hard learned lessons for individual investors are that past performance is no guarantee of future performance, and that the market tends to favor one area for a period of time only to unpredictably rotate in favor of another area at a later time. Additional support for our strategy comes from the tendency for individual investors to mimic the strategies they see utilized by the nation’s largest institutional investors (e.g. pension funds and university endowments). Because of their size, institutional investors allocate their assets to various portions of the U.S. equity market (e.g. large cap growth, small cap growth, large cap value, small cap value, etc.) by selecting investment firms and products that are specialized in certain areas. These structures are complex, and as research contained herein suggests, inefficient as it pertains to the average investor. In fact, a prominent investment consulting firm is advocating what they call “whole portfolio” strategies for institutional clients where the overriding feature is to reduce the inefficiencies they have observed in their institutional client portfolios.
We are extremely encouraged about the outlook for our total market portfolio strategy. One of the underlying tenets of Knupp study (mentioned in Section 1.0) is that specialization within equity portfolio management has gone too far; thus resulting in sub-optimal portfolios. Many portfolios piece together numerous managers, resulting in index-like structures at high fees that are incapable of providing the performance sought after by active portfolio management in the first place. In fact, the study estimates the annual cost to institutions of operating a multi-manager portfolio at 1.20%. This is a huge amount when considering the negative effects this would have on a portfolio held for the long-term. Additionally, we can state with nearly 100% confidence that this cost is even higher for individual investors. The prescription to institutional investors by the study is to embrace the entire opportunity set represented by an asset class via utilization of more simplified structure. Simply put, we concur.
We’ll go one step further to purport this is even more important as it applies to individual investors. The level of acceptance of “Whole Stock” portfolios among institutions remains to be seen. Some institutions may find difficulty with the concept simply because the large size of their portfolios makes it prohibitive to reduce the number of managers within their portfolios. However, this concept is one to be embraced by individuals because it simplifies their portfolios, while at the same time reduces the need for outside counseling. The trend toward more simplified portfolio structures is simply a reversion to the way things were prior to the specialized categories and labels developed for equity products over the last couple decades.
4.4 Service Business Analysis
The investment industry is a classic example of a traditional industry embracing technology to become more efficient. It is clearly fragmented, and while the past few years have seen some consolidation, fragmentation will remain due to the differentiation in investment products, both real and perceived. It’s important not to understate the complexities of this industry. While mature by some measure, a dynamic change (e.g. advancements in communications and other technologies) and a positive environment for investing have created opportunities that will perpetuate well into the next decade.
“The investment industry is complex. It has many moving parts and it’s experiencing dynamic change. If this was not the case, opportunity probably would not exist.”
– Mike Douglas
The beauty of investment management is that great economies of scale can be achieved with successful investment product offerings. When organized efficiently and provided with the appropriate technology and support services, the size and number of accounts becomes irrelevant. Essentially, the underlying portfolio (product) is the same. Additionally, related products can be easily derived from the main product platform. At a recent investment conference, the CEO of IOMEGA stated, “…derivative products are important in any industry.” We would certainly agree. Thus, we have provided for introduction of closely related products to be launched during the later stages of our start-up (see Multi-Product Platform). These derivative products include a balanced product (our Total Market Equity strategy combined with a non-proprietary, fixed-income product), a large stock product (the large cap portion of our Total Market Equity strategy), and an extended market product (the mid and small cap portion of our Total Market Equity strategy). As an investment track record is developed, marketing opportunity expands. Additionally, a successful product can be leveraged into derivative products, thereby increasing asset gathering potential.
A study by Merrill Lynch shows that mutual funds with 4-star or 5-star ratings (the two highest levels) accounted for 74% of net asset flows over the last four years; however, there are virtually no guarantees when it comes to investment performance. This is evidenced by the SEC mandated disclosures attached to all mutual fund disclosure. If a firm takes all the steps to “stack the deck” in its favor, the probability of achieving the desired success is significantly increased. In the following sections we outline a plan that identifies the right people to execute the investment process within an environment conducive to efficient investment management practices. As it pertains to the investment management industry, a properly “stacked deck” (i.e. the optimal organization) is a competitive advantage that cannot easily be achieved by many of the firms in existence today for a variety of reasons.
4.4.1 The Three P’s
There are three P’s commonly associated with investment management organizations: People, Process, and Performance. The prior two determine the latter.
While this proposal highlights many areas (market research, financial projections, etc.), there are only two areas that will ultimately determine the level of success achieved by this group. The first is the people. Bright, energetic, talented, and knowledgeable individuals compose the core of the team presented to you. In addition, research explains that the most qualified investment professionals are attracted to efficient firms that are free from bureaucracy and that align interests via equity stakes. Process is the second critical element of this proposal. Cutting-edge research is provided in support of our portfolio management process. The implementation of our process is maximized by outsourcing virtually all functions not related to portfolio management and research, thereby exploiting the firm’s human capital.
Management Summary
VISTA INVESTORS has compiled a preliminary management team, and has candidates for other key positions. This information is found in the following sections.
5.1 Portfolio Management Team
Michael John Douglas, CIO and Portfolio Manager, is responsible for execution of the investment process. This includes management for all of the team’s research activities. Mr. Douglas’s most recent position is that of Principal within the Portfolio Strategies Research Group at First Union National Bank. In this position he was responsible for conducting investment manager research resulting in the selection of investment managers to be used with the firm’s high net worth and institutional clients. Prior positions include that of Senior Analyst for a consulting team at Wilshire Associates, where he was responsible for advising on the investment decisions of pension funds, university endowments, and insurance companies. His career includes six years of experience researching and evaluating investment management organizations.
Mr. Douglas earned a Masters in Business Administration from the University of Notre Dame. He also holds Bachelor of Science degrees in Industrial Management and Economics from Carnegie Mellon University. Currently, he is a member of the Association for Investment Management and Research and the Jacksonville Financial Analysts’ Society. Mr. Douglas is also a candidate in the CFA (Chartered Financial Analyst) Program.
Mark Francis Haynes, Senior Portfolio Manager, is responsible for conducting company specific research including execution of research assignments, idea generation, sector/industry analysis, and contribution to the firm’s overall economic outlook. Mr. Haynes’ most recent position is that of Assistant Portfolio Manager at ING Pilgrim Investments. In this position, he was part of a team responsible for the management of a retail closed-end fund and several private collateralized loan obligations (CLOs) consisting of nearly $5 billion in high yield senior debt securities. Prior positions include that of Assistant Vice President and Financial Analyst with both Norwest Bank and Bank One, where he was responsible for financial analysis used to determine the credit worthiness of the firm’s clients. His career includes seven years of experience pertaining to financial statement analysis and credit underwriting.
Mr. Haynes earned a Masters in Business Administration from the University of Notre Dame. He also holds Bachelor of Science degrees in Finance and Human Resource Management from Marquette University. Currently, he is a member of the Association for Investment Management and Research and the Phoenix Financial Analysts’ Society. Mr. Haynes is also a candidate in the CFA (Chartered Financial Analyst) Program.
The name of one member of the portfolio management team cannot be disclosed at this time due to sensitivity surrounding this person’s current employment.
Senior Portfolio Manager, CFA is responsible for conducting company specific research including execution of research assignments, idea generation, sector/industry analysis, and contribution to the firm’s overall economic outlook. This individual’s most recent position is that of Portfolio Manager at a major investment firm in the Northeast. As Portfolio Manager, this person managed a Communications Technology mutual fund with assets of approximately $1 billion. Prior positions include that of Technology Industry Analyst with the same firm. This person’s career includes eight years of experience performing security analysis.
This individual earned a Masters in Business Administration from Carnegie Mellon University. This person also holds a Bachelor of Science degree in Industrial Management from Carnegie Mellon University. Currently, this person is a member of the Association for Investment Management and Research and of a local Financial Analysts’ Society. This individual is a CFA (Chartered Financial Analyst) Charterholder.
5.2 Positions Being Hired
The following positions will be hired following the first round of primary funding:
- Operations Director.
- Marketing Analyst.
- Portfolio Management Assistant/Analyst.
- Administrative Assistant.
- Fund Board of Directors (non-salary position).
Retention of human capital is critical in the investment management industry. Our firm has identified potential benefits providers for medical and retirement. Worth noting is that the retirement plan platform will allow employees to invest retirement savings in VISTA INVESTORS’ mutual fund product. Non-propriety products will also be included to fulfill the requirements of section 401(k) of the tax code for diversity amongst product offering types.
5.3 Operations/Services to be Outsourced
- Fund Accounting and Fund Custodian (likely to be State Street Bank in Boston).
- Transfer Agent (likely to be PFPC, a mutual fund service provider owned by PNC Bank).
- Legal.
- Data Services (various).
- Separate Account Management Service (reviewing services by Ewebportfolio.com and TD Waterhouse Institutional).
VISTA INVESTORS has reserved the domain name vistainvestors.com for purposes associated with this business.
| Personnel Plan | |||
| Year 1 | Year 2 | Year 3 | |
| Michael Douglas | $51,445 | $56,590 | $62,248 |
| Mark Haynes | $51,445 | $56,590 | $62,248 |
| CFA | $51,445 | $56,590 | $62,248 |
| Operations Director | $39,134 | $43,047 | $47,352 |
| Marketing Analyst | $29,351 | $32,286 | $35,515 |
| Portfolio Manager Assistant/Analyst | $22,826 | $25,109 | $27,619 |
| Administrative Assistant | $19,571 | $21,528 | $23,681 |
| Total People | 6 | 6 | 6 |
| Total Payroll | $265,217 | $291,739 | $320,913 |
Strategy and Implementation Summary
The key to marketing an investment product is to develop a successful product, develop a pattern of success, and show that pattern can be repeated in the future. After which time, successful products should be aggressively marketed if capacity to manage additional assets exists. While a three to five-year period may seem like millennia compared to the technology world, it is really quite reasonable considering the fact that private equity investors in limited partnership vehicles are generally satisfied with a 10-year waiting period that exists prior to a return of their capital investment. Based on the developmental timeline associated with investment products, this plan provides a financial outline of VISTA INVESTORS’ funding requirements for the first few years of operations.
6.1 Sales Strategy
Our firm’s hallmark investment product will be the Vista Total Market Equity strategy and will be initially offered through an SEC registered mutual fund. Technological advancements also permit for other economically feasible distribution channels such as separately managed portfolios for large account sizes.
The chart and table below provide a more detailed look at our projected sales strategy.

| Sales Forecast | |||
| Year 1 | Year 2 | Year 3 | |
| Sales | |||
| Investment management fee | $18,000 | $104,000 | $560,000 |
| Other | $0 | $0 | $0 |
| Total Sales | $18,000 | $104,000 | $560,000 |
| Direct Cost of Sales | Year 1 | Year 2 | Year 3 |
| Investment management fee | $0 | $0 | $0 |
| Other | $0 | $0 | $0 |
| Subtotal Direct Cost of Sales | $0 | $0 | $0 |
6.2 Database
A proprietary database has been developed to monitor these and other factors, including our reason for purchase or sell. Purchase candidates are characterized by one of the following:
- Value – cheap, based on common valuation measures (relative value, franchise value, discounted cashflow value) and catalyst or change will cause price to appreciate
- Relative Value – “middle ground”
- Growth – growing faster than the market average but price does not represent realizable growth opportunities (e.g. P/E to growth rate ratio)
6.3 Turnover
We expect to turn over approximately 1/3 of the portfolio each year. This is consistent with an average holding period of three years. In general, we would like for all holdings to be long-term investments. Thus we attempt to identify stocks with which we would be comfortable with if we were “locked in” for three years. This forces us to look beyond short-term noise in quarter-to-quarter results and focus on the big picture, such as management’s vision for the future and their probability of executing their plan. However, we do realize that quick price changes, especially in volatile markets, may cause us to realize gains (or losses) sooner than anticipated.
Financial Plan
The primary goal of the first full quarter of operation (July – September 2001) will be to secure funding from outside sources. Prior to this point, VISTA INVESTORS has a budget of $25,000 to be used for finding investors, forming a legal partnership, and registering the firm and its products with the SEC. The amount sought from investors will be approximately $1 million, which should see the business through to profitability near the completion of the third year. This break-even point equates roughly to an asset under management level of approximately $100 million. One can easily see that even modest points beyond this break-even level can be highly lucrative. Economies of scale are great meaning the same investment team can take on a virtually unlimited amount of assets. More importantly, net profit margins become very attractive.
There are a few items worthy of note as it pertains to our forecasts. Most likely, excess cash will be re-deployed into the business once a level of sustainability in revenue has been achieved. The primary purpose of this type of reinvestment would focus on a “second stage” marketing plan to increase distribution. A word of note is also warranted as it pertains to the cash flow statement. One appealing feature of the investment industry is that collection of fees (i.e. revenues) is highly certain because fees are frequently charged directly to the client’s accounts (or to the mutual fund). For this reason, revenue certainty is very high and is directly related to the amount of assets under management. Common practice in the investment management industry is to bill at each quarter-end. For example, our annual fee of 0.80% would be applied to our clients’ accounts four times per year at 0.20%.
Simply put, the economic motivation is great. Growth rates for the investment management industry are projected to range from 20% to 25% in each of the next three years. The demographic, economic, political and social evidence supporting these projections make this one of the most attractive industries due to the high degree of certainty in the estimates. We believe the certainty coupled with the above average growth rate distinguishes this opportunity from other venture investments. Additionally, our conservative estimates outline a plan-to-profitability over a period much shorter than typical venture investments that sometimes require up to ten years to harvest profits.
7.1 Exit Strategy
All employee/owners of the firm will be required to sell back their ownership stakes upon retirement/departure. Thus ownership incentives remain aligned with those actively participating in the firm’s activities. This requirement does not apply to venture/angel investors contributing to the up-front financing of our initial operating budget. Exit strategies will be negotiated with venture/angel investors on a case-by-case basis. This will include the term of the investment partnership.
7.2 Financial Risks and Contingencies
The following highlights some, but certainly not all, of the risks associated with this business plan:
Market Risk – A high correlation exists between the growth rate of the investment management industry and the performance of equity markets. While evidence suggests a conducive environment for equities in the future, no forecasts can be made with absolute certainty.
Performance Risk – At the end of the day, our products are measured by their performance. While the goal is to achieve competitive performance over three to five-year time periods, short-term periods may result in underperformance based on the critical measures outlined in this plan. For this reason, it is common for newly-created ventures in the investment management business to seek funding for an operating budget covering three or more years. This is consistent with the VISTA INVESTORS financing plan.
Business/Operating Risk – Beyond the third full year of operations, assets under management must produce revenues that will be sufficient to support operations in their entirety. Otherwise our options will be to acquire additional funding or to reduce costs. Because investors are our highest priority, we will not take action that will jeopardize our investment products. Thus, costs are unlikely to be reduced below the already modest forecasts of our financial statements. As a contingency, we would first consider outside funding, the sale of our firm, the sale of one of our products, or other feasible alternatives that would sustain the production of the highest quality investment products.
7.3 Important Assumptions
The following table provides some assumptions that are key to the success of VISTA INVESTORS.
| General Assumptions | |||
| Year 1 | Year 2 | Year 3 | |
| Plan Month | 1 | 2 | 3 |
| Current Interest Rate | 10.00% | 10.00% | 10.00% |
| Long-term Interest Rate | 10.00% | 10.00% | 10.00% |
| Tax Rate | 25.42% | 25.00% | 25.42% |
| Other | 0 | 0 | 0 |
7.4 Break-even Analysis
The chart and table below give the break-even assumptions for the company.

| Break-even Analysis | |
| Monthly Revenue Break-even | $29,056 |
| Assumptions: | |
| Average Percent Variable Cost | 0% |
| Estimated Monthly Fixed Cost | $29,056 |
7.5 Projected Profit and Loss
VISTA INVESTORS’ profit and loss information can be found in the table below.


| Pro Forma Profit and Loss | |||
| Year 1 | Year 2 | Year 3 | |
| Sales | $18,000 | $104,000 | $560,000 |
| Direct Cost of Sales | $0 | $0 | $0 |
| Other | $0 | $0 | $0 |
| Total Cost of Sales | $0 | $0 | $0 |
| Gross Margin | $18,000 | $104,000 | $560,000 |
| Gross Margin % | 100.00% | 100.00% | 100.00% |
| Expenses | |||
| Payroll | $265,217 | $291,739 | $320,913 |
| Sales and Marketing and Other Expenses | $26,500 | $45,800 | $87,780 |
| Depreciation | $600 | $1,733 | $1,700 |
| Utilities | $1,575 | $1,545 | $14,600 |
| Insurance | $1,500 | $14,175 | $0 |
| Rent | $13,500 | $0 | $0 |
| Insurance | $0 | $0 | $0 |
| Payroll Taxes | $39,783 | $43,761 | $48,137 |
| Other | $0 | $0 | $0 |
| Total Operating Expenses | $348,675 | $398,752 | $473,129 |
| Profit Before Interest and Taxes | ($330,675) | ($294,752) | $86,871 |
| EBITDA | ($330,075) | ($293,020) | $88,570 |
| Interest Expense | $0 | $0 | $0 |
| Taxes Incurred | $0 | $0 | $22,080 |
| Net Profit | ($330,675) | ($294,752) | $64,791 |
| Net Profit/Sales | -1837.08% | -283.42% | 11.57% |
7.6 Projected Cash Flow
The chart and table below highlight the cash flow statement for the company. It includes the anticipated investment required in the first year.

| Pro Forma Cash Flow | |||
| Year 1 | Year 2 | Year 3 | |
| Cash Received | |||
| Cash from Operations | |||
| Cash Sales | $18,000 | $104,000 | $560,000 |
| Subtotal Cash from Operations | $18,000 | $104,000 | $560,000 |
| Additional Cash Received | |||
| Sales Tax, VAT, HST/GST Received | $0 | $0 | $0 |
| New Current Borrowing | $0 | $0 | $0 |
| New Other Liabilities (interest-free) | $0 | $0 | $0 |
| New Long-term Liabilities | $0 | $0 | $0 |
| Sales of Other Current Assets | $0 | $0 | $0 |
| Sales of Long-term Assets | $0 | $0 | $0 |
| New Investment Received | $1,000,000 | $0 | $0 |
| Subtotal Cash Received | $1,018,000 | $104,000 | $560,000 |
| Expenditures | Year 1 | Year 2 | Year 3 |
| Expenditures from Operations | |||
| Cash Spending | $265,217 | $291,739 | $320,913 |
| Bill Payments | $74,424 | $105,061 | $167,064 |
| Subtotal Spent on Operations | $339,641 | $396,800 | $487,977 |
| Additional Cash Spent | |||
| Sales Tax, VAT, HST/GST Paid Out | $0 | $0 | $0 |
| Principal Repayment of Current Borrowing | $0 | $0 | $0 |
| Other Liabilities Principal Repayment | $0 | $0 | $0 |
| Long-term Liabilities Principal Repayment | $0 | $0 | $0 |
| Purchase Other Current Assets | $0 | $0 | $0 |
| Purchase Long-term Assets | $15,000 | $5,000 | $5,000 |
| Dividends | $0 | $0 | $0 |
| Subtotal Cash Spent | $354,641 | $401,800 | $492,977 |
| Net Cash Flow | $663,359 | ($297,800) | $67,023 |
| Cash Balance | $683,359 | $385,559 | $452,583 |
7.7 Projected Balance Sheet
The Balance Sheet shows a build-up of cash during year 2004 and beyond.
| Pro Forma Balance Sheet | |||
| Year 1 | Year 2 | Year 3 | |
| Assets | |||
| Current Assets | |||
| Cash | $683,359 | $385,559 | $452,583 |
| Other Current Assets | $0 | $0 | $0 |
| Total Current Assets | $683,359 | $385,559 | $452,583 |
| Long-term Assets | |||
| Long-term Assets | $15,000 | $20,000 | $25,000 |
| Accumulated Depreciation | $600 | $2,333 | $4,032 |
| Total Long-term Assets | $14,400 | $17,668 | $20,968 |
| Total Assets | $697,759 | $403,227 | $473,551 |
| Liabilities and Capital | Year 1 | Year 2 | Year 3 |
| Current Liabilities | |||
| Accounts Payable | $8,433 | $8,653 | $14,186 |
| Current Borrowing | $0 | $0 | $0 |
| Other Current Liabilities | $0 | $0 | $0 |
| Subtotal Current Liabilities | $8,433 | $8,653 | $14,186 |
| Long-term Liabilities | $0 | $0 | $0 |
| Total Liabilities | $8,433 | $8,653 | $14,186 |
| Paid-in Capital | $1,025,000 | $1,025,000 | $1,025,000 |
| Retained Earnings | ($5,000) | ($335,675) | ($630,427) |
| Earnings | ($330,675) | ($294,752) | $64,791 |
| Total Capital | $689,325 | $394,573 | $459,365 |
| Total Liabilities and Capital | $697,759 | $403,227 | $473,551 |
| Net Worth | $689,325 | $394,573 | $459,365 |
7.8 Business Ratios
The following table outlines some of the more important ratios from the Business Services industry. The final column, Industry Profile, details specific ratios based on the industry as it is classified by the Standard Industry Classification (SIC) code, 7389, Business Services, NEC.
| Ratio Analysis | ||||
| Year 1 | Year 2 | Year 3 | Industry Profile | |
| Sales Growth | 0.00% | 477.78% | 438.46% | 8.20% |
| Percent of Total Assets | ||||
| Other Current Assets | 0.00% | 0.00% | 0.00% | 44.20% |
| Total Current Assets | 97.94% | 95.62% | 95.57% | 74.30% |
| Long-term Assets | 2.06% | 4.38% | 4.43% | 25.70% |
| Total Assets | 100.00% | 100.00% | 100.00% | 100.00% |
| Current Liabilities | 1.21% | 2.15% | 3.00% | 49.00% |
| Long-term Liabilities | 0.00% | 0.00% | 0.00% | 13.80% |
| Total Liabilities | 1.21% | 2.15% | 3.00% | 62.80% |
| Net Worth | 98.79% | 97.85% | 97.00% | 37.20% |
| Percent of Sales | ||||
| Sales | 100.00% | 100.00% | 100.00% | 100.00% |
| Gross Margin | 100.00% | 100.00% | 100.00% | 0.00% |
| Selling, General & Administrative Expenses | 1937.08% | 383.42% | 88.37% | 81.40% |
| Advertising Expenses | 16.67% | 19.23% | 10.71% | 1.70% |
| Profit Before Interest and Taxes | -1837.08% | -283.42% | 15.51% | 2.10% |
| Main Ratios | ||||
| Current | 81.03 | 44.56 | 31.90 | 1.49 |
| Quick | 81.03 | 44.56 | 31.90 | 1.17 |
| Total Debt to Total Assets | 1.21% | 2.15% | 3.00% | 62.80% |
| Pre-tax Return on Net Worth | -47.97% | -74.70% | 18.91% | 4.20% |
| Pre-tax Return on Assets | -47.39% | -73.10% | 18.34% | 11.30% |
| Additional Ratios | Year 1 | Year 2 | Year 3 | |
| Net Profit Margin | -1837.08% | -283.42% | 11.57% | n.a |
| Return on Equity | -47.97% | -74.70% | 14.10% | n.a |
| Activity Ratios | ||||
| Accounts Payable Turnover | 9.83 | 12.17 | 12.17 | n.a |
| Payment Days | 27 | 30 | 24 | n.a |
| Total Asset Turnover | 0.03 | 0.26 | 1.18 | n.a |
| Debt Ratios | ||||
| Debt to Net Worth | 0.01 | 0.02 | 0.03 | n.a |
| Current Liab. to Liab. | 1.00 | 1.00 | 1.00 | n.a |
| Liquidity Ratios | ||||
| Net Working Capital | $674,925 | $376,906 | $438,397 | n.a |
| Interest Coverage | 0.00 | 0.00 | 0.00 | n.a |
| Additional Ratios | ||||
| Assets to Sales | 38.76 | 3.88 | 0.85 | n.a |
| Current Debt/Total Assets | 1% | 2% | 3% | n.a |
| Acid Test | 81.03 | 44.56 | 31.90 | n.a |
| Sales/Net Worth | 0.03 | 0.26 | 1.22 | n.a |
| Dividend Payout | 0.00 | 0.00 | 0.00 | n.a |
Appendix
| Personnel Plan | |||||||||||||
| Month 1 | Month 2 | Month 3 | Month 4 | Month 5 | Month 6 | Month 7 | Month 8 | Month 9 | Month 10 | Month 11 | Month 12 | ||
| Michael Douglas | 0% | $1,932 | $1,932 | $1,932 | $5,072 | $5,072 | $5,072 | $5,072 | $5,072 | $5,072 | $5,072 | $5,072 | $5,073 |
| Mark Haynes | 0% | $1,932 | $1,932 | $1,932 | $5,072 | $5,072 | $5,072 | $5,072 | $5,072 | $5,072 | $5,072 | $5,072 | $5,073 |
| CFA | 0% | $1,932 | $1,932 | $1,932 | $5,072 | $5,072 | $5,072 | $5,072 | $5,072 | $5,072 | $5,072 | $5,072 | $5,073 |
| Operations Director | 0% | $0 | $0 | $0 | $4,348 | $4,348 | $4,348 | $4,348 | $4,348 | $4,348 | $4,348 | $4,348 | $4,350 |
| Marketing Analyst | 0% | $0 | $0 | $0 | $3,261 | $3,261 | $3,261 | $3,261 | $3,261 | $3,261 | $3,261 | $3,261 | $3,263 |
| Portfolio Manager Assistant/Analyst | 0% | $0 | $0 | $0 | $2,536 | $2,536 | $2,536 | $2,536 | $2,536 | $2,536 | $2,536 | $2,536 | $2,538 |
| Administrative Assistant | 0% | $0 | $0 | $0 | $2,174 | $2,174 | $2,174 | $2,174 | $2,174 | $2,174 | $2,174 | $2,174 | $2,179 |
| Total People | 3 | 3 | 3 | 6 | 6 | 6 | 6 | 6 | 6 | 6 | 6 | 6 | |
| Total Payroll | $5,796 | $5,796 | $5,796 | $27,535 | $27,535 | $27,535 | $27,535 | $27,535 | $27,535 | $27,535 | $27,535 | $27,549 | |
| Sales Forecast | |||||||||||||
| Month 1 | Month 2 | Month 3 | Month 4 | Month 5 | Month 6 | Month 7 | Month 8 | Month 9 | Month 10 | Month 11 | Month 12 | ||
| Sales | |||||||||||||
| Investment management fee | 0% | $0 | $0 | $0 | $0 | $0 | $2,000 | $0 | $0 | $6,000 | $0 | $0 | $10,000 |
| Other | 0% | $0 | $0 | $0 | $0 | $0 | $0 | $0 | $0 | $0 | $0 | $0 | $0 |
| Total Sales | $0 | $0 | $0 | $0 | $0 | $2,000 | $0 | $0 | $6,000 | $0 | $0 | $10,000 | |
| Direct Cost of Sales | Month 1 | Month 2 | Month 3 | Month 4 | Month 5 | Month 6 | Month 7 | Month 8 | Month 9 | Month 10 | Month 11 | Month 12 | |
| Investment management fee | $0 | $0 | $0 | $0 | $0 | $0 | $0 | $0 | $0 | $0 | $0 | $0 | |
| Other | $0 | $0 | $0 | $0 | $0 | $0 | $0 | $0 | $0 | $0 | $0 | $0 | |
| Subtotal Direct Cost of Sales | $0 | $0 | $0 | $0 | $0 | $0 | $0 | $0 | $0 | $0 | $0 | $0 | |
| General Assumptions | |||||||||||||
| Month 1 | Month 2 | Month 3 | Month 4 | Month 5 | Month 6 | Month 7 | Month 8 | Month 9 | Month 10 | Month 11 | Month 12 | ||
| Plan Month | 1 | 2 | 3 | 4 | 5 | 6 | 7 | 8 | 9 | 10 | 11 | 12 | |
| Current Interest Rate | 10.00% | 10.00% | 10.00% | 10.00% | 10.00% | 10.00% | 10.00% | 10.00% | 10.00% | 10.00% | 10.00% | 10.00% | |
| Long-term Interest Rate | 10.00% | 10.00% | 10.00% | 10.00% | 10.00% | 10.00% | 10.00% | 10.00% | 10.00% | 10.00% | 10.00% | 10.00% | |
| Tax Rate | 30.00% | 25.00% | 25.00% | 25.00% | 25.00% | 25.00% | 25.00% | 25.00% | 25.00% | 25.00% | 25.00% | 25.00% | |
| Other | 0 | 0 | 0 | 0 | 0 | 0 | 0 | 0 | 0 | 0 | 0 | 0 | |
| Pro Forma Profit and Loss | |||||||||||||
| Month 1 | Month 2 | Month 3 | Month 4 | Month 5 | Month 6 | Month 7 | Month 8 | Month 9 | Month 10 | Month 11 | Month 12 | ||
| Sales | $0 | $0 | $0 | $0 | $0 | $2,000 | $0 | $0 | $6,000 | $0 | $0 | $10,000 | |
| Direct Cost of Sales | $0 | $0 | $0 | $0 | $0 | $0 | $0 | $0 | $0 | $0 | $0 | $0 | |
| Other | $0 | $0 | $0 | $0 | $0 | $0 | $0 | $0 | $0 | $0 | $0 | $0 | |
| Total Cost of Sales | $0 | $0 | $0 | $0 | $0 | $0 | $0 | $0 | $0 | $0 | $0 | $0 | |
| Gross Margin | $0 | $0 | $0 | $0 | $0 | $2,000 | $0 | $0 | $6,000 | $0 | $0 | $10,000 | |
| Gross Margin % | 0.00% | 0.00% | 0.00% | 0.00% | 0.00% | 100.00% | 0.00% | 0.00% | 100.00% | 0.00% | 0.00% | 100.00% | |
| Expenses | |||||||||||||
| Payroll | $5,796 | $5,796 | $5,796 | $27,535 | $27,535 | $27,535 | $27,535 | $27,535 | $27,535 | $27,535 | $27,535 | $27,549 | |
| Sales and Marketing and Other Expenses | $583 | $583 | $583 | $2,750 | $2,750 | $2,750 | $2,750 | $2,750 | $2,750 | $2,750 | $2,750 | $2,750 | |
| Depreciation | $0 | $0 | $0 | $67 | $67 | $67 | $67 | $67 | $67 | $67 | $67 | $67 | |
| Utilities | $0 | $0 | $0 | $175 | $175 | $175 | $175 | $175 | $175 | $175 | $175 | $175 | |
| Insurance | $0 | $0 | $0 | $167 | $167 | $167 | $167 | $167 | $167 | $167 | $167 | $167 | |
| Rent | $0 | $0 | $0 | $1,500 | $1,500 | $1,500 | $1,500 | $1,500 | $1,500 | $1,500 | $1,500 | $1,500 | |
| Insurance | $0 | $0 | $0 | $0 | $0 | $0 | $0 | $0 | $0 | $0 | $0 | $0 | |
| Payroll Taxes | 15% | $869 | $869 | $869 | $4,130 | $4,130 | $4,130 | $4,130 | $4,130 | $4,130 | $4,130 | $4,130 | $4,132 |
| Other | $0 | $0 | $0 | $0 | $0 | $0 | $0 | $0 | $0 | $0 | $0 | $0 | |
| Total Operating Expenses | $7,249 | $7,249 | $7,249 | $36,324 | $36,324 | $36,324 | $36,324 | $36,324 | $36,324 | $36,324 | $36,324 | $36,340 | |
| Profit Before Interest and Taxes | ($7,249) | ($7,249) | ($7,249) | ($36,324) | ($36,324) | ($34,324) | ($36,324) | ($36,324) | ($30,324) | ($36,324) | ($36,324) | ($26,340) | |
| EBITDA | ($7,249) | ($7,249) | ($7,249) | ($36,257) | ($36,257) | ($34,257) | ($36,257) | ($36,257) | ($30,257) | ($36,257) | ($36,257) | ($26,273) | |
| Interest Expense | $0 | $0 | $0 | $0 | $0 | $0 | $0 | $0 | $0 | $0 | $0 | $0 | |
| Taxes Incurred | $0 | $0 | $0 | $0 | $0 | $0 | $0 | $0 | $0 | $0 | $0 | $0 | |
| Net Profit | ($7,249) | ($7,249) | ($7,249) | ($36,324) | ($36,324) | ($34,324) | ($36,324) | ($36,324) | ($30,324) | ($36,324) | ($36,324) | ($26,340) | |
| Net Profit/Sales | 0.00% | 0.00% | 0.00% | 0.00% | 0.00% | -1716.18% | 0.00% | 0.00% | -505.39% | 0.00% | 0.00% | -263.40% | |
| Pro Forma Cash Flow | |||||||||||||
| Month 1 | Month 2 | Month 3 | Month 4 | Month 5 | Month 6 | Month 7 | Month 8 | Month 9 | Month 10 | Month 11 | Month 12 | ||
| Cash Received | |||||||||||||
| Cash from Operations | |||||||||||||
| Cash Sales | $0 | $0 | $0 | $0 | $0 | $2,000 | $0 | $0 | $6,000 | $0 | $0 | $10,000 | |
| Subtotal Cash from Operations | $0 | $0 | $0 | $0 | $0 | $2,000 | $0 | $0 | $6,000 | $0 | $0 | $10,000 | |
| Additional Cash Received | |||||||||||||
| Sales Tax, VAT, HST/GST Received | 0.00% | $0 | $0 | $0 | $0 | $0 | $0 | $0 | $0 | $0 | $0 | $0 | $0 |
| New Current Borrowing | $0 | $0 | $0 | $0 | $0 | $0 | $0 | $0 | $0 | $0 | $0 | $0 | |
| New Other Liabilities (interest-free) | $0 | $0 | $0 | $0 | $0 | $0 | $0 | $0 | $0 | $0 | $0 | $0 | |
| New Long-term Liabilities | $0 | $0 | $0 | $0 | $0 | $0 | $0 | $0 | $0 | $0 | $0 | $0 | |
| Sales of Other Current Assets | $0 | $0 | $0 | $0 | $0 | $0 | $0 | $0 | $0 | $0 | $0 | $0 | |
| Sales of Long-term Assets | $0 | $0 | $0 | $0 | $0 | $0 | $0 | $0 | $0 | $0 | $0 | $0 | |
| New Investment Received | $0 | $0 | $1,000,000 | $0 | $0 | $0 | $0 | $0 | $0 | $0 | $0 | $0 | |
| Subtotal Cash Received | $0 | $0 | $1,000,000 | $0 | $0 | $2,000 | $0 | $0 | $6,000 | $0 | $0 | $10,000 | |
| Expenditures | Month 1 | Month 2 | Month 3 | Month 4 | Month 5 | Month 6 | Month 7 | Month 8 | Month 9 | Month 10 | Month 11 | Month 12 | |
| Expenditures from Operations | |||||||||||||
| Cash Spending | $5,796 | $5,796 | $5,796 | $27,535 | $27,535 | $27,535 | $27,535 | $27,535 | $27,535 | $27,535 | $27,535 | $27,549 | |
| Bill Payments | $48 | $1,453 | $1,453 | $1,695 | $8,722 | $8,722 | $8,722 | $8,722 | $8,722 | $8,722 | $8,722 | $8,722 | |
| Subtotal Spent on Operations | $5,844 | $7,249 | $7,249 | $29,230 | $36,257 | $36,257 | $36,257 | $36,257 | $36,257 | $36,257 | $36,257 | $36,271 | |
| Additional Cash Spent | |||||||||||||
| Sales Tax, VAT, HST/GST Paid Out | $0 | $0 | $0 | $0 | $0 | $0 | $0 | $0 | $0 | $0 | $0 | $0 | |
| Principal Repayment of Current Borrowing | $0 | $0 | $0 | $0 | $0 | $0 | $0 | $0 | $0 | $0 | $0 | $0 | |
| Other Liabilities Principal Repayment | $0 | $0 | $0 | $0 | $0 | $0 | $0 | $0 | $0 | $0 | $0 | $0 | |
| Long-term Liabilities Principal Repayment | $0 | $0 | $0 | $0 | $0 | $0 | $0 | $0 | $0 | $0 | $0 | $0 | |
| Purchase Other Current Assets | $0 | $0 | $0 | $0 | $0 | $0 | $0 | $0 | $0 | $0 | $0 | $0 | |
| Purchase Long-term Assets | $0 | $0 | $0 | $5,000 | $5,000 | $5,000 | $0 | $0 | $0 | $0 | $0 | $0 | |
| Dividends | $0 | $0 | $0 | $0 | $0 | $0 | $0 | $0 | $0 | $0 | $0 | $0 | |
| Subtotal Cash Spent | $5,844 | $7,249 | $7,249 | $34,230 | $41,257 | $41,257 | $36,257 | $36,257 | $36,257 | $36,257 | $36,257 | $36,271 | |
| Net Cash Flow | ($5,844) | ($7,249) | $992,751 | ($34,230) | ($41,257) | ($39,257) | ($36,257) | ($36,257) | ($30,257) | ($36,257) | ($36,257) | ($26,271) | |
| Cash Balance | $14,156 | $6,907 | $999,658 | $965,428 | $924,171 | $884,914 | $848,657 | $812,400 | $782,143 | $745,887 | $709,630 | $683,359 | |
| Pro Forma Balance Sheet | |||||||||||||
| Month 1 | Month 2 | Month 3 | Month 4 | Month 5 | Month 6 | Month 7 | Month 8 | Month 9 | Month 10 | Month 11 | Month 12 | ||
| Assets | Starting Balances | ||||||||||||
| Current Assets | |||||||||||||
| Cash | $20,000 | $14,156 | $6,907 | $999,658 | $965,428 | $924,171 | $884,914 | $848,657 | $812,400 | $782,143 | $745,887 | $709,630 | $683,359 |
| Other Current Assets | $0 | $0 | $0 | $0 | $0 | $0 | $0 | $0 | $0 | $0 | $0 | $0 | $0 |
| Total Current Assets | $20,000 | $14,156 | $6,907 | $999,658 | $965,428 | $924,171 | $884,914 | $848,657 | $812,400 | $782,143 | $745,887 | $709,630 | $683,359 |
| Long-term Assets | |||||||||||||
| Long-term Assets | $0 | $0 | $0 | $0 | $5,000 | $10,000 | $15,000 | $15,000 | $15,000 | $15,000 | $15,000 | $15,000 | $15,000 |
| Accumulated Depreciation | $0 | $0 | $0 | $0 | $67 | $133 | $200 | $267 | $333 | $400 | $467 | $533 | $600 |
| Total Long-term Assets | $0 | $0 | $0 | $0 | $4,933 | $9,867 | $14,800 | $14,733 | $14,667 | $14,600 | $14,533 | $14,467 | $14,400 |
| Total Assets | $20,000 | $14,156 | $6,907 | $999,658 | $970,361 | $934,038 | $899,714 | $863,391 | $827,067 | $796,743 | $760,420 | $724,096 | $697,759 |
| Liabilities and Capital | Month 1 | Month 2 | Month 3 | Month 4 | Month 5 | Month 6 | Month 7 | Month 8 | Month 9 | Month 10 | Month 11 | Month 12 | |
| Current Liabilities | |||||||||||||
| Accounts Payable | $0 | $1,404 | $1,404 | $1,404 | $8,431 | $8,431 | $8,431 | $8,431 | $8,431 | $8,431 | $8,431 | $8,431 | $8,433 |
| Current Borrowing | $0 | $0 | $0 | $0 | $0 | $0 | $0 | $0 | $0 | $0 | $0 | $0 | $0 |
| Other Current Liabilities | $0 | $0 | $0 | $0 | $0 | $0 | $0 | $0 | $0 | $0 | $0 | $0 | $0 |
| Subtotal Current Liabilities | $0 | $1,404 | $1,404 | $1,404 | $8,431 | $8,431 | $8,431 | $8,431 | $8,431 | $8,431 | $8,431 | $8,431 | $8,433 |
| Long-term Liabilities | $0 | $0 | $0 | $0 | $0 | $0 | $0 | $0 | $0 | $0 | $0 | $0 | $0 |
| Total Liabilities | $0 | $1,404 | $1,404 | $1,404 | $8,431 | $8,431 | $8,431 | $8,431 | $8,431 | $8,431 | $8,431 | $8,431 | $8,433 |
| Paid-in Capital | $25,000 | $25,000 | $25,000 | $1,025,000 | $1,025,000 | $1,025,000 | $1,025,000 | $1,025,000 | $1,025,000 | $1,025,000 | $1,025,000 | $1,025,000 | $1,025,000 |
| Retained Earnings | ($5,000) | ($5,000) | ($5,000) | ($5,000) | ($5,000) | ($5,000) | ($5,000) | ($5,000) | ($5,000) | ($5,000) | ($5,000) | ($5,000) | ($5,000) |
| Earnings | $0 | ($7,249) | ($14,497) | ($21,746) | ($58,070) | ($94,393) | ($128,717) | ($165,041) | ($201,364) | ($231,688) | ($268,011) | ($304,335) | ($330,675) |
| Total Capital | $20,000 | $12,751 | $5,503 | $998,254 | $961,930 | $925,607 | $891,283 | $854,959 | $818,636 | $788,312 | $751,989 | $715,665 | $689,325 |
| Total Liabilities and Capital | $20,000 | $14,156 | $6,907 | $999,658 | $970,361 | $934,038 | $899,714 | $863,391 | $827,067 | $796,743 | $760,420 | $724,096 | $697,759 |
| Net Worth | $20,000 | $12,751 | $5,503 | $998,254 | $961,930 | $925,607 | $891,283 | $854,959 | $818,636 | $788,312 | $751,989 | $715,665 | $689,325 |


