
Staryoo.com
Executive Summary
Staryoo.com is a revolutionary concept that will provide a Web-based trading platform for Chinese equities and securities investors and institutions. Staryoo.com will change the way millions of people invest in China. Particular to Staryoo.com will be investment features that have recently not been available to the investor in China, including, real-time stock price quotes, technical and fundamental analysis, expert commentary on market action and recommendations, investment forums and chat rooms, online bank transfers, remote pager notification, and educational material including books and tapes. The platforms’ intelligent graphic interface will be fully configurable, thereby allowing users to optimize the interface to meet their level of experience and investing profile.
With both the development of the Chinese national super highway project and China’s imminent membership into the World Trade Organization (WTO), Internet use and Internet investing will grow very rapidly. According to a recent report by the China Internet Information Center, there were 4.5 million Internet users in China as of June, 1999. This number is double the 1998 estimate and is expected to increase to 20 million by the end of 2000. Among the 45 million investors in China, 40 million are individual investors. It is anticipated that as foreign equities markets (in particular the U.S. markets) are made available to the individual investor, their trading volume will increase enormously. According to Mr. Pen Reng, Vice President for Shanghai Securities Co., LTD., the second largest brokerage in China, it is estimated that the number of individual investors in China will increase to 250 million by 2005. Staryoo.com has anticipated this trend and will be the first to support international trading.
The U.S. market for equity securities has grown dramatically in recent years. The large increase in the average daily trading volume on NASDAQ has resulted from the combination of historic market highs and the growing number of issuers listed on NASDAQ. At the same time, technology has advanced to the point where more investors are trading online. This has created a new class of self-reliant and value-oriented investors who are comfortable with electronic commerce. We believe that these same trends will develop in China and that we will be well positioned to take advantage of the significant market opportunity that will exist for faster, easier, more reliable, and less expensive trading systems.
Staryoo.com is based in Shanghai, China with a Sunnyvale, CA office. Initial seed capital and technical support has been provided by Starmile Systems Engineering, Co. LTD. (Starmile) located in Shuzhou, China. The goal of setting up Staryoo.com as a U.S.-based company is two-fold: the first is to facilitate the transition from a Chinese equities market to one allowing for the access of the U.S equities markets and, second, to quickly and efficiently allow Staryoo.com to go public in the U.S. To develop and market this trading platform, Staryoo.com will require heavy first and second round funding. Additional rounds of financing may be required by fourth quarter (Q4), Year 3 to achieve the objectives listed below.
1.1 Objectives
- Alpha and Beta testing of Web-based platform, January 15, Year 1 and May 15, Year 1, respectively, with strategic partners in China.
- Complete negotiations with two large brokerage firms for initial deployment of trading platform by June 1, Year 1.
- Secure first round funding by June, Year 1.
- Staryoo.com available for individual investors beginning June 1, Year 1 (without online trading).
- Staryoo.com available for online trading beginning September 15, Year 1.
- U.S. equities markets available in China via Staryoo.com in Q2 Year 2*.
- Achieve revenues of $300,000 by year end, Year 1.
- Sign up 18,000 members and 14 brokerages by Q4 Year 1.
- Deploy Staryoo.com as a trading platform in the U.S. by Q3 Year 3.
- Staryoo.com U.S. public company by Q4 Year 3.
* – anticipated WTO membership in Q4 Year 1.
1.2 Mission
It is Staryoo.com’s mission to provide investors with the most comprehensive Web-based trading platform available. We will devote ourselves to the constant evolution of this trading platform by listening to our users and enhancing our product mix to satisfy their requirements. Staryoo.com is committed to providing an exceptional customer experience that will ensure investor trust and confidence. First class image, first class quality, and first class service will be our goals while making a fair profit for employees and investors. Recognizing that our employees are our most valued resource, Staryoo.com will nurture and reward its’ employees as milestones are achieved, technologies are developed, and the company flourishes.
1.3 Keys to Success
To succeed in this business we must:
- Differentiating Staryoo.com’s Web-based trading platform from all others with increased functionality and features required by investors for advanced Internet trading.
- Provide 100% customer satisfaction with Staryoo.com order transmission and customer service to ensure repeat and consistent usage.
- Provide 100% brokerage satisfaction with Staryoo.com online trading implementation and cost effectiveness.
- Leverage Starmile’s technical expertise and client base to ensure that a wide range of customers are informed about Staryoo.com’s equities trading platform and the advantages of using this platform.
1.4 Strategic Advantage
Staryoo.com will have a competitive advantage over competing Web-based trading platform providers due to the following strategic reasons:
- Starmile has extensive technological knowledge in the fields of bank information processing including transaction processing, account inquires, and settlements.
- Starmile has developed a payment cryptography system certified by the National Cryptography Administration Committee and ISO9002 compliant.
- Starmile has developed an online non-Web-based security trading system for China JiangQian Tide. This system includes most of the functionality being proposed for the Staryoo.com trading platform, including: transactions and trading of Shanghai A shares, statement of account transactions/balance, Windows NT based, online retrieval of market reviews and exchange information, downloading of historical data, input of stock symbol and lookup, network security/firewall implementation, and built-in analysis systems.
- An experienced and diverse management team and Board of Directors. With backgrounds in the technology, banking and securities industries.
- Being a U.S. company with a solid relationship with Starmile provides a lower barrier of resistance for achieving market penetration in China: American companies will find it difficult to obtain market share due to cultural preferences.
Company Summary
Staryoo.com is a new company that will provide a Web-based Internet trading platform for Chinese investors. The formation of Staryoo.com is in anticipation of the very rapid growth in Internet trading due to recent government Internet programs and China’s imminent membership into the WTO. Staryoo.com will provide investors with a group of features and a level of investing sophistication that has not been available with current trading platforms in China.
2.1 Company Ownership
Staryoo.com will be created as a Cayman Islands Corporation to take advantage of its tax-free status. Initially, Staryoo.com will be owned by Starmile System Engineering, Inc. and its principal officers. No officer will own greater than 10% of the company. Additional wholly-owned subsidiaries will be incorporated in Hong Kong, Shanghai, and Delaware.
2.2 Start-up Summary
Starmile System Engineering Inc. provided initial seed capital. This capital has been used for operating expenses and software development expenses required since company inception. The use of proceeds are detailed in the following chart and table:

| Start-up | |
| Requirements | |
| Start-up Expenses | |
| Legal | $20,000 |
| Stationery etc. | $2,000 |
| Brochures | $5,000 |
| Consultants | $5,000 |
| Insurance | $2,000 |
| Rent | $25,000 |
| Research and development | $200,000 |
| Expensed equipment | $1,000 |
| Marketing & Advertising | $25,000 |
| Total Start-up Expenses | $285,000 |
| Start-up Assets | |
| Cash Required | $100,000 |
| Other Current Assets | $0 |
| Long-term Assets | $50,000 |
| Total Assets | $150,000 |
| Total Requirements | $435,000 |

| Start-up Funding | |
| Start-up Expenses to Fund | $285,000 |
| Start-up Assets to Fund | $150,000 |
| Total Funding Required | $435,000 |
| Assets | |
| Non-cash Assets from Start-up | $50,000 |
| Cash Requirements from Start-up | $100,000 |
| Additional Cash Raised | $0 |
| Cash Balance on Starting Date | $100,000 |
| Total Assets | $150,000 |
| Liabilities and Capital | |
| Liabilities | |
| Current Borrowing | $0 |
| Long-term Liabilities | $0 |
| Accounts Payable (Outstanding Bills) | $0 |
| Other Current Liabilities (interest-free) | $0 |
| Total Liabilities | $0 |
| Capital | |
| Planned Investment | |
| Investor 1 | $370,000 |
| Investor 2 | $65,000 |
| Other | $0 |
| Additional Investment Requirement | $0 |
| Total Planned Investment | $435,000 |
| Loss at Start-up (Start-up Expenses) | ($285,000) |
| Total Capital | $150,000 |
| Total Capital and Liabilities | $150,000 |
| Total Funding | $435,000 |
2.3 Company Locations and Facilities
Staryoo.com currently leases 5,000 sq. ft. of office space from Jiaotong University in Shanghai, China. Annual costs of our space is $30,000, or $2,500 per month, not including utilities. We estimate that this facility will accommodate up to 60 employees and will be satisfactory through Year 1. We believe that additional space will be easily secured at a rate satisfactory to Staryoo.com in the current facility maintained by Jiaotong University.
Our initial United States offices are located at 3750 Cheerful Dr., Suite 111, Sunnyvale, California in the heart of the U.S. high tech industry, where we share approximately 650 sq. ft. with Starmile. Annual costs of our space is $15,600, or $1,300 per month, plus escalations.
This plan anticipates the following growth in facility space required: in January 1, Year 2 increase facility space to 10,000 sq. ft in Shanghai, and in June 1, Year 2 increase facility space to 2,500 sq. ft. in the United States. We believe that the United States space will be easily secured at a rate estimated at approximately $3.00 per sq. ft. per month.
Services
Staryoo.com should be considered as a Business-to-Business-to-Consumer (B2B2C) Internet model due to our servicing both brokerages and their clients (our membership). We will be a technology facilitator by providing the conduit through which clients will communicate with their brokerages and vice versa. For members (brokerage clients), Staryoo.com will provide a user configurable three-dimensional Web interface for trading Chinese equities and securities. This platform will facilitate equities trading by providing a seamless interface between the individual investor and his or her brokerage firm. Brokerage firms will realize the cost effective advantages of Staryoo.com providing real-time market updates, news, technology, etc. to a much greater clientele than that particular brokerages’. Additionally, with Staryoo.com maintaining a Virtual Private Network (VPN) for each brokerage, it provides a completely encrypted communication between the brokerages and their clients, allowing for safe and secure order transactions and account updates.
3.1 Service Description
We will incorporate a number of features into the platform to improve the overall sophistication of traders:
- Internet Stock Trading: Staryoo.com will cooperate with the China Security Regulatory Commission and member brokerage firms to provide a comprehensive trading platform for individual brokerage branches, including online order execution, confirmation, and account access.
- Real-time Updates: Market information will be updated in real time, giving the latest prices for all global major indexes. Real-time stock quotes will be available in a scrolling, ticker format with user-defined alerts and customizable configurations.
- News Updates: Direct links will be provided for instant access to recent news developments from around the globe. Video-on-demand (VOD) technology will be employed to allow traders to get up-to-the-minute broadcasts of market analysis from brokerages.
- Bank Transfers: Staryoo.com will provide real-time money transfers between a user’s bank accounts and their brokerage firms.
- Fundamental and Technical Analysis: Members will have access to real-time stock market news and information. Advanced charting techniques will allow for a broad range of technical analysis capabilities.
- Market Recommendations: Economists and market analysts will provide their recommendations and economic outlook.
- Pager Transmission Services: Staryoo.com will provide trading alerts to individual investors utilizing the latest technology for both 1-way and 2-way pagers along with Personal Digital Assistants (PDA’s).
- Chat Rooms and Forums: Staryoo.com will provide a “community” for investor communications, facilitating the exchange of investment ideas and recommendations. This center will also provide online music and games for entertainment and relaxation.
- Staryoo Investors Club: A premium, value oriented membership that provides discounts on retail items, commissions, and free trading tips and recommendations.
- Staryoo University.Com: This educational center will provide new investors with the knowledge and tools required for Internet investing. Most new investors are frightened by investing their hard-earned money over a medium that they understand little about. Allowing investors to practice online trading in a pseudo-trading environment (i.e. no cash or “paper trading”), will build confidence in their trading strategies and improve their overall online experience. Graduates of Staryoo University.com will receive a Bachelor of Staryoo in Investment Technology (B.S.I.T.) degree and a certificate will be emailed to each graduate. Graduates will receive free membership into the Staryoo Investors Club that provides discounts on retail items, commissions and free trading tips and recommendations.
- E-Business/eStaryoo.com: Staryoo.com will utilize its huge membership base to sell goods and products (including books, tapes, investment classes, etc.) in a retail environment. Other investment vehicles such as stamps, coins, and antiques may be included.
- Planning: Staryoo.com will provide various types of individual investment planning ranging from cash flow management to retirement planning.
- Customer Service: Staryoo.com’s customer service staff will be available to handle all customer questions regarding site functionality and its proper usage.
3.2 Service Description – Brokerages
Brokerages will realize the following advantages and services:
- Secure Virtual Private Network (VPN) communications between brokerages and their clientele. Using the SOCKv5 protocol (the standard for Authenticated Firewall Traversal), will allow implementation at the brokerage site with little additional hardware overhead. SOCKv5 is the standard for secure extranet communications.
- Brokerage branded Web page. Staryoo.com will maintain a home page for each VPN brokerage, allowing its’ clientele trade.
- Dynamic brokerage market updates and commentaries. Brokerages will have the ability to update their VPN home pages with brokerage-specific market updates. This will allow them to target their clients with brokerage-specific updates.
- Lower Information Costs. Staryoo.com will provide all news, market updates, quotes, etc. to clients. This will provide significant cost savings to brokerages that would normally purchase these information packages.
- Pre-packaged CSRC Online Trading application. Staryoo.com will provide brokerages with an application for the CSRC. There are 16 items which must be provided to the CSRC for every brokerage that wants to implement online trading, much of which requires detailed analysis of system implementation and procedures. Staryoo.com will be able to minimize the time-to-market for brokerages wishing to implement online trading.
- Trading Frequency. Due to the “community” structure of the main Staryoo.com site, investors will exchange ideas and investment strategies and ultimately increase their trading frequency. Increased trading frequency translates into increased commissions for brokerages.
- Scalable client base. As Internet access expands in China, membership will increase and a greater portion of the population will find investing more convenient and neccessary. Brokerages will benefit from this trend as their client base and revenues from transactions increase.
- Collateral material. Staryoo.com will provide all collateral material (brochures, pamphlets, etc.) to brokerages for distribution to their clients. Staryoo.com recognizes the importance of educating members as to the functionality and usage of its financial platform.
- Quality News and Quotes. Members will receive real-time quotes from each exchange (Shanghai and Shenzhen), and financial news from Reuters.
- Web page design and maintenance. Initially, Staryoo.com will provide standard Web design and functionality to brokerage VPN home pages, but as Internet usage for online trading develops, brokerages will require additional functionality and customization of their VPN sites. Staryoo.com will provide these services to brokerages and allow them to focus on their core business.
- Advertisement brokering. To offset a portion of the expense associated with providing the technology infrastructure to the brokerages, we will provide the purchasing and re-selling of brokerage Web page space for advertising. Since a majority of brokerage Web page space is white (blank) and is generally used for just text, this provides an opportunity to sell space to advertisers who want to target a specific demographic. By selling this space on behalf of the brokerages, the income can partially offset the fees paid to Staryoo.com. Staryoo.com will charge a premium to the end-advertiser (i.e. brokerages may get a credit of $10 per cost per thousand (CPM) while we sell the space to advertisers for $15 per CPM).
- Wireless Transmission Protocol (WAP). Future services will allow brokerages to communicate market updates and news directly to their clients. This will drive members to Staryoo.com and ultimately to the brokerages.
3.3 Competitive Comparison
There are several Internet trading websites in China, but their functionality is less than that planned for Staryoo.com, and they offer little in the way of user functions such as technical/fundamental analysis, education, planning, pager alerts, forums, etc. There are several well-known content providers in China that have a large customer base and may present potential competition to Staryoo.com, but they do not have the investor base nor the expertise with brokerage firms, cryptography, and equities trading systems.
3.4 Fulfillment
The key to fulfilling the individual investor’s online requirements will be for Staryoo.com to keep an active dialog with our members. We must listen to their wants and needs and modify, add, and develop new resources as required. Staryoo.com’s plans are to solicit product reviews and suggestions from members by giving discounted commissions, products, and/or services. These “Product Service Reviews” will be used as feedback for future technology and marketing developments and will ensure that our members are satisfied with their entire online trading and investing experience. Promotional giveaways (computers, reduced commissions, etc.) will be provided to encourage membership interaction. It is only after the customers are satisfied that Staryoo.com will enjoy a consistent and expanding investor membership.
3.5 Technology
China’s Internet access is expected to increase over 400% between June of 1999 and the end of 2000. Coupled with China’s membership into the World Trade Organization, Staryoo.com anticipates that Internet-based trading will quickly become accessible to many traders. Given the relatively few competing Internet trading sites available and their limited functionality, the Staryoo.com platform should quickly become the industry standard.
Multimedia streaming, compression, and multicasts are the hot technologies for the Internet. Investors constantly want more quantitative and reliable information to make their investment choices. Traditional mediums like newspaper, radio, and television cannot keep up with the information flow and make the search for such news items difficult, cumbersome and time consuming. Staryoo.com will benefit from the progression of new Internet technologies by providing its members with increased information exchange.
Staryoo.com’s technical team has previously developed (1998) a dedicated remote online (non-Web-based) trading platform for China JiangQian Tide.
Staryoo.com has extensive experience in data encryption and network communication security systems used by the Industrial and Commercial Bank (ICBC) as well as by 600 China brokerage firms and their branch offices. Their payment cryptography system has obtained certification from the National Cryptography Administration Committee and meets ISO9002 quality requirements.
Staryoo.com has experience in the development of 3-dimensional animated interfaces for dedicated line trading products.
3.6 Future Services
Staryoo.com must remain on top of the new technologies developed for the Internet. In the future we plan on expanding upon the concept of a User Configurable Trading Platform (UCTP) by providing investors a method of customizing their Web platform to meet their individual needs. There are many types of investors from very active to one-stop shoppers. Each of these types of investors will require their site to do different functions (i.e. active traders will want sophisticated technical analysis, while one-stop shoppers will be more fundamentally driven). Additionally, chat rooms and forums should be trader-specific, so that trading confusion is kept to a minimum and trading priorities are maximized. It is the vision of Staryoo.com to develop the technology that will provide a customizable platform usable by all types of investors.
Wireless transmission via WAP of Staryoo.com emails, news, market updates, and stock quotes to both WAP and non-WAP enabled phones will be implemented within the first six months. It is recognized that the use of cellular phones is gaining in popularity in China as their costs are relatively cheap when compared to stand-alone computers. We have discussed deploying a wireless portal in China with TeleWAP.com located in Mountain View, CA. TeleWAP, Inc. has recently negotiated with SINA.com to deliver SINA’s Chinese Internet content to users in both the U.S.A. and Asia.
With the financial markets expanding, Staryoo.com will continue to offer additional trading vehicles. Some of the products we plan to offer are: options on stocks, mutual funds, bonds, commodities and indexes, options on commodities and indexes and annuities.
With the advent of WTO membership, it is expected that Chinese investors will expand their trading horizons to include day trading, a very popular form of “self-employment” currently enjoyed in the United States. Day trading in China was curtailed in 1994, and a one-day settlement period was implemented. With WTO membership, if investors cannot find day trading in China, they will look elsewhere–particularly at the U.S. markets.
Market Analysis Summary
Staryoo.com will be focusing on the individual investor as the target market for its trading platform. Of the 45 million investors in China, almost 90% are individuals. As the availability of computer technology and Internet access increases, it is anticipated that this segment of investors will grow by 20% per year. Additionally, research indicates that online trading accounts have increased over 500% from the end of 1996 to present, and are expected to grow by an additional 60% by the end of 2002. Retail commissions generated by online trading are expected to grow to $2.2 billion by 2001. The market for online services is new and rapidly evolving and will promote intense competition. Currently, the competition for online financial services in China is very limited and lacks the sophistication which, we feel, will be required as individual investors take increased control over their financial future. Staryoo.com is positioning itself as China’s premier investor website and will capitalize on the explosive growth anticipated in this industry.
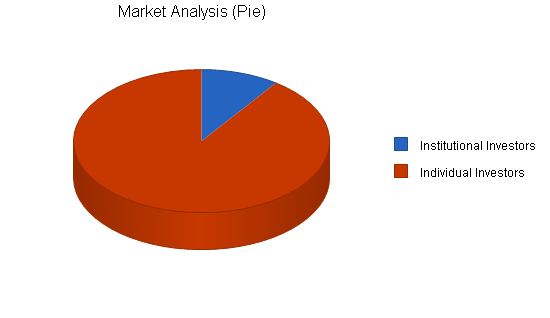
4.1 Market Segmentation
The segmentation allows some room for estimates, due to the rapid growth of the Internet in China. Additionally, it can only be estimated what the effect on investing will be when foreign markets are available, once China becomes a member in the World Trade Organization. The most recent estimate of the number of Chinese investors indicates that there are 40 million individual and five million institutional investors as of 1999. As individuals take more control of their financial planning, we anticipate that this segment will see explosive growth. According to Mr. Ren Peng, Vice President for Haitong Securities Co., LTD., the second largest brokerage in China, it is estimated that the number of individual investors in China will increase to 250 million by 2005. This equates to an annual increase of 38% per year. The institutional segment is estimated to grow by approximately 20% per annum.
| Market Analysis | |||||||
| Year 1 | Year 2 | Year 3 | Year 4 | Year 5 | |||
| Potential Customers | Growth | CAGR | |||||
| Institutional Investors | 20% | 6,000,000 | 7,200,000 | 8,640,000 | 10,368,000 | 12,441,600 | 20.00% |
| Individual Investors | 38% | 55,200,000 | 76,176,000 | 105,122,880 | 145,069,574 | 200,196,012 | 38.00% |
| Total | 36.53% | 61,200,000 | 83,376,000 | 113,762,880 | 155,437,574 | 212,637,612 | 36.53% |
4.2 Target Market Segment Strategy
Staryoo.com will be targeting the individual investor. Our strategy will be to position our website and services as a better way of handling securities transactions, accessing financial and market data, and strategizing on investments. According to International Data Corporation, a market research firm, 30% of individual investors will trade online by 2002. Given that by 2002 there will be an estimated 105 million individual investors, this equates to over 30 million online traders in China. Staryoo.com’s trading platform, with its unique functionality and features, will be ideally suited for this group.
4.2.1 Market Trends
In the past, individual investors could access the financial markets only through a full-commission broker, who would offer investment advice and place trades. These expensive full-service brokers prevented individual investors from trading the markets in a more rapid fashion as commissions and fees quickly eroded profits. Additionally, by requiring personnel to handle each transaction, most traditional brokerage firms restrict their clients’ access to trading and information to the availability of the person processing the transaction. With the emergence of electronic brokerage services, investors are being given the ability to unbundle the costs associated with the human interaction required by full-commission brokers.
We believe that the increased presence of automated teller machines, the growth of discount brokers and a variety of other indicators evidence a shift in demographics that is fundamentally altering the way consumers manage their personal financial assets. Access to information over the Internet, and the growing availability of more powerful, less expensive personal computers has helped create a new type of investor. This investor is more self-reliant, comfortable with technology, value-oriented, and accepts the Internet as a convenient, secure, and reliable means of commerce. Based upon these developments, we believe that this trend has created a growing opportunity to provide online trading services, such as Staryoo.com, that are easy to access, easy to use, cost effective, and secure.
4.2.2 Market Growth
Staryoo.com believes that the increased availability of information to individual investors on a real-time basis, together with government-sponsored advances in Internet access, networking and communications technologies, and China’s membership into the WTO will create tremendous investing opportunities for Web-based investors and market opportunities for Internet trading platforms. In the United States, online trading is the fastest growing segment of the brokerage industry. Forrester Research, Inc. projects that the online trading industry grew from 1.5 million accounts at the end of 1996 to approximately 5 million accounts at the end of 1998, and the market will grow to 8.4 million accounts at the end of 1999, and 14.4 million accounts in 2002. Another industry report indicates that the number of online trades in the United States accounts for 25% to 30% of all individual investor stock transactions, and the volume of trades placed over the Internet increased by 34% from Q3 1998 to Q4 1998. Retail commissions generated by online trading are expected to grow from approximately $268 million in 1996 to as much as $2.2 billion by 2001!
4.2.3 Market Needs
Currently, there are a number of Web-based trading platforms in China but their interfaces and functionality are very inadequate for more sophisticated investors. We believe that as more investors utilize Web-based trading platforms to manage their investment portfolios, they will expect their online platform providers to have broader capabilities. We believe these investors will differentiate among providers based on their capabilities. These capabilities must include:
- Websites that are customer-friendly and easy to navigate and use.
- Multiple points of access to services that are fast, secure, and reliable.
- High levels of online and offline customer service.
- Efficient and quick order entry and processing.
- A wide range of investment tools.
- Educational services for customers.
- An ability to execute trades outside of current markets and market hours.
4.3 Service Business Analysis
The market for online investing services, particularly over the Internet, is new, rapidly evolving and, we feel, soon to be intensely competitive. We expect competition to continue to intensify in the future. Staryoo.com will encounter direct competition from other Internet-based trading platforms and full-service brokerages providing either touch-tone telephone, online investing services, or both. Additionally, we will also compete with financial institutions, mutual fund sponsors and other organizations, some of which may provide online investing services. As China’s equity markets are opened to foreign investors and foreign investment in China increases, foreign Web-based investing services will compete with Staryoo.com.
We believe that the principle competitive factors affecting the market for our services will be customer service, quality, delivery platform, ease of use, presentation layer look and feel, depth and breadth of services and content, innovation, and cost. We believe that we will compete favorably with respect to each of these factors. Our ability to continue to compete will also be affected by our ability to introduce new services and enhancements to existing services into the market on a timely basis.
4.3.1 Business Participants
There are several Internet trading Websites in China, but their functionality is less than that planned for Staryoo.com and they offer little in the way of user functions. The most noted financial Website is by Information Technology Co., Ltd. whose target is “to become China’s top financial Website.” Established in 1995, Homeway is currently the only online investment advisor to be certified by the China Securities Regulatory Commission, though they do not currently offer Web-based securities trading. Currently there are only four websites offering some type of Web-based trading platform, and each sites’ total features are much less than those proposed by the Staryoo.com site.
Strategy and Implementation Summary
During FY2000, and after the introduction of the trading platform, Staryoo.com intends to advertise aggressively to build awareness of our brand quality, customer service, and depth and breadth of products and services. We intend to market our trading platform and services to individual investors by targeting traders through print, online, and other advertisements. Our strategy will be to position our website and services as a better way of handling securities transactions, accessing financial and market data, and strategizing on investments. Our advertising efforts are expected to include advertisements in financial publications and various other regional and national publications that have demographics similar to our target markets. We also intend to advertise and promote our platform through Internet website banner advertisements and television commercials. Using advertising agencies such as 24/7 Media, Inc. which have direct affiliations with a wide range of websites including China.com, may be a cost-effective method of achieving the broad range of impressions necessary to properly promote Staryoo.com
Our initial marketing efforts will be concentrated in China. However, as part of our long-term goals, we plan to market our services to trading communities interested in Chinese equities and securities in other member WTO nations.
5.1 Strategy Pyramid
Most Internet companies use a combination of marketing strategies for promoting their websites and for building brand name awareness. Staryoo.com has the additional advantage of the business relationships developed by Starmile in the financial industries. We feel that our target demographic is an investment-savvy male, affluent, and over the age of 25. Staryoo.com will use the following strategies in the promotion of this new website to the targeted demographic:
- Strategy 1 – Business Relationships – We feel that using existing relationships developed within the financial community will build site usage and recognition with the demographic most likely to be repeat users of our website and trading platform.
- Strategy 2 – Web-based Promotions – Using banner advertising on financial websites will increase brand awareness to a much wider audience, while still maintaining our target demographic. Specific websites to be researched include Sina.com, China.com, China.Internet.com, and China Business Weekly.
- Strategy 3 – Business Newspaper Advertising – Placing large ads in noted financial newspapers directing investors and businessmen to the Staryoo.com site will provide greater penetration into our targeted demographic.
- Strategy 4 – Brokerage Clients – Since we will be working with and not in competition with brokerages, direct marketing to brokerage’s clients will help promote Staryoo.com website awareness.
- Strategy 5 – Chinese American Citizens – Given the large population of Chinese living in America who wish to trade in the Chinese markets, placing advertisements in newspapers devoted to the Chinese in America should attract those requiring Staryoo.com to facilitate their trading.
5.2 Value Proposition
The value proposition offered by Staryoo.com is to give our members a website, which provides the most comprehensive array of financial products available in China for a very reasonable and competitive rate. We believe that the Staryoo.com site will provide our members with a convenient alternative for opening a brokerage account, bank transfers, and pager communications. Most important, Staryoo.com will offer 100% customer satisfaction guarantee for all products and services sold, thus building and retaining our member’s confidence.
5.3 Competitive Edge
Staryoo.com will follow a differentiation strategy to achieve a competitive advantage over other online trading providers in China. This differentiation will be based upon the features and services provided by the Staryoo.com site and include: real-time updates, pager alerts, bank transfers, chat rooms and forums, financial planning, education, etc. We will be quick to respond to our members needs, both for additional services/functionality on the website, and with traditional customer service. Staryoo.com will have both technological and marketing advantages over our competitors arising from the relationship Starmile has developed in the banking and financial industries.
5.4 Marketing Strategy
Staryoo.com has budgeted $100,000 per month for marketing and advertising, beginning in August, 2000. All advertising prior to the June 1, 2000 deployment date will be used to build individual investor anticipation for the site.
- Strategy 1 – Business Relationships – Budget $15,000 for collateral material to be distributed to banking and financial institutions. Note that $60,000 is budgeted for June, 2000 for initial creative and production costs. The remaining $30,000 will be used for re-runs and distribution through the course of the year. It is estimated that an initial distribution of $20,000 will be achieved through these institutions.
- Strategy 2 – Web-based Promotions – Budget $40,000 for banner/sidebar advertising on financial websites. Approximately $5,000 will be devoted to creative while the remaining $35,000 will be for ad placement. Given a CPM of approximately $25 (CBS MarketWatch rates), we can expect to have 1.4 million impressions per month. With a click-through rate of 0.8%, approximately 11,200 new prospective members will be attracted to the Staryoo.com site each month. We will be aggressively tracking click-through rates and membership conversion rates for each type and location of Web advertising done. Additionally, frequency will be capped at three so that impressions will not be lost on unattractable viewers.
- Strategy 3 – Business Newspaper Advertising – Budget $40,000 for advertising in financial and business newspapers. Approximately $5,000 will be devoted to creative while the remaining $35,000 will be for ad placement. Rates for the Business Weekly Newspaper are $5,000 per issue (xxx,xxx circulation). Our strategy will be to place ads consistently on a weekly basis so that our brand awareness is developed and identity remains consistent. This advertising strategy will also be used in America for Chinese Americans looking to trade the Chinese markets.
- Strategy 4 – Brokerage Clients – This will use similar collateral material as described in Strategy 1 above with the exception that it will be personalized for a particular brokerage’s clients. We will budget $5,000 per month for this strategy.
5.4.1 Pricing Strategy
Staryoo.com will focus on attracting customers with a competitive price structure and comprehensive services and functionality. Income will be generated from several sources:
- Brokerage fees from click-throughs to Staryoo.com maintained VPN brokerage sites. Each brokerage will be implemented as a VPN maintained by Staryoo.com. Billing will occur similar to the Application Service Provider (ASP) model, where every time the VPN Brokerage site is accessed, the brokerage will be charged an access fee of $0.125 (1 RMB).
- Fees charged to members for trading alerts.
- Revenue generated from e-business. Commissions will be charged based upon products sold from various vendors.
- Charge members a fee for various information, analysis, and services provided on a tiered system dependent upon content required. To build membership and usage, this revenue stream will not be implemented until 2002.
- Advertisement and promotional fees. Staryoo.com will provide banner advertising to prospective clients wishing to reach a wide and affluent Internet audience.
- The membership database represents tremendous value as a potential customer list. Interested companies wishing to target similar demographics will be charged for access to our membership list.
5.4.2 Promotion Strategy
Outlined below are some of the promotional strategies that will be initially implemented to drive membership:
- Discounted retail purchases.
- Discounted or free bank transfers for active traders.
- Discounted or free alerts for service sign-up.
- Free membership into the Staryoo Investors Club – our premium, value oriented membership club that provides discounts on retail items, commissions, and free trading tips and recommendations.
- Free choice of investment book for graduates of Staryoo University.com. Each graduate will receive an emailed certificate indicating that they have obtained a Bachelor of Staryoo in Investment Technology (B.S.I.T.) degree. Graduates will receive free membership into the Staryoo Investors Club.
- Guess the Hang Seng, Shanghai, and Shenzhen market indexes at the end of each week. Winners will receive commission rebates, computers, public recognition, etc.
5.5 Sales Strategy
We feel that sales will be directly proportional to the number of members using Staryoo.com. Starting with less than 1,000 active members in June 2000, our goal is to secure 18,000 members by December 2000, 80,000 members by December 2001 and 152,000 members by December 2002. The rapid membership escalation in 2002 will be realized with increased advertising and manpower. Important assumptions are highlighted below (see detailed revenue analysis for additional assumptions):
- Members access their VPN Brokerage site 30 times per month.
- Secure two brokerages per month.
- Actual brokerage online trading does not occur until three months after the initial sign-up of the brokerage due to the CSRC online trading application.
- Each brokerage has approximately 20,000 clients.
- Achieve 15% penetration of client base for VPN access, starting out with only 10%, increasing to 13% in 2001, and 15% in 2002.
- Pager Alerts are charged at $0.50 per transmission.
- Initially only 10% of members use the Alert feature.
- Premium membership fees do not occur until 2002.
- Each member spends $50 annually on retail purchases and Staryoo.com earns 20% on transactions.
- Direct Costs of Sales are estimated conservatively at 10% due to advertising creation, promotional discounts, and “Product Service Review” fees.
The annual sales projections are included below.


| Sales Forecast | |||
| Year 1 | Year 2 | Year 3 | |
| Sales | |||
| VPN Brokerage Access Fees | $207,500 | $2,331,000 | $5,373,000 |
| Pager Alerts | $11,066 | $124,320 | $286,560 |
| Advertisement Fees | $55,334 | $621,600 | $1,432,800 |
| E-Commerce | $46,112 | $518,000 | $1,194,000 |
| Other | $0 | $0 | $1,363,800 |
| Total Sales | $320,012 | $3,594,920 | $9,650,160 |
| Direct Cost of Sales | Year 1 | Year 2 | Year 3 |
| VPN Brokerage Access Fees | $20,750 | $233,100 | $537,300 |
| Pager Alerts | $1,107 | $12,432 | $28,656 |
| Advertisement Fees | $5,533 | $62,160 | $143,280 |
| E-Commerce | $4,611 | $51,800 | $119,400 |
| Other | $0 | $0 | $136,380 |
| Subtotal Direct Cost of Sales | $32,001 | $359,492 | $965,016 |
5.6 Strategic Alliances
Strategic alliances are crucial for the full realization of the revenue streams we anticipate. These alliances must be forged in two main areas: the banking industry and with financial brokers. We will pursue relationships with affinity partners to increase our access to potential customers, build brand name recognition, and expand the products and services we can offer our membership. Typical advertising expenses for Internet start-up companies to attract new customers and building name recognition range from 48% to 285% of revenue. We believe that our focus on affinity relationships will result in lower account acquisition costs for members and lower advertising expenses versus these other Internet-based businesses. We anticipate that we will build these alliances based upon the working relationships achieved through Starmile. Additionally, we will be developing e-commerce relationships with partners who will sell retail items on the website and looking to online data providers (i.e. Quote.com, etc.) for reciprocal agreements to share data and members through promotional programs. We intend to expand this affinity program and evaluate potential relationships with new affinity partners in the future as opportunities arise.
5.7 Milestones
Staryoo.com’s important milestones are shown in the following table. Row by row, they track the need to follow up on strategy with specific activities over the next 12 months. Most of the activities on the list can be easily linked to our strategic goals of obtaining greater membership and enhancing the functionality and features of our trading platform.

| Milestones | |||||
| Milestone | Start Date | End Date | Budget | Manager | Department |
| Alpha Testing Platform | 1/15/2000 | 4/15/2000 | R&D Expense | John Wu | Technology |
| Develop Comprehensive Mktg. Plan | 4/15/2000 | 5/15/2000 | R&D Expense | Mr. Zang | Mtkg./Adv. |
| Secure $8M Venture Funding | 1/3/2000 | 5/30/2000 | $50,000 | Johnson | Corporate |
| Brokerage Firm Agreements (2) | 1/3/2000 | 6/1/2000 | Legal Expense | Mr. Zhang | Mtkg./Adv. |
| Beta Testing Platform | 4/15/2000 | 6/1/2000 | R&D Expense | John Wu | Technology |
| Trading Platform goes online | 1/1/2003 | 6/1/2000 | R&D Expense | Mr. Xu | CTO |
| Develop Comprehensive Security Plan | 5/1/2000 | 7/31/2000 | $35,000 | Subcontracted | Corporate |
| Implement Online Trading (1st brokerage) | 5/1/2000 | 9/15/2000 | Expensed | John Wu | Information |
| Sign Up 18,000 Members | 6/1/2000 | 12/31/2000 | Expensed | Mr. Zang | Mktg./Adv. |
| Totals | $85,000 | ||||
Management Summary
The initial management team depends on the founders themselves, with significant engineering resources employed by Starmile, and based in Shuzhou, China. As of May 1, 2000, Staryoo.com has 28 full-time employees, including a CEO, COO, CTO, and two vice-managers responsible for Information, Marketing, and Advertising in China.
6.1 Organizational Structure
Recognizing the extenuating circumstances that will arise due to a U.S. company developing a product for the Chinese markets, the overall management structure must remain flexible. In the short term, the current management team will be responsible for securing the first round of venture capital and overseeing the alpha and beta testing of the trading platform. Starmile will maintain technical development with a transfer of this engineering talent to Staryoo.com planned for May, 2000. It is planned that a Chief Financial Officer (CFO) will be hired by August, 2000.
6.2 Management Team
Mr. Cio, Quigdo, former vice president/CTO of Zheijiang ICBC (the largest commercial bank in China) has nearly 20 years of experience with the development of financial software and hardware. Mr. Cio is an expert on the application of computer technology in the financial industry and plays a crucial role in the advancement technology in the China banking industry, including China’s first debit and credit cards, and the first minicomputer used for accounting systems in banking and computerized deposit systems.
Mr. Smith, John, CEO and founder of Starmile, and president of DoubleTime Electronics, Inc., is a noted entrepreneur and a pioneer in the development of technology as applied to the banking industry in China. Mr. Smith started Starmile in 1994 with just $6,000 and four employees. The company now has 320 employees and sales of $13.7 million annually. DoubleTime Electronics, Inc. was started in 1993 and has over $10 million in assets. Mr. Smith worked as head of the software development department in Zhejiang ICBC for ten years while developing banking accounting, MIS, and document processing systems. Mr. Smith has published several papers and articles on Management and New Technology Applications in the Financial Industry.
Mr. Tsu, Ben, vice president and Chief Technology Officer in Shuzhou for Starmile is responsible for all major technological research and development for the company. Mr. Tsu has been directly responsible for the development of products generating over $20 million in revenue. Mr. Tsu was a key developer of the first and second versions of the first China Securities Brokerage Firm Trading Systems. Mr. Tsu was graduated with honors from Beijing University with a Bachelors of Science in Electrical Engineering in 1992.
Mr. John, Don, vice president of Starmile and CEO at Staryoo.com, is responsible for technology and business development. Mr. John worked as a software engineer and engineering manager in the Eastern Business Tech Corporation for two years, MIS and Business Development manager at BP Tech Corporation for three years, and Engineering Manager at DoubleTree Electronics, Inc. for one year. Mr. John received his Bachelors of Engineering in the Application of Math and Computer Science, his Masters of Engineering in MIS and a Ph.D. in Finance from Shanghai University . Mr. John also holds a Master of Science in Engineering Management from Gonzaga University in 1993.
Mr. Grey, Ronald, COO of Staryoo.com and CEO/founder of Pacific Food, Inc., joined Staryoo.com in January, 2000. Mr. Grey will be responsible for overseeing the development and deployment of Staryoo.com’s trading platform both in China and the United States. From 1993 to 2000, Mr. Grey was CEO of Pacific Food, Inc., an entertainment/food service company located in Orlando, FL, and was responsible for all business development, accounting and human resources. From 1983 through 1993, Mr. Grey worked as Product Engineering Supervisor and Product Engineer in Product Development for LSI and Intel. Mr. Grey graduated Cum Laude from the University of Delaware with a Bachelors of Science in Electrical Engineering in 1983.
6.3 Management Team Gaps
Staryoo.com currently is searching for an experienced Chief Technology Officer from the United States. The Chief Technology Officer position will be hired by June, 2000 in anticipation of providing brokerages with a secure virtual private network through which their clients will communicate. Starmile, through the initial alpha and beta testing of the platform, will provide significant marketing and technology expertise. A Chief Financial Officer will be hired by August, 2000 to oversee the company’s budgets. The company will hire engineering, customer service, accounting, and clerical staff as required to achieve the timelines presented elsewhere in this plan.
Our success will depend on our ability to hire and retain additional qualified marketing, industry, technical, and financial personnel. Qualified personnel are in high demand. We face considerable competition from other service firms and other Internet and online service companies for these personnel, many of which have significantly greater resources than we have. In order for Staryoo.com to attract talented and qualified employees, we must allow our employees to enjoy equity positions in the company. A stock option plan is intended to assist in securing and retaining key employees, directors, and consultants by allowing them to participate in our ownership and growth through the grant of incentive and non-qualified options. By offering sufficient stock options and stock grants to current and prospective employees, we will ensure their loyalty and active participation towards the success of Staryoo.com.
Use of contracts for various services via B2B Internet companies may be necessary to expedite the infrastructure of various departments such as human resources, administrative personnel, and finance.
Advisors to the Board of Directors will be added to our team as the opportunities and individuals present themselves.
6.4 Personnel Plan
The following tables summarize our personnel expenditures for the first three years, with compensation increasing from approximately $534,000 the first year to $2.8 million in the third. We believe this plan is an equitable compromise between fairness and expedience, and meets the commitment of our business plan. Since Staryoo.com is being developed in China for the Chinese markets, initially, a majority of the labor will be personnel from China. The Personnel table is separated into staffing for both China and America, with salaries commensurate with the location. Staryoo.com will gain a tremendous advantage by using the relatively inexpensive labor pool available in China. A typical software engineer in China receives a salary of approximately $500 per month versus the American counterpart at approximately $5,000 per month. The detailed monthly personnel plan for the first year is included in the appendix.
The table below is a breakdown of the staffing growth anticipated in each department (US/CN):
| Department | 2000 | 2001 | 2002 |
| Management | 2/3 | 2/3 | 2/3 |
| Engineering | 2/18 | 4/22 | 7/30 |
| Sales and Marketing | 0/6 | 2/12 | 8/20 |
| Customer Service | 0/5 | 0/7 | 8/10 |
| Finance | 0/3 | 0/5 | 0/10 |
| Miscellaneous Staff | 1/6 | 2/10 | 3/15 |
| Total | 46 | 69 | 116 |
| Personnel Plan | |||
| Year 1 | Year 2 | Year 3 | |
| CEO – USA | $93,950 | $105,000 | $135,000 |
| COO – USA | $87,700 | $95,000 | $120,000 |
| Vice-Manager Mktg & Adv. – China | $35,000 | $55,000 | $65,000 |
| CTO – China | $40,000 | $60,000 | $75,000 |
| CFO – China | $42,000 | $55,000 | $70,000 |
| Engineering Staff – USA | $44,000 | $288,000 | $595,000 |
| Engineering Staff – China | $75,000 | $132,000 | $180,000 |
| Sales & Advertising Staff – USA | $0 | $120,000 | $560,000 |
| Sales & Advertising Staff – China | $14,000 | $57,600 | $96,000 |
| Customer Service Staff – USA | $0 | $0 | $336,000 |
| Customer Service Staff – China | $9,200 | $33,600 | $48,000 |
| Accounting Staff | $10,000 | $25,000 | $60,000 |
| Miscellaneous Staff – USA | $17,500 | $78,000 | $135,000 |
| Miscellaneous Staff – China | $16,800 | $48,000 | $75,000 |
| Total People | 46 | 69 | 116 |
| Total Payroll | $485,150 | $1,152,200 | $2,550,000 |
Financial Plan
Ideally, Staryoo.com wants to bring in as much as several million dollars of equity investment from investors compatible with our growth plans, management style, and vision, in return for a fair equity ownership. The infusion would allow for a buffer of excess cash so that the membership growth plan can be increased and revised on short notice. This plan does not refer to specifics regarding the structure of this equity partnership but will be discussed with suitable partners. As has been mentioned elsewhere in this plan, the exit strategy for any equity partner is through an IPO planned for Q4 2002.
We feel that the financial plan for Staryoo.com is based on conservative estimates and assumptions, but depend upon the initial equity investment to make it work. Membership growth is of paramount importance and is accomplished through increased advertising and customer service support. Initial break-even membership occurs at approximately 67,500 members, which is forecasted in October, 2001. Profitability is not expected until after 2002 due to increased capital expenditures each year and the resulting increased depreciation expenses.
7.1 Important Assumptions
The financial plan depends on important assumptions, most of which are shown in the following table as annual assumptions. The monthly assumptions are included in the appendix. Interest rates, tax rates, and personnel burden are based on conservative assumptions.
Some of the more important underlying assumptions are:
- We assume a strong economy and stock market, without major recession.
- We assume, of course, that there are no unforeseen changes in technology to make the Staryoo.com trading platform and website immediately obsolete.
| General Assumptions | |||
| Year 1 | Year 2 | Year 3 | |
| Plan Month | 1 | 2 | 3 |
| Current Interest Rate | 5.00% | 5.00% | 5.00% |
| Long-term Interest Rate | 7.00% | 7.00% | 7.00% |
| Tax Rate | 34.58% | 35.00% | 34.58% |
| Other | 0 | 0 | 0 |
7.2 Key Financial Indicators
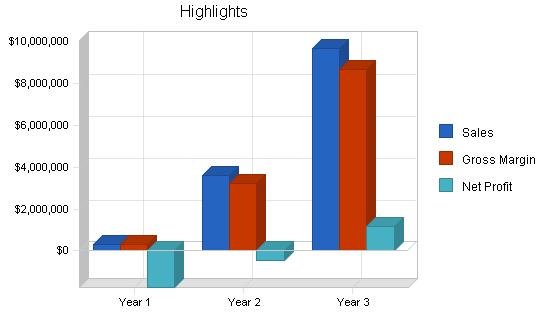
The following benchmark chart indicates our key financial indicators for the first three years. We foresee major growth in sales as well as corresponding operating expenses.

7.3 Break-even Analysis
The following chart and table summarize our break-even analysis, with fixed costs per month at the time of platform deployment, and the amount of revenue we need to establish to break even. Staryoo.com does not expect to reach break-even membership until October, 2001.

| Break-even Analysis | |
| Monthly Revenue Break-even | $188,395 |
| Assumptions: | |
| Average Percent Variable Cost | 10% |
| Estimated Monthly Fixed Cost | $169,555 |
7.4 Projected Profit and Loss
Staryoo.com’s projected profit and loss is shown on the following table, with sales increasing steadily from 2000 through 2002. Significant losses are incurred in the first two years as start-up expenses are sustained and profitability is not expected until after the third year due to increased capital expenditures resulting in increased depreciation expenses.
The following assumptions were made with respect to these projections:
- All revenue streams except Membership Fees will be fully implemented at deployment (June 1, 2000).
- Slightly higher direct costs of sales mainly due to creating advertising banners, etc. for advertisers and promotional items.
- Facility Space increases – China: January 1, 2001 into 10,000 sq. ft. @ $5,000/mo., U.S.: June 1, 2001 into 2,500 sq. ft. @ $3.00/sq. ft./mo.
- Technology expenses are associated with the continued development of infrastructure for the website.
- Information expenses are associated with the purchase and translation of information including RT quotes, local and foreign news, and market information.
- Capital expenditures are increased in 2002 and leads to the increased depreciation expense.
- Depreciation expense is figured on a three-year, straight-line basis.
- Line Charge expenses are associated with the rented bandwidth and telephone lines required for the pager alert features.


| Pro Forma Profit and Loss | |||
| Year 1 | Year 2 | Year 3 | |
| Sales | $320,012 | $3,594,920 | $9,650,160 |
| Direct Cost of Sales | $32,001 | $359,492 | $965,016 |
| Other | $0 | $0 | $0 |
| Total Cost of Sales | $32,001 | $359,492 | $965,016 |
| Gross Margin | $288,011 | $3,235,428 | $8,685,144 |
| Gross Margin % | 90.00% | 90.00% | 90.00% |
| Expenses | |||
| Payroll | $485,150 | $1,152,200 | $2,550,000 |
| Sales and Marketing and Other Expenses | $1,200,000 | $1,975,000 | $3,300,000 |
| Depreciation | $0 | $0 | $0 |
| Line Charges | $50,000 | $75,000 | $150,000 |
| Utilities | $16,000 | $35,000 | $75,000 |
| Technology | $200,000 | $250,000 | $400,000 |
| Rent | $35,000 | $105,000 | $200,000 |
| Payroll Taxes | $48,515 | $115,220 | $255,000 |
| Other | $0 | $0 | $0 |
| Total Operating Expenses | $2,034,665 | $3,707,420 | $6,930,000 |
| Profit Before Interest and Taxes | ($1,746,654) | ($471,992) | $1,755,144 |
| EBITDA | ($1,746,654) | ($471,992) | $1,755,144 |
| Interest Expense | $625 | $0 | $0 |
| Taxes Incurred | $0 | $0 | $606,987 |
| Net Profit | ($1,747,279) | ($471,992) | $1,148,157 |
| Net Profit/Sales | -546.00% | -13.13% | 11.90% |
7.5 Projected Cash Flow
The projected cash flow reflects venture capital investment in 2000, Q1 2001, Q3 2001,Q1 2002 and an initial public offering in Q4 2002. The delay in venture investment required between 2000 and 2001 is due to the expected increases in equipment and software development required to:
- Make U.S. equities markets available to Chinese investors in Q1 2001, and
- Deploy the trading platform in the U.S. by Q2 2002.
Note that excluding the capital purchases in 2001 and the capital input, Staryoo.com has become marginally cash flow positive by the second year.
The timeline and amounts for the capital expenditures through 2001 are as follows:
| Item | Time Frame | Amount |
| Computer Equipment | 05/31/00 | $800,000 |
| Computer Equipment (capacity increase-China) | 09/30/00 | $500,000 |
| Leasehold Improvements | 01/01/01 | $100,000 |
| Software | 01/15/01 | $750,000 |
| Computer Equipment (capacity increase-China) | 01/15/01 | $1,000,000 |
| Leasehold Improvements (2,500 sq. ft. facility-USA) | 06/01/01 | $150,000 |
| Computer Equipment (equipment for USA) | 06/15/01 | $1,000,000 |
| Equipment/Improvements | 2002 | $6,000,000 |

| Pro Forma Cash Flow | |||
| Year 1 | Year 2 | Year 3 | |
| Cash Received | |||
| Cash from Operations | |||
| Cash Sales | $320,012 | $3,594,920 | $9,650,160 |
| Subtotal Cash from Operations | $320,012 | $3,594,920 | $9,650,160 |
| Additional Cash Received | |||
| Sales Tax, VAT, HST/GST Received | $0 | $0 | $0 |
| New Current Borrowing | $50,000 | $0 | $0 |
| New Other Liabilities (interest-free) | $0 | $0 | $0 |
| New Long-term Liabilities | $0 | $0 | $0 |
| Sales of Other Current Assets | $0 | $0 | $0 |
| Sales of Long-term Assets | $0 | $0 | $0 |
| New Investment Received | $4,000,000 | $4,000,000 | $18,600,000 |
| Subtotal Cash Received | $4,370,012 | $7,594,920 | $28,250,160 |
| Expenditures | Year 1 | Year 2 | Year 3 |
| Expenditures from Operations | |||
| Cash Spending | $485,150 | $1,152,200 | $2,550,000 |
| Bill Payments | $1,374,290 | $2,882,998 | $5,702,363 |
| Subtotal Spent on Operations | $1,859,440 | $4,035,198 | $8,252,363 |
| Additional Cash Spent | |||
| Sales Tax, VAT, HST/GST Paid Out | $0 | $0 | $0 |
| Principal Repayment of Current Borrowing | $50,000 | $0 | $0 |
| Other Liabilities Principal Repayment | $0 | $0 | $0 |
| Long-term Liabilities Principal Repayment | $0 | $0 | $0 |
| Purchase Other Current Assets | $0 | $0 | $0 |
| Purchase Long-term Assets | $1,300,000 | $3,000,000 | $6,000,000 |
| Dividends | $0 | $0 | $0 |
| Subtotal Cash Spent | $3,209,440 | $7,035,198 | $14,252,363 |
| Net Cash Flow | $1,160,572 | $559,722 | $13,997,797 |
| Cash Balance | $1,260,572 | $1,820,294 | $15,818,091 |
7.6 Projected Balance Sheet
The following Balance Sheet shows managed but sufficient growth of net worth, and a sufficiently healthy financial position. The monthly estimates are included in the appendix.
| Pro Forma Balance Sheet | |||
| Year 1 | Year 2 | Year 3 | |
| Assets | |||
| Current Assets | |||
| Cash | $1,260,572 | $1,820,294 | $15,818,091 |
| Other Current Assets | $0 | $0 | $0 |
| Total Current Assets | $1,260,572 | $1,820,294 | $15,818,091 |
| Long-term Assets | |||
| Long-term Assets | $1,350,000 | $4,350,000 | $10,350,000 |
| Accumulated Depreciation | $0 | $0 | $0 |
| Total Long-term Assets | $1,350,000 | $4,350,000 | $10,350,000 |
| Total Assets | $2,610,572 | $6,170,294 | $26,168,091 |
| Liabilities and Capital | Year 1 | Year 2 | Year 3 |
| Current Liabilities | |||
| Accounts Payable | $207,852 | $239,565 | $489,206 |
| Current Borrowing | $0 | $0 | $0 |
| Other Current Liabilities | $0 | $0 | $0 |
| Subtotal Current Liabilities | $207,852 | $239,565 | $489,206 |
| Long-term Liabilities | $0 | $0 | $0 |
| Total Liabilities | $207,852 | $239,565 | $489,206 |
| Paid-in Capital | $4,435,000 | $8,435,000 | $27,035,000 |
| Retained Earnings | ($285,000) | ($2,032,279) | ($2,504,271) |
| Earnings | ($1,747,279) | ($471,992) | $1,148,157 |
| Total Capital | $2,402,721 | $5,930,729 | $25,678,886 |
| Total Liabilities and Capital | $2,610,572 | $6,170,294 | $26,168,091 |
| Net Worth | $2,402,721 | $5,930,729 | $25,678,886 |
7.7 Business Ratios
We expect to maintain healthy ratios for risk and return, while steadily improving our Net Profit Margin, Return on Assets, and Return on Equity. Industry profile ratios based on the Standard Industrial Classification (SIC) code 7379, Computer Related Services, nec., are shown for comparison.
| Ratio Analysis | ||||
| Year 1 | Year 2 | Year 3 | Industry Profile | |
| Sales Growth | 0.00% | 1023.37% | 168.44% | 7.20% |
| Percent of Total Assets | ||||
| Other Current Assets | 0.00% | 0.00% | 0.00% | 46.70% |
| Total Current Assets | 48.29% | 29.50% | 60.45% | 71.90% |
| Long-term Assets | 51.71% | 70.50% | 39.55% | 28.10% |
| Total Assets | 100.00% | 100.00% | 100.00% | 100.00% |
| Current Liabilities | 7.96% | 3.88% | 1.87% | 51.40% |
| Long-term Liabilities | 0.00% | 0.00% | 0.00% | 19.10% |
| Total Liabilities | 7.96% | 3.88% | 1.87% | 70.50% |
| Net Worth | 92.04% | 96.12% | 98.13% | 29.50% |
| Percent of Sales | ||||
| Sales | 100.00% | 100.00% | 100.00% | 100.00% |
| Gross Margin | 90.00% | 90.00% | 90.00% | 0.00% |
| Selling, General & Administrative Expenses | 636.00% | 103.13% | 78.18% | 80.70% |
| Advertising Expenses | 218.74% | 33.38% | 17.62% | 1.20% |
| Profit Before Interest and Taxes | -545.81% | -13.13% | 18.19% | 1.70% |
| Main Ratios | ||||
| Current | 6.06 | 7.60 | 32.33 | 1.27 |
| Quick | 6.06 | 7.60 | 32.33 | 1.01 |
| Total Debt to Total Assets | 7.96% | 3.88% | 1.87% | 70.50% |
| Pre-tax Return on Net Worth | -72.72% | -7.96% | 6.83% | 3.50% |
| Pre-tax Return on Assets | -66.93% | -7.65% | 6.71% | 11.80% |
| Additional Ratios | Year 1 | Year 2 | Year 3 | |
| Net Profit Margin | -546.00% | -13.13% | 11.90% | n.a |
| Return on Equity | -72.72% | -7.96% | 4.47% | n.a |
| Activity Ratios | ||||
| Accounts Payable Turnover | 7.61 | 12.17 | 12.17 | n.a |
| Payment Days | 27 | 28 | 22 | n.a |
| Total Asset Turnover | 0.12 | 0.58 | 0.37 | n.a |
| Debt Ratios | ||||
| Debt to Net Worth | 0.09 | 0.04 | 0.02 | n.a |
| Current Liab. to Liab. | 1.00 | 1.00 | 1.00 | n.a |
| Liquidity Ratios | ||||
| Net Working Capital | $1,052,721 | $1,580,729 | $15,328,886 | n.a |
| Interest Coverage | -2,794.65 | 0.00 | 0.00 | n.a |
| Additional Ratios | ||||
| Assets to Sales | 8.16 | 1.72 | 2.71 | n.a |
| Current Debt/Total Assets | 8% | 4% | 2% | n.a |
| Acid Test | 6.06 | 7.60 | 32.33 | n.a |
| Sales/Net Worth | 0.13 | 0.61 | 0.38 | n.a |
| Dividend Payout | 0.00 | 0.00 | 0.00 | n.a |
Appendix
| Sales Forecast | |||||||||||||
| Month 1 | Month 2 | Month 3 | Month 4 | Month 5 | Month 6 | Month 7 | Month 8 | Month 9 | Month 10 | Month 11 | Month 12 | ||
| Sales | |||||||||||||
| VPN Brokerage Access Fees | 0% | $0 | $0 | $0 | $0 | $0 | $2,500 | $7,500 | $15,000 | $25,000 | $37,500 | $52,500 | $67,500 |
| Pager Alerts | 0% | $0 | $0 | $0 | $0 | $0 | $133 | $400 | $800 | $1,333 | $2,000 | $2,800 | $3,600 |
| Advertisement Fees | 0% | $0 | $0 | $0 | $0 | $0 | $667 | $2,000 | $4,000 | $6,667 | $10,000 | $14,000 | $18,000 |
| E-Commerce | 0% | $0 | $0 | $0 | $0 | $0 | $556 | $1,667 | $3,333 | $5,556 | $8,333 | $11,667 | $15,000 |
| Other | 0% | $0 | $0 | $0 | $0 | $0 | $0 | $0 | $0 | $0 | $0 | $0 | $0 |
| Total Sales | $0 | $0 | $0 | $0 | $0 | $3,856 | $11,567 | $23,133 | $38,556 | $57,833 | $80,967 | $104,100 | |
| Direct Cost of Sales | Month 1 | Month 2 | Month 3 | Month 4 | Month 5 | Month 6 | Month 7 | Month 8 | Month 9 | Month 10 | Month 11 | Month 12 | |
| VPN Brokerage Access Fees | 10% | $0 | $0 | $0 | $0 | $0 | $250 | $750 | $1,500 | $2,500 | $3,750 | $5,250 | $6,750 |
| Pager Alerts | 10% | $0 | $0 | $0 | $0 | $0 | $13 | $40 | $80 | $133 | $200 | $280 | $360 |
| Advertisement Fees | 10% | $0 | $0 | $0 | $0 | $0 | $67 | $200 | $400 | $667 | $1,000 | $1,400 | $1,800 |
| E-Commerce | 10% | $0 | $0 | $0 | $0 | $0 | $56 | $167 | $333 | $556 | $833 | $1,167 | $1,500 |
| Other | 10% | $0 | $0 | $0 | $0 | $0 | $0 | $0 | $0 | $0 | $0 | $0 | $0 |
| Subtotal Direct Cost of Sales | $0 | $0 | $0 | $0 | $0 | $386 | $1,157 | $2,313 | $3,856 | $5,783 | $8,097 | $10,410 | |
| Personnel Plan | |||||||||||||
| Month 1 | Month 2 | Month 3 | Month 4 | Month 5 | Month 6 | Month 7 | Month 8 | Month 9 | Month 10 | Month 11 | Month 12 | ||
| CEO – USA | 0% | $6,250 | $6,250 | $6,250 | $6,250 | $6,250 | $7,700 | $8,000 | $8,500 | $9,000 | $9,500 | $10,000 | $10,000 |
| COO – USA | 0% | $0 | $6,250 | $6,250 | $6,250 | $6,250 | $7,700 | $8,000 | $8,500 | $9,000 | $9,500 | $10,000 | $10,000 |
| Vice-Manager Mktg & Adv. – China | 0% | $0 | $0 | $3,500 | $3,500 | $3,500 | $3,500 | $3,500 | $3,500 | $3,500 | $3,500 | $3,500 | $3,500 |
| CTO – China | 0% | $1,000 | $1,000 | $1,000 | $1,000 | $1,000 | $5,000 | $5,000 | $5,000 | $5,000 | $5,000 | $5,000 | $5,000 |
| CFO – China | 0% | $3,500 | $3,500 | $3,500 | $3,500 | $3,500 | $3,500 | $3,500 | $3,500 | $3,500 | $3,500 | $3,500 | $3,500 |
| Engineering Staff – USA | 0% | $0 | $0 | $0 | $0 | $0 | $0 | $0 | $0 | $11,000 | $11,000 | $11,000 | $11,000 |
| Engineering Staff – China | 0% | $2,500 | $3,500 | $4,500 | $4,500 | $6,000 | $6,000 | $7,500 | $7,500 | $7,500 | $7,500 | $9,000 | $9,000 |
| Sales & Advertising Staff – USA | 0% | $0 | $0 | $0 | $0 | $0 | $0 | $0 | $0 | $0 | $0 | $0 | $0 |
| Sales & Advertising Staff – China | 0% | $0 | $0 | $0 | $0 | $1,600 | $1,200 | $1,600 | $1,600 | $1,600 | $2,000 | $2,000 | $2,400 |
| Customer Service Staff – USA | 0% | $0 | $0 | $0 | $0 | $0 | $0 | $0 | $0 | $0 | $0 | $0 | $0 |
| Customer Service Staff – China | 0% | $0 | $0 | $0 | $0 | $0 | $800 | $800 | $1,200 | $1,200 | $1,600 | $1,600 | $2,000 |
| Accounting Staff | 0% | $0 | $0 | $0 | $400 | $1,200 | $1,200 | $1,200 | $1,200 | $1,200 | $1,200 | $1,200 | $1,200 |
| Miscellaneous Staff – USA | 0% | $0 | $0 | $0 | $0 | $0 | $2,500 | $2,500 | $2,500 | $2,500 | $2,500 | $2,500 | $2,500 |
| Miscellaneous Staff – China | 0% | $0 | $0 | $0 | $700 | $1,400 | $2,100 | $2,100 | $2,100 | $2,100 | $2,100 | $2,100 | $2,100 |
| Total People | 8 | 11 | 14 | 14 | 28 | 32 | 36 | 37 | 39 | 41 | 44 | 46 | |
| Total Payroll | $13,250 | $20,500 | $25,000 | $26,100 | $30,700 | $41,200 | $43,700 | $45,100 | $57,100 | $58,900 | $61,400 | $62,200 | |
| General Assumptions | |||||||||||||
| Month 1 | Month 2 | Month 3 | Month 4 | Month 5 | Month 6 | Month 7 | Month 8 | Month 9 | Month 10 | Month 11 | Month 12 | ||
| Plan Month | 1 | 2 | 3 | 4 | 5 | 6 | 7 | 8 | 9 | 10 | 11 | 12 | |
| Current Interest Rate | 5.00% | 5.00% | 5.00% | 5.00% | 5.00% | 5.00% | 5.00% | 5.00% | 5.00% | 5.00% | 5.00% | 5.00% | |
| Long-term Interest Rate | 7.00% | 7.00% | 7.00% | 7.00% | 7.00% | 7.00% | 7.00% | 7.00% | 7.00% | 7.00% | 7.00% | 7.00% | |
| Tax Rate | 30.00% | 35.00% | 35.00% | 35.00% | 35.00% | 35.00% | 35.00% | 35.00% | 35.00% | 35.00% | 35.00% | 35.00% | |
| Other | 0 | 0 | 0 | 0 | 0 | 0 | 0 | 0 | 0 | 0 | 0 | 0 | |
| Pro Forma Profit and Loss | |||||||||||||
| Month 1 | Month 2 | Month 3 | Month 4 | Month 5 | Month 6 | Month 7 | Month 8 | Month 9 | Month 10 | Month 11 | Month 12 | ||
| Sales | $0 | $0 | $0 | $0 | $0 | $3,856 | $11,567 | $23,133 | $38,556 | $57,833 | $80,967 | $104,100 | |
| Direct Cost of Sales | $0 | $0 | $0 | $0 | $0 | $386 | $1,157 | $2,313 | $3,856 | $5,783 | $8,097 | $10,410 | |
| Other | $0 | $0 | $0 | $0 | $0 | $0 | $0 | $0 | $0 | $0 | $0 | $0 | |
| Total Cost of Sales | $0 | $0 | $0 | $0 | $0 | $386 | $1,157 | $2,313 | $3,856 | $5,783 | $8,097 | $10,410 | |
| Gross Margin | $0 | $0 | $0 | $0 | $0 | $3,470 | $10,410 | $20,820 | $34,700 | $52,050 | $72,870 | $93,690 | |
| Gross Margin % | 0.00% | 0.00% | 0.00% | 0.00% | 0.00% | 90.00% | 90.00% | 90.00% | 90.00% | 90.00% | 90.00% | 90.00% | |
| Expenses | |||||||||||||
| Payroll | $13,250 | $20,500 | $25,000 | $26,100 | $30,700 | $41,200 | $43,700 | $45,100 | $57,100 | $58,900 | $61,400 | $62,200 | |
| Sales and Marketing and Other Expenses | $0 | $0 | $0 | $10,000 | $61,250 | $161,250 | $161,250 | $161,250 | $161,250 | $161,250 | $161,250 | $161,250 | |
| Depreciation | 0% | $0 | $0 | $0 | $0 | $0 | $0 | $0 | $0 | $0 | $0 | $0 | $0 |
| Line Charges | 5000000% | $0 | $0 | $0 | $0 | $6,250 | $6,250 | $6,250 | $6,250 | $6,250 | $6,250 | $6,250 | $6,250 |
| Utilities | 1600000% | $0 | $0 | $0 | $0 | $2,000 | $2,000 | $2,000 | $2,000 | $2,000 | $2,000 | $2,000 | $2,000 |
| Technology | 20000000% | $0 | $0 | $0 | $0 | $25,000 | $25,000 | $25,000 | $25,000 | $25,000 | $25,000 | $25,000 | $25,000 |
| Rent | 3500000% | $0 | $0 | $0 | $3,889 | $3,889 | $3,889 | $3,889 | $3,889 | $3,889 | $3,889 | $3,889 | $3,889 |
| Payroll Taxes | 10% | $1,325 | $2,050 | $2,500 | $2,610 | $3,070 | $4,120 | $4,370 | $4,510 | $5,710 | $5,890 | $6,140 | $6,220 |
| Other | $0 | $0 | $0 | $0 | $0 | $0 | $0 | $0 | $0 | $0 | $0 | $0 | |
| Total Operating Expenses | $14,575 | $22,550 | $27,500 | $42,599 | $132,159 | $243,709 | $246,459 | $247,999 | $261,199 | $263,179 | $265,929 | $266,809 | |
| Profit Before Interest and Taxes | ($14,575) | ($22,550) | ($27,500) | ($42,599) | ($132,159) | ($240,238) | ($236,049) | ($227,179) | ($226,498) | ($211,129) | ($193,059) | ($173,119) | |
| EBITDA | ($14,575) | ($22,550) | ($27,500) | ($42,599) | ($132,159) | ($240,238) | ($236,049) | ($227,179) | ($226,498) | ($211,129) | ($193,059) | ($173,119) | |
| Interest Expense | $0 | $0 | $0 | $0 | $208 | $167 | $125 | $83 | $42 | $0 | $0 | $0 | |
| Taxes Incurred | $0 | $0 | $0 | $0 | $0 | $0 | $0 | $0 | $0 | $0 | $0 | $0 | |
| Net Profit | ($14,575) | ($22,550) | ($27,500) | ($42,599) | ($132,367) | ($240,405) | ($236,174) | ($227,263) | ($226,540) | ($211,129) | ($193,059) | ($173,119) | |
| Net Profit/Sales | 0.00% | 0.00% | 0.00% | 0.00% | 0.00% | -6234.57% | -2041.79% | -982.42% | -587.56% | -365.07% | -238.44% | -166.30% | |
| Pro Forma Cash Flow | |||||||||||||
| Month 1 | Month 2 | Month 3 | Month 4 | Month 5 | Month 6 | Month 7 | Month 8 | Month 9 | Month 10 | Month 11 | Month 12 | ||
| Cash Received | |||||||||||||
| Cash from Operations | |||||||||||||
| Cash Sales | $0 | $0 | $0 | $0 | $0 | $3,856 | $11,567 | $23,133 | $38,556 | $57,833 | $80,967 | $104,100 | |
| Subtotal Cash from Operations | $0 | $0 | $0 | $0 | $0 | $3,856 | $11,567 | $23,133 | $38,556 | $57,833 | $80,967 | $104,100 | |
| Additional Cash Received | |||||||||||||
| Sales Tax, VAT, HST/GST Received | 0.00% | $0 | $0 | $0 | $0 | $0 | $0 | $0 | $0 | $0 | $0 | $0 | $0 |
| New Current Borrowing | $0 | $0 | $0 | $0 | $50,000 | $0 | $0 | $0 | $0 | $0 | $0 | $0 | |
| New Other Liabilities (interest-free) | $0 | $0 | $0 | $0 | $0 | $0 | $0 | $0 | $0 | $0 | $0 | $0 | |
| New Long-term Liabilities | $0 | $0 | $0 | $0 | $0 | $0 | $0 | $0 | $0 | $0 | $0 | $0 | |
| Sales of Other Current Assets | $0 | $0 | $0 | $0 | $0 | $0 | $0 | $0 | $0 | $0 | $0 | $0 | |
| Sales of Long-term Assets | $0 | $0 | $0 | $0 | $0 | $0 | $0 | $0 | $0 | $0 | $0 | $0 | |
| New Investment Received | $0 | $0 | $0 | $0 | $0 | $2,000,000 | $0 | $0 | $2,000,000 | $0 | $0 | $0 | |
| Subtotal Cash Received | $0 | $0 | $0 | $0 | $50,000 | $2,003,856 | $11,567 | $23,133 | $2,038,556 | $57,833 | $80,967 | $104,100 | |
| Expenditures | Month 1 | Month 2 | Month 3 | Month 4 | Month 5 | Month 6 | Month 7 | Month 8 | Month 9 | Month 10 | Month 11 | Month 12 | |
| Expenditures from Operations | |||||||||||||
| Cash Spending | $13,250 | $20,500 | $25,000 | $26,100 | $30,700 | $41,200 | $43,700 | $45,100 | $57,100 | $58,900 | $61,400 | $62,200 | |
| Bill Payments | $44 | $1,349 | $2,065 | $2,967 | $19,338 | $105,047 | $203,094 | $204,082 | $205,386 | $208,065 | $210,148 | $212,705 | |
| Subtotal Spent on Operations | $13,294 | $21,849 | $27,065 | $29,067 | $50,038 | $146,247 | $246,794 | $249,182 | $262,486 | $266,965 | $271,548 | $274,905 | |
| Additional Cash Spent | |||||||||||||
| Sales Tax, VAT, HST/GST Paid Out | $0 | $0 | $0 | $0 | $0 | $0 | $0 | $0 | $0 | $0 | $0 | $0 | |
| Principal Repayment of Current Borrowing | $0 | $0 | $0 | $0 | $0 | $10,000 | $10,000 | $10,000 | $10,000 | $10,000 | $0 | $0 | |
| Other Liabilities Principal Repayment | $0 | $0 | $0 | $0 | $0 | $0 | $0 | $0 | $0 | $0 | $0 | $0 | |
| Long-term Liabilities Principal Repayment | $0 | $0 | $0 | $0 | $0 | $0 | $0 | $0 | $0 | $0 | $0 | $0 | |
| Purchase Other Current Assets | $0 | $0 | $0 | $0 | $0 | $0 | $0 | $0 | $0 | $0 | $0 | $0 | |
| Purchase Long-term Assets | $0 | $0 | $0 | $0 | $0 | $800,000 | $0 | $0 | $500,000 | $0 | $0 | $0 | |
| Dividends | $0 | $0 | $0 | $0 | $0 | $0 | $0 | $0 | $0 | $0 | $0 | $0 | |
| Subtotal Cash Spent | $13,294 | $21,849 | $27,065 | $29,067 | $50,038 | $956,247 | $256,794 | $259,182 | $772,486 | $276,965 | $271,548 | $274,905 | |
| Net Cash Flow | ($13,294) | ($21,849) | ($27,065) | ($29,067) | ($38) | $1,047,609 | ($245,227) | ($236,049) | $1,266,070 | ($219,132) | ($190,581) | ($170,805) | |
| Cash Balance | $86,706 | $64,857 | $37,792 | $8,725 | $8,687 | $1,056,296 | $811,069 | $575,020 | $1,841,090 | $1,621,958 | $1,431,378 | $1,260,572 | |
| Pro Forma Balance Sheet | |||||||||||||
| Month 1 | Month 2 | Month 3 | Month 4 | Month 5 | Month 6 | Month 7 | Month 8 | Month 9 | Month 10 | Month 11 | Month 12 | ||
| Assets | Starting Balances | ||||||||||||
| Current Assets | |||||||||||||
| Cash | $100,000 | $86,706 | $64,857 | $37,792 | $8,725 | $8,687 | $1,056,296 | $811,069 | $575,020 | $1,841,090 | $1,621,958 | $1,431,378 | $1,260,572 |
| Other Current Assets | $0 | $0 | $0 | $0 | $0 | $0 | $0 | $0 | $0 | $0 | $0 | $0 | $0 |
| Total Current Assets | $100,000 | $86,706 | $64,857 | $37,792 | $8,725 | $8,687 | $1,056,296 | $811,069 | $575,020 | $1,841,090 | $1,621,958 | $1,431,378 | $1,260,572 |
| Long-term Assets | |||||||||||||
| Long-term Assets | $50,000 | $50,000 | $50,000 | $50,000 | $50,000 | $50,000 | $850,000 | $850,000 | $850,000 | $1,350,000 | $1,350,000 | $1,350,000 | $1,350,000 |
| Accumulated Depreciation | $0 | $0 | $0 | $0 | $0 | $0 | $0 | $0 | $0 | $0 | $0 | $0 | $0 |
| Total Long-term Assets | $50,000 | $50,000 | $50,000 | $50,000 | $50,000 | $50,000 | $850,000 | $850,000 | $850,000 | $1,350,000 | $1,350,000 | $1,350,000 | $1,350,000 |
| Total Assets | $150,000 | $136,706 | $114,857 | $87,792 | $58,725 | $58,687 | $1,906,296 | $1,661,069 | $1,425,020 | $3,191,090 | $2,971,958 | $2,781,378 | $2,610,572 |
| Liabilities and Capital | Month 1 | Month 2 | Month 3 | Month 4 | Month 5 | Month 6 | Month 7 | Month 8 | Month 9 | Month 10 | Month 11 | Month 12 | |
| Current Liabilities | |||||||||||||
| Accounts Payable | $0 | $1,281 | $1,982 | $2,417 | $15,949 | $98,278 | $196,292 | $197,239 | $198,452 | $201,063 | $203,060 | $205,538 | $207,852 |
| Current Borrowing | $0 | $0 | $0 | $0 | $0 | $50,000 | $40,000 | $30,000 | $20,000 | $10,000 | $0 | $0 | $0 |
| Other Current Liabilities | $0 | $0 | $0 | $0 | $0 | $0 | $0 | $0 | $0 | $0 | $0 | $0 | $0 |
| Subtotal Current Liabilities | $0 | $1,281 | $1,982 | $2,417 | $15,949 | $148,278 | $236,292 | $227,239 | $218,452 | $211,063 | $203,060 | $205,538 | $207,852 |
| Long-term Liabilities | $0 | $0 | $0 | $0 | $0 | $0 | $0 | $0 | $0 | $0 | $0 | $0 | $0 |
| Total Liabilities | $0 | $1,281 | $1,982 | $2,417 | $15,949 | $148,278 | $236,292 | $227,239 | $218,452 | $211,063 | $203,060 | $205,538 | $207,852 |
| Paid-in Capital | $435,000 | $435,000 | $435,000 | $435,000 | $435,000 | $435,000 | $2,435,000 | $2,435,000 | $2,435,000 | $4,435,000 | $4,435,000 | $4,435,000 | $4,435,000 |
| Retained Earnings | ($285,000) | ($285,000) | ($285,000) | ($285,000) | ($285,000) | ($285,000) | ($285,000) | ($285,000) | ($285,000) | ($285,000) | ($285,000) | ($285,000) | ($285,000) |
| Earnings | $0 | ($14,575) | ($37,125) | ($64,625) | ($107,224) | ($239,591) | ($479,996) | ($716,170) | ($943,432) | ($1,169,973) | ($1,381,102) | ($1,574,160) | ($1,747,279) |
| Total Capital | $150,000 | $135,425 | $112,875 | $85,375 | $42,776 | ($89,591) | $1,670,004 | $1,433,830 | $1,206,568 | $2,980,027 | $2,768,898 | $2,575,840 | $2,402,721 |
| Total Liabilities and Capital | $150,000 | $136,706 | $114,857 | $87,792 | $58,725 | $58,687 | $1,906,296 | $1,661,069 | $1,425,020 | $3,191,090 | $2,971,958 | $2,781,378 | $2,610,572 |
| Net Worth | $150,000 | $135,425 | $112,875 | $85,375 | $42,776 | ($89,591) | $1,670,004 | $1,433,830 | $1,206,568 | $2,980,027 | $2,768,898 | $2,575,840 | $2,402,721 |


