
Investment Company
Executive Summary
This sample plan was created for a hypothetical investment company that buys other companies as investments. In this sample, the hypothetical Venture Capital firm starts with $20 million as an initial investment fund. In its early months of existence, it invests $5 million each in four companies. It receives a management fee of two percent (2%) of the fund value, paid quarterly. It pays salaries to its partners and other employees, and office expenses, from the management fee.
The investments show up in the Cash Flow table as the purchase of long-term assets, which also puts them into the balance sheet as long-term assets. You can see them in this sample plan, in the first few months.
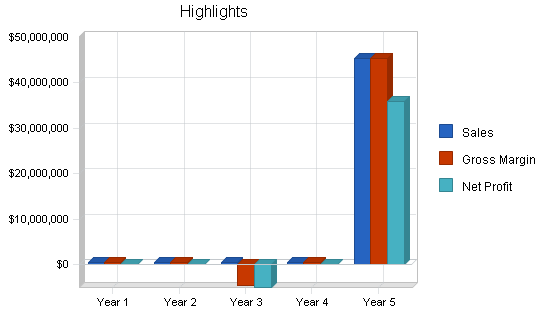
In the third year, one of the target companies fails, so $5 million is written off as failure. You’ll see how that looks as a $5 million sale of long-term assets in the cash flow, and a balancing entry of $5 million in costs of sales in the profit and loss, making for a loss and write-off that year. The result is a tax loss, and the balance of investments goes to $15 million.
In the fifth year, one of the target companies is transacted at $50 million. You’ll see in the sample how that shows up as a $45 million equity appreciation in the sales forecast, plus a $5 million sale of long-term assets in the cash flow. At that point there’s been a $45 million profit, and the balance of long-term assets goes down to $10 million.
This is a simplified example. The business model holds long-term assets and waits for them to appreciate. It doesn’t show appreciation of assets until they are finally sold, and it doesn’t show write-down of assets until they fail. Sales and cost of sales are the appreciation and write-down of assets, plus the management fees.
The explanation above has been broken down and copied into key topics in the outline that are linked to corresponding tables. These topics are:
- 2.2 Start-up Summary
- 5.5.1 Sales Forecast
- 6.4 Personnel
- 7.4 Projected Profit and Loss
- 7.5 Projected Cash Flow
- 7.6 Projected Balance Sheet
Company Summary
Content has been omitted from this sample plan topic, and following sub-topics. This sample plan has an abbreviated plan outline. With the exception of the Executive Summary, only those topics linked to key tables have been used.
The focus of this sample plan is to show the financials for this type of company. Brief descriptions can be found in the topics associated with key tables.
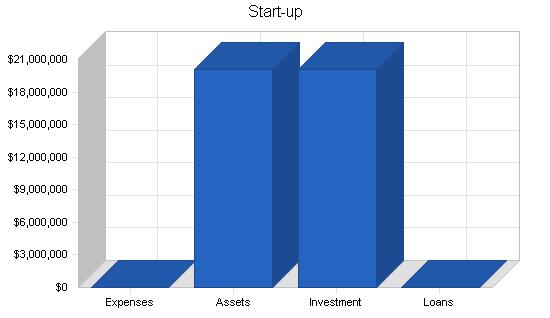
2.1 Start-up Summary
This hypothetical Venture Capital firm starts with $20 million as an initial investment fund. The venture capital partners invest $100,000 as working capital needed to balance the cash flow from quarter to quarter.
| Start-up | |
| Requirements | |
| Start-up Expenses | |
| Legal | $0 |
| Stationery etc. | $0 |
| Brochures | $0 |
| Consultants | $0 |
| Insurance | $0 |
| Rent | $0 |
| Research and Development | $0 |
| Expensed Equipment | $0 |
| Other | $0 |
| Total Start-up Expenses | $0 |
| Start-up Assets | |
| Cash Required | $20,100,000 |
| Other Current Assets | $0 |
| Long-term Assets | $0 |
| Total Assets | $20,100,000 |
| Total Requirements | $20,100,000 |
| Start-up Funding | |
| Start-up Expenses to Fund | $0 |
| Start-up Assets to Fund | $20,100,000 |
| Total Funding Required | $20,100,000 |
| Assets | |
| Non-cash Assets from Start-up | $0 |
| Cash Requirements from Start-up | $20,100,000 |
| Additional Cash Raised | $0 |
| Cash Balance on Starting Date | $20,100,000 |
| Total Assets | $20,100,000 |
| Liabilities and Capital | |
| Liabilities | |
| Current Borrowing | $0 |
| Long-term Liabilities | $0 |
| Accounts Payable (Outstanding Bills) | $0 |
| Other Current Liabilities (interest-free) | $0 |
| Total Liabilities | $0 |
| Capital | |
| Planned Investment | |
| Investor 1 | $20,000,000 |
| Investor 2 | $100,000 |
| Other | $0 |
| Additional Investment Requirement | $0 |
| Total Planned Investment | $20,100,000 |
| Loss at Start-up (Start-up Expenses) | $0 |
| Total Capital | $20,100,000 |
| Total Capital and Liabilities | $20,100,000 |
| Total Funding | $20,100,000 |
Services
Content has been omitted from this sample plan topic, and following sub-topics. This sample plan has an abbreviated plan outline. With the exception of the Executive Summary, only those topics linked to key tables have been used.
The focus of this sample plan is to show the financials for this type of company. Brief descriptions can be found in the topics associated with key tables.
Market Analysis Summary
Content has been omitted from this sample plan topic, and following sub-topics. This sample plan has an abbreviated plan outline. With the exception of the Executive Summary, only those topics linked to key tables have been used.
The focus of this sample plan is to show the financials for this type of company. Brief descriptions can be found in the topics associated with key tables.
Strategy and Implementation Summary
Content has been omitted from this sample plan topic, and following sub-topics. This sample plan has an abbreviated plan outline. With the exception of the Executive Summary, only those topics linked to key tables have been used.
The focus of this sample plan is to show the financials for this type of company. Brief descriptions can be found in the topics associated with key tables.
Sales Forecast


| Sales Forecast | |||||
| Year 1 | Year 2 | Year 3 | Year 4 | Year 5 | |
| Sales | |||||
| Management Fees | $400,000 | $400,000 | $400,000 | $400,000 | $400,000 |
| Equity appreciation | $0 | $0 | $0 | $0 | $45,000,000 |
| Total Sales | $400,000 | $400,000 | $400,000 | $400,000 | $45,400,000 |
| Direct Cost of Sales | Year 1 | Year 2 | Year 3 | Year 4 | Year 5 |
| Management Fees | $0 | $0 | $0 | $0 | $0 |
| Equity appreciation | $0 | $0 | $0 | $0 | $0 |
| Subtotal Direct Cost of Sales | $0 | $0 | $0 | $0 | $0 |
Management Summary
Content has been omitted from this sample plan topic, and following sub-topics. This sample plan has an abbreviated plan outline. With the exception of the Executive Summary, only those topics linked to key tables have been used.
The focus of this sample plan is to show the financials for this type of company. Brief descriptions can be found in the topics associated with key tables.
7.1 Personnel Plan
This hypothetical company pays salaries to its partners and other employees, and office expenses, from the management fee of two percent (2%).
| Personnel Plan | |||||
| Year 1 | Year 2 | Year 3 | Year 4 | Year 5 | |
| Partners | $240,000 | $252,000 | $265,000 | $278,000 | $292,000 |
| Other | $60,000 | $63,000 | $66,000 | $69,000 | $72,000 |
| Total People | 4 | 4 | 4 | 4 | 4 |
| Total Payroll | $300,000 | $315,000 | $331,000 | $347,000 | $364,000 |
Financial Plan
Content has been omitted from this sample plan topic, and following sub-topics. This sample plan has an abbreviated plan outline. With the exception of the Executive Summary, only those topics linked to key tables have been used.
The focus of this sample plan is to show the financials for this type of company. Brief descriptions can be found in the topics associated with key tables.
8.1 Projected Profit and Loss
Please note that in the third year one investment is written off as a failure, producing a $5 million cost which ends up showing a loss for the year of nearly $5 million. The sale of equity at the end of the period enters the sales forecast and the profit and loss statement as a $45 million gain.
You will also note that there may be gains or losses in the value of the assets held as equity investments, but these gains or losses don’t enter the accounting until there is a transaction. The accounting treatment is identical to what an individual investor does with stocks: changes in the market price of a share of stock are irrelevant until that share is actually sold to somebody else, or, if the company ceases to exist, that stock is written off as having no value.


| Pro Forma Profit and Loss | |||||
| Year 1 | Year 2 | Year 3 | Year 4 | Year 5 | |
| Sales | $400,000 | $400,000 | $400,000 | $400,000 | $45,400,000 |
| Direct Cost of Sales | $0 | $0 | $0 | $0 | $0 |
| Investment write-off | $0 | $0 | $5,000,000 | $0 | $0 |
| Total Cost of Sales | $0 | $0 | $5,000,000 | $0 | $0 |
| Gross Margin | $400,000 | $400,000 | ($4,600,000) | $400,000 | $45,400,000 |
| Gross Margin % | 100.00% | 100.00% | -1150.00% | 100.00% | 100.00% |
| Expenses | |||||
| Payroll | $300,000 | $315,000 | $331,000 | $347,000 | $364,000 |
| Sales and Marketing and Other Expenses | $13,200 | $13,900 | $14,600 | $15,300 | $16,000 |
| Depreciation | $0 | $0 | $0 | $0 | $0 |
| Leased Equipment | $2,400 | $2,500 | $2,600 | $2,700 | $2,800 |
| Utilities | $1,200 | $1,300 | $1,400 | $1,500 | $1,600 |
| Insurance | $2,400 | $2,500 | $2,600 | $2,700 | $2,800 |
| Rent | $36,000 | $37,800 | $39,700 | $41,700 | $43,800 |
| Payroll Taxes | $45,000 | $47,250 | $49,650 | $52,050 | $54,600 |
| Other | $0 | $0 | $0 | $0 | $0 |
| Total Operating Expenses | $400,200 | $420,250 | $441,550 | $462,950 | $485,600 |
| Profit Before Interest and Taxes | ($200) | ($20,250) | ($5,041,550) | ($62,950) | $44,914,400 |
| EBITDA | ($200) | ($20,250) | ($5,041,550) | ($62,950) | $44,914,400 |
| Interest Expense | $0 | $0 | $0 | $0 | $0 |
| Taxes Incurred | $0 | $0 | $0 | $0 | $8,982,880 |
| Net Profit | ($200) | ($20,250) | ($5,041,550) | ($62,950) | $35,931,520 |
| Net Profit/Sales | -0.05% | -5.06% | -1260.39% | -15.74% | 79.14% |
8.2 Projected Cash Flow
The Cash Flow shows four $5 million investments made in the first few months of the plan.
In the third year, one of the target companies fails, so $5 million is written off as failure. You’ll see that shows as a $5 million sale of long-term assets in the cash flow, and a balancing entry of $5 million in costs of sales in the profit and loss, making for a loss and write-off that year. The result is a tax loss, and the balance of investments goes to $15 Million.
In the fifth year, another investment is transacted at $50 million. This shows up as a $5 million equity appreciation in the Sales Forecast, plus a $5 million sale of long-term assets in the Cash Flow. At that point there’s been a $45 million profit and the balance of long-term assets goes down to $10 million.
The partners invest an additional $100,000 in the fourth year as additional working capital to balance the cash flow of the company.

| Pro Forma Cash Flow | |||||
| Year 1 | Year 2 | Year 3 | Year 4 | Year 5 | |
| Cash Received | |||||
| Cash from Operations | |||||
| Cash Sales | $400,000 | $400,000 | $400,000 | $400,000 | $45,400,000 |
| Subtotal Cash from Operations | $400,000 | $400,000 | $400,000 | $400,000 | $45,400,000 |
| Additional Cash Received | |||||
| Sales Tax, VAT, HST/GST Received | $0 | $0 | $0 | $0 | $0 |
| New Current Borrowing | $0 | $0 | $0 | $0 | $0 |
| New Other Liabilities (interest-free) | $0 | $0 | $0 | $0 | $0 |
| New Long-term Liabilities | $0 | $0 | $0 | $0 | $0 |
| Sales of Other Current Assets | $0 | $0 | $0 | $0 | $0 |
| Sales of Long-term Assets | $0 | $0 | $5,000,000 | $0 | $5,000,000 |
| New Investment Received | $0 | $0 | $0 | $100,000 | $0 |
| Subtotal Cash Received | $400,000 | $400,000 | $5,400,000 | $500,000 | $50,400,000 |
| Expenditures | Year 1 | Year 2 | Year 3 | Year 4 | Year 5 |
| Expenditures from Operations | |||||
| Cash Spending | $300,000 | $315,000 | $331,000 | $347,000 | $364,000 |
| Bill Payments | $92,128 | $104,671 | $4,699,155 | $526,465 | $8,365,697 |
| Subtotal Spent on Operations | $392,128 | $419,671 | $5,030,155 | $873,465 | $8,729,697 |
| Additional Cash Spent | |||||
| Sales Tax, VAT, HST/GST Paid Out | $0 | $0 | $0 | $0 | $0 |
| Principal Repayment of Current Borrowing | $0 | $0 | $0 | $0 | $0 |
| Other Liabilities Principal Repayment | $0 | $0 | $0 | $0 | $0 |
| Long-term Liabilities Principal Repayment | $0 | $0 | $0 | $0 | $0 |
| Purchase Other Current Assets | $0 | $0 | $0 | $0 | $0 |
| Purchase Long-term Assets | $20,000,000 | $0 | $0 | $0 | $0 |
| Dividends | $0 | $0 | $0 | $0 | $0 |
| Subtotal Cash Spent | $20,392,128 | $419,671 | $5,030,155 | $873,465 | $8,729,697 |
| Net Cash Flow | ($19,992,128) | ($19,671) | $369,845 | ($373,465) | $41,670,303 |
| Cash Balance | $107,872 | $88,201 | $458,045 | $84,580 | $41,754,883 |
8.3 Projected Balance Sheet
You can see in the balance sheet how the ending balances for long-term assets were not re-valued. They remain at the original purchase price until they are sold, or written off as a complete loss. There is a $5 million write-off in the third year, and a sale of $5 million worth of assets in the last year. That sale of $5 million in assets produces the $5 million sale at book value plus the $45 million gain in the sales forecast and profit and loss table.
| Pro Forma Balance Sheet | |||||
| Year 1 | Year 2 | Year 3 | Year 4 | Year 5 | |
| Assets | |||||
| Current Assets | |||||
| Cash | $107,872 | $88,201 | $458,045 | $84,580 | $41,754,883 |
| Other Current Assets | $0 | $0 | $0 | $0 | $0 |
| Total Current Assets | $107,872 | $88,201 | $458,045 | $84,580 | $41,754,883 |
| Long-term Assets | |||||
| Long-term Assets | $20,000,000 | $20,000,000 | $15,000,000 | $15,000,000 | $10,000,000 |
| Accumulated Depreciation | $0 | $0 | $0 | $0 | $0 |
| Total Long-term Assets | $20,000,000 | $20,000,000 | $15,000,000 | $15,000,000 | $10,000,000 |
| Total Assets | $20,107,872 | $20,088,201 | $15,458,045 | $15,084,580 | $51,754,883 |
| Liabilities and Capital | Year 1 | Year 2 | Year 3 | Year 4 | Year 5 |
| Current Liabilities | |||||
| Accounts Payable | $8,072 | $8,651 | $420,045 | $9,530 | $748,313 |
| Current Borrowing | $0 | $0 | $0 | $0 | $0 |
| Other Current Liabilities | $0 | $0 | $0 | $0 | $0 |
| Subtotal Current Liabilities | $8,072 | $8,651 | $420,045 | $9,530 | $748,313 |
| Long-term Liabilities | $0 | $0 | $0 | $0 | $0 |
| Total Liabilities | $8,072 | $8,651 | $420,045 | $9,530 | $748,313 |
| Paid-in Capital | $20,100,000 | $20,100,000 | $20,100,000 | $20,200,000 | $20,200,000 |
| Retained Earnings | $0 | ($200) | ($20,450) | ($5,062,000) | ($5,124,950) |
| Earnings | ($200) | ($20,250) | ($5,041,550) | ($62,950) | $35,931,520 |
| Total Capital | $20,099,800 | $20,079,550 | $15,038,000 | $15,075,050 | $51,006,570 |
| Total Liabilities and Capital | $20,107,872 | $20,088,201 | $15,458,045 | $15,084,580 | $51,754,883 |
| Net Worth | $20,099,800 | $20,079,550 | $15,038,000 | $15,075,050 | $51,006,570 |
8.4 Business Ratios
The Standard Industry Code (SIC) for this type of business is 7389, Business Services. The Industry Data is provided in the final column of the Ratios table.
| Ratio Analysis | ||||||
| Year 1 | Year 2 | Year 3 | Year 4 | Year 5 | Industry Profile | |
| Sales Growth | 0.00% | 0.00% | 0.00% | 0.00% | 11250.00% | 8.20% |
| Percent of Total Assets | ||||||
| Other Current Assets | 0.00% | 0.00% | 0.00% | 0.00% | 0.00% | 44.20% |
| Total Current Assets | 0.54% | 0.44% | 2.96% | 0.56% | 80.68% | 74.30% |
| Long-term Assets | 99.46% | 99.56% | 97.04% | 99.44% | 19.32% | 25.70% |
| Total Assets | 100.00% | 100.00% | 100.00% | 100.00% | 100.00% | 100.00% |
| Current Liabilities | 0.04% | 0.04% | 2.72% | 0.06% | 1.45% | 49.00% |
| Long-term Liabilities | 0.00% | 0.00% | 0.00% | 0.00% | 0.00% | 13.80% |
| Total Liabilities | 0.04% | 0.04% | 2.72% | 0.06% | 1.45% | 62.80% |
| Net Worth | 99.96% | 99.96% | 97.28% | 99.94% | 98.55% | 37.20% |
| Percent of Sales | ||||||
| Sales | 100.00% | 100.00% | 100.00% | 100.00% | 100.00% | 100.00% |
| Gross Margin | 100.00% | 100.00% | -1150.00% | 100.00% | 100.00% | 0.00% |
| Selling, General & Administrative Expenses | 100.05% | 105.06% | 110.39% | 115.74% | 20.86% | 81.40% |
| Advertising Expenses | 0.30% | 0.33% | 0.35% | 0.38% | 0.00% | 1.70% |
| Profit Before Interest and Taxes | -0.05% | -5.06% | -1260.39% | -15.74% | 98.93% | 2.10% |
| Main Ratios | ||||||
| Current | 13.36 | 10.20 | 1.09 | 8.88 | 55.80 | 1.49 |
| Quick | 13.36 | 10.20 | 1.09 | 8.88 | 55.80 | 1.17 |
| Total Debt to Total Assets | 0.04% | 0.04% | 2.72% | 0.06% | 1.45% | 62.80% |
| Pre-tax Return on Net Worth | 0.00% | -0.10% | -33.53% | -0.42% | 88.06% | 4.20% |
| Pre-tax Return on Assets | 0.00% | -0.10% | -32.61% | -0.42% | 86.78% | 11.30% |
| Additional Ratios | Year 1 | Year 2 | Year 3 | Year 4 | Year 5 | |
| Net Profit Margin | -0.05% | -5.06% | -1260.39% | -15.74% | 79.14% | n.a |
| Return on Equity | 0.00% | -0.10% | -33.53% | -0.42% | 70.44% | n.a |
| Activity Ratios | ||||||
| Accounts Payable Turnover | 12.41 | 12.17 | 12.17 | 12.17 | 12.17 | n.a |
| Payment Days | 27 | 29 | 15 | 676 | 15 | n.a |
| Total Asset Turnover | 0.02 | 0.02 | 0.03 | 0.03 | 0.88 | n.a |
| Debt Ratios | ||||||
| Debt to Net Worth | 0.00 | 0.00 | 0.03 | 0.00 | 0.01 | n.a |
| Current Liab. to Liab. | 1.00 | 1.00 | 1.00 | 1.00 | 1.00 | n.a |
| Liquidity Ratios | ||||||
| Net Working Capital | $99,800 | $79,550 | $38,000 | $75,050 | $41,006,570 | n.a |
| Interest Coverage | 0.00 | 0.00 | 0.00 | 0.00 | 0.00 | n.a |
| Additional Ratios | ||||||
| Assets to Sales | 50.27 | 50.22 | 38.65 | 37.71 | 1.14 | n.a |
| Current Debt/Total Assets | 0% | 0% | 3% | 0% | 1% | n.a |
| Acid Test | 13.36 | 10.20 | 1.09 | 8.88 | 55.80 | n.a |
| Sales/Net Worth | 0.02 | 0.02 | 0.03 | 0.03 | 0.89 | n.a |
| Dividend Payout | 0.00 | 0.00 | 0.00 | 0.00 | 0.00 | n.a |
Appendix
| Sales Forecast | |||||||||||||
| Month 1 | Month 2 | Month 3 | Month 4 | Month 5 | Month 6 | Month 7 | Month 8 | Month 9 | Month 10 | Month 11 | Month 12 | ||
| Sales | |||||||||||||
| Management Fees | 2% | $0 | $0 | $100,000 | $0 | $0 | $100,000 | $0 | $0 | $100,000 | $0 | $0 | $100,000 |
| Equity appreciation | 0% | $0 | $0 | $0 | $0 | $0 | $0 | $0 | $0 | $0 | $0 | $0 | $0 |
| Total Sales | $0 | $0 | $100,000 | $0 | $0 | $100,000 | $0 | $0 | $100,000 | $0 | $0 | $100,000 | |
| Direct Cost of Sales | Month 1 | Month 2 | Month 3 | Month 4 | Month 5 | Month 6 | Month 7 | Month 8 | Month 9 | Month 10 | Month 11 | Month 12 | |
| Management Fees | $0 | $0 | $0 | $0 | $0 | $0 | $0 | $0 | $0 | $0 | $0 | $0 | |
| Equity appreciation | $0 | $0 | $0 | $0 | $0 | $0 | $0 | $0 | $0 | $0 | $0 | $0 | |
| Subtotal Direct Cost of Sales | $0 | $0 | $0 | $0 | $0 | $0 | $0 | $0 | $0 | $0 | $0 | $0 | |
| Personnel Plan | |||||||||||||
| Month 1 | Month 2 | Month 3 | Month 4 | Month 5 | Month 6 | Month 7 | Month 8 | Month 9 | Month 10 | Month 11 | Month 12 | ||
| Partners | 0% | $20,000 | $20,000 | $20,000 | $20,000 | $20,000 | $20,000 | $20,000 | $20,000 | $20,000 | $20,000 | $20,000 | $20,000 |
| Other | 0% | $5,000 | $5,000 | $5,000 | $5,000 | $5,000 | $5,000 | $5,000 | $5,000 | $5,000 | $5,000 | $5,000 | $5,000 |
| Total People | 4 | 4 | 4 | 4 | 4 | 4 | 4 | 4 | 4 | 4 | 4 | 4 | |
| Total Payroll | $25,000 | $25,000 | $25,000 | $25,000 | $25,000 | $25,000 | $25,000 | $25,000 | $25,000 | $25,000 | $25,000 | $25,000 | |
| General Assumptions | |||||||||||||
| Month 1 | Month 2 | Month 3 | Month 4 | Month 5 | Month 6 | Month 7 | Month 8 | Month 9 | Month 10 | Month 11 | Month 12 | ||
| Plan Month | 1 | 2 | 3 | 4 | 5 | 6 | 7 | 8 | 9 | 10 | 11 | 12 | |
| Current Interest Rate | 10.00% | 10.00% | 10.00% | 10.00% | 10.00% | 10.00% | 10.00% | 10.00% | 10.00% | 10.00% | 10.00% | 10.00% | |
| Long-term Interest Rate | 10.00% | 10.00% | 10.00% | 10.00% | 10.00% | 10.00% | 10.00% | 10.00% | 10.00% | 10.00% | 10.00% | 10.00% | |
| Tax Rate | 20.00% | 20.00% | 20.00% | 20.00% | 20.00% | 20.00% | 20.00% | 20.00% | 20.00% | 20.00% | 20.00% | 20.00% | |
| Other | 0 | 0 | 0 | 0 | 0 | 0 | 0 | 0 | 0 | 0 | 0 | 0 | |
| Pro Forma Profit and Loss | |||||||||||||
| Month 1 | Month 2 | Month 3 | Month 4 | Month 5 | Month 6 | Month 7 | Month 8 | Month 9 | Month 10 | Month 11 | Month 12 | ||
| Sales | $0 | $0 | $100,000 | $0 | $0 | $100,000 | $0 | $0 | $100,000 | $0 | $0 | $100,000 | |
| Direct Cost of Sales | $0 | $0 | $0 | $0 | $0 | $0 | $0 | $0 | $0 | $0 | $0 | $0 | |
| Investment write-off | $0 | $0 | $0 | $0 | $0 | $0 | $0 | $0 | $0 | $0 | $0 | $0 | |
| Total Cost of Sales | $0 | $0 | $0 | $0 | $0 | $0 | $0 | $0 | $0 | $0 | $0 | $0 | |
| Gross Margin | $0 | $0 | $100,000 | $0 | $0 | $100,000 | $0 | $0 | $100,000 | $0 | $0 | $100,000 | |
| Gross Margin % | 0.00% | 0.00% | 100.00% | 0.00% | 0.00% | 100.00% | 0.00% | 0.00% | 100.00% | 0.00% | 0.00% | 100.00% | |
| Expenses | |||||||||||||
| Payroll | $25,000 | $25,000 | $25,000 | $25,000 | $25,000 | $25,000 | $25,000 | $25,000 | $25,000 | $25,000 | $25,000 | $25,000 | |
| Sales and Marketing and Other Expenses | $1,100 | $1,100 | $1,100 | $1,100 | $1,100 | $1,100 | $1,100 | $1,100 | $1,100 | $1,100 | $1,100 | $1,100 | |
| Depreciation | $0 | $0 | $0 | $0 | $0 | $0 | $0 | $0 | $0 | $0 | $0 | $0 | |
| Leased Equipment | $200 | $200 | $200 | $200 | $200 | $200 | $200 | $200 | $200 | $200 | $200 | $200 | |
| Utilities | $100 | $100 | $100 | $100 | $100 | $100 | $100 | $100 | $100 | $100 | $100 | $100 | |
| Insurance | $200 | $200 | $200 | $200 | $200 | $200 | $200 | $200 | $200 | $200 | $200 | $200 | |
| Rent | $3,000 | $3,000 | $3,000 | $3,000 | $3,000 | $3,000 | $3,000 | $3,000 | $3,000 | $3,000 | $3,000 | $3,000 | |
| Payroll Taxes | 15% | $3,750 | $3,750 | $3,750 | $3,750 | $3,750 | $3,750 | $3,750 | $3,750 | $3,750 | $3,750 | $3,750 | $3,750 |
| Other | $0 | $0 | $0 | $0 | $0 | $0 | $0 | $0 | $0 | $0 | $0 | $0 | |
| Total Operating Expenses | $33,350 | $33,350 | $33,350 | $33,350 | $33,350 | $33,350 | $33,350 | $33,350 | $33,350 | $33,350 | $33,350 | $33,350 | |
| Profit Before Interest and Taxes | ($33,350) | ($33,350) | $66,650 | ($33,350) | ($33,350) | $66,650 | ($33,350) | ($33,350) | $66,650 | ($33,350) | ($33,350) | $66,650 | |
| EBITDA | ($33,350) | ($33,350) | $66,650 | ($33,350) | ($33,350) | $66,650 | ($33,350) | ($33,350) | $66,650 | ($33,350) | ($33,350) | $66,650 | |
| Interest Expense | $0 | $0 | $0 | $0 | $0 | $0 | $0 | $0 | $0 | $0 | $0 | $0 | |
| Taxes Incurred | $0 | $0 | $0 | $0 | $0 | $0 | $0 | $0 | $0 | $0 | $0 | $0 | |
| Net Profit | ($33,350) | ($33,350) | $66,650 | ($33,350) | ($33,350) | $66,650 | ($33,350) | ($33,350) | $66,650 | ($33,350) | ($33,350) | $66,650 | |
| Net Profit/Sales | 0.00% | 0.00% | 66.65% | 0.00% | 0.00% | 66.65% | 0.00% | 0.00% | 66.65% | 0.00% | 0.00% | 66.65% | |
| Pro Forma Cash Flow | |||||||||||||
| Month 1 | Month 2 | Month 3 | Month 4 | Month 5 | Month 6 | Month 7 | Month 8 | Month 9 | Month 10 | Month 11 | Month 12 | ||
| Cash Received | |||||||||||||
| Cash from Operations | |||||||||||||
| Cash Sales | $0 | $0 | $100,000 | $0 | $0 | $100,000 | $0 | $0 | $100,000 | $0 | $0 | $100,000 | |
| Subtotal Cash from Operations | $0 | $0 | $100,000 | $0 | $0 | $100,000 | $0 | $0 | $100,000 | $0 | $0 | $100,000 | |
| Additional Cash Received | |||||||||||||
| Sales Tax, VAT, HST/GST Received | 0.00% | $0 | $0 | $0 | $0 | $0 | $0 | $0 | $0 | $0 | $0 | $0 | $0 |
| New Current Borrowing | $0 | $0 | $0 | $0 | $0 | $0 | $0 | $0 | $0 | $0 | $0 | $0 | |
| New Other Liabilities (interest-free) | $0 | $0 | $0 | $0 | $0 | $0 | $0 | $0 | $0 | $0 | $0 | $0 | |
| New Long-term Liabilities | $0 | $0 | $0 | $0 | $0 | $0 | $0 | $0 | $0 | $0 | $0 | $0 | |
| Sales of Other Current Assets | $0 | $0 | $0 | $0 | $0 | $0 | $0 | $0 | $0 | $0 | $0 | $0 | |
| Sales of Long-term Assets | $0 | $0 | $0 | $0 | $0 | $0 | $0 | $0 | $0 | $0 | $0 | $0 | |
| New Investment Received | $0 | $0 | $0 | $0 | $0 | $0 | $0 | $0 | $0 | $0 | $0 | $0 | |
| Subtotal Cash Received | $0 | $0 | $100,000 | $0 | $0 | $100,000 | $0 | $0 | $100,000 | $0 | $0 | $100,000 | |
| Expenditures | Month 1 | Month 2 | Month 3 | Month 4 | Month 5 | Month 6 | Month 7 | Month 8 | Month 9 | Month 10 | Month 11 | Month 12 | |
| Expenditures from Operations | |||||||||||||
| Cash Spending | $25,000 | $25,000 | $25,000 | $25,000 | $25,000 | $25,000 | $25,000 | $25,000 | $25,000 | $25,000 | $25,000 | $25,000 | |
| Bill Payments | $278 | $8,350 | $8,350 | $8,350 | $8,350 | $8,350 | $8,350 | $8,350 | $8,350 | $8,350 | $8,350 | $8,350 | |
| Subtotal Spent on Operations | $25,278 | $33,350 | $33,350 | $33,350 | $33,350 | $33,350 | $33,350 | $33,350 | $33,350 | $33,350 | $33,350 | $33,350 | |
| Additional Cash Spent | |||||||||||||
| Sales Tax, VAT, HST/GST Paid Out | $0 | $0 | $0 | $0 | $0 | $0 | $0 | $0 | $0 | $0 | $0 | $0 | |
| Principal Repayment of Current Borrowing | $0 | $0 | $0 | $0 | $0 | $0 | $0 | $0 | $0 | $0 | $0 | $0 | |
| Other Liabilities Principal Repayment | $0 | $0 | $0 | $0 | $0 | $0 | $0 | $0 | $0 | $0 | $0 | $0 | |
| Long-term Liabilities Principal Repayment | $0 | $0 | $0 | $0 | $0 | $0 | $0 | $0 | $0 | $0 | $0 | $0 | |
| Purchase Other Current Assets | $0 | $0 | $0 | $0 | $0 | $0 | $0 | $0 | $0 | $0 | $0 | $0 | |
| Purchase Long-term Assets | $5,000,000 | $5,000,000 | $5,000,000 | $5,000,000 | $0 | $0 | $0 | $0 | $0 | $0 | $0 | $0 | |
| Dividends | $0 | $0 | $0 | $0 | $0 | $0 | $0 | $0 | $0 | $0 | $0 | $0 | |
| Subtotal Cash Spent | $5,025,278 | $5,033,350 | $5,033,350 | $5,033,350 | $33,350 | $33,350 | $33,350 | $33,350 | $33,350 | $33,350 | $33,350 | $33,350 | |
| Net Cash Flow | ($5,025,278) | ($5,033,350) | ($4,933,350) | ($5,033,350) | ($33,350) | $66,650 | ($33,350) | ($33,350) | $66,650 | ($33,350) | ($33,350) | $66,650 | |
| Cash Balance | $15,074,722 | $10,041,372 | $5,108,022 | $74,672 | $41,322 | $107,972 | $74,622 | $41,272 | $107,922 | $74,572 | $41,222 | $107,872 | |
| Pro Forma Balance Sheet | |||||||||||||
| Month 1 | Month 2 | Month 3 | Month 4 | Month 5 | Month 6 | Month 7 | Month 8 | Month 9 | Month 10 | Month 11 | Month 12 | ||
| Assets | Starting Balances | ||||||||||||
| Current Assets | |||||||||||||
| Cash | $20,100,000 | $15,074,722 | $10,041,372 | $5,108,022 | $74,672 | $41,322 | $107,972 | $74,622 | $41,272 | $107,922 | $74,572 | $41,222 | $107,872 |
| Other Current Assets | $0 | $0 | $0 | $0 | $0 | $0 | $0 | $0 | $0 | $0 | $0 | $0 | $0 |
| Total Current Assets | $20,100,000 | $15,074,722 | $10,041,372 | $5,108,022 | $74,672 | $41,322 | $107,972 | $74,622 | $41,272 | $107,922 | $74,572 | $41,222 | $107,872 |
| Long-term Assets | |||||||||||||
| Long-term Assets | $0 | $5,000,000 | $10,000,000 | $15,000,000 | $20,000,000 | $20,000,000 | $20,000,000 | $20,000,000 | $20,000,000 | $20,000,000 | $20,000,000 | $20,000,000 | $20,000,000 |
| Accumulated Depreciation | $0 | $0 | $0 | $0 | $0 | $0 | $0 | $0 | $0 | $0 | $0 | $0 | $0 |
| Total Long-term Assets | $0 | $5,000,000 | $10,000,000 | $15,000,000 | $20,000,000 | $20,000,000 | $20,000,000 | $20,000,000 | $20,000,000 | $20,000,000 | $20,000,000 | $20,000,000 | $20,000,000 |
| Total Assets | $20,100,000 | $20,074,722 | $20,041,372 | $20,108,022 | $20,074,672 | $20,041,322 | $20,107,972 | $20,074,622 | $20,041,272 | $20,107,922 | $20,074,572 | $20,041,222 | $20,107,872 |
| Liabilities and Capital | Month 1 | Month 2 | Month 3 | Month 4 | Month 5 | Month 6 | Month 7 | Month 8 | Month 9 | Month 10 | Month 11 | Month 12 | |
| Current Liabilities | |||||||||||||
| Accounts Payable | $0 | $8,072 | $8,072 | $8,072 | $8,072 | $8,072 | $8,072 | $8,072 | $8,072 | $8,072 | $8,072 | $8,072 | $8,072 |
| Current Borrowing | $0 | $0 | $0 | $0 | $0 | $0 | $0 | $0 | $0 | $0 | $0 | $0 | $0 |
| Other Current Liabilities | $0 | $0 | $0 | $0 | $0 | $0 | $0 | $0 | $0 | $0 | $0 | $0 | $0 |
| Subtotal Current Liabilities | $0 | $8,072 | $8,072 | $8,072 | $8,072 | $8,072 | $8,072 | $8,072 | $8,072 | $8,072 | $8,072 | $8,072 | $8,072 |
| Long-term Liabilities | $0 | $0 | $0 | $0 | $0 | $0 | $0 | $0 | $0 | $0 | $0 | $0 | $0 |
| Total Liabilities | $0 | $8,072 | $8,072 | $8,072 | $8,072 | $8,072 | $8,072 | $8,072 | $8,072 | $8,072 | $8,072 | $8,072 | $8,072 |
| Paid-in Capital | $20,100,000 | $20,100,000 | $20,100,000 | $20,100,000 | $20,100,000 | $20,100,000 | $20,100,000 | $20,100,000 | $20,100,000 | $20,100,000 | $20,100,000 | $20,100,000 | $20,100,000 |
| Retained Earnings | $0 | $0 | $0 | $0 | $0 | $0 | $0 | $0 | $0 | $0 | $0 | $0 | $0 |
| Earnings | $0 | ($33,350) | ($66,700) | ($50) | ($33,400) | ($66,750) | ($100) | ($33,450) | ($66,800) | ($150) | ($33,500) | ($66,850) | ($200) |
| Total Capital | $20,100,000 | $20,066,650 | $20,033,300 | $20,099,950 | $20,066,600 | $20,033,250 | $20,099,900 | $20,066,550 | $20,033,200 | $20,099,850 | $20,066,500 | $20,033,150 | $20,099,800 |
| Total Liabilities and Capital | $20,100,000 | $20,074,722 | $20,041,372 | $20,108,022 | $20,074,672 | $20,041,322 | $20,107,972 | $20,074,622 | $20,041,272 | $20,107,922 | $20,074,572 | $20,041,222 | $20,107,872 |
| Net Worth | $20,100,000 | $20,066,650 | $20,033,300 | $20,099,950 | $20,066,600 | $20,033,250 | $20,099,900 | $20,066,550 | $20,033,200 | $20,099,850 | $20,066,500 | $20,033,150 | $20,099,800 |


