
Truckbay
Executive Summary
Truckbay, LLC is a Limited Liability Company organized under the laws of Nebraska and established in October 2002 by co-founders Jim Bell and John Bell. The new fundamental business model for Truckbay.com is to become a light equipment listing service on eBay Motors and build a comprehensive network of linked websites that deliver increased sales and exposure. The ultimate goal is to build Truckbay.com into the leading classified listing service in the global light equipment market. The best way to achieve this goal is to provide the most views per listing of any service.
Truckbay was founded in October 2002. After an initial five-month software development period, Truckbay.com launched in February 2003. Currently, the core business model consists of recurring monthly revenue from a membership fee charged to light duty truck dealers. This membership fee allows access to a private e-community of like dealers who utilize this industry-specific software to buy and sell wholesale equipment online.
In September, 2004, a proposed merger was discussed between Truckbay, Mr. Y and Mr. Z. The purpose of this discussion was to analyze the benefits Truckbay would receive from a consulting arrangement with them. Mr. Y and Mr. Z founded Company X in early 2000. Company X became the most successful listing service for eBay Motors, capturing over 21% of their total automotive listings in their brief history. Company X agreed to sell their company to eBay Corporation in January 2003 returning over 800% return to their original investors. Their success and expertise in eBay Motors and Search Engine technology are ideal compliments as Truckbay turns its focus to this similar business model. Company X has agreed to contribute capital, business and technical consulting, along with a venture capital pool, in exchange for 15% ownership in Truckbay.
Truckbay will focus on four key markets to sell our online classified advertising solutions to:
- Light Truck Dealers
- Fleets
- Financial Institutions
- Individual Owners
Our most important group of customers are Dealer Principals and Sales Managers within the Light Truck organizations. In most cases, the Sales Manager is charged with distributing his substantial advertising budget among the most effective sources of lead generation. While they are open to new sources on the most part, they are looking for immediate return on their investment. Truckbay will generate immediate leads and sales by leveraging eBay Motors’ massive marketplace and other multi-channel linked websites.
Financial Considerations
The marketing research and tailored marketing strategy described in this business plan will result in after-tax profits of approximately $549,000 by 2007. We estimate that by 2008, revenues will reflect a 20% market share of the eBay Motors light truck listing market. We are operating on a cash basis, accepting pre-paid listings only.
Truckbay is seeking $475,000 in venture capital for 19% equity ownership of the company. We anticipate an IRR of 109%, with an investor’s ending valuation of $1,043,100 in 2007, based on an earnings-based valuation reflecting projections from a similar period in Company X’s history. Our exit strategy is to sell Truckbay within 3-5 years to a larger related company (such as ebay).

1.1 Objectives
Truckbay’s fundamental objective is to provide a leading, online classified advertising solution that targets the global heavy truck and equipment market. Our key goals include:
- Leverage eBay Motor’s marketplace to gain rapid market exposure in this large niche industry.
- Utilize cutting-edge Search Engine technology to drive viewership.
- Provide an affordable, turn-key eDealer suite of online services to garner long term loyalty.
1.2 Mission
Truckbay is a commercial enterprise, and as such, exist for the purpose of generating sales & profits for its investors, owners, managers and staff. Because Truckbay is a service business, it also exists to serve its customers.
- The company will provide the best online advertising solution for the global heavy truck and equipment market.
- The company will partner with proven, experienced consultants and industry leaders.
- Our customers will always receive a valuable service that utilizes the latest in technological advances.
- Our team will consist of high-energy, results-oriented people who are trained to be the best.
- Our team will be offered a workplace where they can prosper & grow in a dignified, fun and rewarding manner.
- Our investors will see a lucrative return on their dollars, and will have the opportunity for future growth and prosperity with the company.
1.3 Keys to Success
We believe that our main keys to success include:
- Utilizing key Search Engine technology to drive traffic
- Leveraging eBay Motors to drive traffic
- Positive team workplace environment
- Seasoned management team
We will minimize certain risk factors by:
- Maintaining a low overhead structure
- Hiring a draw, versus commissioned, Sales Team
- Utilizing successful practices from a proven business model
Company Summary
Truckbay was founded in October 2002. After an initial five-month software development period, the website launched in February 2003. Currently, the core business model consists of recurring monthly revenue from a membership fee charged to heavy duty truck and trailer dealers. This membership fee allows access to a private e-community of like dealers who utilize this industry specific software to buy and sell wholesale equipment online.
Truckbay did not meet revenue expectations during the first two years of business, even though over one-half the potential market tried our limited services and over 800 trucks and trailers are listed on the site. Unfortunately, a majority of the members that utilize Truckbay are not listing their equipment at wholesale prices. Since this is the core business, the membership cannot gain momentum as long as Dealers try to sell their wholesale inventory at retail prices. This delay in market acceptance has unexpectedly exhausted the working capital budgeted for this start-up.
It has become evident that continuing to nurture this business model will not allow the company to reach its goals. Through informal market studies and surveys, Dealers have consistently said they are eager to utilize new online services that will help increase sales and exposure. In order to achieve these goals, the following new features are necessary to increase the value of our services.
The new fundamental business model for Truckbay is to become a heavy equipment listing service on eBay Motors and build a comprehensive network of linked websites that deliver increased sales and exposure. The ultimate goal is to build Truckbay into the leading classified listing service in the global heavy equipment market. The best way to achieve this goal is to provide the most views per listing of any service.
eBay Motors is positioned to be a key retail lead generator for this market as they have already accomplished this with the automobile industry. Truckbay will leverage this extensive marketplace by providing Dealers a listing service to eBay Motors which will, in turn, establish a massive collection of equipment listings. In addition, we will build a group of twenty specific websites interlinking to Truckbay.
For example, a Dealer lists a tractor on eBay Motors utilizing the Truckbay service. We will take that listing and send it to eBay, Truckbay and potentially to twenty other similar Truckbay websites. By utilizing eBay, Google, MSN and Yahoo search technology, this listing and websites will appear in the top percentage of search results. This type of exposure will provide the customer with optimum value and certainly with the results they are looking for.

2.1 Company Ownership
Truckbay, LLC is a Limited Liability Company organized under the laws of Georgia and established in October 2002 by co-founders Cab Trucker and John Speed. Membership interest is 80/20 respectively.
Cab Trucker
Cab Trucker is President of Truckbay. In addition to growing up in this business, Cab has spent the last 10 years buying and selling heavy equipment across the U.S. Most recently, Cab served as Branch Manager for [proprietary and confidential information removed]. His strengths include Sales, Marketing and Financials.
John Speed
John Speed is an investor with Truckbay. John is CEO of Company A and participates in numerous entrepreneurial ventures. John was awarded the Entrepreneur of the Year for Technology by Ernst & Young’s in 2002. Subject to shareholder approval, Company A is being acquired by Fidelity National Financial in the 4th quarter of 2004.
In September, 2004, a proposed merger was discussed between Truckbay, Mr. Y and Mr. Z. The purpose of this discussion was to analyze the benefits Truckbay would receive from a consulting arrangement with the fore-mentioned gentlemen.
Mr. Y and Mr. Z founded Company X in early 2000. Company X became the most successful listing service for eBay Motors, capturing over 21% of their total automotive listings in their brief history. Mr. Y and Mr. Z agreed to sell their company to eBay Corporation in January 2003 returning over 800% return to their original investors. Their success and expertise in eBay Motors and Search Engine technology are ideal compliments as Truckbay turns its focus on this similar business model.
Mr. Y and Mr. Z have agreed to contribute capital, business and technical consulting, along with a venture capital pool, in exchange for 15% ownership in Truckbay. If accepted, the new membership structure would be dispersed accordingly:
51% Cab Trucker – President and CEO
35% Mr. Y and Mr. Z – Investment Group and Consulting (Y and Z with 7.5% each, 19% for Private Investors, 1% for API Developer)
13% John Speed – Consultant
1% Attorney Services
2.2 Company History
Truckbay has been able to stay profitable by maintaining a low overhead. However, the company’s lofty financial goals can not be achieved without integrating new services to generate more revenue. In order to build these services, the company will need to raise $500,000 in capital to be utilized for technology enhancements, office infrastructure, personnel wages and office rent.
The company will continue to maintain the lowest possible overhead and will not incur any debt unless absolutely necessary. The founders believe that keeping fixed costs down is a key to success. This has been shown during the first two years of business.

| Past Performance | |||
| 2002 | 2003 | 2004 | |
| Sales | $0 | $31,000 | $43,000 |
| Gross Margin | $0 | ($15,000) | $10,000 |
| Gross Margin % | 0.00% | -48.39% | 23.26% |
| Operating Expenses | $0 | $48,000 | $35,000 |
| Balance Sheet | |||
| 2002 | 2003 | 2004 | |
| Current Assets | |||
| Cash | $0 | $3,000 | $4,000 |
| Other Current Assets | $0 | $1 | $1 |
| Total Current Assets | $0 | $3,001 | $4,001 |
| Long-term Assets | |||
| Long-term Assets | $0 | $26,000 | $26,000 |
| Accumulated Depreciation | $0 | $11,000 | $11,000 |
| Total Long-term Assets | $0 | $15,000 | $15,000 |
| Total Assets | $0 | $18,001 | $19,001 |
| Current Liabilities | |||
| Accounts Payable | $0 | $0 | $0 |
| Current Borrowing | $0 | $3,500 | $7,000 |
| Other Current Liabilities (interest free) | $0 | $0 | $0 |
| Total Current Liabilities | $0 | $3,500 | $7,000 |
| Long-term Liabilities | $0 | $0 | $0 |
| Total Liabilities | $0 | $3,500 | $7,000 |
| Paid-in Capital | $0 | $55,000 | $55,000 |
| Retained Earnings | $0 | ($40,212) | ($25,999) |
| Earnings | $0 | ($287) | ($17,000) |
| Total Capital | $0 | $14,501 | $12,001 |
| Total Capital and Liabilities | $0 | $18,001 | $19,001 |
| Other Inputs | |||
| Payment Days | 1 | 1 | 1 |
Services
Truckbay will be a multi-channel marketing tool for classified equipment, and will offer the following core services:
- Provide a premier listing service for eBay Motors to assist their clients in advertising, selling and ultimately making more profit for their equipment.
- Provide a heavy-equipment search engine on multiple websites for the global Internet community.
- Provide a private wholesale section for the dealer network to exchange equipment.
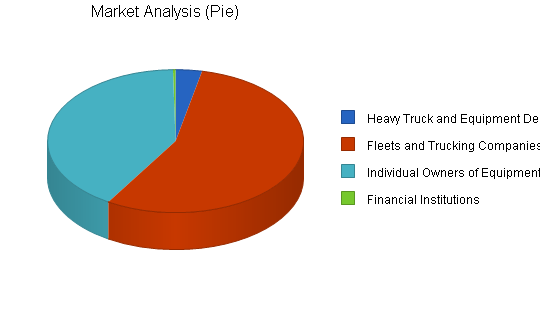
Market Analysis Summary
Truckbay will focus on four key markets for our online classified advertising solutions:
- Heavy Truck and Equipment Dealers
- Fleets and Trucking Companies
- Financial Institutions
- Individual Owners of Equipment
Our most important group of customers are Dealer Principals and Sales Managers within the Heavy Truck and Equipment organizations. In most cases, the Sales Manager is charged with distributing his substantial advertising budget among the most effective sources of lead generation. While they are open to new sources, for the most part, they are looking for immediate return on their investment. Truckbay will generate immediate leads and sales by leveraging eBay Motors’ massive marketplace and other multi-channel linked websites.
Fleets, trucking companies, financial institutions and the individual owners of equipment make up a substantial market in themselves. Utilizing our existing contacts and relationships within these organizations, Truckbay will offer a unique online service that will provide a less expensive and more efficient solution to advertising their trades, repossessions and aged equipment.
4.1 Market Segmentation
Truckbay will target markets with the highest volume of potential equipment listings. These target markets in North America include:
-
Mid-to-large sized truck dealerships
-
Mid-to-large sized heavy equipment dealerships
-
Fleets operating 5 or more vehicles
-
Trucking Companies operating 5 or more vehicles
| Market Analysis | |||||||
| 2005 | 2006 | 2007 | 2008 | 2009 | |||
| Potential Customers | Growth | CAGR | |||||
| Heavy Truck and Equipment Dealers | 1% | 5,000 | 5,050 | 5,101 | 5,152 | 5,204 | 1.00% |
| Fleets and Trucking Companies | 1% | 84,000 | 84,840 | 85,688 | 86,545 | 87,410 | 1.00% |
| Individual Owners of Equipment | 1% | 62,000 | 62,620 | 63,246 | 63,878 | 64,517 | 1.00% |
| Financial Institutions | 1% | 500 | 505 | 510 | 515 | 520 | 0.99% |
| Total | 1.00% | 151,500 | 153,015 | 154,545 | 156,090 | 157,651 | 1.00% |
4.2 Target Market Segment Strategy
By focusing our efforts on these specific markets, we will grow our inventory database quicker than trying to reach the entire market segment. While not forecasted in our financial plan, we intend to gain incremental growth from the individual owner operator market as they find our services at eBay Motors and from top placement on search engines.
4.3 Service Business Analysis
The often neglected heavy truck and equipment industry has relatively few organizations offering online services. While we anticipate that this will change, Truckbay is currently positioned to take advantage of being “first to market” with our unique classified listing service.
Typically, this conservative industry trails the more glamorous automotive industry by 3-5 years in adopting technology trends. These Dealers may no longer survive doing business the old fashion way. As they slowly embrace technology, Dealers have begun to allocate more and more of their advertising budget for online services. We are in our infancy, while eBay Motors has a proven track record. As of today, no organization has a similar service that targets the heavy truck and equipment business. Truckbay will fill that void and provide a valuable new service that produces immediate results. Wide-spread acceptance will become inevitable as long as we remain proactive.
Strategy and Implementation Summary
The sales and marketing strategy is to move as quickly as possible into the eBay Motors classified listing service for heavy trucks and equipment. It has been shown that these market areas are presently not being actively pursued by the competition. We will maintain our lead and competitive advantage if we:
Emphasize service
We will focus on surpassing our customers’ expectations in every facet of our business.
Build a relationship-oriented business
We will build long-term relationships with customers, not single-visit deals.
Focus on target markets
We will focus our offerings proactively to the customers that are most profitable.
5.1 Competitive Edge
Clearly, our competitive edge is the experience and approach that our management team will bring to the table. We plan to utilize a proven business model that targeted the automobile industry and convert it to the heavy truck and equipment industry. With the maturity of eBay Motors and Truckbay being the first to market, we will grow exponentially as we fill a need in this market.
We will also keep abreast of the latest Search Engine Technology to maintain top ranking in our industry categories. Finally, our commitment to the entire user experience, striving to exceed our customers’ expectations, will support a loyal following as new competitors join the market.
5.2 Sales Strategy
The marketing strategy discussed previously in this business plan will generate the desired sales leads. These leads will begin with a phone call or email to Truckbay. In addition, our Sales Team will proactively make calls to their respective assigned regions. Initially, we plan to divide North America into eight regions of responsibility (Northeast, Mid-Atlantic, Southeast, North Central, South Central, West, Canada and Mexico). Team members will be provided with a contact database of heavy truck and equipment dealers in their area. This list will be acquired by Polk, the leading provider of list in our industry.
As mentioned, our Sales Team will be proactively contacting Dealers, Trucking Companies, Fleets, Finance Companies and individual owners of heavy trucks and equipment. We will support whatever level of service the customer requires with the objective to get their listings in our database. We will even have the ability to send a 3rd party inspector to their property and gather the data and take multiple pictures to achieve this goal.
To protect the company’s long term viability, team members will be required to sign a limited non-compete agreement. In addition, we will invest in the infrastructure to maintain the integrity of our sales database. The company will provide each team member with a networked PC that will allow them to access the internet at high speeds. The Company database will be maintained by Salesforce.com, which will deter theft of information and keep the data clean. Each PC will include limited software to keep the initial investment low. All PCs will have the ability to print to a single laser printer.
With regard to our database of customers and prospects, it is essential that a consultative sales approach be adopted to ensure a thorough, organized, orderly approach for each prospect. Detailed notes will be kept on each client. Follow-up and persistence will pay off. This approach will allow the company tremendous flexibility in case of turnover. A new team member will have the ability to be quickly trained and instantly become a profit center by utilizing the existing contact database with detailed notes.
The typical sales position will consist of the following responsibilities:
- Proactively call 40-50 prospects per day.
- Assist clients in listing a minimum of 15 classifieds per day that go to auction.
- Qualify and enroll 5 Dealers to our full service inventory management package.
- By using historical eBay Motors data, match showroom inventory with highly successful eBay auctions and propose wording to our clients.
The Team Member compensation package will consist of the following earning options. The goal is to provide a quality, persistent salesperson the ability to earn $37,000 annually and includes incentives to achieve unlimited income potential.
- Team members will receive a straight 10% commission from a standard $160 listing.
- Closing a full service Dealer will earn the Team member 50% of the 1st month’s fee along with a 5% per-listing commission.
- When a listing is sold on eBay Motors, the Team member will earn an additional $25.
- When the Sales Team reaches their collective monthly goals, each member will receive a $200 bonus and the Company will purchase lunch to be served in-house.
The goal of the draw/commission package is to fairly compensate each Team member for solid work ethic, while offering strong financial incentives to cultivate strong customer-centric ownership and maximize the revenue from each potential client. It requires additional energy to listen to each client every day. While some clients require more hand-holding than others, the Team member that “goes the extra mile” to achieve the ultimate goal, a sold listing, will be substantially rewarded.
The purpose of a Team concept versus the typical Salesforce is to cultivate a “true” team environment. Our mission statement clearly describes our focus to surpass the customer’s expectation. What typically happens when a customer calls a company and their assigned salesperson is not immediately available? They are quickly passed on to voice mail or put on hold. This will not surpass our customer’s expectations and they will become frustrated, hang-up and/or take their business elsewhere. This is not an option.
Therefore, our customer experience will be much different. If an assigned Team member is not available to immediately speak with our clients, the individual that picks up the phone call before the end of the second ring will take ownership of the call. They will be trained and provided access to the client’s information so that the customer is “wowed” by the ending results. While the interim Team member will not receive any commission for “going the extra mile,” they will be able to confidently expect the same treatment of their clients in the inevitable event they are unavailable. This is a main reason why we will have a monthly team bonus structure. This positive office environment cultivates a win-win solution. If we do not master these skills, someone else will.
To assist in the hiring process, we will offer the best, qualified candidates a base salary of $2,500 per month. Each assigned cubicle will be treated as a separate profit center for the company. The office structure will be an open call center with cubicles that cultivate active energy and positive synergies for the Team members. Cab Trucker has a successful history in building and managing a team environment as a manager.
5.2.1 Sales Forecast
As the following table shows, the company plans to deliver sales of approximately $824,000 in the first year, $1,290,000 in the second year, and $1,660,000 in the third year plan implementation.


| Sales Forecast | |||
| 2005 | 2006 | 2007 | |
| Sales | |||
| eBay Motors Single Listing | $640,000 | $750,000 | $1,000,000 |
| eBay Motors Unlimited Listings | $138,080 | $480,000 | $600,000 |
| Affiliate Buyer’s Assistance Programs | $6,490 | $7,500 | $8,000 |
| Buyer Assistant Partnerships | $4,100 | $6,000 | $6,000 |
| Co-op Advertising | $1,500 | $2,000 | $2,000 |
| Dealers Single Listing | $4,700 | $6,000 | $6,000 |
| Dealer Wholesale Membership | $30,000 | $40,000 | $40,000 |
| Total Sales | $824,870 | $1,291,500 | $1,662,000 |
| Direct Cost of Sales | 2005 | 2006 | 2007 |
| Other | $0 | $0 | $0 |
| Technology | $120,000 | $150,000 | $250,000 |
| Subtotal Direct Cost of Sales | $120,000 | $150,000 | $250,000 |
5.3 Marketing Strategy
Truckbay will position itself as the online classified listing solution for the heavy truck and equipment industry in North America. By utilizing the latest Search Engine technology and purchasing specific ad words to secure top placement, we will gain immediate recognition as an industry leader. We also plan to secure a substantial market share of all eBay Motors’ commercial vehicle listings. We will be consistently recognized as a leader, with the exposure eBay auctions, stores and keyword searches provide within this leading marketplace.
Currently, eBay has over 62 Million registered users, 7 Million unique visitors each month and eBay Motors is by far their most profitable division, bringing in over 30% of their revenue. Last year, eBay Motors handled over 600,000 vehicle transactions, averaging 1,600 trades per day. It is estimated that eBay Motors is helping sell 1 car per minute, clearly making them the top automotive seller in the world.
For the first time in eBay’s history, it has hired sales staff to actively contact used car dealers and promote the site. Truckbay will also have a Sales Team that proactively contacts the heavy truck and equipment market. Ford has recently advised its dealers that the number of vehicles being sold sight-unseen prior to sale has risen above 5%. Our goal is to be first to market for trucks, and offer the best service to this large niche market.
5.4 Milestones
Our first milestone will be to secure $475,000 in capital from the private market. 19% of the business will be available with a minimum investment of $25,000 securing 1%. We have allocated 2 months to gather these funds; however, this may be accelerated as interest has already been expressed by outside investors.
After the holidays, we plan to begin building the technical infrastructure and the eBay Motors API integration. Concurrently, we will redesign the website to improve upon the existing structure. A main focus will be to eliminate the password requirement in order to access the existing inventory. There will continue to be a private “Dealer-only” link which will be password-protected and include wholesale pricing.
Once the website is complete, the core search engine technology will be cloned to the homepage of 10 new affiliate websites that target a smaller, popular niche market. While these websites will look entirely different, they will ultimately provide filtered search results from the main website database or information for typical Search Engine questions from the consumer. In addition, there will be links to all other Truckbay websites on each homepage navigating users to areas of interest. This will not be transparent to the average Web surfer.
We estimate the design and development will take no more than 3 months. Assuming we stay on schedule, we will try to secure office space and begin the process of recruiting and training a Sales Team for a March 1, 2005 launch date. The first month will be used to perfect the website functionality and training. In the 2nd quarter of 2005, we will begin aggressively contacting target markets and selling our services. If our marketing survey results are still valid, we expect rapid acceptance. We will offer a 7-day money back guarantee to any prospects that may be unsure.
The Company believes that activity breeds activity, so we plan to initiate numerous advertising campaigns to drive high volume for the first year. This includes selective pay-per-click ad words on Google, Yahoo, MSN and Overture.

| Milestones | |||||
| Milestone | Start Date | End Date | Budget | Manager | Department |
| Review Business Plan | 10/15/2004 | 11/1/2004 | $0 | ALL | ALL |
| Secure Private Capital | 11/1/2004 | 12/31/2004 | $500 | RAS, LP | N/A |
| Repurposing website | 1/3/2005 | 2/1/2005 | $3,000 | Dale Corley | Marketing |
| Build website | 1/3/2005 | 3/1/2005 | $12,500 | Shane Rapp | Technology |
| Build eBAY API integration | 1/3/2005 | 3/1/2005 | $12,500 | Shane Rapp | Technology |
| Create 10 HTML affiliate websites | 1/3/2005 | 3/1/2005 | $10,000 | Shane Rapp | Technology |
| Recruit and Hire Sales Team | 3/1/2005 | 4/1/2005 | $5,000 | Russ Chaney | Sales |
| Office Furniture & PCs | 3/1/2005 | 6/1/2005 | $10,000 | Dale Corley | GM |
| Office Rent Factor | 2/1/2005 | 12/31/2005 | $15,000 | Dale Corley | GM |
| Submit Search Engine Ad words | 3/1/2005 | 12/31/2005 | $2,500 | Dale Corley | Advertising |
| Pay-Per-Click w/ Google & Overture | 3/1/2005 | 12/31/2005 | $5,000 | Dale Corley | Advertising |
| Software Leasing – Salesforce.com | 3/1/2005 | 12/31/2005 | $5,000 | Dale Corley | Sales |
| eBay Store and Ad words | 3/1/2005 | 12/31/2005 | $2,500 | Dale Corley | Advertising |
| Totals | $83,500 | ||||
Web Plan Summary
Truckbay will consist of two core and ten affiliate websites, all driving listings and traffic to each other. www.Truckbay.net will be our eBay Motors listing service website. www.Truckbay.com will be our main classified advertising website. The ten affiliate websites will be described in the next section.
6.1 Website Marketing Strategy
The customer has two choices from the beginning. They can add a few listings and try out the auction service or add their entire inventory. Team members will be trained to ask if they can gather more of their inventory off of their company website to add to their free showroom. This showroom will be built into our eBay template and provide additional exposure to all of the Dealer’s inventory. In addition, select inventory will be placed in the Truckbay eBay Store, ultimately driving more views, traffic and leads to our existing clients.
From here our proactive Sales Team will research matching equipment from the eBay Motors sold archives to pick out those items they feel will be successful in the eBay Motors auction. A follow-up phone call discussing the research results and reminding them that their listing is already in our database will help close more listings.
Once a new listing has been added to the auction, showrooms and stores, we will download the equipment to the main website. This public website will hold our entire database of classified ads and will have a simple Search Feature on the homepage for visitors to easily find the equipment they are looking for. Once they find matching listings, they will have the ability to view the dealer contact information or save it for future reference and comparison.
Finally, we will start with 10 linked websites that target a smaller niche market within the heavy truck and equipment industry. As we get closer to the launch date, we will research popular keywords and phrases used by our customers when they visit Search Engines. We will use the most common phrases and keywords to create our new domain names. For example, we know that “buy a heavy truck” is a popular search phrase. Therefore, we will make a website designed to help these people buy a heavy truck. There will be standard questions and answers along with links to our other 10 websites directing them to check out these popular websites to buy a truck. This linking process will place our websites in the top positions for many of the most popular Search Engines.
6.2 Development Requirements
Mr. Z will lead our development team throughout the project. The Company has aggressive goals to introduce our product by the beginning of the second quarter in 2005. Therefore, we will have three separate developers working on specific projects. We are currently speaking with a former employee of eBay Motors who is a Master Certified Developer and very familiar with the eBay API. If we reach an agreement, we hope to contract him to develop our most critical and sophisticated integration between the existing website and our new eBay service website.
In addition, we will hire a full time employee with experience as a Web author and designer to build our external websites. Mr. Z will assist in the hiring of this person and be responsible for keeping the project organized and on time. In addition, Mr. Z has HTML experience that will be helpful as we fine-tune each individual website. We have allocated three months of development time and one month of debugging.
Cab will be responsible for providing Mr. Z with the keyword and phrase market research so he can secure the appropriate Web domains and Search Engine Ad words. Phase two of our development plan includes continuing to build affiliate linked websites and enhancing the functionality and appearance of our existing network of sites.
Our websites will be hosted externally at a hurricane-protected server facility in Miami, Florida. Z will monitor this relationship to ensure our needs are met and company protected.
Management Summary
Truckbay is fortunate to have numerous consulting partners that will compliment any holes we may have in our Management team. Three of the four partners have owned and operate highly successful corporations that have achieved tremendous growth and returns for their investors. More importantly, Mr. Y and Mr. Z have been successful in building and running a similar business to the one proposed in this plan.
Specifically, the Management Team will consist of the following people and their areas of expertise:
- Cab Trucker – President of Company focusing on Operations, Sales, Marketing and Advertising
- Mr. Y – Management Advisor focusing on Legal, Operations and Sales
- Mr. Z – Technical Advisor focusing on IT, Hosting and all things technical
- John Speed – Entrepreneurial Consultant
- Barry Stir – Legal Advisor
7.1 Personnel Plan
Truckbay plans to employ one full-time Web developer, one part-time Web developer/programmer, and 8-10 draw/commissioned salespeople. The full-time Web Developer will receive a salary of $78,000 per year; the part-time Web developer (25-30 hours/week) will receive a salary of $30,000 – $35,000. Both will receive a performance bonus that falls in line with the Company’s performance.
Truckbay is a sales organization, thus the base + commission compensation structure. In today’s employment market, the Company must provide employees access to additional benefits to attract the best candidates. Truckbay will offer all employees:
- Health care insurance
- Dental care insurance
- Vacation time
- Up-sell incentive programs
- 401k retirement plans
Premiums for these items are included in the base salaries listed in the Personnel table.
The staff will consist of ten employees (plus the president) working from 8AM – 5PM. Eight Salespeople and two Web Developers will need an office space of approximately 2,400 square feet consisting of three offices, a conference room and a large open area with ten cubicles. We will rotate two team members each week to work a 10AM – 7PM shift in order to support our West Coast customers.
| Personnel Plan | |||
| 2005 | 2006 | 2007 | |
| Sales Team Personnel | |||
| Base salary | $127,500 | $127,500 | $127,500 |
| Bonuses | $5,800 | $12,800 | $12,800 |
| Commission on standard listing | $68,058 | $125,150 | $162,200 |
| Commission on Dealer Single Listing | $470 | $600 | $600 |
| Commission on Full-service Dealer Listing | $2,100 | $4,000 | $4,000 |
| Subtotal | $203,928 | $270,050 | $307,100 |
| Development Personnel | |||
| Web Developer 1 | $78,000 | $78,000 | $78,000 |
| Assistant Web Developer | $30,000 | $35,000 | $35,000 |
| Developer Bonus | $0 | $0 | $0 |
| Subtotal | $108,000 | $113,000 | $113,000 |
| General and Administrative Personnel | |||
| President | $60,000 | $60,000 | $60,000 |
| Name or Title or Group | $0 | $0 | $0 |
| Name or Title or Group | $0 | $0 | $0 |
| Subtotal | $60,000 | $60,000 | $60,000 |
| Other Personnel | |||
| Name or Title or Group | $0 | $0 | $0 |
| Name or Title or Group | $0 | $0 | $0 |
| Name or Title or Group | $0 | $0 | $0 |
| Subtotal | $0 | $0 | $0 |
| Total People | 0 | 0 | 0 |
| Total Payroll | $371,928 | $443,050 | $480,100 |
Financial Plan
The business of Truckbay does not require substantial outlays for inventory and all sales are on a cash basis, so increases in sales will not be accompanied by initial cash-flow deficits. Once the new listing services are put in place, we expect rapid growth through aggressive, proactive selling by our commissioned sales team. Our financial plan is dependent upon a major change in focus and marketing, to switch from a dealer-based network to a retail one. It also relies on increasing our accessibility with a network of 10 related websites, all driving traffic to the main paid listings. With the advice of Mr. Y and Mr. X, we are confident that we can turn around the financial history of the company, to create a very profitable business. The financial projections are as follows.
8.1 Valuation
We understand that an investor’s concern is to recoup his investment with a high profit in a short period of time. Based on the experience of Company X, and with the help of its founders, we conservatively estimate an earnings-based valuation of $5,500,000 for Truckbay in 2007. For an investor contributing $475,000 now, that works out to an ending valuation of $1,043,000, with an IRR of 109%. This valuation is based on an exit strategy of selling the company within 3-5 years to a related corporation (such as eBay). Details of the Investment Analysis can be found below.
| Investment Analysis | ||||
| Start | 2005 | 2006 | 2007 | |
| Initial Investment | ||||
| Investment | $0 | $475,000 | $0 | $0 |
| Dividends | $0 | $0 | $300,000 | $300,000 |
| Ending Valuation | $0 | $0 | $0 | $1,138,100 |
| Combination as Income Stream | $0 | ($475,000) | $300,000 | $1,438,100 |
| Percent Equity Acquired | 19% | |||
| Net Present Value (NPV) | $815,074 | |||
| Internal Rate of Return (IRR) | 108% | |||
| Assumptions | ||||
| Discount Rate | 10.00% | |||
| Valuation Earnings Multiple | 10 | 10 | 10 | |
| Valuation Sales Multiple | 2 | 2 | 2 | |
| Investment (calculated) | $55,000 | $475,000 | $0 | $0 |
| Dividends | $0 | $300,000 | $300,000 | |
| Calculated Earnings-based Valuation | $1,820,000 | $4,360,000 | $5,990,000 | |
| Calculated Sales-based Valuation | $1,650,000 | $2,580,000 | $3,320,000 | |
| Calculated Average Valuation | $1,735,000 | $3,470,000 | $4,655,000 | |
8.2 Important Assumptions
NOTES FOR PROJECTIONS
All sales projections/assumptions are based on historical data referenced from the first three years of Company X.
Other Assumptions:
- We can find adequate office space to rent below $11 per square foot – full service in the Atlanta market.
- We can recruit a highly skilled Web Developer for $78,000 salary plus bonus incentives.
- The website development is completed by March 1, 2005.
- Truckbay’s success will be based on the participation level of Mr. Y and Mr. Z.

| General Assumptions | |||
| 2005 | 2006 | 2007 | |
| Plan Month | 1 | 2 | 3 |
| Current Interest Rate | 10.00% | 10.00% | 10.00% |
| Long-term Interest Rate | 10.00% | 10.00% | 10.00% |
| Tax Rate | 30.00% | 30.00% | 30.00% |
| Other | 0 | 0 | 0 |
8.3 Break-even Analysis
The following table shows the break-even analysis for Truckbay’s new websites and sales strategy. The table shows that we need to sell roughly $29,000 of listings each month to break even in the next year. Truckbay will reach its break-even point in April.

| Break-even Analysis | |
| Monthly Revenue Break-even | $23,478 |
| Assumptions: | |
| Average Percent Variable Cost | 15% |
| Estimated Monthly Fixed Cost | $20,063 |
8.4 Projected Profit and Loss
The following table and charts shows our projected Profit and Loss for the next three years. Monthly details can be found in the Appendix. Our sales team salaries are counted as part of our direct cost of sales, for the purpose of calculating our gross margin.


| Pro Forma Profit and Loss | |||
| 2005 | 2006 | 2007 | |
| Sales | $824,870 | $1,291,500 | $1,662,000 |
| Direct Cost of Sales | $120,000 | $150,000 | $250,000 |
| Sales Team Payroll | $203,928 | $270,050 | $307,100 |
| Other Costs of Sales | $0 | $0 | $0 |
| Total Cost of Sales | $323,928 | $420,050 | $557,100 |
| Gross Margin | $500,942 | $871,450 | $1,104,900 |
| Gross Margin % | 60.73% | 67.48% | 66.48% |
| Operating Expenses | |||
| Development Expenses | |||
| Development Payroll | $108,000 | $113,000 | $113,000 |
| Training | $4,000 | $6,000 | $6,000 |
| Other Development Expenses | $0 | $0 | $0 |
| Total Development Expenses | $112,000 | $119,000 | $119,000 |
| Development % | 13.58% | 9.21% | 7.16% |
| General and Administrative Expenses | |||
| General and Administrative Payroll | $60,000 | $60,000 | $60,000 |
| Marketing/Promotion | $5,000 | $5,000 | $5,000 |
| Depreciation | $2,400 | $2,400 | $2,400 |
| Rent | $19,200 | $19,200 | $19,200 |
| Utilities | $6,000 | $6,000 | $6,000 |
| Insurance | $3,000 | $3,000 | $3,000 |
| Payroll Taxes | $0 | $0 | $0 |
| Other | $12,000 | $12,000 | $12,000 |
| Total General and Administrative Expenses | $107,600 | $107,600 | $107,600 |
| General and Administrative % | 13.04% | 8.33% | 6.47% |
| Other Expenses: | |||
| Other Payroll | $0 | $0 | $0 |
| Meals and Entertainment | $4,000 | $6,000 | $6,000 |
| Trade Shows and Association Dues | $4,000 | $4,000 | $4,000 |
| Subscriptions | $150 | $150 | $150 |
| Business Travel | $13,000 | $12,000 | $12,000 |
| Total Other Expenses | $21,150 | $22,150 | $22,150 |
| Other % | 2.56% | 1.72% | 1.33% |
| Total Operating Expenses | $240,750 | $248,750 | $248,750 |
| Profit Before Interest and Taxes | $260,191 | $622,700 | $856,150 |
| EBITDA | $262,591 | $625,100 | $858,550 |
| Interest Expense | $510 | $175 | $0 |
| Taxes Incurred | $77,904 | $186,757 | $256,845 |
| Net Profit | $181,777 | $435,768 | $599,305 |
| Net Profit/Sales | 22.04% | 33.74% | 36.06% |
8.5 Projected Cash Flow
The cash flow projection shows that provisions for ongoing expenses are adequate to meet the needs of the company as the business generates sufficient cash flow to support operations. We will collect all fees up front from our customers and pay commissions at the end of each month.

| Pro Forma Cash Flow | |||
| 2005 | 2006 | 2007 | |
| Cash Received | |||
| Cash from Operations | |||
| Cash Sales | $824,870 | $1,291,500 | $1,662,000 |
| Subtotal Cash from Operations | $824,870 | $1,291,500 | $1,662,000 |
| Additional Cash Received | |||
| Sales Tax, VAT, HST/GST Received | $0 | $0 | $0 |
| New Current Borrowing | $0 | $0 | $0 |
| New Other Liabilities (interest-free) | $0 | $0 | $0 |
| New Long-term Liabilities | $0 | $0 | $0 |
| Sales of Other Current Assets | $0 | $0 | $0 |
| Sales of Long-term Assets | $0 | $0 | $0 |
| New Investment Received | $475,000 | $0 | $0 |
| Subtotal Cash Received | $1,299,870 | $1,291,500 | $1,662,000 |
| Expenditures | 2005 | 2006 | 2007 |
| Expenditures from Operations | |||
| Cash Spending | $371,928 | $443,050 | $480,100 |
| Bill Payments | $240,028 | $405,298 | $566,230 |
| Subtotal Spent on Operations | $611,956 | $848,348 | $1,046,330 |
| Additional Cash Spent | |||
| Sales Tax, VAT, HST/GST Paid Out | $0 | $0 | $0 |
| Principal Repayment of Current Borrowing | $3,500 | $3,500 | $0 |
| Other Liabilities Principal Repayment | $0 | $0 | $0 |
| Long-term Liabilities Principal Repayment | $0 | $0 | $0 |
| Purchase Other Current Assets | $10,000 | $0 | $0 |
| Purchase Long-term Assets | $0 | $0 | $0 |
| Dividends | $0 | $300,000 | $300,000 |
| Subtotal Cash Spent | $625,456 | $1,151,848 | $1,346,330 |
| Net Cash Flow | $674,414 | $139,652 | $315,670 |
| Cash Balance | $678,414 | $818,066 | $1,133,737 |
8.6 Projected Balance Sheet
The following table shows our projected Balance Sheet. We plan to repay our current credit card debt within two years. With the help help of Company X’s founders, we should increase the net worth of the business significantly over the next three years.
| Pro Forma Balance Sheet | |||
| 2005 | 2006 | 2007 | |
| Assets | |||
| Current Assets | |||
| Cash | $678,414 | $818,066 | $1,133,737 |
| Other Current Assets | $10,001 | $10,001 | $10,001 |
| Total Current Assets | $688,415 | $828,067 | $1,143,738 |
| Long-term Assets | |||
| Long-term Assets | $26,000 | $26,000 | $26,000 |
| Accumulated Depreciation | $13,400 | $15,800 | $18,200 |
| Total Long-term Assets | $12,600 | $10,200 | $7,800 |
| Total Assets | $701,015 | $838,267 | $1,151,538 |
| Liabilities and Capital | 2005 | 2006 | 2007 |
| Current Liabilities | |||
| Accounts Payable | $28,737 | $33,722 | $47,687 |
| Current Borrowing | $3,500 | $0 | $0 |
| Other Current Liabilities | $0 | $0 | $0 |
| Subtotal Current Liabilities | $32,237 | $33,722 | $47,687 |
| Long-term Liabilities | $0 | $0 | $0 |
| Total Liabilities | $32,237 | $33,722 | $47,687 |
| Paid-in Capital | $530,000 | $530,000 | $530,000 |
| Retained Earnings | ($42,999) | ($161,222) | ($25,455) |
| Earnings | $181,777 | $435,768 | $599,305 |
| Total Capital | $668,778 | $804,545 | $1,103,850 |
| Total Liabilities and Capital | $701,015 | $838,267 | $1,151,538 |
| Net Worth | $668,778 | $804,545 | $1,103,850 |
8.7 Business Ratios
Truckbay’s ratios can be seen in the table below. For comparison, we have included standard business ratios for the Electronic media advertising representatives industry, SIC Code 7313.01.
| Ratio Analysis | ||||
| 2005 | 2006 | 2007 | Industry Profile | |
| Sales Growth | 1818.30% | 56.57% | 28.69% | 2.79% |
| Percent of Total Assets | ||||
| Other Current Assets | 1.43% | 1.19% | 0.87% | 42.87% |
| Total Current Assets | 98.20% | 98.78% | 99.32% | 78.45% |
| Long-term Assets | 1.80% | 1.22% | 0.68% | 21.55% |
| Total Assets | 100.00% | 100.00% | 100.00% | 100.00% |
| Current Liabilities | 4.60% | 4.02% | 4.14% | 34.05% |
| Long-term Liabilities | 0.00% | 0.00% | 0.00% | 5.29% |
| Total Liabilities | 4.60% | 4.02% | 4.14% | 39.34% |
| Net Worth | 95.40% | 95.98% | 95.86% | 60.66% |
| Percent of Sales | ||||
| Sales | 100.00% | 100.00% | 100.00% | 100.00% |
| Gross Margin | 60.73% | 67.48% | 66.48% | 100.00% |
| Selling, General & Administrative Expenses | 38.69% | 33.73% | 30.42% | 77.34% |
| Advertising Expenses | 0.29% | 0.19% | 0.14% | 5.22% |
| Profit Before Interest and Taxes | 31.54% | 48.22% | 51.51% | 3.09% |
| Main Ratios | ||||
| Current | 21.35 | 24.56 | 23.98 | 1.94 |
| Quick | 21.35 | 24.56 | 23.98 | 1.52 |
| Total Debt to Total Assets | 4.60% | 4.02% | 4.14% | 44.15% |
| Pre-tax Return on Net Worth | 38.83% | 77.38% | 77.56% | 11.73% |
| Pre-tax Return on Assets | 37.04% | 74.26% | 74.35% | 21.00% |
| Additional Ratios | 2005 | 2006 | 2007 | |
| Net Profit Margin | 22.04% | 33.74% | 36.06% | n.a |
| Return on Equity | 27.18% | 54.16% | 54.29% | n.a |
| Activity Ratios | ||||
| Accounts Payable Turnover | 9.35 | 12.17 | 12.17 | n.a |
| Payment Days | 27 | 28 | 26 | n.a |
| Total Asset Turnover | 1.18 | 1.54 | 1.44 | n.a |
| Debt Ratios | ||||
| Debt to Net Worth | 0.05 | 0.04 | 0.04 | n.a |
| Current Liab. to Liab. | 1.00 | 1.00 | 1.00 | n.a |
| Liquidity Ratios | ||||
| Net Working Capital | $656,178 | $794,345 | $1,096,050 | n.a |
| Interest Coverage | 509.95 | 3,558.29 | 0.00 | n.a |
| Additional Ratios | ||||
| Assets to Sales | 0.85 | 0.65 | 0.69 | n.a |
| Current Debt/Total Assets | 5% | 4% | 4% | n.a |
| Acid Test | 21.35 | 24.56 | 23.98 | n.a |
| Sales/Net Worth | 1.23 | 1.61 | 1.51 | n.a |
| Dividend Payout | 0.00 | 0.69 | 0.50 | n.a |
Appendix
| Sales Forecast | |||||||||||||
| Jan | Feb | Mar | Apr | May | Jun | Jul | Aug | Sep | Oct | Nov | Dec | ||
| Sales | |||||||||||||
| eBay Motors Single Listing | 0% | $0 | $0 | $16,000 | $32,000 | $48,000 | $64,000 | $80,000 | $80,000 | $80,000 | $80,000 | $80,000 | $80,000 |
| eBay Motors Unlimited Listings | 0% | $80 | $500 | $2,500 | $5,000 | $7,500 | $10,000 | $12,500 | $15,000 | $17,500 | $20,000 | $22,500 | $25,000 |
| Affiliate Buyer’s Assistance Programs | 0% | $0 | $0 | $250 | $300 | $360 | $432 | $518 | $622 | $746 | $896 | $1,075 | $1,290 |
| Buyer Assistant Partnerships | 0% | $0 | $0 | $100 | $200 | $300 | $500 | $500 | $500 | $500 | $500 | $500 | $500 |
| Co-op Advertising | 0% | $0 | $0 | $0 | $0 | $0 | $0 | $250 | $250 | $250 | $250 | $250 | $250 |
| Dealers Single Listing | 0% | $0 | $0 | $300 | $400 | $500 | $500 | $500 | $500 | $500 | $500 | $500 | $500 |
| Dealer Wholesale Membership | 0% | $0 | $0 | $3,000 | $3,000 | $3,000 | $3,000 | $3,000 | $3,000 | $3,000 | $3,000 | $3,000 | $3,000 |
| Total Sales | $80 | $500 | $22,150 | $40,900 | $59,660 | $78,432 | $97,268 | $99,872 | $102,496 | $105,146 | $107,825 | $110,540 | |
| Direct Cost of Sales | Jan | Feb | Mar | Apr | May | Jun | Jul | Aug | Sep | Oct | Nov | Dec | |
| Other | $0 | $0 | $0 | $0 | $0 | $0 | $0 | $0 | $0 | $0 | $0 | $0 | |
| Technology | $10,000 | $10,000 | $10,000 | $10,000 | $10,000 | $10,000 | $10,000 | $10,000 | $10,000 | $10,000 | $10,000 | $10,000 | |
| Subtotal Direct Cost of Sales | $10,000 | $10,000 | $10,000 | $10,000 | $10,000 | $10,000 | $10,000 | $10,000 | $10,000 | $10,000 | $10,000 | $10,000 | |
| Personnel Plan | |||||||||||||
| Jan | Feb | Mar | Apr | May | Jun | Jul | Aug | Sep | Oct | Nov | Dec | ||
| Sales Team Personnel | |||||||||||||
| Base salary | $0 | $0 | $7,500 | $7,500 | $7,500 | $10,000 | $10,000 | $12,500 | $15,000 | $17,500 | $20,000 | $20,000 | |
| Bonuses | 0% | $0 | $0 | $0 | $0 | $0 | $0 | $0 | $0 | $1,200 | $1,400 | $1,600 | $1,600 |
| Commission on standard listing | 10% | $0 | $0 | $0 | $0 | $0 | $7,543 | $9,427 | $9,687 | $9,950 | $10,215 | $10,482 | $10,754 |
| Commission on Dealer Single Listing | 10% | $0 | $0 | $30 | $40 | $50 | $50 | $50 | $50 | $50 | $50 | $50 | $50 |
| Commission on Full-service Dealer Listing | 5% | $0 | $0 | $0 | $0 | $0 | $300 | $300 | $300 | $300 | $300 | $300 | $300 |
| Subtotal | $0 | $0 | $7,530 | $7,540 | $7,550 | $17,893 | $19,777 | $22,537 | $26,500 | $29,465 | $32,432 | $32,704 | |
| Development Personnel | |||||||||||||
| Web Developer 1 | $6,500 | $6,500 | $6,500 | $6,500 | $6,500 | $6,500 | $6,500 | $6,500 | $6,500 | $6,500 | $6,500 | $6,500 | |
| Assistant Web Developer | 0% | $2,500 | $2,500 | $2,500 | $2,500 | $2,500 | $2,500 | $2,500 | $2,500 | $2,500 | $2,500 | $2,500 | $2,500 |
| Developer Bonus | 1% | $0 | $0 | $0 | $0 | $0 | $0 | $0 | $0 | $0 | $0 | $0 | $0 |
| Subtotal | $9,000 | $9,000 | $9,000 | $9,000 | $9,000 | $9,000 | $9,000 | $9,000 | $9,000 | $9,000 | $9,000 | $9,000 | |
| General and Administrative Personnel | |||||||||||||
| President | $5,000 | $5,000 | $5,000 | $5,000 | $5,000 | $5,000 | $5,000 | $5,000 | $5,000 | $5,000 | $5,000 | $5,000 | |
| Name or Title or Group | $0 | $0 | $0 | $0 | $0 | $0 | $0 | $0 | $0 | $0 | $0 | $0 | |
| Name or Title or Group | $0 | $0 | $0 | $0 | $0 | $0 | $0 | $0 | $0 | $0 | $0 | $0 | |
| Subtotal | $5,000 | $5,000 | $5,000 | $5,000 | $5,000 | $5,000 | $5,000 | $5,000 | $5,000 | $5,000 | $5,000 | $5,000 | |
| Other Personnel | |||||||||||||
| Name or Title or Group | $0 | $0 | $0 | $0 | $0 | $0 | $0 | $0 | $0 | $0 | $0 | $0 | |
| Name or Title or Group | $0 | $0 | $0 | $0 | $0 | $0 | $0 | $0 | $0 | $0 | $0 | $0 | |
| Name or Title or Group | $0 | $0 | $0 | $0 | $0 | $0 | $0 | $0 | $0 | $0 | $0 | $0 | |
| Subtotal | $0 | $0 | $0 | $0 | $0 | $0 | $0 | $0 | $0 | $0 | $0 | $0 | |
| Total People | 0 | 0 | 0 | 0 | 0 | 0 | 0 | 0 | 0 | 0 | 0 | 0 | |
| Total Payroll | $14,000 | $14,000 | $21,530 | $21,540 | $21,550 | $31,893 | $33,777 | $36,537 | $40,500 | $43,465 | $46,432 | $46,704 | |
| Pro Forma Profit and Loss | |||||||||||||
| Jan | Feb | Mar | Apr | May | Jun | Jul | Aug | Sep | Oct | Nov | Dec | ||
| Sales | $80 | $500 | $22,150 | $40,900 | $59,660 | $78,432 | $97,268 | $99,872 | $102,496 | $105,146 | $107,825 | $110,540 | |
| Direct Cost of Sales | $10,000 | $10,000 | $10,000 | $10,000 | $10,000 | $10,000 | $10,000 | $10,000 | $10,000 | $10,000 | $10,000 | $10,000 | |
| Sales Team Payroll | $0 | $0 | $7,530 | $7,540 | $7,550 | $17,893 | $19,777 | $22,537 | $26,500 | $29,465 | $32,432 | $32,704 | |
| Other Costs of Sales | $0 | $0 | $0 | $0 | $0 | $0 | $0 | $0 | $0 | $0 | $0 | $0 | |
| Total Cost of Sales | $10,000 | $10,000 | $17,530 | $17,540 | $17,550 | $27,893 | $29,777 | $32,537 | $36,500 | $39,465 | $42,432 | $42,704 | |
| Gross Margin | ($9,920) | ($9,500) | $4,620 | $23,360 | $42,110 | $50,539 | $67,492 | $67,335 | $65,997 | $65,681 | $65,392 | $67,836 | |
| Gross Margin % | -12400.00% | -1900.00% | 20.86% | 57.11% | 70.58% | 64.44% | 69.39% | 67.42% | 64.39% | 62.47% | 60.65% | 61.37% | |
| Operating Expenses | |||||||||||||
| Development Expenses | |||||||||||||
| Development Payroll | $9,000 | $9,000 | $9,000 | $9,000 | $9,000 | $9,000 | $9,000 | $9,000 | $9,000 | $9,000 | $9,000 | $9,000 | |
| Training | $1,500 | $0 | $0 | $0 | $0 | $0 | $2,500 | $0 | $0 | $0 | $0 | $0 | |
| Other Development Expenses | $0 | $0 | $0 | $0 | $0 | $0 | $0 | $0 | $0 | $0 | $0 | $0 | |
| Total Development Expenses | $10,500 | $9,000 | $9,000 | $9,000 | $9,000 | $9,000 | $11,500 | $9,000 | $9,000 | $9,000 | $9,000 | $9,000 | |
| Development % | 13125.00% | 1800.00% | 40.63% | 22.00% | 15.09% | 11.47% | 11.82% | 9.01% | 8.78% | 8.56% | 8.35% | 8.14% | |
| General and Administrative Expenses | |||||||||||||
| General and Administrative Payroll | $5,000 | $5,000 | $5,000 | $5,000 | $5,000 | $5,000 | $5,000 | $5,000 | $5,000 | $5,000 | $5,000 | $5,000 | |
| Marketing/Promotion | $417 | $417 | $417 | $417 | $417 | $417 | $417 | $417 | $417 | $417 | $417 | $417 | |
| Depreciation | $200 | $200 | $200 | $200 | $200 | $200 | $200 | $200 | $200 | $200 | $200 | $200 | |
| Rent | $1,600 | $1,600 | $1,600 | $1,600 | $1,600 | $1,600 | $1,600 | $1,600 | $1,600 | $1,600 | $1,600 | $1,600 | |
| Utilities | $500 | $500 | $500 | $500 | $500 | $500 | $500 | $500 | $500 | $500 | $500 | $500 | |
| Insurance | $250 | $250 | $250 | $250 | $250 | $250 | $250 | $250 | $250 | $250 | $250 | $250 | |
| Payroll Taxes | 15% | $0 | $0 | $0 | $0 | $0 | $0 | $0 | $0 | $0 | $0 | $0 | $0 |
| Other | $1,000 | $1,000 | $1,000 | $1,000 | $1,000 | $1,000 | $1,000 | $1,000 | $1,000 | $1,000 | $1,000 | $1,000 | |
| Total General and Administrative Expenses | $8,967 | $8,967 | $8,967 | $8,967 | $8,967 | $8,967 | $8,967 | $8,967 | $8,967 | $8,967 | $8,967 | $8,967 | |
| General and Administrative % | 11208.75% | 1793.33% | 40.48% | 21.92% | 15.03% | 11.43% | 9.22% | 8.98% | 8.75% | 8.53% | 8.32% | 8.11% | |
| Other Expenses: | |||||||||||||
| Other Payroll | $0 | $0 | $0 | $0 | $0 | $0 | $0 | $0 | $0 | $0 | $0 | $0 | |
| Meals and Entertainment | $0 | $0 | $400 | $400 | $400 | $400 | $400 | $400 | $400 | $400 | $400 | $400 | |
| Trade Shows and Association Dues | $0 | $0 | $0 | $0 | $0 | $1,500 | $0 | $0 | $0 | $0 | $2,500 | $0 | |
| Subscriptions | $150 | $0 | $0 | $0 | $0 | $0 | $0 | $0 | $0 | $0 | $0 | $0 | |
| Business Travel | $1,000 | $1,000 | $2,000 | $1,000 | $1,000 | $1,000 | $1,000 | $1,000 | $1,000 | $1,000 | $1,000 | $1,000 | |
| Total Other Expenses | $1,150 | $1,000 | $2,400 | $1,400 | $1,400 | $2,900 | $1,400 | $1,400 | $1,400 | $1,400 | $3,900 | $1,400 | |
| Other % | 1437.50% | 200.00% | 10.84% | 3.42% | 2.35% | 3.70% | 1.44% | 1.40% | 1.37% | 1.33% | 3.62% | 1.27% | |
| Total Operating Expenses | $20,617 | $18,967 | $20,367 | $19,367 | $19,367 | $20,867 | $21,867 | $19,367 | $19,367 | $19,367 | $21,867 | $19,367 | |
| Profit Before Interest and Taxes | ($30,537) | ($28,467) | ($15,747) | $3,993 | $22,743 | $29,672 | $45,625 | $47,968 | $46,630 | $46,315 | $43,526 | $48,469 | |
| EBITDA | ($30,337) | ($28,267) | ($15,547) | $4,193 | $22,943 | $29,872 | $45,825 | $48,168 | $46,830 | $46,515 | $43,726 | $48,669 | |
| Interest Expense | $56 | $53 | $51 | $49 | $46 | $44 | $41 | $39 | $36 | $34 | $32 | $29 | |
| Taxes Incurred | ($9,178) | ($8,556) | ($4,739) | $1,183 | $6,809 | $8,889 | $13,675 | $14,379 | $13,978 | $13,884 | $13,048 | $14,532 | |
| Net Profit | ($21,415) | ($19,964) | ($11,058) | $2,761 | $15,888 | $20,740 | $31,909 | $33,551 | $32,616 | $32,396 | $30,446 | $33,908 | |
| Net Profit/Sales | -26768.79% | -3992.82% | -49.93% | 6.75% | 26.63% | 26.44% | 32.80% | 33.59% | 31.82% | 30.81% | 28.24% | 30.67% | |
| Pro Forma Cash Flow | |||||||||||||
| Jan | Feb | Mar | Apr | May | Jun | Jul | Aug | Sep | Oct | Nov | Dec | ||
| Cash Received | |||||||||||||
| Cash from Operations | |||||||||||||
| Cash Sales | $80 | $500 | $22,150 | $40,900 | $59,660 | $78,432 | $97,268 | $99,872 | $102,496 | $105,146 | $107,825 | $110,540 | |
| Subtotal Cash from Operations | $80 | $500 | $22,150 | $40,900 | $59,660 | $78,432 | $97,268 | $99,872 | $102,496 | $105,146 | $107,825 | $110,540 | |
| Additional Cash Received | |||||||||||||
| Sales Tax, VAT, HST/GST Received | 0.00% | $0 | $0 | $0 | $0 | $0 | $0 | $0 | $0 | $0 | $0 | $0 | $0 |
| New Current Borrowing | $0 | $0 | $0 | $0 | $0 | $0 | $0 | $0 | $0 | $0 | $0 | $0 | |
| New Other Liabilities (interest-free) | $0 | $0 | $0 | $0 | $0 | $0 | $0 | $0 | $0 | $0 | $0 | $0 | |
| New Long-term Liabilities | $0 | $0 | $0 | $0 | $0 | $0 | $0 | $0 | $0 | $0 | $0 | $0 | |
| Sales of Other Current Assets | $0 | $0 | $0 | $0 | $0 | $0 | $0 | $0 | $0 | $0 | $0 | $0 | |
| Sales of Long-term Assets | $0 | $0 | $0 | $0 | $0 | $0 | $0 | $0 | $0 | $0 | $0 | $0 | |
| New Investment Received | $475,000 | $0 | $0 | $0 | $0 | $0 | $0 | $0 | $0 | $0 | $0 | $0 | |
| Subtotal Cash Received | $475,080 | $500 | $22,150 | $40,900 | $59,660 | $78,432 | $97,268 | $99,872 | $102,496 | $105,146 | $107,825 | $110,540 | |
| Expenditures | Jan | Feb | Mar | Apr | May | Jun | Jul | Aug | Sep | Oct | Nov | Dec | |
| Expenditures from Operations | |||||||||||||
| Cash Spending | $14,000 | $14,000 | $21,530 | $21,540 | $21,550 | $31,893 | $33,777 | $36,537 | $40,500 | $43,465 | $46,432 | $46,704 | |
| Bill Payments | $243 | $7,261 | $6,438 | $11,642 | $16,586 | $22,141 | $25,792 | $31,323 | $29,571 | $29,178 | $29,140 | $30,713 | |
| Subtotal Spent on Operations | $14,243 | $21,261 | $27,968 | $33,182 | $38,136 | $54,034 | $59,569 | $67,860 | $70,071 | $72,643 | $75,573 | $77,417 | |
| Additional Cash Spent | |||||||||||||
| Sales Tax, VAT, HST/GST Paid Out | $0 | $0 | $0 | $0 | $0 | $0 | $0 | $0 | $0 | $0 | $0 | $0 | |
| Principal Repayment of Current Borrowing | $292 | $292 | $292 | $292 | $292 | $292 | $292 | $292 | $292 | $292 | $292 | $288 | |
| Other Liabilities Principal Repayment | $0 | $0 | $0 | $0 | $0 | $0 | $0 | $0 | $0 | $0 | $0 | $0 | |
| Long-term Liabilities Principal Repayment | $0 | $0 | $0 | $0 | $0 | $0 | $0 | $0 | $0 | $0 | $0 | $0 | |
| Purchase Other Current Assets | $0 | $0 | $10,000 | $0 | $0 | $0 | $0 | $0 | $0 | $0 | $0 | $0 | |
| Purchase Long-term Assets | $0 | $0 | $0 | $0 | $0 | $0 | $0 | $0 | $0 | $0 | $0 | $0 | |
| Dividends | $0 | $0 | $0 | $0 | $0 | $0 | $0 | $0 | $0 | $0 | $0 | $0 | |
| Subtotal Cash Spent | $14,535 | $21,553 | $38,260 | $33,474 | $38,428 | $54,326 | $59,861 | $68,152 | $70,363 | $72,935 | $75,865 | $77,705 | |
| Net Cash Flow | $460,545 | ($21,053) | ($16,110) | $7,426 | $21,232 | $24,106 | $37,408 | $31,720 | $32,134 | $32,211 | $31,960 | $32,835 | |
| Cash Balance | $464,545 | $443,492 | $427,382 | $434,808 | $456,040 | $480,145 | $517,553 | $549,273 | $581,407 | $613,618 | $645,578 | $678,414 | |
| Pro Forma Balance Sheet | |||||||||||||
| Jan | Feb | Mar | Apr | May | Jun | Jul | Aug | Sep | Oct | Nov | Dec | ||
| Assets | Starting Balances | ||||||||||||
| Current Assets | |||||||||||||
| Cash | $4,000 | $464,545 | $443,492 | $427,382 | $434,808 | $456,040 | $480,145 | $517,553 | $549,273 | $581,407 | $613,618 | $645,578 | $678,414 |
| Other Current Assets | $1 | $1 | $1 | $10,001 | $10,001 | $10,001 | $10,001 | $10,001 | $10,001 | $10,001 | $10,001 | $10,001 | $10,001 |
| Total Current Assets | $4,001 | $464,546 | $443,493 | $437,383 | $444,809 | $466,041 | $490,146 | $527,554 | $559,274 | $591,408 | $623,619 | $655,579 | $688,415 |
| Long-term Assets | |||||||||||||
| Long-term Assets | $26,000 | $26,000 | $26,000 | $26,000 | $26,000 | $26,000 | $26,000 | $26,000 | $26,000 | $26,000 | $26,000 | $26,000 | $26,000 |
| Accumulated Depreciation | $11,000 | $11,200 | $11,400 | $11,600 | $11,800 | $12,000 | $12,200 | $12,400 | $12,600 | $12,800 | $13,000 | $13,200 | $13,400 |
| Total Long-term Assets | $15,000 | $14,800 | $14,600 | $14,400 | $14,200 | $14,000 | $13,800 | $13,600 | $13,400 | $13,200 | $13,000 | $12,800 | $12,600 |
| Total Assets | $19,001 | $479,346 | $458,093 | $451,783 | $459,009 | $480,041 | $503,946 | $541,154 | $572,674 | $604,608 | $636,619 | $668,379 | $701,015 |
| Liabilities and Capital | Jan | Feb | Mar | Apr | May | Jun | Jul | Aug | Sep | Oct | Nov | Dec | |
| Current Liabilities | |||||||||||||
| Accounts Payable | $0 | $7,052 | $6,055 | $11,096 | $15,852 | $21,288 | $24,746 | $30,337 | $28,598 | $28,209 | $28,115 | $29,722 | $28,737 |
| Current Borrowing | $7,000 | $6,708 | $6,416 | $6,124 | $5,832 | $5,540 | $5,248 | $4,956 | $4,664 | $4,372 | $4,080 | $3,788 | $3,500 |
| Other Current Liabilities | $0 | $0 | $0 | $0 | $0 | $0 | $0 | $0 | $0 | $0 | $0 | $0 | $0 |
| Subtotal Current Liabilities | $7,000 | $13,760 | $12,471 | $17,220 | $21,684 | $26,828 | $29,994 | $35,293 | $33,262 | $32,581 | $32,195 | $33,510 | $32,237 |
| Long-term Liabilities | $0 | $0 | $0 | $0 | $0 | $0 | $0 | $0 | $0 | $0 | $0 | $0 | $0 |
| Total Liabilities | $7,000 | $13,760 | $12,471 | $17,220 | $21,684 | $26,828 | $29,994 | $35,293 | $33,262 | $32,581 | $32,195 | $33,510 | $32,237 |
| Paid-in Capital | $55,000 | $530,000 | $530,000 | $530,000 | $530,000 | $530,000 | $530,000 | $530,000 | $530,000 | $530,000 | $530,000 | $530,000 | $530,000 |
| Retained Earnings | ($25,999) | ($42,999) | ($42,999) | ($42,999) | ($42,999) | ($42,999) | ($42,999) | ($42,999) | ($42,999) | ($42,999) | ($42,999) | ($42,999) | ($42,999) |
| Earnings | ($17,000) | ($21,415) | ($41,379) | ($52,438) | ($49,676) | ($33,788) | ($13,048) | $18,860 | $52,411 | $85,026 | $117,423 | $147,869 | $181,777 |
| Total Capital | $12,001 | $465,586 | $445,622 | $434,563 | $437,325 | $453,213 | $473,953 | $505,861 | $539,412 | $572,027 | $604,424 | $634,870 | $668,778 |
| Total Liabilities and Capital | $19,001 | $479,346 | $458,093 | $451,783 | $459,009 | $480,041 | $503,946 | $541,154 | $572,674 | $604,608 | $636,619 | $668,379 | $701,015 |
| Net Worth | $12,001 | $465,586 | $445,622 | $434,563 | $437,325 | $453,213 | $473,953 | $505,861 | $539,412 | $572,027 | $604,424 | $634,870 | $668,778 |


