
eDocFile
Executive Summary
eDocFile provides electronic filing systems for state courts. Every year, some 90 million cases and 1 billion legal documents move through the US court system. States can’t keep up with the flow of criminal and civil filings, the number of federal court cases continues to rise dramatically year after year, and the courts keep on adding more judges and judicial officers to handle the work.
A surprising amount of the judicial process is not automated, much less integrated. There is a serious need for a cost-effective, integrated digital solution based on available technology. eDocFile proposes a solution capable of transforming the practice of law with an online system that is cost-effective, simple to use, and can be integrated with legacy technology already in use. eDocFile offers much more than simply sending documents back and forth. It is a digital bridge linking the electronic world of the law firm with the electronic world of the court. It’s law firms and courts exchanging and accessing all case data, not just documents.
With E-Filing, courts will be able to access court documents instantly. Instead of having to call archives and ask for a document to be found, copied, and delivered. Judges can simply pull up documents on their PCs. Court documents can be archived electronically, making them easily accessible and saving millions of dollars in the process. Attorneys can look up docket information and schedules over the Internet, pay filing fees, instantly download documents filed with the court, view case documents and exhibits, and even track the work of opposing counsel.
Clearly, efficiency is the biggest benefit to both courts and law firms – efficiency that comes from being able to instantly access information, communicate and transact business from any desktop. eDocFile offers a simple to use yet comprehensive system that facilitates the flow of information from one party to another in an efficient, cost-effective and seamless manner.
If electronic filing is so great, why aren’t we all using it? The answer is that many small projects have been initiated in the United States. Unfortunately, most have either failed, been terminated or are defined as “requirements” projects for future systems. None have delivered a sufficient bottom-line gain to court efficiency to command support for funding the necessary infrastructure.
The primary problems relate to the technology. While many of the components of electronic filing have been available for some time, the lack of standards, difficulty of integration, insufficient training and customer support, and equipment and software costs have been limiting factors. In the last few years, the power of personal computer technology has improved significantly, and costs have declined. Data storage costs have dropped from more than $1,000 per megabyte on early PCs, to less than five cents per megabyte today. This price is dropping about 50 percent each year. Only a few years ago there was no universal communications network, with standard protocols and interfaces, available to link our systems together.
Even today, security and scalability issues on the Internet have not been completely resolved. However, eDocFile, by solving these challenges can make available to courts, both on a national and state level, an integrated e-filing and document management system. At the same time, we will establish brand name recognition, capture significant market share, and generate a sustainable revenue stream that will fund growth and development of new products as we grow from a niche player to the premier legal Internet portal.
1.1 Mission
Our mission is listen to our customers’ requirements in order to fulfill their individual needs. In doing so we will strive to become the leading provider of secure and simple to use electronic filing systems for courts and judicial administrations, using Web technology.
eDocFile is committed to providing small and medium sized court systems with the ability to automate their filing and document management systems through the use of a comprehensive Web based extranet system. Lawyers within these jurisdictions may file documents with the court electronically from the convenience of their private workspace, all the while allowing courts to manage cases and dockets more efficiently and cost effectively. By combining electronic filing and document management in one Web based extranet system, eDocFile provides to clients, both courts and lawyers, the best litigation management system with minimum restrictions on software and hardware constraints, yet the broadest individual choice of technological functionality.
1.2 Objectives
eDocFile objectives will evolve in a three-phase concurrent development cycle.
Learning
Knowing the customer, the product and services offered by the company as well as knowing the competition are imperative for success. Planning, research and development are critical procedures for this cycle. Objectives for this phase are:
- Become experts on the legal market and have a database of competitors, market analysis, and customer needs before beta version of extranet is completed.
- Have beta version completed within three months of capital formation.
- Establish good working relationships with court systems by meeting with their decision-makers and plotting a mutual plan for success based on trust, reliability and service.
- Get commitments for support, services and products by May Year 1 to support the launch of EDocFile in August Year 1.
Earning
Marketing, sales, customer support, execution of action plans and continued learning will ensure eDocFile a market position that will generate earnings and promote growth, both in new customers and new products and services.
- Establishing brand awareness and brand recognition that positions eDocFile as the market leader for safe, simple and reliable Web based electronic filing system between lawyers and courts.
- Many target courts are without a comprehensive computer management system; our easy to use Web based extranet system allows our customers to manage filings and internal document management.
- Market metrics for evaluating market penetration success include, a market presence in the top 15 legal markets in the country, market share, customer satisfaction ratings and click through traffic. eDocFile will strive to double this metrics semi-annually until we reach market dominance.
- Begin generating positive cash flow by the middle of Year 2.
Returning
Balancing long-term sustainability and profitability with short-term necessities and change will the Achilles heel of many Internet companies. Therefore, we believe that with a policy of returning or giving back to the community (employees, customers and shareholders) eDocFile will ensure apportionment of resources without excessive waste and redundancy. Objectives for this cycle are:
- Developing a mission statement which reflects the values of the founders while providing a mandate for culture creation that will attract and retain the best and brightest talent.
- Develop a comprehensive holistic internal structure that is responsive to market demands and rapid change. This model is predicated on the idea of “a continuous learning organization” with the training and marketing functionality binding the entire organization.
- Develop value-added modules that will launch eDocFile from a niche player to the premier legal portal on the Web by 2006. This means creating features that are action oriented, that is, coming up with solutions that get things off customers to do list forever.
A balanced and focused approach of developing products with the customer in mind by enthusiastic and innovative employees will ensure the success of eDocFile, ultimately leading to increased shareholder value.
1.3 Keys to Success
The keys to success in this business are:
Marketing:
- Establishing brand name.
- Creating barriers-to-entry by competitors through the building trust based relations between courts and eDocFile.
- Building credibility.
Simplicity:

- Create a system that is simple to use.
Company Summary
eDocFile develops electronic filing systems to assist the judicial branch of government in increasing efficiency through the use of Web based extranet technology. Our customers are 1) court systems who want to increase efficiency without a loss of security or control, and without large expenditures of time or capital, and 2) lawyers who want convenience and reliability when considering e-filing as an option.
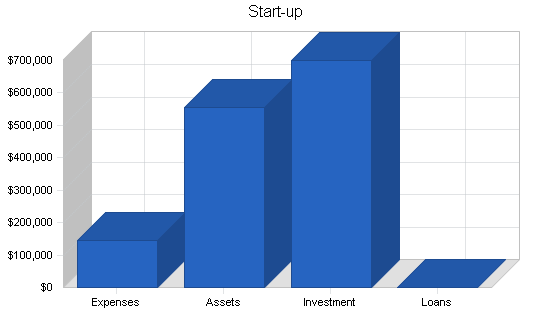
2.1 Start-up Summary
After the beta version is completed, salaries, operating overhead and marketing expenses will kick in. We anticipate this happening in the second half of Year 1. Seed funding will be sought from angel investors.
| Start-up | |
| Requirements | |
| Start-up Expenses | |
| Legal | $4,000 |
| Stationery etc. | $500 |
| Brochures | $2,000 |
| Consultants | $3,000 |
| Insurance | $6,000 |
| Rent | $18,000 |
| Research and Development | $95,000 |
| Expensed Equipment | $15,000 |
| Other | $0 |
| Total Start-up Expenses | $143,500 |
| Start-up Assets | |
| Cash Required | $341,500 |
| Other Current Assets | $215,000 |
| Long-term Assets | $0 |
| Total Assets | $556,500 |
| Total Requirements | $700,000 |
| Start-up Funding | |
| Start-up Expenses to Fund | $143,500 |
| Start-up Assets to Fund | $556,500 |
| Total Funding Required | $700,000 |
| Assets | |
| Non-cash Assets from Start-up | $215,000 |
| Cash Requirements from Start-up | $341,500 |
| Additional Cash Raised | $0 |
| Cash Balance on Starting Date | $341,500 |
| Total Assets | $556,500 |
| Liabilities and Capital | |
| Liabilities | |
| Current Borrowing | $0 |
| Long-term Liabilities | $0 |
| Accounts Payable (Outstanding Bills) | $0 |
| Other Current Liabilities (interest-free) | $0 |
| Total Liabilities | $0 |
| Capital | |
| Planned Investment | |
| Friends and family | $200,000 |
| Angel Investor | $450,000 |
| Government Grant | $50,000 |
| Additional Investment Requirement | $0 |
| Total Planned Investment | $700,000 |
| Loss at Start-up (Start-up Expenses) | ($143,500) |
| Total Capital | $556,500 |
| Total Capital and Liabilities | $556,500 |
| Total Funding | $700,000 |
2.2 Company Ownership
eDocFile is a privately held New York S Corporation, we plan to file for incorporation in the state of Delaware shortly before product launch. Claire Xoe and Brian Sliver, both founders, share ownership equally. As the company increases in size, shares will be distributed among employees.
Services
eDocFile offers the expertise a court needs in order to create an electronic filing system. Our ultimate service would be an automated document management system and hosting relationship with the courts, in which the court only needs a Web browser to log on to an extranet site customized to their needs. eDocFile would also provide high-level retainer consulting, market research reports, or project-based consulting in an effort to bring the courts up to speed with technology and to integrate existing legacy systems.
Secondary services will be focused on lawyers. eDocFile will offer lawyers the ability to use our extranet as an affordable alternative to costly in-house networking and document management. We are confident a focused marketing campaign will convert a significant number of e-filers (lawyers) into long term hosting relationships. This would pave the way for eDocFile to move from a lucrative niche e-filing market to the broader global services market of a legal portal.
An electronic filing project should demonstrate new efficiencies in court administration, and fully leverage investments in computerized back office technology such as case management systems to better serve internal users. Goals should include designing an approach to electronic filing that gives filers the same range of services they have today, but with optional computer-based efficiencies. For instance, eDocFile together with individual courts can expect to work toward the following service goals:
- Provide e-filing/retrieval access to many divisions of law. Ensure security of court back office.
- Utilize advanced architecture and integrate disaster recovery.
- Ensure accurate and timely electronic court fee payment.
- Maintain high availability and accuracy of filing confirmation.
- Require quality support and service.
- Include government agencies needs in development process.
- Develop open standards for electronic filing and retrieval.
- Develop the appropriate pro se e-filing modules and the appropriate exceptions to mandatory e-filing.
- Maintain the high quality of services provided today.
- E-Filing Extranet: Our secure extranet gives courts the ability to manage cases, complex legal documents and processes, internal and external communications, scheduling and calendar services, internal resource management, and integrate existing legacy systems. The extranet will be the primary platform for lawyers to access e-filing features and will become the central repository for all court documents. Revenue will be generated per transaction by lawyers and through hosting agreements with courts.
- Consulting and Training: eDocFile offers consulting and training to courts as they adopt technology enabling the move from their paper system to our electronic system. This begins with a complete understanding of each individual court’s situation; objectives, goals, and constraints. Our solution suggests ways for the court to upgrade in a manner most conducive to individual court’s needs with the least amount of disruption.
- Storage Repository: A central repository makes accessing and customizing judicial information efficient and cost-effective. Initially this would be a per transaction based service. eDocFile will strive to offer this service on a subscription basis, once we have defined the type of information that could be customized by user segments.
3.1 Competitive Comparison
eDocFile products and services include several important features that set them apart from other products and services that may be considered competitive:
Integrated Centrality and Convenience:
- eDocFile offers a simple turnkey solution that only requires an Internet browser. Point and click simplicity and convenience.
- eDocFile makes filing, storing and retrieving convenient and simple by offering a centralized extranet with Web-based capability.
- Value added services such as automatic forwarding of documents to necessary parties, hosting, and central accessing, creates an integrated and seamless repository where searching cases and precedent becomes effortless.
Cost Savings:
- Since the system is designed around an extranet with a Web based interface, the courts would not have to purchase new equipment, hire IT specialists, nor have to constantly upgrade their systems. These systems can be run efficiently on current computers.
- Hardware and software upgrades become obsolete with our Web based hosting model.
- Collateral building costs associated with introducing an IT system will not be necessary.
- Storage costs will decrease with increased use of electronic storage.
- Actual cost of our system when compared with competitors is also lower.
Customized Solutions:
- eDocFile will customize the extranet to fit around the needs of the individual courts and will provide complete training.
- Our open architecture system encourages innovation and adaptation from our clients, and easily integrates with existing legacy systems.
3.2 Sales Literature
eDocFile will begin with a general corporate brochure introducing the company and the products/services offered. This brochure will be developed as part of the start-up expenses. The second phase of our sales cycle will use a CD that contains a short message about the product and will contain a library of resources to support an interest in a sale.
Our sales literature will focus on eDocFile’s ability to customize its services. We will also outline cost versus return, and risk versus benefit. A clear benefit message designed to convince the constituent groups of the value of the technology could be crafted in several parts.
- First, it is necessary to explore the benefits of electronic commerce to the courts, and lawyers using it, the parties involved in cases, and the citizens of the state, and their representatives, who must pay for the system.
- Second, it is important to assess the technology and services that are available for implementation, and the vendors that supply it. In most cases, there are several alternative approaches to implementing electronic filing. Each should be explored with the individual court system.
- Third, it is essential to document the life cycle costs of the specific approach or approaches under consideration. With a complete business case, the court is in a better position to sell the project internally and externally. Our success depends on implementing a customized solution to each jurisdiction.
3.3 Fulfillment
The logic behind eDocFile’s outsourcing, is the ability to take advantage of partners who are industry leaders in core competencies, which are complimentary to eDocFile’s products and services.
- Programming: Immediately we will outsource our programming needs. We will use the services of Array Inc., a company that exports programming to Eastern Europe, thereby taking advantage of exchange rates and local economic conditions. Strategic and proprietary programming will be done in house after a beta version is completed.
- Hosting: US Web/CKS is recognized in the industry as a leader in secure site hosting.
- Security: Will be offered through our relationship with a company called VeriSign, using a public/private key system.
- Monetary Transactions: CyberCash will handle our credit card billing.
- Traffic and Systems Monitoring: Webtrends will monitor usage of the system together with a licensing agreement with Net Perceptions, who will help us develop an intelligent and learning database required for data warehousing.
3.4 Technology
A certain amount of work must be performed whenever information is submitted to the court. The data must be read, analyzed, stored, acted upon and distributed to others. eDocFile achieves these requirements through an extranet using Web based technology. Copyright law protects the software that allows for our extranet functionality and trademark law protects our brand equity.
Components
In general, the court needs a good case management system that can function as an index to documents. A document management system also is necessary. In the real world, most courts cannot afford to manage electronic documents without electronic filing. The paper handling costs are just too high.
Integration of case and document management is necessary. Experience with imaging technology has shown that if the document management system has its own index, then data storage, and possibly data entry, will be duplicated and the systems will never get synchronized.
The electronic filing components that are “behind the scenes” are essential. Though there are other options, this is typically a server (server hardware and server software), or group of servers, inside and outside of the court security firewall that accepts and does initial processing of the documents. The other critical component is the network connection to the outside world. This can be a private network or regular phone lines with dialup modems, but the Internet has become a superior choice in almost every circumstance. A user interface with a World Wide Web browser makes the entire system user friendly.
Our extranet will be the primary platform to offer these services. Functionality for e-filing will be designed and programmed in-house, integration between eDocFile and other software vendors will be accomplished through a collaborative effort between eDocFile and these vendors.
3.5 Future Services
The Internet seems to reinvent itself quickly. Our strategy for future development is to remain positioned with enough flexibility to adapt new technologies, and adapt to changes quickly.
In the future, eDocFile will broaden its product and service base by adding more functionality to our clients needs by developing modules specific to each client. These modules will be developed from eDocFile’s insights into trends within e-commerce as it relates to the legal profession and from the unique challenges faced by our clients. Repackaging these solutions would lead to more value added services for our customers. Best practice techniques learned from monitoring our database and usage patterns can be redistributed proactively to our customers at no charge to them and with little effort on our part, leading to greater usage of the system.
Our long-term goal is to create a legal portal to the Web, thereby, broadening our services and allowing access to more end-users. A portal business model will be successful by creating alliances and partnerships with other Internet service and content providers. The transactional revenue generated from e-filing would make the company cash rich in a relatively short span of time and will fund expansion, leading eDocFile to become the gateway to the Internet for the legal profession.
Market Analysis Summary
Our most important group of potential customers are the courts. Judges and administrators will be the focus of our marketing efforts. They do not want to waste their time or risk their money evaluating many products, services, or systems but realize that they have to adapt to the changing times. Knowing this, eDocFile has to create a targeted and focused plan to address the needs of the court.
Statistics provided by the National Center for State Courts show a growing trend in court filings: in 1999 there were 86,091,501 criminal and civil filings in state courts, 87,792,486 in 1997, and 89,409,300 in 1998. It is clear that judges and administrators must do something to make this process efficient and effective. The market for electronic filing is in its infant stages. Currently, there are a few test markets with no dominant market players.
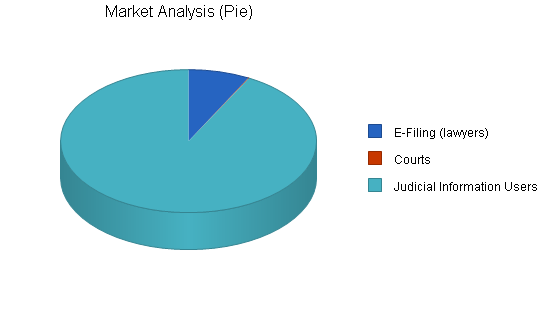
4.1 Market Segmentation
eDocFile has identified three distinct segments, the courts, lawyers and judicial information users.
The Courts
Courts realize they have to adopt some form of e-filing system to become efficient and effective. Yet these costs are very high and adoption rates are slow. When implementing and maintaining such a system is staff needs training in the new system and if the system is based on hardware requirements, then an IT department has to be created, further adding to costs. A building may need to be rewired to accommodate the new system. Each of these considerations adds to the coast of most e-filing systems. In comparison, eDocFile, is inexpensive and much more responsive to the changing needs of the courts, both in the short term and long term.
- Access is only a browser click away.
- Using the product requires minimal training and no need for an in house IT department.
- The integrity of the physical building does not have to be altered to use the system other than more phones or cable lines being installed.
- Upgrades and maintenance are automatic, while hosting allows the court to access any information quickly and efficiently.
- Paper and physical storage costs will not be eliminated but may be reduced significantly.
Lawyers
Lawyers will use the system at first on a transactional basis and will become a captive market as courts adopt the system. We will offer lawyers additional services as more of them start using the system. As we move toward becoming a legal portal, integrated value-added solutions targeted at specific segments within this group will command premium prices. Our turnkey extranet solution also allows small to medium law firms to compete on technology without developing an internal IT infrastructure. Lawyers will benefit from our hosting and document management solution because they would not have to become experts in networking, connectivity or specialized software. They can focus on the practice of law with confidence that their technology needs are met. eDocFile is a simple choice for lawyers who want to compete in the electronic age.
Judicial Information Users
Judicial information is used daily by a number of professional services. For example, real estate professionals, credit reporting agencies, employers and temp agencies, schools, and lawyers are all users. With rapid advances in connectivity these markets may grow to include private citizens who want to check their public profiles. While this segment is not the primary focus of eDocFile’s current business plan, we foresee it playing a substantial role in the future as we integrate more content from other sources of public information and can customize it to suit individual needs.
| Market Analysis | |||||||
| Year 1 | Year 2 | Year 3 | Year 4 | Year 5 | |||
| Potential Customers | Growth | CAGR | |||||
| E-Filing (lawyers) | 2% | 1,250,000 | 1,275,000 | 1,300,500 | 1,326,510 | 1,353,040 | 2.00% |
| Courts | 2% | 17,000 | 17,340 | 17,687 | 18,041 | 18,402 | 2.00% |
| Judicial Information Users | 6% | 15,000,000 | 15,900,000 | 16,854,000 | 17,865,240 | 18,937,154 | 6.00% |
| Total | 5.70% | 16,267,000 | 17,192,340 | 18,172,187 | 19,209,791 | 20,308,596 | 5.70% |
4.2 Service Business Analysis
Electronic filing has been defined as “… the process of transmitting documents and other court information to the court through an electronic medium, rather than on paper. E-filing is in its infancy.
There are many brand name companies entering the industry. However, these companies have existing products, which they are trying to use in order to leverage the e-filing market. We believe this strategy will fail because it locks the courts into proprietary standards. Further, these companies charge high prices for their technology.
Electronic filing lets people get more of their work done with their PCs, send and receive documents, pay filing fees, notify other parties, receive court notices and retrieve court information.
Impact? Significant! More than 89 million civil and criminal cases are filed annually in State courts, and more than 17 million Federal district and bankruptcy cases. Over 100 million filings are made each year.
Contrast the definition of electronic court filing above with how court filing is accomplished today. Their clients reimburse Law firms for costs associated with preparing the document for filing, delivering the document to the court, and getting a confirmation that the document was received.
Market research indicates that US consumers of legal services (individuals and businesses) reimburse attorneys an average of $35 per delivery event (messengers, mail, overnight and rush deliveries).
Moreover, more than 80 percent of all lawyers often “rush” delivery , which frequently can add another 22 percent to the cost. When successfully implemented, electronic filing can reduce these costs, perhaps as much as 75 percent.
At the courthouse, the cost savings can be even more dramatic. Recently, a Kansas court compared filing materials electronically and traditionally. To file 100 documents traditionally took more than 10 hours to process and roughly $220 in staff time. But to file the same documents electronically took 9 minutes and cost a mere $2.80. With more than 17,000 state courts, the savings to taxpayers quickly add up.
Most importantly, roughly 98 percent of all law firms have all the equipment they need on their desks today. There is no need to purchase new equipment or software.
The majority of U.S. courts have yet to purchase modern court management systems or document management systems. Electronic filing requires these two systems be in place to work. Competitors are legacy vendors who already provide courts or lawyers with existing hardware or software technology; we combine case management software with Internet communication software and host the solution on an extranet.
4.2.1 Distributing a Service
E-filing markets are going to be won mainly by word-of-mouth recommendations. eDocFile will recruit all of its consultants from the ranks of judges and lawyers and pairing these consultants with IT professionals. These teams will be responsible for building and cultivating relationships with the court systems, and for spreading the gospel of eDocFile. Primary distribution channels will be through the Internet itself. Our branding and positioning together with a focused marketing campaign will create a “drive to the Web” philosophy. This strategy is consistent and mutually reinforcing with both our product and our company culture.
4.2.2 Competition and Buying Patterns
We believe clients place a lot of trust in professional reputation and reliability of brand name. Therefore, our strategy is to hire exclusively from the ranks of legal professionals. Also, creating a company culture that prizes innovation, quality, excellence, and customer service as our cornerstones will help support and justify the customers’ confidence in our company, conveying value to our brand identity.
The market is price sensitive because budgets are determined by committees external to the courts, and often have to wait in line for funding IT projects or in some instances have to wait for the next budgetary cycle; for example, New York has a two-year budget cycle. Current competitors are capitalizing on market demand for this new service capability and are charging premium prices. On price, eDocFile will be the market leader, our strategy is to encourage adoption and secure a large market share and develop brand name recognition.
Bandwidth will become crucial to future products as we introduce multimedia features to the litigation process. Great strides in bandwidth are currently being made and we are developing relationships with telecommunication companies to look at partnering so that we can offer a complete solution to both courts and lawyers.
We believe that eDocFile will become a leader in electronic filing, by maintaining low prices, professional service, and capturing significant market share. This success will propel eDocFile to position itself as the premier portal for the legal community.
4.2.3 Main Competitors
Brand Name Companies
Strengths: High consumer confidence and trust. Enviable reputations, which make purchase of products an easy decision for a manager, despite the very high prices. Have understanding of general legal profession and access to the e-filing market through existing relationships. Have huge financial resources to flood market with their proprietary standards.
Weakness: General legal knowledge doesn’t substitute for this specific market channel. The rapidly changing Internet often outpaces the adaptation curves of large companies. Also, these company’s fees are extremely expensive, and would be an obstacle to all but the large court systems. Using existing products will be a hurdle to overcome, since it is based on the cookie cutter mentality, one solution fits all courts.
4.2.4 Business Participants
No dominant players currently exist as most products are still in the test phase. While there are some corporate giants entering the market, no one can claim to have significant market share. Most companies are in their beta-testing phase. The distinctions between the product and information services we offer are implicit in the simplicity of use and is a web based turnkey solution. We do not have existing products that we are trying to preserve as we enter the market, therefore customization and flexibility are easily achieved.
Our initial targets are small to medium courts: large courts, which are the traditional target markets of the brand name companies, will become a secondary focus. eDocFile is adopting a “seize” strategy, that is, we will focus on the smaller courts that surround the large courts systems, building on our successes. These victories, and simplicity coupled with the cost effectiveness of our solution will eventually attract larger courts. Functioning in the shadow of the behemoths while we are building brand name recognition, establishing trust relationships and capturing market share will insulate us in the embryonic phases of growth.
Our cost advantage is greater so we do not have to compete for high margin contracts to be successful. In beta testing, Justicelink charged the courts of Prince George’s County, Maryland $25,000 to install their system. Software for subscribing lawyers cost $175 to $200 per workstation. Lawyers also pay $15 per filing and $0.50 per minute for on-line time to query the court’s case management database information. Our installation costs are free to the court systems and per transaction costs to lawyers are only $10 with no per minute charges for any queries. We designed this pricing structure to mimic utility pricing models and to encourage usage and adoption among courts. As courts use our system and store data, eDocFile will enjoy a revenue stream from hosting charges, which will run them about 10 cents a megabyte. The hosting arrangement also creates huge barriers to entry driving up changeover costs.
Strategy and Implementation Summary
eDocFile will focus on the court system. Adoption by the courts will lead to compliance of lawyers within a jurisdiction. Thus capturing one market segment will create a captive market segment of lawyers. Our primary focus will be on small to medium courts, however, discussions with New York Judicial Information Network (NYJIN) suggest that we may be able to capture the entire New York court system at one time.
5.1 Marketing Strategy
Positioning and branding will be key in establishing eDocFile as the e-filing leader for the legal profession. This will be achieved through a focused and targeted marketing communications plan. eDocFile will focus on the courts through a direct sales campaign aimed at building relationships and trust with potential clients. The second phase of our marketing is to a “drive to the Web” strategy that is designed to automate sales. Though this part of the process is automated, eDocFile will maintain a one-to-one service model and a mass customization product model.
5.1.1 Promotion Strategy
Press releases will target influential writers within the legal technology industry and allowing them to test the product, as a way to generate interest would be a primary strategy of our PR campaign. Getting this kind of free press will generate widespread industry interest. Trade shows will become our forum to display and demonstrate our product to the legal community. Brochures, articles and CD’s would form our literature package to send to clients.
5.1.2 Pricing Strategy
eDocFile will adopt a utility based pricing model for the extranet services; that is, a court system will be charged storage on the system plus a hosting fee (10 cents a megabyte). Lawyers will be charged a nominal $10 transaction fee per filing. This fee pays for the automation process of checking the document for compliance with the court and will transmit an electronic receipt for the lawyer’s records if successful or a receipt with reasons why the filing is not successful. When accepted the filing would be automated into the court system notifying all the concerned parties. Lawyers may also opt for a hosting model if they want to automate their case management systems through our extranet. This relationship will not negate the e-filing transaction cost.
Reselling judicial information would carry a transaction fee but would not become a revenue producing activity until we have established ourselves as a market leader. At that point we will look toward cultivating that market.
At the outset we will not charge our customers a sign-up fee, but future-pricing models will look to defray acquisition costs through such a fee. Our pricing model is designed to encourage usage and adoption among the courts.
5.2 Sales Strategy
Direct sales is the only way for us to build trust and credibility. Emphasis will be on developing pilot programs with courts. Once this credibility building phase is done eDocFile will move toward an automated “drive to the Web” model. This will bring down acquisition costs significantly and allow the company to benefit from economies of scope and scale.
5.2.1 Sales Programs
The philosophy of the company toward sales is that every employee is a member of the sales team and will be educated in the nuances of selling the product. Functional sales teams will be comprised of a legal professional and a technical professional, together these teams will function as consultants to courts. An inside sales team will compile information about customers while working closely with the marketing group. As we grow, sales teams will become responsible for geographical areas.
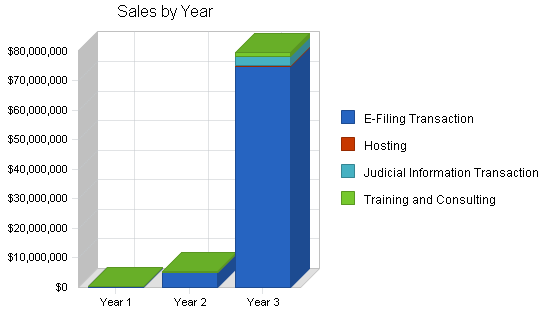
5.2.2 Sales Forecast
Sales will be slow at first but grow exponentially once eDocFile has established credibility in the legal community. Growth will depend on enrolling courts in eDocFile’s centralized Web-based system. Once the beta version is completed hiring a sales and marketing force would become our primary activity. Training, motivating and retaining a well-informed and zealous team will greatly enhance the success of the company.

| Sales Forecast | |||
| Year 1 | Year 2 | Year 3 | |
| Sales | |||
| E-Filing Transaction | $370,946 | $5,001,520 | $75,022,801 |
| Hosting | $1,391 | $23,448 | $351,713 |
| Judicial Information Transactions | $14,463 | $194,998 | $2,924,973 |
| Training and Consulting | $67,027 | $225,933 | $1,412,081 |
| Total Sales | $453,826 | $5,445,899 | $79,711,568 |
| Direct Cost of Sales | Year 1 | Year 2 | Year 3 |
| E-Filing Transaction | $37,095 | $500,152 | $7,502,280 |
| Hosting | $139 | $2,345 | $35,171 |
| Judicial Information Transactions | $2,169 | $29,250 | $438,746 |
| Training and Consulting | $50,270 | $169,450 | $1,059,061 |
| Subtotal Direct Cost of Sales | $89,673 | $701,196 | $9,035,258 |
5.3 Milestones
Milestones are fluid and adaptable to market and economic changes. As we add staff, responsibilities will be shifted to appropriate managers and functional areas.

| Milestones | |||||
| Milestone | Start Date | End Date | Budget | Manager | Department |
| Incorporation | 1/1/2004 | 1/31/2004 | $0 | Brian | Business Development |
| Business Plan | 1/1/2004 | 1/31/2004 | $0 | Claire | Business Development |
| Capital Formation Strategy | 1/1/2004 | 1/31/2004 | $0 | Brian/ Claire | Finance |
| Seed Money- for programming | 1/31/2004 | 2/10/2004 | $0 | Brian/ Claire | Finance |
| Begin Programming | 2/10/2004 | 2/20/2004 | $0 | Claire | Programming |
| Create Board of Directors | 2/20/2004 | 2/28/2004 | $0 | Brian/ Claire | Business Development |
| Finalize Investment | 2/28/2004 | 3/31/2004 | $0 | Brian/ Claire | Finance |
| Draft Marketing Plan | 2/28/2004 | 3/31/2004 | $0 | Claire | Marketing |
| Investigate Alliances | 2/28/2004 | 3/31/2004 | $0 | Claire | Business Development |
| Beta Testing | 3/31/2004 | 4/30/2004 | $0 | Brian/ Claire | Programming |
| Start Implementing | 3/31/2004 | 4/30/2004 | $0 | Brian/ Claire | Operations |
| Beta Testing Complete | 4/30/2004 | 5/31/2004 | $0 | Brian/ Claire | Programming |
| Begin Full Scale Marketing | 4/30/2004 | 5/31/2004 | $0 | Brian/ Claire | Marketing |
| Launch Product | 5/31/2004 | 7/1/2004 | $0 | Brian/ Claire | Operations |
| Totals | $0 | ||||
Management Summary
Currently, we have two employees. Both are founders. No new staff will be joining the company until the beta version is completed. We use a loosely affiliated network of retired judges, practicing lawyers, law professors and legal professionals who provide advice and insight about the market and other key criteria. This is done on an ad hoc basis. The plan for acquiring talent is to use this network as recruiting agents. eDocFile wants its initial core recruits to be seasoned professionals from the legal industry. We have a short list of professionals who have expressed interest in joining the company; many conditioned their joining us subject to capital formation.
6.1 Organizational Structure
At the outset, eDocFile will have a flat organizational structure. This will allow for transparent and seamless communication. It will also allow the company to be responsive to customer needs by being proactive in design and development. The primary functional group will be a consulting team, composed of an experienced legal professional and an IT professional. Each team will be responsible for sales, support and maintenance of accounts. The company will be comprised of three main functional areas initially: R&D, marketing and sales, and HR and CEO responsibilities.
R&D: This group will focus on cutting edge product development and maintenance of the software. R&D will dovetail with marketing to guarantee customer needs are met and exceeded.
Marketing and Sales: Branding, positioning and market research will form the cornerstone of our marketing communications program. This team has to develop a program that is in accordance with company culture and our mission statement, yet it has to responsive to customer needs and changing market conditions. To balance competing interests of short term and long term goals the marketing team has to devise a dynamic feed back data loop that integrates internal R&D data with external market data. This system would become a critical component of our competitive advantage. Customer training will also fall under the domain of marketing.
HR and CEO: HR responsibilities will include much of the culture building and will interface with the training programs in marketing. HR will focus on reinforcing behaviors that create company culture. The CEO is the chief salesperson and chief financial officer. The CEO will also be responsible for attracting quality and expertise to the company.
6.2 Management Team
The management team will consist of a CEO, a COO and a Board of Directors. The CEO will have a legal background, (preferably a judge) and be familiar with current Internet and extranet technology. Claire Xoe will serve as CEO until the proper candidate is found.
The Board of Directors (12) will all come from the ranks of retired judges and lawyers and at least three must have corporate experience preferably with management backgrounds.
Claire Xoe: CEO and founder: Claire has worked and consulted for Internet start-ups in sales and marketing for the last three years. She recently left LegalAnywhere, an Internet company based in New York City, NY to found eDocFile. Claire holds science, engineering and humanities undergraduate degrees. She also holds a JD and MBA from Cornell University.
Brian Sliver: COO and founder. Brian has been involved in Internet start-ups for about 4 years and has considerable experience in technology and networking. Brian holds an undergraduate degree in Sociology from Dartmouth College and will complete his JD from Cornell University in 2004.
6.3 Management Team Gaps
The start-up management team lacks experience in the day to day functioning of the court system. This challenge will be addressed and defused by hiring from within the ranks of the legal community.
6.4 Personnel Plan
Initially eDocFile will offer a standardized pay structure to all its employees. The difference in pay scale will be made up in stock options. This is a performance based incentive system and is designed to elicit equality among all employees and generate ownership among all employees. No new employees will be added until the beta version is completed. When we do start hiring, an office manager, sales team, and marketing group will be recruited.
| Personnel Plan | |||
| Year 1 | Year 2 | Year 3 | |
| CEO | $18,000 | $36,000 | $36,000 |
| COO | $18,000 | $36,000 | $36,000 |
| Office Manager | $18,000 | $36,000 | $36,000 |
| Sales Consultants | $102,000 | $720,000 | $1,080,000 |
| Programmers/ Technicians | $56,004 | $360,000 | $540,000 |
| Customer Service | $50,004 | $432,000 | $648,000 |
| Marketing | $43,992 | $288,000 | $432,000 |
| Other | $6,000 | $72,000 | $108,000 |
| Total People | 10 | 49 | 58 |
| Total Payroll | $312,000 | $1,980,000 | $2,916,000 |
Financial Plan
eDocFile will require a $700,000 investment. Growth will be slow at first, but once the infrastructure is created through branding, positioning and a competent employee base, growth will be explosive. eDocFile should not need additional funding according to projections, because once sales are generated, a captive market of lawyers will generate a revenue stream that will pay for future acquisition of sales. At some juncture (we have calculated 2%, or approx. 1,780,000 transactions) critical mass will be reached and there will be explosive growth. The challenge at that point will not be sales or marketing, but HR. Growth will be limited by the number of qualified people we can hire to support our customers.
7.1 Important Assumptions
Since the company will not be financed by debt, interest rates will not be of great importance to us. Further, eDocFile will not have a significant Accounts Receivable burden as we will, in essence, have cash transactions. Services will be paid for at the time of performance. We also assume an economy without major recession, however, since our service is transaction based and in a sector of the economy that is generally recession proof this is not a major concern for us.
These factors make this venture extremely attractive, and once a self-sustaining revenue stream is achieved, the company could conceivably function as a cash machine.
| General Assumptions | |||
| Year 1 | Year 2 | Year 3 | |
| Plan Month | 1 | 2 | 3 |
| Current Interest Rate | 10.00% | 10.00% | 10.00% |
| Long-term Interest Rate | 9.00% | 9.00% | 9.00% |
| Tax Rate | 30.00% | 30.00% | 30.00% |
| Other | 0 | 0 | 0 |
7.2 Exit Strategy
One strategy, with the market’s current love affair with .com companies, is to take the company public. With public money comes public scrutiny and influence, the potential eDocFile has to generate large sums of cash may raise questions about the benefits of going public. However, this is an option that can never be excluded.
The other obvious strategy is to be acquired. Unless we are not having fun doing this or have competing outside interests this would not be a first option. However, in today’s climate there are some merger and acquisition deals that should not be overlooked, therefore while this is not a favored strategy it certainly deserves consideration.
We would like to build a company for the long term and think that within three to five years we could generate enough cash to buy out our investors if they need to cash out their investment, thereby keeping the company private. This kind of control will allow us to build a legal portal and give us the leverage to move beyond the legal market to other professional markets.
7.3 Break-even Analysis
The Break-even Analysis is based on the per transaction costs and fees of e-filing, as well as operating expenses.

| Break-even Analysis | |
| Monthly Revenue Break-even | $49,795 |
| Assumptions: | |
| Average Percent Variable Cost | 20% |
| Estimated Monthly Fixed Cost | $39,956 |
7.4 Projected Profit and Loss
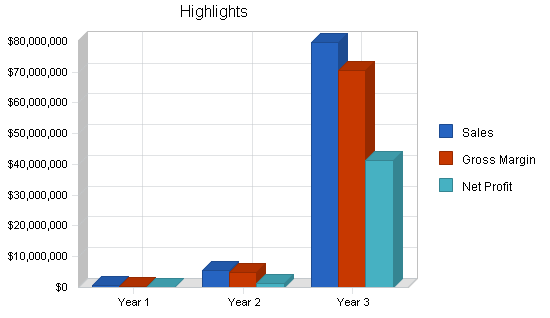
Current projection shows that eDocFile will become profitable in the fourth quarter of its first year. However, this does not mean that eDocFile will have recovered any of its investment. While these projections are far from perfect, they do highlight financial trends; for instance, gross margins will increase as direct sales costs fall over time. The captive market of lawyers is a windfall and helps the company reach profitability sooner that most other Internet start-ups.


| Pro Forma Profit and Loss | |||
| Year 1 | Year 2 | Year 3 | |
| Sales | $453,826 | $5,445,899 | $79,711,568 |
| Direct Cost of Sales | $89,673 | $701,196 | $9,035,258 |
| Other Costs of Sales | $0 | $0 | $0 |
| Total Cost of Sales | $89,673 | $701,196 | $9,035,258 |
| Gross Margin | $364,153 | $4,744,703 | $70,676,310 |
| Gross Margin % | 80.24% | 87.12% | 88.67% |
| Expenses | |||
| Payroll | $312,000 | $1,980,000 | $2,916,000 |
| Sales and Marketing and Other Expenses | $50,988 | $544,590 | $7,971,157 |
| Depreciation | $0 | $0 | $0 |
| Rent | $18,000 | $36,000 | $36,000 |
| Utilities | $14,016 | $53,914 | $116,219 |
| Insurance | $31,392 | $198,000 | $291,600 |
| Payroll Taxes | $46,800 | $297,000 | $437,400 |
| Leased equipment | $6,276 | $11,880 | $17,496 |
| Total Operating Expenses | $479,472 | $3,121,384 | $11,785,872 |
| Profit Before Interest and Taxes | ($115,319) | $1,623,319 | $58,890,438 |
| EBITDA | ($115,319) | $1,623,319 | $58,890,438 |
| Interest Expense | $0 | $0 | $0 |
| Taxes Incurred | $0 | $486,996 | $17,667,131 |
| Net Profit | ($115,319) | $1,136,323 | $41,223,307 |
| Net Profit/Sales | -25.41% | 20.87% | 51.72% |
7.5 Projected Cash Flow
Cash flow is healthy when compared with most start-ups, yet there is a period in the last quarter of the first year, just before profitability that cash flow becomes tight. The company’s reserves are at its lowest and unforeseen catastrophes, though they may not be fatal, but could cause a serious set back. However, once we establish some semblance of market share, cash flow becomes spectacular even by the most conservative standards because this service is transaction driven.

| Pro Forma Cash Flow | |||
| Year 1 | Year 2 | Year 3 | |
| Cash Received | |||
| Cash from Operations | |||
| Cash Sales | $453,826 | $5,445,899 | $79,711,568 |
| Subtotal Cash from Operations | $453,826 | $5,445,899 | $79,711,568 |
| Additional Cash Received | |||
| Sales Tax, VAT, HST/GST Received | $0 | $0 | $0 |
| New Current Borrowing | $0 | $0 | $0 |
| New Other Liabilities (interest-free) | $0 | $0 | $0 |
| New Long-term Liabilities | $0 | $0 | $0 |
| Sales of Other Current Assets | $0 | $0 | $0 |
| Sales of Long-term Assets | $0 | $0 | $0 |
| New Investment Received | $0 | $0 | $0 |
| Subtotal Cash Received | $453,826 | $5,445,899 | $79,711,568 |
| Expenditures | Year 1 | Year 2 | Year 3 |
| Expenditures from Operations | |||
| Cash Spending | $312,000 | $1,980,000 | $2,916,000 |
| Bill Payments | $186,190 | $2,209,059 | $32,839,986 |
| Subtotal Spent on Operations | $498,190 | $4,189,059 | $35,755,986 |
| Additional Cash Spent | |||
| Sales Tax, VAT, HST/GST Paid Out | $0 | $0 | $0 |
| Principal Repayment of Current Borrowing | $0 | $0 | $0 |
| Other Liabilities Principal Repayment | $0 | $0 | $0 |
| Long-term Liabilities Principal Repayment | $0 | $0 | $0 |
| Purchase Other Current Assets | $0 | $0 | $0 |
| Purchase Long-term Assets | $0 | $0 | $0 |
| Dividends | $0 | $0 | $0 |
| Subtotal Cash Spent | $498,190 | $4,189,059 | $35,755,986 |
| Net Cash Flow | ($44,364) | $1,256,840 | $43,955,582 |
| Cash Balance | $297,136 | $1,553,976 | $45,509,558 |
7.6 Projected Balance Sheet
The following table shows the projected balance sheet.
| Pro Forma Balance Sheet | |||
| Year 1 | Year 2 | Year 3 | |
| Assets | |||
| Current Assets | |||
| Cash | $297,136 | $1,553,976 | $45,509,558 |
| Other Current Assets | $215,000 | $215,000 | $215,000 |
| Total Current Assets | $512,136 | $1,768,976 | $45,724,558 |
| Long-term Assets | |||
| Long-term Assets | $0 | $0 | $0 |
| Accumulated Depreciation | $0 | $0 | $0 |
| Total Long-term Assets | $0 | $0 | $0 |
| Total Assets | $512,136 | $1,768,976 | $45,724,558 |
| Liabilities and Capital | Year 1 | Year 2 | Year 3 |
| Current Liabilities | |||
| Accounts Payable | $70,956 | $191,472 | $2,923,748 |
| Current Borrowing | $0 | $0 | $0 |
| Other Current Liabilities | $0 | $0 | $0 |
| Subtotal Current Liabilities | $70,956 | $191,472 | $2,923,748 |
| Long-term Liabilities | $0 | $0 | $0 |
| Total Liabilities | $70,956 | $191,472 | $2,923,748 |
| Paid-in Capital | $700,000 | $700,000 | $700,000 |
| Retained Earnings | ($143,500) | ($258,819) | $877,504 |
| Earnings | ($115,319) | $1,136,323 | $41,223,307 |
| Total Capital | $441,181 | $1,577,504 | $42,800,811 |
| Total Liabilities and Capital | $512,136 | $1,768,976 | $45,724,558 |
| Net Worth | $441,181 | $1,577,504 | $42,800,811 |
7.7 Business Ratios
The business ratios are impressive because of the built-in captive market. Also, the company has no debt or AR, and together with high margins the projections show high liquidity and large amounts of working capital. This is a healthy and profitable projected forecast. Our SIC industry class is currently Data base information retrieval – 7375.9901.
| Ratio Analysis | ||||
| Year 1 | Year 2 | Year 3 | Industry Profile | |
| Sales Growth | 0.00% | 1100.00% | 1363.70% | 10.27% |
| Percent of Total Assets | ||||
| Other Current Assets | 41.98% | 12.15% | 0.47% | 44.32% |
| Total Current Assets | 100.00% | 100.00% | 100.00% | 77.85% |
| Long-term Assets | 0.00% | 0.00% | 0.00% | 22.15% |
| Total Assets | 100.00% | 100.00% | 100.00% | 100.00% |
| Current Liabilities | 13.85% | 10.82% | 6.39% | 35.88% |
| Long-term Liabilities | 0.00% | 0.00% | 0.00% | 21.91% |
| Total Liabilities | 13.85% | 10.82% | 6.39% | 57.79% |
| Net Worth | 86.15% | 89.18% | 93.61% | 42.21% |
| Percent of Sales | ||||
| Sales | 100.00% | 100.00% | 100.00% | 100.00% |
| Gross Margin | 80.24% | 87.12% | 88.67% | 100.00% |
| Selling, General & Administrative Expenses | 105.65% | 66.26% | 36.95% | 82.56% |
| Advertising Expenses | 0.00% | 0.00% | 0.00% | 1.01% |
| Profit Before Interest and Taxes | -25.41% | 29.81% | 73.88% | 1.11% |
| Main Ratios | ||||
| Current | 7.22 | 9.24 | 15.64 | 1.68 |
| Quick | 7.22 | 9.24 | 15.64 | 1.27 |
| Total Debt to Total Assets | 13.85% | 10.82% | 6.39% | 2.10% |
| Pre-tax Return on Net Worth | -26.14% | 102.90% | 137.59% | 66.78% |
| Pre-tax Return on Assets | -22.52% | 91.77% | 128.79% | 6.31% |
| Additional Ratios | Year 1 | Year 2 | Year 3 | |
| Net Profit Margin | -25.41% | 20.87% | 51.72% | n.a |
| Return on Equity | -26.14% | 72.03% | 96.31% | n.a |
| Activity Ratios | ||||
| Accounts Payable Turnover | 3.62 | 12.17 | 12.17 | n.a |
| Payment Days | 27 | 21 | 16 | n.a |
| Total Asset Turnover | 0.89 | 3.08 | 1.74 | n.a |
| Debt Ratios | ||||
| Debt to Net Worth | 0.16 | 0.12 | 0.07 | n.a |
| Current Liab. to Liab. | 1.00 | 1.00 | 1.00 | n.a |
| Liquidity Ratios | ||||
| Net Working Capital | $441,181 | $1,577,504 | $42,800,811 | n.a |
| Interest Coverage | 0.00 | 0.00 | 0.00 | n.a |
| Additional Ratios | ||||
| Assets to Sales | 1.13 | 0.32 | 0.57 | n.a |
| Current Debt/Total Assets | 14% | 11% | 6% | n.a |
| Acid Test | 7.22 | 9.24 | 15.64 | n.a |
| Sales/Net Worth | 1.03 | 3.45 | 1.86 | n.a |
| Dividend Payout | 0.00 | 0.00 | 0.00 | n.a |
Appendix
| Sales Forecast | |||||||||||||
| Month 1 | Month 2 | Month 3 | Month 4 | Month 5 | Month 6 | Month 7 | Month 8 | Month 9 | Month 10 | Month 11 | Month 12 | ||
| Sales | |||||||||||||
| E-Filing Transaction | 0% | $0 | $0 | $0 | $0 | $0 | $0 | $0 | $0 | $20,840 | $20,840 | $83,359 | $245,908 |
| Hosting | 0% | $0 | $0 | $0 | $0 | $0 | $0 | $0 | $0 | $78 | $78 | $313 | $922 |
| Judicial Information Transactions | 0% | $0 | $0 | $0 | $0 | $0 | $0 | $0 | $0 | $813 | $813 | $3,250 | $9,588 |
| Training and Consulting | 0% | $0 | $0 | $0 | $0 | $0 | $0 | $0 | $0 | $3,766 | $3,766 | $15,062 | $44,433 |
| Total Sales | $0 | $0 | $0 | $0 | $0 | $0 | $0 | $0 | $25,496 | $25,496 | $101,983 | $300,851 | |
| Direct Cost of Sales | Month 1 | Month 2 | Month 3 | Month 4 | Month 5 | Month 6 | Month 7 | Month 8 | Month 9 | Month 10 | Month 11 | Month 12 | |
| E-Filing Transaction | $0 | $0 | $0 | $0 | $0 | $0 | $0 | $0 | $2,084 | $2,084 | $8,336 | $24,591 | |
| Hosting | $0 | $0 | $0 | $0 | $0 | $0 | $0 | $0 | $8 | $8 | $31 | $92 | |
| Judicial Information Transactions | $0 | $0 | $0 | $0 | $0 | $0 | $0 | $0 | $122 | $122 | $488 | $1,438 | |
| Training and Consulting | $0 | $0 | $0 | $0 | $0 | $0 | $0 | $0 | $2,824 | $2,824 | $11,297 | $33,325 | |
| Subtotal Direct Cost of Sales | $0 | $0 | $0 | $0 | $0 | $0 | $0 | $0 | $5,038 | $5,038 | $20,151 | $59,446 | |
| Personnel Plan | |||||||||||||
| Month 1 | Month 2 | Month 3 | Month 4 | Month 5 | Month 6 | Month 7 | Month 8 | Month 9 | Month 10 | Month 11 | Month 12 | ||
| CEO | 0% | $1,500 | $1,500 | $1,500 | $1,500 | $1,500 | $1,500 | $1,500 | $1,500 | $1,500 | $1,500 | $1,500 | $1,500 |
| COO | 0% | $1,500 | $1,500 | $1,500 | $1,500 | $1,500 | $1,500 | $1,500 | $1,500 | $1,500 | $1,500 | $1,500 | $1,500 |
| Office Manager | 0% | $1,500 | $1,500 | $1,500 | $1,500 | $1,500 | $1,500 | $1,500 | $1,500 | $1,500 | $1,500 | $1,500 | $1,500 |
| Sales Consultants | 0% | $8,500 | $8,500 | $8,500 | $8,500 | $8,500 | $8,500 | $8,500 | $8,500 | $8,500 | $8,500 | $8,500 | $8,500 |
| Programmers/ Technicians | 0% | $4,667 | $4,667 | $4,667 | $4,667 | $4,667 | $4,667 | $4,667 | $4,667 | $4,667 | $4,667 | $4,667 | $4,667 |
| Customer Service | 0% | $4,167 | $4,167 | $4,167 | $4,167 | $4,167 | $4,167 | $4,167 | $4,167 | $4,167 | $4,167 | $4,167 | $4,167 |
| Marketing | 0% | $3,666 | $3,666 | $3,666 | $3,666 | $3,666 | $3,666 | $3,666 | $3,666 | $3,666 | $3,666 | $3,666 | $3,666 |
| Other | 0% | $500 | $500 | $500 | $500 | $500 | $500 | $500 | $500 | $500 | $500 | $500 | $500 |
| Total People | 10 | 10 | 10 | 10 | 10 | 10 | 10 | 10 | 10 | 10 | 10 | 10 | |
| Total Payroll | $26,000 | $26,000 | $26,000 | $26,000 | $26,000 | $26,000 | $26,000 | $26,000 | $26,000 | $26,000 | $26,000 | $26,000 | |
| General Assumptions | |||||||||||||
| Month 1 | Month 2 | Month 3 | Month 4 | Month 5 | Month 6 | Month 7 | Month 8 | Month 9 | Month 10 | Month 11 | Month 12 | ||
| Plan Month | 1 | 2 | 3 | 4 | 5 | 6 | 7 | 8 | 9 | 10 | 11 | 12 | |
| Current Interest Rate | 10.00% | 10.00% | 10.00% | 10.00% | 10.00% | 10.00% | 10.00% | 10.00% | 10.00% | 10.00% | 10.00% | 10.00% | |
| Long-term Interest Rate | 9.00% | 9.00% | 9.00% | 9.00% | 9.00% | 9.00% | 9.00% | 9.00% | 9.00% | 9.00% | 9.00% | 9.00% | |
| Tax Rate | 30.00% | 30.00% | 30.00% | 30.00% | 30.00% | 30.00% | 30.00% | 30.00% | 30.00% | 30.00% | 30.00% | 30.00% | |
| Other | 0 | 0 | 0 | 0 | 0 | 0 | 0 | 0 | 0 | 0 | 0 | 0 | |
| Pro Forma Profit and Loss | |||||||||||||
| Month 1 | Month 2 | Month 3 | Month 4 | Month 5 | Month 6 | Month 7 | Month 8 | Month 9 | Month 10 | Month 11 | Month 12 | ||
| Sales | $0 | $0 | $0 | $0 | $0 | $0 | $0 | $0 | $25,496 | $25,496 | $101,983 | $300,851 | |
| Direct Cost of Sales | $0 | $0 | $0 | $0 | $0 | $0 | $0 | $0 | $5,038 | $5,038 | $20,151 | $59,446 | |
| Other Costs of Sales | $0 | $0 | $0 | $0 | $0 | $0 | $0 | $0 | $0 | $0 | $0 | $0 | |
| Total Cost of Sales | $0 | $0 | $0 | $0 | $0 | $0 | $0 | $0 | $5,038 | $5,038 | $20,151 | $59,446 | |
| Gross Margin | $0 | $0 | $0 | $0 | $0 | $0 | $0 | $0 | $20,458 | $20,458 | $81,832 | $241,405 | |
| Gross Margin % | 0.00% | 0.00% | 0.00% | 0.00% | 0.00% | 0.00% | 0.00% | 0.00% | 80.24% | 80.24% | 80.24% | 80.24% | |
| Expenses | |||||||||||||
| Payroll | $26,000 | $26,000 | $26,000 | $26,000 | $26,000 | $26,000 | $26,000 | $26,000 | $26,000 | $26,000 | $26,000 | $26,000 | |
| Sales and Marketing and Other Expenses | $4,249 | $4,249 | $4,249 | $4,249 | $4,249 | $4,249 | $4,249 | $4,249 | $4,249 | $4,249 | $4,249 | $4,249 | |
| Depreciation | $0 | $0 | $0 | $0 | $0 | $0 | $0 | $0 | $0 | $0 | $0 | $0 | |
| Rent | $1,500 | $1,500 | $1,500 | $1,500 | $1,500 | $1,500 | $1,500 | $1,500 | $1,500 | $1,500 | $1,500 | $1,500 | |
| Utilities | $1,168 | $1,168 | $1,168 | $1,168 | $1,168 | $1,168 | $1,168 | $1,168 | $1,168 | $1,168 | $1,168 | $1,168 | |
| Insurance | $2,616 | $2,616 | $2,616 | $2,616 | $2,616 | $2,616 | $2,616 | $2,616 | $2,616 | $2,616 | $2,616 | $2,616 | |
| Payroll Taxes | 15% | $3,900 | $3,900 | $3,900 | $3,900 | $3,900 | $3,900 | $3,900 | $3,900 | $3,900 | $3,900 | $3,900 | $3,900 |
| Leased equipment | $523 | $523 | $523 | $523 | $523 | $523 | $523 | $523 | $523 | $523 | $523 | $523 | |
| Total Operating Expenses | $39,956 | $39,956 | $39,956 | $39,956 | $39,956 | $39,956 | $39,956 | $39,956 | $39,956 | $39,956 | $39,956 | $39,956 | |
| Profit Before Interest and Taxes | ($39,956) | ($39,956) | ($39,956) | ($39,956) | ($39,956) | ($39,956) | ($39,956) | ($39,956) | ($19,498) | ($19,498) | $41,876 | $201,449 | |
| EBITDA | ($39,956) | ($39,956) | ($39,956) | ($39,956) | ($39,956) | ($39,956) | ($39,956) | ($39,956) | ($19,498) | ($19,498) | $41,876 | $201,449 | |
| Interest Expense | $0 | $0 | $0 | $0 | $0 | $0 | $0 | $0 | $0 | $0 | $0 | $0 | |
| Taxes Incurred | $0 | $0 | $0 | $0 | $0 | $0 | $0 | $0 | $0 | $0 | $0 | $0 | |
| Net Profit | ($39,956) | ($39,956) | ($39,956) | ($39,956) | ($39,956) | ($39,956) | ($39,956) | ($39,956) | ($19,498) | ($19,498) | $41,876 | $201,449 | |
| Net Profit/Sales | 0.00% | 0.00% | 0.00% | 0.00% | 0.00% | 0.00% | 0.00% | 0.00% | -76.48% | -76.48% | 41.06% | 66.96% | |
| Pro Forma Cash Flow | |||||||||||||
| Month 1 | Month 2 | Month 3 | Month 4 | Month 5 | Month 6 | Month 7 | Month 8 | Month 9 | Month 10 | Month 11 | Month 12 | ||
| Cash Received | |||||||||||||
| Cash from Operations | |||||||||||||
| Cash Sales | $0 | $0 | $0 | $0 | $0 | $0 | $0 | $0 | $25,496 | $25,496 | $101,983 | $300,851 | |
| Subtotal Cash from Operations | $0 | $0 | $0 | $0 | $0 | $0 | $0 | $0 | $25,496 | $25,496 | $101,983 | $300,851 | |
| Additional Cash Received | |||||||||||||
| Sales Tax, VAT, HST/GST Received | 0.00% | $0 | $0 | $0 | $0 | $0 | $0 | $0 | $0 | $0 | $0 | $0 | $0 |
| New Current Borrowing | $0 | $0 | $0 | $0 | $0 | $0 | $0 | $0 | $0 | $0 | $0 | $0 | |
| New Other Liabilities (interest-free) | $0 | $0 | $0 | $0 | $0 | $0 | $0 | $0 | $0 | $0 | $0 | $0 | |
| New Long-term Liabilities | $0 | $0 | $0 | $0 | $0 | $0 | $0 | $0 | $0 | $0 | $0 | $0 | |
| Sales of Other Current Assets | $0 | $0 | $0 | $0 | $0 | $0 | $0 | $0 | $0 | $0 | $0 | $0 | |
| Sales of Long-term Assets | $0 | $0 | $0 | $0 | $0 | $0 | $0 | $0 | $0 | $0 | $0 | $0 | |
| New Investment Received | $0 | $0 | $0 | $0 | $0 | $0 | $0 | $0 | $0 | $0 | $0 | $0 | |
| Subtotal Cash Received | $0 | $0 | $0 | $0 | $0 | $0 | $0 | $0 | $25,496 | $25,496 | $101,983 | $300,851 | |
| Expenditures | Month 1 | Month 2 | Month 3 | Month 4 | Month 5 | Month 6 | Month 7 | Month 8 | Month 9 | Month 10 | Month 11 | Month 12 | |
| Expenditures from Operations | |||||||||||||
| Cash Spending | $26,000 | $26,000 | $26,000 | $26,000 | $26,000 | $26,000 | $26,000 | $26,000 | $26,000 | $26,000 | $26,000 | $26,000 | |
| Bill Payments | $465 | $13,956 | $13,956 | $13,956 | $13,956 | $13,956 | $13,956 | $13,956 | $14,124 | $18,994 | $19,498 | $35,417 | |
| Subtotal Spent on Operations | $26,465 | $39,956 | $39,956 | $39,956 | $39,956 | $39,956 | $39,956 | $39,956 | $40,124 | $44,994 | $45,498 | $61,417 | |
| Additional Cash Spent | |||||||||||||
| Sales Tax, VAT, HST/GST Paid Out | $0 | $0 | $0 | $0 | $0 | $0 | $0 | $0 | $0 | $0 | $0 | $0 | |
| Principal Repayment of Current Borrowing | $0 | $0 | $0 | $0 | $0 | $0 | $0 | $0 | $0 | $0 | $0 | $0 | |
| Other Liabilities Principal Repayment | $0 | $0 | $0 | $0 | $0 | $0 | $0 | $0 | $0 | $0 | $0 | $0 | |
| Long-term Liabilities Principal Repayment | $0 | $0 | $0 | $0 | $0 | $0 | $0 | $0 | $0 | $0 | $0 | $0 | |
| Purchase Other Current Assets | $0 | $0 | $0 | $0 | $0 | $0 | $0 | $0 | $0 | $0 | $0 | $0 | |
| Purchase Long-term Assets | $0 | $0 | $0 | $0 | $0 | $0 | $0 | $0 | $0 | $0 | $0 | $0 | |
| Dividends | $0 | $0 | $0 | $0 | $0 | $0 | $0 | $0 | $0 | $0 | $0 | $0 | |
| Subtotal Cash Spent | $26,465 | $39,956 | $39,956 | $39,956 | $39,956 | $39,956 | $39,956 | $39,956 | $40,124 | $44,994 | $45,498 | $61,417 | |
| Net Cash Flow | ($26,465) | ($39,956) | ($39,956) | ($39,956) | ($39,956) | ($39,956) | ($39,956) | ($39,956) | ($14,628) | ($19,498) | $56,486 | $239,434 | |
| Cash Balance | $315,035 | $275,079 | $235,123 | $195,167 | $155,211 | $115,255 | $75,299 | $35,343 | $20,715 | $1,217 | $57,703 | $297,136 | |
| Pro Forma Balance Sheet | |||||||||||||
| Month 1 | Month 2 | Month 3 | Month 4 | Month 5 | Month 6 | Month 7 | Month 8 | Month 9 | Month 10 | Month 11 | Month 12 | ||
| Assets | Starting Balances | ||||||||||||
| Current Assets | |||||||||||||
| Cash | $341,500 | $315,035 | $275,079 | $235,123 | $195,167 | $155,211 | $115,255 | $75,299 | $35,343 | $20,715 | $1,217 | $57,703 | $297,136 |
| Other Current Assets | $215,000 | $215,000 | $215,000 | $215,000 | $215,000 | $215,000 | $215,000 | $215,000 | $215,000 | $215,000 | $215,000 | $215,000 | $215,000 |
| Total Current Assets | $556,500 | $530,035 | $490,079 | $450,123 | $410,167 | $370,211 | $330,255 | $290,299 | $250,343 | $235,715 | $216,217 | $272,703 | $512,136 |
| Long-term Assets | |||||||||||||
| Long-term Assets | $0 | $0 | $0 | $0 | $0 | $0 | $0 | $0 | $0 | $0 | $0 | $0 | $0 |
| Accumulated Depreciation | $0 | $0 | $0 | $0 | $0 | $0 | $0 | $0 | $0 | $0 | $0 | $0 | $0 |
| Total Long-term Assets | $0 | $0 | $0 | $0 | $0 | $0 | $0 | $0 | $0 | $0 | $0 | $0 | $0 |
| Total Assets | $556,500 | $530,035 | $490,079 | $450,123 | $410,167 | $370,211 | $330,255 | $290,299 | $250,343 | $235,715 | $216,217 | $272,703 | $512,136 |
| Liabilities and Capital | Month 1 | Month 2 | Month 3 | Month 4 | Month 5 | Month 6 | Month 7 | Month 8 | Month 9 | Month 10 | Month 11 | Month 12 | |
| Current Liabilities | |||||||||||||
| Accounts Payable | $0 | $13,491 | $13,491 | $13,491 | $13,491 | $13,491 | $13,491 | $13,491 | $13,491 | $18,361 | $18,361 | $32,970 | $70,956 |
| Current Borrowing | $0 | $0 | $0 | $0 | $0 | $0 | $0 | $0 | $0 | $0 | $0 | $0 | $0 |
| Other Current Liabilities | $0 | $0 | $0 | $0 | $0 | $0 | $0 | $0 | $0 | $0 | $0 | $0 | $0 |
| Subtotal Current Liabilities | $0 | $13,491 | $13,491 | $13,491 | $13,491 | $13,491 | $13,491 | $13,491 | $13,491 | $18,361 | $18,361 | $32,970 | $70,956 |
| Long-term Liabilities | $0 | $0 | $0 | $0 | $0 | $0 | $0 | $0 | $0 | $0 | $0 | $0 | $0 |
| Total Liabilities | $0 | $13,491 | $13,491 | $13,491 | $13,491 | $13,491 | $13,491 | $13,491 | $13,491 | $18,361 | $18,361 | $32,970 | $70,956 |
| Paid-in Capital | $700,000 | $700,000 | $700,000 | $700,000 | $700,000 | $700,000 | $700,000 | $700,000 | $700,000 | $700,000 | $700,000 | $700,000 | $700,000 |
| Retained Earnings | ($143,500) | ($143,500) | ($143,500) | ($143,500) | ($143,500) | ($143,500) | ($143,500) | ($143,500) | ($143,500) | ($143,500) | ($143,500) | ($143,500) | ($143,500) |
| Earnings | $0 | ($39,956) | ($79,912) | ($119,868) | ($159,824) | ($199,780) | ($239,736) | ($279,692) | ($319,648) | ($339,146) | ($358,644) | ($316,768) | ($115,319) |
| Total Capital | $556,500 | $516,544 | $476,588 | $436,632 | $396,676 | $356,720 | $316,764 | $276,808 | $236,852 | $217,354 | $197,856 | $239,732 | $441,181 |
| Total Liabilities and Capital | $556,500 | $530,035 | $490,079 | $450,123 | $410,167 | $370,211 | $330,255 | $290,299 | $250,343 | $235,715 | $216,217 | $272,703 | $512,136 |
| Net Worth | $556,500 | $516,544 | $476,588 | $436,632 | $396,676 | $356,720 | $316,764 | $276,808 | $236,852 | $217,354 | $197,856 | $239,732 | $441,181 |

