
Adventure Travel International
Executive Summary
Adventure Travel International (ATI) will begin operations this year and provide adventure and sport/travel packages to people in the Pacific Northwest, specifically the greater Woodville area. An opportunity for ATI’s success exists because the national tourism and travel industry is growing at 4%, and adventure travel at 10% annually. Further, the Woodville adventure travel market is growing at least 12% annually and there are no providers who specialize solely in adventure travel in the greater Woodville area. ATI is poised to take advantage of this growth and lack of competition with an experienced staff, excellent location, and effective management and marketing.
The company’s goals over the next three years are:
- Sales of $650,000 by year three.
- Maintain margins of 10% on all airline travel.
- Achieve 15% of sales from the Internet.
- Develop strategic alliances with service providers nationally, internationally, and in the Woodville area.
In order to achieve these goals ATI needs to focus on the three key areas of:
- Effective segmentation and targeting of adventure travelers within the larger travel market.
- Successfully position ourselves as adventure travel specialists.
- Communicate the differentiation and quality of our offering through personal interaction, media, and regional marketing.
- Develop a repeat-business base of loyal customers in order to create sufficient sales.
ATI will be a sole proprietorship owned and operated by Shea Delaney in the town of Atkins Grove, California. The founder and employees of ATI are experienced travel industry professionals and are passionate about the activities ATI will promote and offer.
ATI’s total start-up capital requirement is approximately $102,500. Start-up will be financed through the owner’s personal investment and a long-term note of $85,000 secured from the Woodville First National Bank.
The travel agency market is competitive, and technology, namely the Internet and Computerized Reservation Systems (CRS), has changed the way travel agencies operate. The Internet gives agencies and individuals the ability to perform travel related research. Discount airfare brokers have taken advantage of the Internet by offering tickets online at discounted rates. This has increased price competition. Computerized Reservation Systems have increased the speed and efficiency of the agency-to-customer transaction. They have also increased the start-up costs for travel agencies who wish to be competitive. One notable trend in the travel industry is increased deregulation. Deregulation has increased the need for differentiation and has, in many cases, lowered the prices of airfare and other travel-related services. Additional trends include caps on agency commissions by many of the larger airlines, increases in adventure travel, and reduction of profit margins.
The travel industry is highly fragmented. There are large national chains, small home-based businesses, consolidators on the Internet, etc. Membership numbers in some of the travel-related associations give some indication of the number of participants in this market. The American Society of Travel Agents (ASTA) reports 25,000 members in 135 countries, most of whom are small businesses. ATI has approximately 30 immediate competitors in the greater Woodville area, including two agencies that are branches of national travel agency chains.
ATI is researching the market to identify potential opportunities for future sales in this rapidly changing environment. ATI’s long-term goal is to establish itself as an internationally recognized provider of top-of-the-line adventure travel. This goal does not prohibit ATI from participating in additional segments. It does, however, provide a corporate focus and a differentiated offering.
ATI’s target customers are health-conscious couples and individuals, with median household incomes of approximately $50,000. They are interested in popular adventure activities such as skiing, whitewater sports, and mountain biking. ATI’s most important target customers, however, will be married couples, ages 25-35, with children and household incomes over $50,000.
The Woodville area, like much of the Pacific Northwest, has a large concentration of outdoor recreation enthusiasts. These health-conscious individuals, couples, and groups interested in popular adventure sports, such as skiing, kayaking, trekking, etc., are ATI’s primary customers. ATI’s target market is an exploitable niche, and ATI will provide a specialized and thus differentiated service.
ATI has established relationships with providers of travel-related products and services. Two major airlines have been selected as our primary ticket providers in part because they do not cap the agent’s profit on tickets. This allows us to capture the 10% margin on ticket sales that was for many years the industry standard. Market research has enabled us to identify and establish working relationships with service providers around the world. ATI has been able to identify opportunities to capture margins of up to 25% from certain parties. Sourcing will be continuously evaluated. ATI will take advantage of trade shows, travel industry publications, and other sources of industry-related information to monitor the quality of its offering.
ATI has a number of major competitors that the company will seek to acquire market share from. They are:
- Rollins & Hayes;
- Sundance Travel;
- Global Adventure Travel.
None of these competitors have the combination of price, scope, or local focus that ATI will be able to offer.
ATI’s pricing strategy will be a major consideration. Much of it will be determined by market standards. ATI will attempt to maintain margins of 10% on all airline travel. Margins on all other products and services vary depending upon the provider but are expected to average 20%. ATI will make every effort to maintain a competitive pricing policy. However, as ATI builds its reputation as the premier provider of adventure travel, it expects to earn the ability to charge a premium for its services.
The company will also pursue an aggressive marketing campaign. During ATI’s first year of operation it will hold a grand opening and will organize and sponsor several athletic events. All ATI employees promote ATI’s services to local athletic clubs. Negotiations with area health clubs have begun and additional promotions will likely occur through these strategic alliances. Specialty, rather than large national publications, will serve as media vehicles for ATI advertising. Local radio stations will also be used. Personal selling will occur, though phone solicitation will be limited. ATI plans to occasionally station sales personnel in locations around Woodville such as shopping malls. ATI’s goal is to develop personal familiarity between its employees and the community.
ATI will be a small organization and its employees will share in management duties and decision making. Shea Delaney will act as the General Manager, but it will be important for each member of the team to be capable in all aspects of the business. Prerequisites for all ATI employees include at least five years travel industry experience, knowledge and ability in the types of activities ATI will promote, and Certified Travel Counselor (CTC) certification for applicable positions. The CTC designation can be obtained through the Institute of Certified Travel Agents (ICTA).
Prices will be competitive with the remainder of the market. The company’s estimated sales for the first year of operations are approximately $534,000, increasing 10% annually for the next two years.
ATI will begin operations with four full-time positions. The positions are as follows; general manager and president: Shea Delaney; marketing and advertising director: Jordan Barnes; accountant: Paul Mclellan; and one travel agent.
The company does not expect any problems with expenses or cash flow within the next three years. Annual cash flow for the first year of operation becomes positive in the second quarter of operation.


1.1 Objectives
- Sales of $650,000 by year three.
- Maintain margins of 10% on all airline travel.
- Achieve 15% of sales from the Internet.
- Develop strategic alliances with service providers nationally, internationally, and in the Woodville area.
1.2 Mission
Adventure Travel International (ATI) is a travel agency that specializes in adventure tourism and travel. It will provide consulting and custom travel arrangements and packages. ATI’s mission is to become the foremost provider of adventure travel to the people of the Pacific Northwest. ATI’s employees and owner are outdoor adventure and travel enthusiasts as well as seasoned travel industry professionals. ATI seeks to connect adventure travel newcomers and veterans with service providers, adventure activities, and accommodations that fit the client’s desires, budget, and skill level.
1.3 Keys to Success
- Effectively segment and target adventure travelers within the larger travel market.
- Successfully position ourselves as adventure travel specialists.
- Communicate the differentiation and quality of our offering through personal interaction and media.
- Develop a repeat-business base of loyal customers.
Company Summary
ATI is a full service travel agency that specializes in adventure travel and provides recreational and business travelers with professional service and consultation. ATI will position itself as a specialist in the field of adventure travel and will generate the majority of its income from this segment.
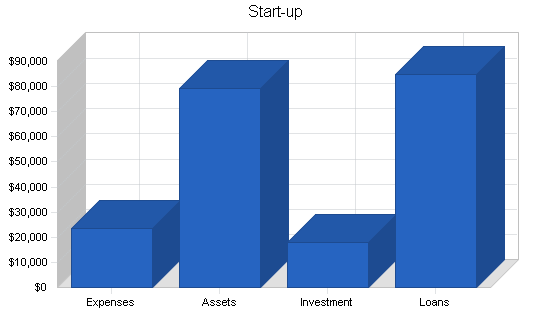
2.1 Start-up Summary
ATI’s total start-up capital requirement is approximately $103,000. Start-up will be financed through the owner’s personal investment and a long-term note secured from the Woodville First National Bank. Start-up details are located in Table 1.
- EXPENSES: These will be rent, office supplies, consultant’s fees, insurance, utilities, etc. The largest start-up expense will be for computers.
- ASSETS: Primarily cash and computers.
- INVESTMENT: The bulk of the investment will come from a loan from Shea Delaney’s personal savings.
- LOANS: An $85,000 loan has been secured from Woodville First National Bank.
| Start-up | |
| Requirements | |
| Start-up Expenses | |
| Legal | $550 |
| Stationery etc. | $500 |
| Brochures | $1,000 |
| Consultants | $2,000 |
| Insurance | $400 |
| Rent | $2,625 |
| Equipment | $16,000 |
| Other | $500 |
| Total Start-up Expenses | $23,575 |
| Start-up Assets | |
| Cash Required | $35,000 |
| Other Current Assets | $17,500 |
| Long-term Assets | $26,925 |
| Total Assets | $79,425 |
| Total Requirements | $103,000 |
| Start-up Funding | |
| Start-up Expenses to Fund | $23,575 |
| Start-up Assets to Fund | $79,425 |
| Total Funding Required | $103,000 |
| Assets | |
| Non-cash Assets from Start-up | $44,425 |
| Cash Requirements from Start-up | $35,000 |
| Additional Cash Raised | $0 |
| Cash Balance on Starting Date | $35,000 |
| Total Assets | $79,425 |
| Liabilities and Capital | |
| Liabilities | |
| Current Borrowing | $0 |
| Long-term Liabilities | $85,000 |
| Accounts Payable (Outstanding Bills) | $0 |
| Other Current Liabilities (interest-free) | $0 |
| Total Liabilities | $85,000 |
| Capital | |
| Planned Investment | |
| Owner | $18,000 |
| Investor | $0 |
| Additional Investment Requirement | $0 |
| Total Planned Investment | $18,000 |
| Loss at Start-up (Start-up Expenses) | ($23,575) |
| Total Capital | ($5,575) |
| Total Capital and Liabilities | $79,425 |
| Total Funding | $103,000 |
2.2 Company Ownership
ATI is a sole proprietorship owned and operated by Shea Delaney in the town of Atkins Grove, California. ATI’s owner is researching the possibility of establishing ATI as a Limited Liability Company (LLC) or Partnership (LLP). This may occur within eighteen months of operation.
2.3 Company Locations and Facilities
ATI has identified three potential locations for office space. All potential locations are in the town of Atkins Grove, California, and are between 800 and 1000 sq. ft. Once successfully established, ATI will be one of approximately 30 travel agencies in the greater Woodville area, population 325,000. ATI will be the only adventure travel specialist in the immediate area.
Services
ATI provides individual and group travel to leisure and corporate clients. Services and products provided by ATI include travel consultation, pre-arranged tours, custom packages, reservations for lodging, rental cars, rail passage, etc. ATI seeks to differentiate itself as the premier adventure travel agency in the greater Woodville area.
3.1 Service Description
ATI is a full service agency and sells standard travel agency goods and services, including airfare and travel packages. Additional services include assistance with passports, providing access to top-of-the-line equipment and supplies, and a superior offering that includes access to better than average terrain and activities, accommodations, and entertainment. The value added of ATI’s offering is its knowledge and expertise, competitive rates, and specialty focus on adventure travel, which translates into increased satisfaction for the customer.
Adventure travel is divided into two categories, hard and soft adventure. Both hard and soft adventures involve active and athletic activities. Hard adventure activities, as the name suggests, generally consist of activities that involve risk and athletic competence. Soft adventure activities are less physically demanding and more passive than their hard adventure counterparts. Economic indicators suggest that an increased demand for adventure travel services exists. ATI can position itself as a niche service provider within the travel and tourism market and offer high quality travel packages for various sporting trips. ATI will serve the adventure travel market as a top quality, full service provider. All suppliers with whom ATI will deal will be top-notch professionals with accomplished backgrounds. If suppliers fail, at any time, to meet our rigid standards of quality, they will not be used.
3.2 Competitive Comparison
The travel agency market is competitive, and technology, namely the Internet and Computerized Reservation Systems (CRS), has changed the way travel agencies operate. The Internet gives agencies and individuals the ability to perform travel related research. Discount air fare brokers have taken advantage of the Internet by offering tickets on line at discounted rates. This has increased price competition. Computerized Reservation Systems have increased the speed and efficiency of the agency to customer transaction. They have also increased the start-up costs for travel agencies who wish to be competitive. Moreover, industry competition and the increased number of travel options available have made it necessary for smaller travel agencies to establish themselves as specialists in one or more types of travel. ATI has done this by positioning itself as an adventure travel specialist. ATI has not identified a direct competitor in the greater Woodville area. However, a travel agency does not have to be an adventure travel specialist to book an adventure travel trip. Therefore, ATI will compete with other Woodville area travel agencies as they offer alternatives to adventure travel, have the ability to arrange adventure travel themselves, and have the advantage of established relationships with clients.
3.3 Sales Literature
Brochures for travel locations, rental car companies, entertainment, etc. are obtained from the wholesale houses and service providers with whom ATI deals. Brochures for ATI are handled by a local graphic arts company and are mailed to potential customers upon request. Additional literature such as direct mail, print ads, and sales promotion materials will be utilized as needed. ATI will maintain a database from which customer/contact information will be drawn.
3.4 Fulfillment
ATI has established relationships with providers of travel related products and services. Two major airlines have been selected as our primary ticket providers in part because they do not cap the agent’s profit on tickets. This allows us to capture the 10% margin on ticket sales that was for many years the industry standard. Market research has enabled us to identify and establish working relationships with service providers around the world. ATI has been able to identify opportunities to capture margins of up to 25% from certain parties. Sourcing will be continuously evaluated. ATI will take advantage of trade shows, travel industry publications, and other sources of industry related information to monitor the quality of its offering.
3.5 Technology
ATI will rely on a Computerized Reservation System (CRS) for all client reservations. The CRS enables travel agencies to identify what the customer is looking for and make that information available quickly. It also increases the speed and efficiency with which ATI can communicate with suppliers. In addition, the CRS makes customer data storage and retrieval relatively simple. ATI will also make use of the Internet for market research and communications.
3.6 Future Services
ATI may in the future open agencies at additional locations. In addition, as the adventure travel market reaches maturity, ATI may participate in additional segments of the travel market. ATI is researching the market to identify potential opportunities for future sales. ATI’s long-term goal is to establish itself as an internationally recognized provider of top-of-the-line adventure travel. This goal does not prohibit ATI from participating in additional segments. It does, however, provide a corporate focus and a differentiated offering.
Market Analysis Summary
ATI plans to focus its initial efforts on the adventure travel market in the greater Woodville area. Adventure travel falls primarily under the leisure travel category. Revenues from leisure travel earned by U.S. travel agencies exceed $50 billion annually. Adventure travel is a sub-category of leisure travel and can be further broken down into hard and soft adventure travel. Annual expenditures in the U.S. market are estimated to be approximately $40-50 million for soft and $12-15 for hard adventure travelers.
4.1 Market Segmentation
ATI’s target customers are health-conscious couples and individuals, with median household incomes of approximately $50,000. They are interested in popular adventure activities such as skiing, whitewater sports, and mountain biking and major purchasers are located in urban areas within these states:
- California
- Florida
- New York
- Texas
- Illinois
- Nevada
- Hawaii
- New Jersey
- Pennsylvania
- Georgia
Adventure travelers are slightly more likely to be men between the ages of 18-34. However an increasing number of hard adventure travelers are women (some statistics suggest that women comprise 49% of the adventure market). Men on average spend more than women on their adventure travels. ATI’s primary customers, however, are married couples, ages 25-35, with children and household incomes over $50,000.
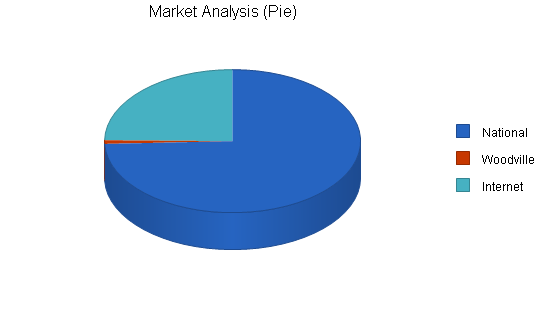
| Market Analysis | |||||||
| Year 1 | Year 2 | Year 3 | Year 4 | Year 5 | |||
| Potential Customers | Growth | CAGR | |||||
| National | 10% | 9,000,000 | 9,900,000 | 10,890,000 | 11,979,000 | 13,176,900 | 10.00% |
| Woodville | 15% | 100,000 | 115,000 | 132,250 | 152,088 | 174,901 | 15.00% |
| Internet | 20% | 3,000,000 | 3,600,000 | 4,320,000 | 5,184,000 | 6,220,800 | 20.00% |
| Total | 12.78% | 12,100,000 | 13,615,000 | 15,342,250 | 17,315,088 | 19,572,601 | 12.78% |
4.2 Target Market Segment Strategy
ATI is located in the heart of the Pacific Northwest. The natural beauty and abundance of outdoor activities attract many fitness oriented individuals. Per capita, the area has more people than any other in the nation who actively participate in mountain and water sports such as skiing, climbing, kayaking, whitewater rafting, mountain biking, etc. These are the people in ATI’s target market. ATI will focus on the sale and promotion of adventure travel primarily to individuals, but also to corporate clients in the Woodville area.
4.2.1 Market Trends
One notable trend in the travel industry is increased deregulation. Deregulation has increased the need for differentiation and has, in many cases, lowered the prices of airfare and other travel related services. Additional trends include caps on agency commissions by many of the larger airlines, increases in adventure travel, and reduction of profit margins. More than 50% of the U.S. adult traveling population, or 147 million people, have taken an adventure trip in their lifetime, 98 million in the past five years. Approximately 31 million adults have engaged in hard adventure activities like whitewater rafting, scuba diving, and mountain biking. An additional 25 million engaged in both a hard and soft adventure activity. Activities most commonly participated in during adventure vacations: camping (85%), hiking (74%), skiing (51%), snorkeling or scuba diving (30%), sailing (26%), kayaking or whitewater rafting (24%), and biking trips (24%). Customers tend to be young and affluent, ages 18-34, and one fourth are from households with annual incomes of $75,000 or more.
4.2.2 Market Growth
The travel industry is growing. Reasons for this growth include a healthy domestic economy and the devaluation of currency in other regions which has made travel less expensive for U.S. residents. Leisure travel has increased by 3.2% in 1997 and is predicted to grow 2.0% in 1998. The healthy economy has increased business which in turn boosted domestic business travel 4.8% in 1997 with an estimated increase of 3.6% in 1998. Adventure travel, which is growing 10% annually, is one of the fastest growing segments of the travel industry. Statistics show that 8,000 U.S. companies offered adventure packages that generated $7 billion in 1997. There also has been a 66% increase in executive participation in adventure travel between 1992 and 1996.
4.2.3 Market Needs
Many potential customers are unsure of the location they wish to reach. Part of the value associated with travel agencies is the knowledge they possess about destinations. Customers look to the agency to provide them with sound advice for a competitive price. ATI is confident in its ability to do so. Time is a precious commodity. ATI can save the customer time and money, and help to ensure that they are satisfied with their vacation.
4.3 Service Business Analysis
The U.S. travel and tourism industry is the nation’s third largest retail industry, and the U.S. Department of Commerce says that it will be number one by the year 2000. Revenues from travel have increased approximately 100% in the last decade. U.S. travel agencies produce over $100 billion in revenues each year. The market is separated into two main categories, business and leisure travel. Each contribute about 45% to total revenues. The remainder of revenues are generated from combined business/leisure trips. The market is further separated into domestic and international travel. Domestic travel accounts for approximately 70% of industry revenues. Business travel can be divided into two categories, the medium to large corporate account and the small independent businessman. Leisure travelers are classified according to the types of trips they take, income, or age.
The four primary leisure travel groups are:
- Adventure, Special-Interest, R&R, Honeymoons, and Sightseeing Trips.
- High-Income Travelers.
- Budget-Conscious Travelers.
- Families, Students and Seniors.
4.3.1 Competition and Buying Patterns
There are many activities and types of travel available to people contemplating an adventure vacation. These substitute products and services are one type of competition. Theme parks, motorhome trips, and cruises are just a few. Other substitutes include less expensive, self-planned, or trips geared towards more traditional types of vacations. In addition, potential customers do not have to vacation. Instead, they may elect to spend elsewhere, or invest the money they would have otherwise spent on a vacation. Direct competition can come from virtually any agency, and there are several agencies who specialize in adventure travel in the United States. Lifestyle, age, and disposable income influence the decision to travel and in which type of travel to participate. Adventure travelers make purchase decisions based upon their desire to combine athletic interests with vacation time. The average adventure traveler engages in one adventure travel vacation every 12-18 months.
4.3.2 Main Competitors
- Rollins & Hayes: Based on the east coast, Rollins & Hayes are the most well known and respected adventure travel agency in the world. They have been providing adventure travel packages for over twenty years. Rollins & Hayes have successfully integrated travel agency services and adventure travel activities. This offers them complete control over the entire vacation. They have the advantage of an established reputation, high-quality trips, economies of scale, and strategic alliances. However, their packages are expensive and appeal primarily to a high-income clientele.
- Sundance Travel: Based in Colorado, Sundance is a traditional agency and has been in business for 10 years. They have gradually made the move towards adventure travel specialists and are now recognized as such. Their strengths are experience, reputation, and financial solvency. Weaknesses may include high personnel and management turnover and the lack of a clear plan for future growth.
- Global Adventure Travel: Global was established in 1995 and they have successfully established themselves as adventure travel specialists. They are based in the Los Angeles area. Global has done a good job positioning themselves through successful marketing communications and management. The Los Angeles area contains a large adventure travel market. It is, however, a very competitive area.
4.3.3 Business Participants
The travel industry is similar to many others. There are large national chains, small home-based businesses, consolidators on the Internet, etc. Membership numbers in some of the travel related associations give some indication of the number of participants in this market. The American Society of Travel Agents (ASTA) reports 25,000 members in 135 countries, most of whom are small businesses. The Association of Retail Travel Agencies (ARTA) has another 3,000 members. In addition, there are many agencies not affiliated with these associations but with one or more of the approximately 35 travel industry organizations in the country. ATI has approximately 30 immediate competitors in the greater Woodville area, including two agencies that are branches of national travel agency chains.
4.3.4 Distributing a Service
The primary distribution pattern in the travel industry is from supplier to agent to consumer. Distribution between supplier and agency is regulated by a conference system. The two conferences through which agencies gain access to air travel providers are the Airline Reporting Corporation (ARC) and the International Airlines Travel Agents Network (IATAN). These suppliers can be contacted through Computerized Reservation System (CRS). Travel agencies receive a supply of blank airline ticket vouchers from the ARC. The agency is responsible for proper storage of and collecting payments for the vouchers. One notable change in the distribution channel has occurred. Wholesale houses have started buying large quantities of airline tickets and selling online for reduced prices.
Strategy and Implementation Summary
In order to reach its goal of becoming the Pacific Northwest’s premiere adventure travel agency, ATI will adopt the following strategy:
- Establish ATI’s reputation as a differentiated, specialty provider of adventure travel. This will be accomplished through a diverse marketing communications program at ATI’s target market, utilizing various media.
- Provide unparalleled service to the people of Woodville in order to gain repeat business and build trust. This will include providing superior service in all phases of the transaction, including timely follow-through.
- Aggressively promote adventure sports as healthy and exciting activities and those who participate in them as pioneers, heroes, and true Pacific Northwesterners.
5.1 Value Proposition
The value proposition of ATI’s services comes from ATI’s experience with and love of adventure sports. ATI’s employees are confident in their ability to meet the needs of their customers because they share the customers’ enthusiasm for the activities ATI offers. ATI’s confidence and ability translates into confidence for the consumer and a starting point towards developing long-term relationships and trust.
5.2 Competitive Edge
ATI’s competitive edge is its focus, passion, and experience. ATI seeks to promote and provide access to adventure sports and travel. ATI provides a differentiated offering with the management experience, capital, and commitment to make it work.
5.3 Marketing Strategy
ATI adheres to the theory that the goal of business is to create and keep customers. Its marketing strategy will reflect this goal as it builds its reputation in the Woodville area. Though ATI operates in the travel industry, it provides much more than travel. ATI provides adventure and freedom. Many of ATI’s customers spend 50 weeks of the year in an office. ATI offers people the ability to get away and remember how much they love the challenge and excitement of an athletic endeavor. ATI will promote the benefits of adventure travel. These benefits include better health, excitement, personal growth, ear-to-ear grins, and a whole lot of fun.
5.3.1 Promotion Strategy
During ATI’s first year of operation it will hold a grand opening and will organize and sponsor several athletic events. Events will include an off-road triathlon, 10k race and 5k fun run, and a mountain bike race. ATI will provide various travel packages and other items as prizes. All ATI employees belong to local athletic clubs and will, through interaction with other members, promote ATI’s services. During the grand opening and other events, ATI will provide literature with information about the trips and activities. Negotiations with area health clubs have begun and additional promotions will likely occur through these strategic alliances. Specialty, rather than large national publications, will serve as media vehicles for ATI advertising. Local radio stations will also be used. Personal selling will also occur, though phone solicitation will be limited. ATI plans to occasionally station sales personnel in locations around Woodville such as shopping malls. ATI’s goal is to develop personal familiarity between its employees and the community.
5.3.2 Distribution Strategy
ATI’s distribution strategy will focus on the target market in the Woodville area to whom it will sell directly. Secondarily, ATI seeks to establish distribution capability on the World Wide Web. Doing so will improve ATI’s ability to establish a national reputation.
5.3.3 Marketing Programs
Customers will be reached through traditional marketing communication methods. Information has been located detailing profiles of both hard and soft adventure travelers, where they live, work, what they do, etc. Research suggests that many of our target customers, and travelers in general, are Internet savvy and many adventure travelers purchase over the Internet or buy through travel agents. As such, the Internet will serve as an appropriate and effective medium of communication. ATI will target the primary customer group initially. This group has been defined as persons who have purchased or are likely to purchase an adventure vacation. In addition to the Internet, methods by which we will communicate with customers will depend on the results of our marketing research. ATI will likely use trade or special interest magazines, mailing lists and direct mail, and personal selling. Initially, service will be introduced regionally. Sales will be extended into the national and global markets within a few years of operation. We hope to promote out of season services through frequent customer contact and through our own publication, most likely a monthly newsletter.
5.3.4 Positioning Statement
For individual and corporate clients who wish to participate in adventure travel, ATI is the premier adventure travel agency in the Pacific Northwest. ATI’s experience with and enthusiasm for adventure travel is displayed in the exceptional service, value, and advice it provides for the customer.
5.3.5 Pricing Strategy
Much of ATI’s pricing is determined by market standards. ATI will attempt to maintain margins of 10% on all airline travel. Margins on all other products and services vary depending upon the provider but are expected to average 20%. ATI will make every effort to maintain a competitive pricing policy. However, as ATI builds its reputation as the premier provider of adventure travel, it expects to earn the ability to charge a premium for its services.
5.4 Sales Strategy
ATI will sell the benefits of the services it offers and the activities it promotes. ATI sells the freedom that is part of a healthy and balanced lifestyle. The benefits of that lifestyle are many. People need to be reminded occasionally that there is more to life than building bigger barns. ATI can provide clients with all of the arrangements they can think of and likely many they would not have thought of. Our concern is not to maximize profits on any individual sale but to satisfy the customer. Doing so will reduce costs and increase profits in the long run. It is less expensive to maintain a relationship than it is to develop a new one. At ATI we believe in the benefits of the activities we promote, and we are confident that we can satisfy the desires of the seasoned adventure traveler and the newcomer alike.
Sales projections are detailed in the Yearly Sales Total chart.

5.4.1 Sales Forecast
Detailed projections are located in the Total Sales by Month table in the appendix. ATI expects sales to be slow in the first quarter of operation. Sales growth is estimated at 20% annually through year three of operation.

| Sales Forecast | |||
| Year 1 | Year 2 | Year 3 | |
| Sales | |||
| Woodville | $427,685 | $382,245 | $258,751 |
| National | $42,768 | $70,568 | $97,032 |
| Internet | $10,693 | $47,046 | $97,032 |
| Corporate | $53,058 | $88,210 | $194,063 |
| Total Sales | $534,204 | $588,069 | $646,878 |
| Direct Cost of Sales | Year 1 | Year 2 | Year 3 |
| Woodville | $333,595 | $294,329 | $196,651 |
| National | $33,900 | $54,337 | $73,744 |
| Internet | $8,417 | $36,225 | $73,744 |
| Corporate | $42,081 | $67,922 | $147,488 |
| Subtotal Direct Cost of Sales | $417,993 | $452,813 | $491,627 |
5.5 Strategic Alliances
Strategic alliances for promotion have been developed with Body Works Health Club, Woodville Whitewater, The Great Wall climbing gym, and several area retailers. Alliances with adventure trip providers in several U.S. states and foreign countries have also been established.
5.6 Milestones
ATI’s important milestones are detailed in the following table. The milestones reflect ATI’s philosophy that it is important for a company to set goals. Goals determine strategy and tactics, and help to maintain corporate focus. The milestones can be seen as progress points and will be used as a way to measure ATI’s success in reaching its goals.
| Milestones | |||||
| Milestone | Start Date | End Date | Budget | Manager | Department |
| Grand Opening & Giveaway | 9/1/1999 | 11/1/1999 | $1,500 | Jordan Barnes | Marketing |
| Breakeven | 1/2/2000 | 1/2/2001 | $0 | Paul Mclean | Accounting |
| World Wide Web sales capability | 9/15/1999 | 1/1/2000 | $5,000 | Steve Fergusee | Sales |
| Strategic Alliance Development program | 9/1/1999 | 12/1/1999 | $1,500 | Shea Delaney | Managers |
| Totals | $8,000 | ||||
Management Summary
Shea Delaney will act as the General Manager. However, ATI is a small organization and its employees will share in management duties and decision making. It will be important for each member of the team to be capable in all aspects of the business. Prerequisites for all ATI employees include at least five years travel industry experience, knowledge and ability in the types of activities ATI will promote, and Certified Travel Counselor (CTC) certification for applicable positions. The CTC designation can be obtained through the Institute of Certified Travel Agents (ICTA).
6.1 Organizational Structure
ATI will begin operations with 4 full-time positions. The positions are as follows.
General Manager and President: Shea Delaney, age 37, B.A. Marketing Management, University of California Santa Cruz. Shea has 12 years experience in the travel industry, including five years experience as manager of the Transworld travel agency, Southern California branch. As manager at Transworld, Shea increased revenues by $1.5 million and established the adventure travel division which, in its first 18 months, generated an additional $400,00 in revenues. His background in adventure sports includes four years on the U.S. pro kayaking tour, two years as a sponsored cross-country mountain bike racer, 25 years surfing, including three years as an amateur competitor, and participation in many other adventure and organized sports such as snowboarding, beach volleyball, and track and field.
Marketing and Advertising Director: Jordan Barnes, age 31, B.S. Communications, Brigham Young University. Jordan spent five years as an adventure travel and freelance writer and has been a marketing consultant specializing in adventure sports for the past three years. Jordan has an extensive mountaineering background and has summitted three 8,000 meter peaks, including Everest. In addition to mountaineering, Jordan is an avid climber and has skied since the age of five.
Accountant: Paul Mclellan, age 45, B.S. Accounting, University of Alaska, Anchorage. Paul is an accountant and an Alaskan. His ability with numbers has helped keep his mind occupied during competition in the Iditarod, marathons, and mountaineering expeditions. Paul worked as an auditor for the State of Alaska for four years after college and then as an accounting department manager for a non-profit organization for another four years. Before going back to school and earning his degree, Paul was a commercial sport fisherman out of Homer, Alaska. During that time he established connections with many service providers in the state of Alaska. ATI will capitalize on these connections as Alaska is a popular destination amongst adventure travelers.
Travel Agent #1: Sue Taylor, Certified Travel Counselor. Sue has eight years experience as a travel counselor. She is an avid cyclist, runner, and kayaker. In addition, Sue has traveled extensively and has first-hand knowledge of many of the destinations our clients wish to reach. Her trips include a year-long trek in South America, four months in Nepal, and a four-month stint as a ski instructor in Wanaka, New Zealand.
6.2 Personnel Plan
The personnel plan depicts ATI’s anticipated head count for the start up year. The following table provides more detailed information. ATI does not anticipate the need to significantly increase personnel in the first 2-3 years.
| Personnel Plan | |||
| Year 1 | Year 2 | Year 3 | |
| Manager/President | $6,000 | $6,240 | $6,490 |
| Accountant | $13,200 | $13,728 | $14,277 |
| Travel Agent | $12,000 | $12,480 | $12,979 |
| Marketing & Advertising Dir. | $13,800 | $13,800 | $13,800 |
| Total People | 4 | 4 | 4 |
| Total Payroll | $45,000 | $46,248 | $47,546 |
Financial Plan
ATI’s financial plan is detailed in following sections. Preliminary estimates suggest that ATI will experience slow growth in the first two quarters of operation. This is partly due to ATI’s status as a start-up company and seasonal factors. Income estimates are based, in part, on anticipated revenues from accounts that were secured by ATI employees prior to their departure from former employers. ATI has sufficient cash to endure the negative cash flow situation that it may encounter initially. ATI also anticipates an increase in gross margin and sales volume. Thus, the overall financial plan presents a conservative but realistic depiction of ATI’s financial position.
7.1 Important Assumptions
ATI assumes the following:
- Market growth projections for the travel industry and for adventure travel are accurate.
- National economic conditions, which are favorable to the travel industry, will not experience significant decline in the next five years.
- International conditions will remain favorable for service providers and ATI will be able to maintain those relationships.
| General Assumptions | |||
| Year 1 | Year 2 | Year 3 | |
| Plan Month | 1 | 2 | 3 |
| Current Interest Rate | 10.00% | 10.00% | 10.00% |
| Long-term Interest Rate | 10.00% | 10.00% | 10.00% |
| Tax Rate | 30.00% | 30.00% | 30.00% |
| Other | 0 | 0 | 0 |
7.2 Key Financial Indicators
The following chart indicates ATI’s key financial indicators for the first three years. ATI anticipates growth in sales with relatively stable operating expenses. Favorable economic conditions and forecasts of continued growth in the adventure travel market support ATI’s planned financial success.

7.3 Break-even Analysis
The following table details ATI’s break-even analysis, including monthly sales break-even points.
Break-even calculations assume a 20% gross margin. This is a conservative estimate, and it will be improved as strategic relationships develop and the benefits of ATI’s offerings are realized by customers.

| Break-even Analysis | |
| Monthly Revenue Break-even | $33,902 |
| Assumptions: | |
| Average Percent Variable Cost | 78% |
| Estimated Monthly Fixed Cost | $7,375 |
7.4 Projected Profit and Loss
ATI’s profit picture improves as operations progress into the third quarter of the first year of operation. ATI anticipates improving its gross margin from 22% in year one to 23% in year two. Annual estimates of profit and loss are detailed in the following table.


| Pro Forma Profit and Loss | |||
| Year 1 | Year 2 | Year 3 | |
| Sales | $534,204 | $588,069 | $646,878 |
| Direct Cost of Sales | $417,993 | $452,813 | $491,627 |
| Other Costs of Sales | $0 | $0 | $0 |
| Total Cost of Sales | $417,993 | $452,813 | $491,627 |
| Gross Margin | $116,211 | $135,256 | $155,251 |
| Gross Margin % | 21.75% | 23.00% | 24.00% |
| Expenses | |||
| Payroll | $45,000 | $46,248 | $47,546 |
| Marketing/Promotion | $26,100 | $26,280 | $26,280 |
| Depreciation | $0 | $0 | $0 |
| Rent | $10,500 | $10,500 | $10,500 |
| Utilities | $4,500 | $4,500 | $4,500 |
| Insurance | $2,400 | $2,400 | $2,400 |
| Payroll Taxes | $0 | $0 | $0 |
| Other | $0 | $0 | $0 |
| Total Operating Expenses | $88,500 | $89,928 | $91,226 |
| Profit Before Interest and Taxes | $27,711 | $45,328 | $64,025 |
| EBITDA | $27,711 | $45,328 | $64,025 |
| Interest Expense | $8,078 | $7,330 | $6,550 |
| Taxes Incurred | $5,890 | $11,399 | $17,243 |
| Net Profit | $13,743 | $26,599 | $40,233 |
| Net Profit/Sales | 2.57% | 4.52% | 6.22% |
7.5 Projected Cash Flow
Monthly cash flow is shown in the following illustration. Annual cash flow figures are estimated based on a 60-day collection period. Cash flow for the first year of operation becomes positive mid-year.

| Pro Forma Cash Flow | |||
| Year 1 | Year 2 | Year 3 | |
| Cash Received | |||
| Cash from Operations | |||
| Cash Sales | $400,653 | $441,052 | $485,159 |
| Cash from Receivables | $100,048 | $143,639 | $158,031 |
| Subtotal Cash from Operations | $500,701 | $584,691 | $643,190 |
| Additional Cash Received | |||
| Sales Tax, VAT, HST/GST Received | $0 | $0 | $0 |
| New Current Borrowing | $0 | $0 | $0 |
| New Other Liabilities (interest-free) | $0 | $0 | $0 |
| New Long-term Liabilities | $0 | $0 | $0 |
| Sales of Other Current Assets | $0 | $0 | $0 |
| Sales of Long-term Assets | $0 | $0 | $0 |
| New Investment Received | $0 | $0 | $0 |
| Subtotal Cash Received | $500,701 | $584,691 | $643,190 |
| Expenditures | Year 1 | Year 2 | Year 3 |
| Expenditures from Operations | |||
| Cash Spending | $45,000 | $46,248 | $47,546 |
| Bill Payments | $415,328 | $533,008 | $555,493 |
| Subtotal Spent on Operations | $460,328 | $579,256 | $603,039 |
| Additional Cash Spent | |||
| Sales Tax, VAT, HST/GST Paid Out | $0 | $0 | $0 |
| Principal Repayment of Current Borrowing | $0 | $0 | $0 |
| Other Liabilities Principal Repayment | $0 | $0 | $0 |
| Long-term Liabilities Principal Repayment | $7,800 | $7,800 | $7,800 |
| Purchase Other Current Assets | $0 | $0 | $0 |
| Purchase Long-term Assets | $0 | $0 | $0 |
| Dividends | $0 | $0 | $0 |
| Subtotal Cash Spent | $468,128 | $587,056 | $610,839 |
| Net Cash Flow | $32,574 | ($2,365) | $32,351 |
| Cash Balance | $67,574 | $65,208 | $97,559 |
7.6 Projected Balance Sheet
The pro forma balance sheet indicates sustained and planned growth. Net worth improves considerably in year two and will provide ATI with a strong financial position. Monthly estimates are included in the appendix.
| Pro Forma Balance Sheet | |||
| Year 1 | Year 2 | Year 3 | |
| Assets | |||
| Current Assets | |||
| Cash | $67,574 | $65,208 | $97,559 |
| Accounts Receivable | $33,503 | $36,881 | $40,569 |
| Other Current Assets | $17,500 | $17,500 | $17,500 |
| Total Current Assets | $118,576 | $119,589 | $155,628 |
| Long-term Assets | |||
| Long-term Assets | $26,925 | $26,925 | $26,925 |
| Accumulated Depreciation | $0 | $0 | $0 |
| Total Long-term Assets | $26,925 | $26,925 | $26,925 |
| Total Assets | $145,501 | $146,514 | $182,553 |
| Liabilities and Capital | Year 1 | Year 2 | Year 3 |
| Current Liabilities | |||
| Accounts Payable | $60,133 | $42,347 | $45,953 |
| Current Borrowing | $0 | $0 | $0 |
| Other Current Liabilities | $0 | $0 | $0 |
| Subtotal Current Liabilities | $60,133 | $42,347 | $45,953 |
| Long-term Liabilities | $77,200 | $69,400 | $61,600 |
| Total Liabilities | $137,333 | $111,747 | $107,553 |
| Paid-in Capital | $18,000 | $18,000 | $18,000 |
| Retained Earnings | ($23,575) | ($9,832) | $16,767 |
| Earnings | $13,743 | $26,599 | $40,233 |
| Total Capital | $8,168 | $34,767 | $75,000 |
| Total Liabilities and Capital | $145,501 | $146,514 | $182,553 |
| Net Worth | $8,168 | $34,767 | $75,000 |
7.7 Business Ratios
The following table details our primary business ratios. Initial analysis indicates that ATI’s ratios for profitability, risk, and return are financially favorable and will improve greatly in year two of operation. Industry Profile ratios are based on Standard Industry Classification (SIC) Index code 4724.
| Ratio Analysis | ||||
| Year 1 | Year 2 | Year 3 | Industry Profile | |
| Sales Growth | 0.00% | 10.08% | 10.00% | 4.00% |
| Percent of Total Assets | ||||
| Accounts Receivable | 23.03% | 25.17% | 22.22% | 25.20% |
| Other Current Assets | 12.03% | 11.94% | 9.59% | 38.80% |
| Total Current Assets | 81.50% | 81.62% | 85.25% | 64.00% |
| Long-term Assets | 18.50% | 18.38% | 14.75% | 36.00% |
| Total Assets | 100.00% | 100.00% | 100.00% | 100.00% |
| Current Liabilities | 41.33% | 28.90% | 25.17% | 39.60% |
| Long-term Liabilities | 53.06% | 47.37% | 33.74% | 16.30% |
| Total Liabilities | 94.39% | 76.27% | 58.92% | 55.90% |
| Net Worth | 5.61% | 23.73% | 41.08% | 44.10% |
| Percent of Sales | ||||
| Sales | 100.00% | 100.00% | 100.00% | 100.00% |
| Gross Margin | 21.75% | 23.00% | 24.00% | 38.30% |
| Selling, General & Administrative Expenses | 19.18% | 18.48% | 17.78% | 27.50% |
| Advertising Expenses | 0.00% | 0.00% | 0.00% | 0.40% |
| Profit Before Interest and Taxes | 5.19% | 7.71% | 9.90% | 1.30% |
| Main Ratios | ||||
| Current | 1.97 | 2.82 | 3.39 | 1.44 |
| Quick | 1.97 | 2.82 | 3.39 | 1.13 |
| Total Debt to Total Assets | 94.39% | 76.27% | 58.92% | 55.90% |
| Pre-tax Return on Net Worth | 240.36% | 109.29% | 76.63% | 3.20% |
| Pre-tax Return on Assets | 13.49% | 25.93% | 31.48% | 7.20% |
| Additional Ratios | Year 1 | Year 2 | Year 3 | |
| Net Profit Margin | 2.57% | 4.52% | 6.22% | n.a |
| Return on Equity | 168.25% | 76.51% | 53.64% | n.a |
| Activity Ratios | ||||
| Accounts Receivable Turnover | 3.99 | 3.99 | 3.99 | n.a |
| Collection Days | 56 | 87 | 87 | n.a |
| Accounts Payable Turnover | 7.91 | 12.17 | 12.17 | n.a |
| Payment Days | 27 | 36 | 29 | n.a |
| Total Asset Turnover | 3.67 | 4.01 | 3.54 | n.a |
| Debt Ratios | ||||
| Debt to Net Worth | 16.81 | 3.21 | 1.43 | n.a |
| Current Liab. to Liab. | 0.44 | 0.38 | 0.43 | n.a |
| Liquidity Ratios | ||||
| Net Working Capital | $58,443 | $77,242 | $109,675 | n.a |
| Interest Coverage | 3.43 | 6.18 | 9.77 | n.a |
| Additional Ratios | ||||
| Assets to Sales | 0.27 | 0.25 | 0.28 | n.a |
| Current Debt/Total Assets | 41% | 29% | 25% | n.a |
| Acid Test | 1.41 | 1.95 | 2.50 | n.a |
| Sales/Net Worth | 65.40 | 16.91 | 8.63 | n.a |
| Dividend Payout | 0.00 | 0.00 | 0.00 | n.a |
Appendix
| Sales Forecast | |||||||||||||
| Month 1 | Month 2 | Month 3 | Month 4 | Month 5 | Month 6 | Month 7 | Month 8 | Month 9 | Month 10 | Month 11 | Month 12 | ||
| Sales | |||||||||||||
| Woodville | 0% | $20,000 | $22,000 | $24,200 | $26,620 | $29,282 | $32,210 | $35,431 | $38,974 | $42,872 | $47,159 | $51,875 | $57,062 |
| National | 0% | $2,000 | $2,200 | $2,420 | $2,662 | $2,928 | $3,221 | $3,543 | $3,897 | $4,287 | $4,716 | $5,188 | $5,706 |
| Internet | 0% | $500 | $550 | $605 | $666 | $732 | $805 | $886 | $974 | $1,072 | $1,179 | $1,297 | $1,427 |
| Corporate | 0% | $2,500 | $2,750 | $3,025 | $3,328 | $3,660 | $4,026 | $4,026 | $4,872 | $5,359 | $5,895 | $6,484 | $7,133 |
| Total Sales | $25,000 | $27,500 | $30,250 | $33,276 | $36,602 | $40,262 | $43,886 | $48,717 | $53,590 | $58,949 | $64,844 | $71,328 | |
| Direct Cost of Sales | Month 1 | Month 2 | Month 3 | Month 4 | Month 5 | Month 6 | Month 7 | Month 8 | Month 9 | Month 10 | Month 11 | Month 12 | |
| Woodville | $15,600 | $17,160 | $18,876 | $20,764 | $22,840 | $25,124 | $27,636 | $30,400 | $33,440 | $36,784 | $40,463 | $44,508 | |
| National | $1,560 | $1,716 | $1,888 | $2,076 | $2,824 | $2,512 | $2,764 | $3,040 | $3,344 | $3,678 | $4,047 | $4,451 | |
| Internet | $390 | $429 | $472 | $519 | $571 | $628 | $691 | $836 | $836 | $920 | $1,012 | $1,113 | |
| Corporate | $1,950 | $2,145 | $2,360 | $2,596 | $2,855 | $3,140 | $3,455 | $4,180 | $4,180 | $4,598 | $5,058 | $5,564 | |
| Subtotal Direct Cost of Sales | $19,500 | $21,450 | $23,596 | $25,955 | $29,090 | $31,404 | $34,546 | $38,456 | $41,800 | $45,980 | $50,580 | $55,636 | |
| Personnel Plan | |||||||||||||
| Month 1 | Month 2 | Month 3 | Month 4 | Month 5 | Month 6 | Month 7 | Month 8 | Month 9 | Month 10 | Month 11 | Month 12 | ||
| Manager/President | 0% | $500 | $500 | $500 | $500 | $500 | $500 | $500 | $500 | $500 | $500 | $500 | $500 |
| Accountant | 0% | $1,100 | $1,100 | $1,100 | $1,100 | $1,100 | $1,100 | $1,100 | $1,100 | $1,100 | $1,100 | $1,100 | $1,100 |
| Travel Agent | 0% | $1,000 | $1,000 | $1,000 | $1,000 | $1,000 | $1,000 | $1,000 | $1,000 | $1,000 | $1,000 | $1,000 | $1,000 |
| Marketing & Advertising Dir. | 0% | $1,150 | $1,150 | $1,150 | $1,150 | $1,150 | $1,150 | $1,150 | $1,150 | $1,150 | $1,150 | $1,150 | $1,150 |
| Total People | 4 | 4 | 4 | 4 | 4 | 4 | 4 | 4 | 4 | 4 | 4 | 4 | |
| Total Payroll | $3,750 | $3,750 | $3,750 | $3,750 | $3,750 | $3,750 | $3,750 | $3,750 | $3,750 | $3,750 | $3,750 | $3,750 | |
| Pro Forma Profit and Loss | |||||||||||||
| Month 1 | Month 2 | Month 3 | Month 4 | Month 5 | Month 6 | Month 7 | Month 8 | Month 9 | Month 10 | Month 11 | Month 12 | ||
| Sales | $25,000 | $27,500 | $30,250 | $33,276 | $36,602 | $40,262 | $43,886 | $48,717 | $53,590 | $58,949 | $64,844 | $71,328 | |
| Direct Cost of Sales | $19,500 | $21,450 | $23,596 | $25,955 | $29,090 | $31,404 | $34,546 | $38,456 | $41,800 | $45,980 | $50,580 | $55,636 | |
| Other Costs of Sales | $0 | $0 | $0 | $0 | $0 | $0 | $0 | $0 | $0 | $0 | $0 | $0 | |
| Total Cost of Sales | $19,500 | $21,450 | $23,596 | $25,955 | $29,090 | $31,404 | $34,546 | $38,456 | $41,800 | $45,980 | $50,580 | $55,636 | |
| Gross Margin | $5,500 | $6,050 | $6,654 | $7,321 | $7,512 | $8,858 | $9,340 | $10,261 | $11,790 | $12,969 | $14,264 | $15,692 | |
| Gross Margin % | 22.00% | 22.00% | 22.00% | 22.00% | 20.52% | 22.00% | 21.28% | 21.06% | 22.00% | 22.00% | 22.00% | 22.00% | |
| Expenses | |||||||||||||
| Payroll | $3,750 | $3,750 | $3,750 | $3,750 | $3,750 | $3,750 | $3,750 | $3,750 | $3,750 | $3,750 | $3,750 | $3,750 | |
| Marketing/Promotion | $2,175 | $2,175 | $2,175 | $2,175 | $2,175 | $2,175 | $2,175 | $2,175 | $2,175 | $2,175 | $2,175 | $2,175 | |
| Depreciation | $0 | $0 | $0 | $0 | $0 | $0 | $0 | $0 | $0 | $0 | $0 | $0 | |
| Rent | $875 | $875 | $875 | $875 | $875 | $875 | $875 | $875 | $875 | $875 | $875 | $875 | |
| Utilities | $375 | $375 | $375 | $375 | $375 | $375 | $375 | $375 | $375 | $375 | $375 | $375 | |
| Insurance | $200 | $200 | $200 | $200 | $200 | $200 | $200 | $200 | $200 | $200 | $200 | $200 | |
| Payroll Taxes | 15% | $0 | $0 | $0 | $0 | $0 | $0 | $0 | $0 | $0 | $0 | $0 | $0 |
| Other | $0 | $0 | $0 | $0 | $0 | $0 | $0 | $0 | $0 | $0 | $0 | $0 | |
| Total Operating Expenses | $7,375 | $7,375 | $7,375 | $7,375 | $7,375 | $7,375 | $7,375 | $7,375 | $7,375 | $7,375 | $7,375 | $7,375 | |
| Profit Before Interest and Taxes | ($1,875) | ($1,325) | ($721) | ($54) | $137 | $1,483 | $1,965 | $2,886 | $4,415 | $5,594 | $6,889 | $8,317 | |
| EBITDA | ($1,875) | ($1,325) | ($721) | ($54) | $137 | $1,483 | $1,965 | $2,886 | $4,415 | $5,594 | $6,889 | $8,317 | |
| Interest Expense | $703 | $698 | $692 | $687 | $681 | $676 | $670 | $665 | $660 | $654 | $649 | $643 | |
| Taxes Incurred | ($773) | ($607) | ($424) | ($222) | ($163) | $242 | $388 | $666 | $1,127 | $1,482 | $1,872 | $2,302 | |
| Net Profit | ($1,805) | ($1,416) | ($989) | ($518) | ($381) | $565 | $906 | $1,555 | $2,629 | $3,458 | $4,368 | $5,372 | |
| Net Profit/Sales | -7.22% | -5.15% | -3.27% | -1.56% | -1.04% | 1.40% | 2.06% | 3.19% | 4.91% | 5.87% | 6.74% | 7.53% | |
| Pro Forma Cash Flow | |||||||||||||
| Month 1 | Month 2 | Month 3 | Month 4 | Month 5 | Month 6 | Month 7 | Month 8 | Month 9 | Month 10 | Month 11 | Month 12 | ||
| Cash Received | |||||||||||||
| Cash from Operations | |||||||||||||
| Cash Sales | $18,750 | $20,625 | $22,688 | $24,957 | $27,452 | $30,197 | $32,915 | $36,538 | $40,193 | $44,212 | $48,633 | $53,496 | |
| Cash from Receivables | $0 | $208 | $6,271 | $6,898 | $7,588 | $8,347 | $9,181 | $10,096 | $11,012 | $12,220 | $13,442 | $14,786 | |
| Subtotal Cash from Operations | $18,750 | $20,833 | $28,958 | $31,855 | $35,039 | $38,543 | $42,096 | $46,633 | $51,204 | $56,432 | $62,075 | $68,282 | |
| Additional Cash Received | |||||||||||||
| Sales Tax, VAT, HST/GST Received | 0.00% | $0 | $0 | $0 | $0 | $0 | $0 | $0 | $0 | $0 | $0 | $0 | $0 |
| New Current Borrowing | $0 | $0 | $0 | $0 | $0 | $0 | $0 | $0 | $0 | $0 | $0 | $0 | |
| New Other Liabilities (interest-free) | $0 | $0 | $0 | $0 | $0 | $0 | $0 | $0 | $0 | $0 | $0 | $0 | |
| New Long-term Liabilities | $0 | $0 | $0 | $0 | $0 | $0 | $0 | $0 | $0 | $0 | $0 | $0 | |
| Sales of Other Current Assets | $0 | $0 | $0 | $0 | $0 | $0 | $0 | $0 | $0 | $0 | $0 | $0 | |
| Sales of Long-term Assets | $0 | $0 | $0 | $0 | $0 | $0 | $0 | $0 | $0 | $0 | $0 | $0 | |
| New Investment Received | $0 | $0 | $0 | $0 | $0 | $0 | $0 | $0 | $0 | $0 | $0 | $0 | |
| Subtotal Cash Received | $18,750 | $20,833 | $28,958 | $31,855 | $35,039 | $38,543 | $42,096 | $46,633 | $51,204 | $56,432 | $62,075 | $68,282 | |
| Expenditures | Month 1 | Month 2 | Month 3 | Month 4 | Month 5 | Month 6 | Month 7 | Month 8 | Month 9 | Month 10 | Month 11 | Month 12 | |
| Expenditures from Operations | |||||||||||||
| Cash Spending | $3,750 | $3,750 | $3,750 | $3,750 | $3,750 | $3,750 | $3,750 | $3,750 | $3,750 | $3,750 | $3,750 | $3,750 | |
| Bill Payments | $768 | $23,125 | $25,243 | $27,574 | $30,151 | $33,323 | $36,056 | $39,369 | $43,539 | $47,362 | $51,907 | $56,909 | |
| Subtotal Spent on Operations | $4,518 | $26,875 | $28,993 | $31,324 | $33,901 | $37,073 | $39,806 | $43,119 | $47,289 | $51,112 | $55,657 | $60,659 | |
| Additional Cash Spent | |||||||||||||
| Sales Tax, VAT, HST/GST Paid Out | $0 | $0 | $0 | $0 | $0 | $0 | $0 | $0 | $0 | $0 | $0 | $0 | |
| Principal Repayment of Current Borrowing | $0 | $0 | $0 | $0 | $0 | $0 | $0 | $0 | $0 | $0 | $0 | $0 | |
| Other Liabilities Principal Repayment | $0 | $0 | $0 | $0 | $0 | $0 | $0 | $0 | $0 | $0 | $0 | $0 | |
| Long-term Liabilities Principal Repayment | $650 | $650 | $650 | $650 | $650 | $650 | $650 | $650 | $650 | $650 | $650 | $650 | |
| Purchase Other Current Assets | $0 | $0 | $0 | $0 | $0 | $0 | $0 | $0 | $0 | $0 | $0 | $0 | |
| Purchase Long-term Assets | $0 | $0 | $0 | $0 | $0 | $0 | $0 | $0 | $0 | $0 | $0 | $0 | |
| Dividends | $0 | $0 | $0 | $0 | $0 | $0 | $0 | $0 | $0 | $0 | $0 | $0 | |
| Subtotal Cash Spent | $5,168 | $27,525 | $29,643 | $31,974 | $34,551 | $37,723 | $40,456 | $43,769 | $47,939 | $51,762 | $56,307 | $61,309 | |
| Net Cash Flow | $13,582 | ($6,692) | ($685) | ($119) | $488 | $820 | $1,639 | $2,864 | $3,265 | $4,669 | $5,768 | $6,974 | |
| Cash Balance | $48,582 | $41,890 | $41,205 | $41,086 | $41,574 | $42,394 | $44,033 | $46,897 | $50,163 | $54,832 | $60,600 | $67,574 | |
| Pro Forma Balance Sheet | |||||||||||||
| Month 1 | Month 2 | Month 3 | Month 4 | Month 5 | Month 6 | Month 7 | Month 8 | Month 9 | Month 10 | Month 11 | Month 12 | ||
| Assets | Starting Balances | ||||||||||||
| Current Assets | |||||||||||||
| Cash | $35,000 | $48,582 | $41,890 | $41,205 | $41,086 | $41,574 | $42,394 | $44,033 | $46,897 | $50,163 | $54,832 | $60,600 | $67,574 |
| Accounts Receivable | $0 | $6,250 | $12,917 | $14,208 | $15,629 | $17,192 | $18,911 | $20,701 | $22,785 | $25,171 | $27,688 | $30,457 | $33,503 |
| Other Current Assets | $17,500 | $17,500 | $17,500 | $17,500 | $17,500 | $17,500 | $17,500 | $17,500 | $17,500 | $17,500 | $17,500 | $17,500 | $17,500 |
| Total Current Assets | $52,500 | $72,332 | $72,307 | $72,913 | $74,215 | $76,266 | $78,805 | $82,234 | $87,182 | $92,833 | $100,020 | $108,557 | $118,576 |
| Long-term Assets | |||||||||||||
| Long-term Assets | $26,925 | $26,925 | $26,925 | $26,925 | $26,925 | $26,925 | $26,925 | $26,925 | $26,925 | $26,925 | $26,925 | $26,925 | $26,925 |
| Accumulated Depreciation | $0 | $0 | $0 | $0 | $0 | $0 | $0 | $0 | $0 | $0 | $0 | $0 | $0 |
| Total Long-term Assets | $26,925 | $26,925 | $26,925 | $26,925 | $26,925 | $26,925 | $26,925 | $26,925 | $26,925 | $26,925 | $26,925 | $26,925 | $26,925 |
| Total Assets | $79,425 | $99,257 | $99,232 | $99,838 | $101,140 | $103,191 | $105,730 | $109,159 | $114,107 | $119,758 | $126,945 | $135,482 | $145,501 |
| Liabilities and Capital | Month 1 | Month 2 | Month 3 | Month 4 | Month 5 | Month 6 | Month 7 | Month 8 | Month 9 | Month 10 | Month 11 | Month 12 | |
| Current Liabilities | |||||||||||||
| Accounts Payable | $0 | $22,286 | $24,327 | $26,573 | $29,043 | $32,125 | $34,749 | $37,922 | $41,965 | $45,638 | $50,016 | $54,835 | $60,133 |
| Current Borrowing | $0 | $0 | $0 | $0 | $0 | $0 | $0 | $0 | $0 | $0 | $0 | $0 | $0 |
| Other Current Liabilities | $0 | $0 | $0 | $0 | $0 | $0 | $0 | $0 | $0 | $0 | $0 | $0 | $0 |
| Subtotal Current Liabilities | $0 | $22,286 | $24,327 | $26,573 | $29,043 | $32,125 | $34,749 | $37,922 | $41,965 | $45,638 | $50,016 | $54,835 | $60,133 |
| Long-term Liabilities | $85,000 | $84,350 | $83,700 | $83,050 | $82,400 | $81,750 | $81,100 | $80,450 | $79,800 | $79,150 | $78,500 | $77,850 | $77,200 |
| Total Liabilities | $85,000 | $106,636 | $108,027 | $109,623 | $111,443 | $113,875 | $115,849 | $118,372 | $121,765 | $124,788 | $128,516 | $132,685 | $137,333 |
| Paid-in Capital | $18,000 | $18,000 | $18,000 | $18,000 | $18,000 | $18,000 | $18,000 | $18,000 | $18,000 | $18,000 | $18,000 | $18,000 | $18,000 |
| Retained Earnings | ($23,575) | ($23,575) | ($23,575) | ($23,575) | ($23,575) | ($23,575) | ($23,575) | ($23,575) | ($23,575) | ($23,575) | ($23,575) | ($23,575) | ($23,575) |
| Earnings | $0 | ($1,805) | ($3,220) | ($4,209) | ($4,728) | ($5,109) | ($4,544) | ($3,638) | ($2,083) | $546 | $4,004 | $8,372 | $13,743 |
| Total Capital | ($5,575) | ($7,380) | ($8,795) | ($9,784) | ($10,303) | ($10,684) | ($10,119) | ($9,213) | ($7,658) | ($5,029) | ($1,571) | $2,797 | $8,168 |
| Total Liabilities and Capital | $79,425 | $99,257 | $99,232 | $99,838 | $101,140 | $103,191 | $105,730 | $109,159 | $114,107 | $119,758 | $126,945 | $135,482 | $145,501 |
| Net Worth | ($5,575) | ($7,380) | ($8,795) | ($9,784) | ($10,303) | ($10,684) | ($10,119) | ($9,213) | ($7,658) | ($5,029) | ($1,571) | $2,797 | $8,168 |


