
Aero Technologies
Executive Summary
Today the world is defined by the term ‘Information Age.’ All businesses, both large and small, require effective and efficient business communication solutions in order to continuously meet their customer expectations and attain a competitive advantage, and therefore be successful. Whether a company is large or small it is realized that, the right amount of financing, materials, talent, and experience are not enough to succeed without a good communication system in place that enables smooth transaction sealing. Communications is at the heart of regional and international integration, with the development of an efficient, cost effective and technologically advanced communications infrastructure essential to Botswana’s success in the global market. With the economies of most countries becoming increasingly sophisticated and knowledge-intensive, there is a greater need for the existence of an efficient network that will enable decision-makers to have access to timely and accurate data to facilitate decision-making and transaction sealing.
We are on the brink of penetrating a lucrative market in a rapidly growing industry. The current increase in the number of entrepreneurs, and competition among existing companies presents an opportunity for Aero Technologies to penetrate the market. Our services/products will be positioned very carefully. They will be of extremely high quality to ensure client satisfaction, supported by impeccable customer service. Aero Technologies will offer the expertise that a proactive oriented and market-opportunity seeking company needs to develop and maintain a good communications system. We intend to provide a number of necessary services the business community and to the public. Initial plans are to introduce five main lines of services, with the primary focus on Multimedia, Call Centre facility, Data Communications and IT, Financial Services, and Knowledge Consulting.
We realize that, for us to prosper, there is need to be flexible and responsive, to delight clients by providing them what they want, when they want it, and before the competition can offer it. The company intends to achieve this through a systematic approach that is customer-centric, and in which the customer’s business objectives enjoy top priority. This involves not only skill and depth of knowledge, but time devoted to studying a customer’s needs. Aero Technologies will view the provision of value-added services over the entire scope of our customers’ requirements as not only essential, but as a competitive advantage which the company protects as a key asset; from service concept to service provision, the intention will be to ensure that every policy and procedure, system and process has the objective of improving the flexibility and response of the whole company. There is a need for interaction between all functional areas, particularly between marketing and service logistics, if the project is to realize its full potential, with marketing being employed as a strategic weapon.
Once the needs and processes are understood and described, leading edge products and best-of-industry skills will be applied to design and develop a fitting solution to satisfy the need and enable the client’s business in the most cost effective way.
Our marketing strategy will be based mainly on ensuring customers know what need the service(s) is able to fulfill, and making the right service and information available to the right target client. We intend to implement a market penetration strategy that will ensure that our services are well known and respected in our respective industry. Our marketing strategy will convey the sense of quality and satisfaction in every picture, every promotion, and every publication. Our promotional strategy will involve integrating traditional advertising, breakfast seminars, events, Internet marketing, personal selling, public relations, and direct marketing, details of which are provided in the marketing section of this plan.
We intend to build our project management team correctly. We need the right people in the right place at the right time if we are to ensure optimum growth. We intend to develop our team so that our people can grow as the company grows — a mutually beneficial relationship.
The intention is to go into partnership with NNN Limited, a company registered in QQQ, and provide financial, IT, and data communications consultancy services to industries in the application and use of latest technologies such as data communication and Wireless Application Protocol (WAP), enabling cellular telecommunications.
In a nutshell, we don’t just intend to market and sell our service, but to market and provide a service that will ensure our client’s customer satisfaction, ease of communication, improved corporate logistics, and cost savings on transactions ensuring a total-quality environment. This will ensure we establish and maintain a reputable corporate image. However it should be noted that timing and information provision will be of the utmost importance and significance in terms of the project’s introduction onto the market. In addition we are appreciative of the fact that entering such a market is not a bed of roses, particularly as it is still a relatively new concept needing to be implanted in people’s minds in terms of the benefits it may bring to them, as well as the number of ‘laggard’ firms who often do not easily appreciate the need for change, be it to their benefit. In such a case the need will exist to aggressively market the concept to these organizations and individuals through various means. Hence the intention is to utilize the technical and business know-how of technical partners in order to implement and attain our business objectives.
NOTE: All currency values in this plan are expressed in Botswanan Pula [P].
1.1 Objectives
Our business strategy will revolve around the need to provide quality service and products to our various target clients, in the process fully satisfying their needs. This shall be undertaken through recruitment of a professional telemarketing, sales and technical team and the provision of good quality custom-designed services, catering for the clients’ particular needs.
With time our marketing campaign will increase the knowledge of our services to the various market segments we shall be targeting. This is particularly so with organizations looking at establishing a competitive advantage(s) on the market due to increased competition, hence providing them with the opportunity to focus on their core activities whilst procuring increased business from new and existing customers. Marketing material shall be professionally done so as to be reflective of our intended image and reputation. We shall position ourselves as a quality total communications solution service provider that strives to provide effective and efficient communication solutions. We intend to establish a good rapport with all the relevant stakeholders.
In summary we intend to attain the following objectives:
- Continuously provide professional quality services on time and on budget.
- Develop a follow-up strategy to gauge performance with all our clients.
- Implement and maintain a quality control system and assurance policy.
- To continuously formalize and measure cross-functional working communication so as to ensure that the various departments work harmoniously towards attainment of company objectives.
- To instill a culture of continuous improvement in beating standards of customer satisfaction and efficiency.
- We are fully committed to supporting growth and development in the economy.
1.2 Mission
Aero Technologies, Ltd. offers marketing oriented organizations a reliable, high-quality alternative to in-house resources for business development, market development, and channel development on a local and regional scale. A true alternative to in-house resources offers a very high level of practical experience, know-how, contacts, and confidentiality. Clients will know that working with Aero Technologies is a more professional, less risky way to undertake communication with its various stakeholders, than working completely in-house with their own people. Aero Technologies must also maintain financial balance, charge a reasonable value for its services, and deliver a higher value to its clients. Initial focus will be development in the regional markets, or for international clients in Botswana. Aero Technologies is also an excellent place to work, a professional environment that is challenging, rewarding, creative, and respectful of ideas and individuals. Aero Technologies ultimately provides excellent value to its customers and fair reward to its owners and employees.

Internally we intend to create and nurture a healthy, creative, respectful and enjoyable office environment, in which our employees are fairly compensated and encouraged to respect the customer and the quality of the service we provide. In addition follow-up will be mandatory so as ensure customer satisfaction and make any improvements as recommended by the customers in future. We seek fair and responsible profit, enough to keep the company financially healthy for the short and long term, and to fairly compensate investors for the money and risk.
1.3 Keys to Success
The keys to this project’s success will undoubtedly be effective market segmentation through identification of several niche markets and implementation strategies. Along these lines the company intends to implement personal selling and direct marketing strategies to the target markets. Hence the key success factors will include the following:
- Excellence in fulfilling the promise: Completely confidential, reliable, trustworthy expertise and service(s) through the provision of an uncompromising service. This dictates that we have in place the latest technology, hardware and software, and well-trained personnel so as to fulfill the aforesaid.
- Timely response to clients’ orders: We cannot afford to delay our clients for whatever reason, as this will have a negative bearing on our image and reputation, including future business. Hence we need to be continually communicating with the client ensuring we provide needs-based solutions.
- Skill and depth of knowledge: Considering the nature of our services and their relative infancy on the market, the skill and depth of knowledge of our personnel shall be of utmost importance in determining the provision of the service(s) to the end-users.
- Marketing know-how: In a relatively volatile market there will be a need to aggressively market our business and the services we provide so as to be continuously at the top of our prospective and current clients minds. This will also act as a temporary deterrent for companies contemplating entering our market. Advertising shall be one of our competitive advantages.
- Leveraging from a large pool of expertise: The company’s various alliances with technological partners shall prove invaluable considering the skills and intellectual capacity these partners will have in the fields of design and system integration, implementation and execution, lifecycle support and understanding, and in the application of new technology. This has the potential of proving to be an important differentiator on the market.
Company Summary
Aero Technologies, Ltd. was founded in November 1999 as a Private Limited Company through the foresight and vision of the three directors. It was formed as a division of TTT with the directors having identified a large potential market for their products and services. For most of its initial existence, the company intends to utilize the large database and experience of its directors in obtaining orders, with the intention of establishing close relationships with its clients.
2.1 Company Ownership
Aero Technologies is a company incorporated at the Registrar of Companies by XXX, YYY, and ZZZ. Though relatively new, the directors realize their company’s vast potential market and opportunity for growth given implementation of the appropriate strategies, aided by the necessary finances. Aero Technologies was established with 3,000 shares equally distributed amongst the directors.
2.2 Start-up Summary
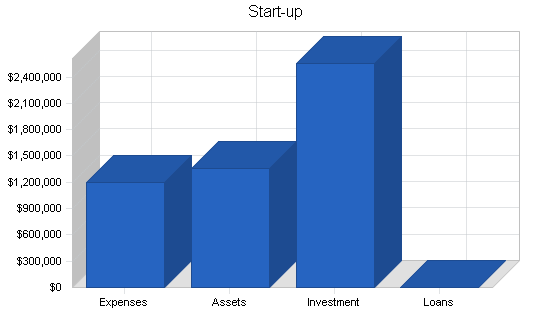
Total start-up expenses covered (including legal costs, logo design, stationery and related expenses) came to approximately P1,192,000. Start-up assets required and utilized included personal computers, vehicles, office furniture, and other office equipment.
NOTE: All currency values in this plan are expressed in Botswanan Pula [P].
| Start-up | |
| Requirements | |
| Start-up Expenses | |
| Legal | $2,000 |
| Stationery etc. | $2,000 |
| Brochures | $5,000 |
| Consultants | $5,000 |
| Supplier Contracts | $3,000 |
| Rent | $4,000 |
| Staff Training | $8,000 |
| Expensed Equipment | $1,135,000 |
| Other | $28,000 |
| Total Start-up Expenses | $1,192,000 |
| Start-up Assets | |
| Cash Required | $350,000 |
| Start-up Inventory | $0 |
| Other Current Assets | $0 |
| Long-term Assets | $1,012,400 |
| Total Assets | $1,362,400 |
| Total Requirements | $2,554,400 |
| Start-up Funding | |
| Start-up Expenses to Fund | $1,192,000 |
| Start-up Assets to Fund | $1,362,400 |
| Total Funding Required | $2,554,400 |
| Assets | |
| Non-cash Assets from Start-up | $1,012,400 |
| Cash Requirements from Start-up | $350,000 |
| Additional Cash Raised | $0 |
| Cash Balance on Starting Date | $350,000 |
| Total Assets | $1,362,400 |
| Liabilities and Capital | |
| Liabilities | |
| Current Borrowing | $0 |
| Long-term Liabilities | $0 |
| Accounts Payable (Outstanding Bills) | $0 |
| Other Current Liabilities (interest-free) | $0 |
| Total Liabilities | $0 |
| Capital | |
| Planned Investment | |
| Investor 1 | $1,000,000 |
| Investor 2 | $1,000,000 |
| Investor 3 | $554,400 |
| Additional Investment Requirement | $0 |
| Total Planned Investment | $2,554,400 |
| Loss at Start-up (Start-up Expenses) | ($1,192,000) |
| Total Capital | $1,362,400 |
| Total Capital and Liabilities | $1,362,400 |
| Total Funding | $2,554,400 |
Products and Services
Aero Technologies offers the expertise a proactive oriented and technologically inclined company needs to perform its operations efficiently and effectively, through allowing it to concentrate on its core activities whilst deploying the latest communication implements. Its wide range of solutions will incorporate and embrace customer contact centres, technology enabled relationship management, technology enabled marketing and technology enabled selling solutions, multi-service data and voice networking as well as Individualized Customer Relationship Management centres, integration services and Knowledge Management Consulting. Hence we intend to provide a number of necessary services to the business community, primarily the upper echelons, as well as the public. These can be summed up in five main areas:
- Multimedia
- Call Centre Facility
- Data Communications and IT
- Financial Services
- Knowledge Management.
Hence we intend to offer the expertise a high-technology company needs to develop new product distribution and new market segments in new markets. However it should be noted that the Knowledge Management Centre will invariably incorporate the functions of the other divisions.
3.1 SWOT Analysis
We are presently in a highly lucrative market in a rapidly growing economy. We foresee our strengths as the ability to respond timeously to the market dictates and to provide custom designed technological services. Our key personnel will have a wide and thorough knowledge of the technological services we intend to provide, and expertise, which will go a long way towards penetrating the market. Below are the summarized strengths, weaknesses, opportunities and threats.
3.2 Macroenvironment
Research indicates that the younger more ambitious market presently in the executive and overall business sector, being more educated and aware of the global environment, assesses and implements its core activities to a much higher degree than past trends have indicated. This is exacerbated by the increase in competition in all industries. Therefore with the emergence of this generation of individuals, the appreciation of quality services and business communication solutions/recommendations that provide for and enable company growth, dictates that our service lines will be popular.
The current drive by the government towards a more diversified economy presents an opportunity for our business to propel and excel in our intended markets, benefiting from the support of the concerned institutions and trade bodies. In addition with the country increasingly becoming an economic hub, we foresee a demand for high quality business communication solutions. Through undertaking our business activities professionally, we foresee that it should not be too difficult to gain market acceptance if we deliver the final service timeously and of good quality, at competitive rates.
3.3 Sales Literature
The business will begin with a general services brochure establishing the positioning of the company and services clients are able to benefit from. These shall be designed for the decision-makers ensuring they are not too technical, but short and concise. Literature and mailings shall also be designed in such a way that they establish a high-quality look and feel, in order to create and fulfill the right sense of professionalism. Breakfast seminars shall be undertaken in the initial period of the project targeting decision-makers and ensuring they understand the benefits of our services in today’s business environment. Another important marketing tool will be CD-ROMS. These shall be targeted at business executives who often do not have much time on their hands and are looking at utilizing every second productively. These CD-ROMS shall be most useful as they will listen to them whilst in transit from one business meeting to another.
We also intend to have well designed posters, table tents, T-shirts, mouse pads, keys-holders, and mugs distributed at strategic points and procured through reputable manufacturers so as not to compromise on quality. Potential strategic points for our literature include hotels, lodges, computer hardware and software distributors amongst others.
3.4 Technology
Aero Technologies will strive to maintain the latest business communication hardware and software capabilities so as to ensure we are continuously at the forefront in our market arena. The one certainty in our industry is that technology will continue to evolve and develop, changing what we market as well as how we market it. Our aim will be to be aware of the implications of this new technology and utilize it in our existing framework where possible. Complete presentation facilities for preparation and delivery of multimedia presentations on Macintosh or Windows machines, in formats that include on-disk presentation or video presentation are also possibilities that still are being looked into. We also intend to have the latest and most efficient software in place to enable smooth operations. Please see the capital equipment for further details.
3.5 Future Products and Services
In putting the project together we have attempted to offer enough services to allow us to always be in demand by our clients. However, technological developments have provided us with a new era of opportunities for the various organizations in which we can only guess at the needs. For example, current rapid innovations/ development of Wireless Application Protocol (WAP) technology, which is seeing a new service being introduced almost on a fortnightly basis overseas, presents an opportunity to be realized, particularly focusing on WAP enabled cellphones that enable individuals to access or send their email messages over the cellphone. There is also the possibility to introduce video-conferencing, as we will have the necessary infrastructure in place. Applications such as banking by cellphone, online telephone directories and delivery of breaking news headlines are also future services to be utilized. However, the most important factor in developing future services will be market need. Our understanding of the needs of our target market segments will be one of our competitive advantages. It is critical to our effort to develop the right new services.
Market Analysis Summary
We are today experiencing a rapid growth in the economy of unsurpassed nature. This has been brought about by, amongst other things, the relaxation of foreign exchange policies and macroeconomic policies geared towards attracting foreign investors into the country. The fiscal and monetary policies of the government geared towards maintaining growth with social justice have largely contributed towards this, evidenced by our economy averaging a growth rate of 7% since 1990 — very high by international standards.
The current drive and emphasis by the government on diversification of the industrial base away from the minerals sector presents an opportunity for Aero Technologies to make a valuable contribution towards achieving this goal. This will result in implementation of modern Information Technology services and techniques, and transfer of knowledge.
Aware of the fact that we will be operating in a predominantly infant market we intend to ensure that our marketing strategies are considerate of the importance of the fit between our services capabilities and benefits, and the target market, so as to develop a strong sustainable competitive position in the market. As a result we intend to implement a niche marketing strategy, focusing on certain target markets.
It should be appreciated that entering such a market is not a bed of roses, particularly considering its infancy and hence the intention will be to implement an aggressive marketing strategy, well supported by the other business functions. The above prognosis influenced our decision to enter the IT business communication service provision/consultancy industry.
4.1 Market Segmentation
We will be focusing on proactive, market seeking organizations, who want to sell into markets in the region and overseas. These are mostly larger companies, and occasionally medium-sized companies.
Our most important group of potential customers are business executives in large, medium and small corporations. These are marketing managers, general managers, sales managers, sometimes charged with international focus and sometimes charged with market or even specific channel focus. They do not want to waste their time or money looking for bargain information or questionable expertise. As they go into markets looking at new opportunities, they are very sensitive to risking their company’s name and reputation. Hence the need to professionally market our services and business as a whole, offering impeccable expertise. Our intention will be to offer an attractive development alternative to the company that is management constrained and unable to address opportunities in new markets and new market segments due to technological shortfalls.

| Market Analysis | |||||||
| Year 1 | Year 2 | Year 3 | Year 4 | Year 5 | |||
| Potential Customers | Growth | CAGR | |||||
| SOHO Executives | 1% | 100 | 101 | 102 | 103 | 104 | 0.99% |
| Professionals | 10% | 1,000 | 1,100 | 1,210 | 1,331 | 1,464 | 10.00% |
| Medium-sized Co. Executives | 14% | 2,100 | 2,394 | 2,729 | 3,111 | 3,547 | 14.00% |
| Large-sized Co. Executives | 19% | 2,850 | 3,392 | 4,036 | 4,803 | 5,716 | 19.00% |
| Academics | 1% | 150 | 151 | 152 | 153 | 154 | 0.66% |
| Total | 15.37% | 6,200 | 7,138 | 8,229 | 9,501 | 10,985 | 15.37% |
4.2 Target Market Segment Strategy
Our marketing strategy will be based mainly on making the right service(s) available to the right target customer. We will ensure that our services’ prices take into consideration organizations’/peoples’ budgets, and that these people appreciate the service and know that it exists, including where to find it. The marketing will convey the sense of quality in every picture, every promotion, and every publication. Our intention will be to target those innovative or proactive companies contemplating transferring a part of their marketing activities on the Internet, in order to benefit from the advantages offered by this unique system of communication. We realize the need to focus our marketing message and our service offerings. We need to develop our message, communicate it, and make good on it.
4.2.1 Market Needs
Aero Technologies intends to provide customers with the necessary systems and services to provide cutting-edge customer service, by essentially offering a certain spectrum of communications solutions, primarily the interaction applications.
We understand that our target markets need more than just continuous communication and information from their various stakeholders, but communication and information that will enable them to make more informed decisions and transactions at the earliest opportunity. We don’t just intend to provide a service(s), but to provide one of unparalleled nature relative to the market. Our target market are not businesses that want to make decisions solely on the basis of price, but instead are mainly concerned with having reliable providers of expertise and a good communications network in place.
4.2.2 Market Trends
Today we are passing through a technological discontinuity of epic proportions. The growth of the Internet shows no signs of abating and has profound implications for businesses not only in Africa, but also throughout the world. Though e-commerce is largely developed country-led, with the Americas and Europe in the forefront, this is slowly changing with more and more servers being set up in Asian and African countries, Botswana being no exception. As e-commerce knows no boundaries the intention of Aero Technologies will be to assist clients in undertaking communication and transactions with ease, initially on a regional level, but also at the global level. This has resulted in the significant trend toward greater international sales and communication between organizations throughout the world. Another important trend is the one toward greater use of specialized and focused consultants, instead of in-house resources. Companies are increasingly looking for more out-sourcing and, in general, a preference for variable costs instead of fixed costs. This shall have important implications on the acceptance of our services on the market.
In summary, the range and volume of products sold online are likely to increase vastly in the future, expanding the size and value of the electronic market. However, encouragement may be obtained from the fact that in its pursuit of diversification the Government of Botswana would very much encourage an additional player in the e-commerce market, provided they are of the right caliber and beneficial to the economy as a whole.
4.3 Service Business Analysis
A general market study about the benefits of wireless technology undertaken by Ovum Research, an international research company, was conducted on the use of cellular data communications and other conferencing facilities. The study notes that with the provision of wireless technology to various sub-Saharan countries, telecommunications systems could be profitably established.
The art of m-commerce relies on the convergence of Internet technologies, mobile devices, cellular phones, band-width and a whole lot of companies champing at the bit of m-commerce. M-commerce is about being able to transact business through any portable intelligent device and some of the greatest growth in the m-commerce arena is coming from the development of the cellular phone. The one wireless standard uniting and gaining momentum in the use of personal digital assistants (PDA) is the Wireless Application Protocol (WAP). This protocol uses wireless means to connect any mobile device to specific Internet information. The computing device has to be WAP enabling and only a few Internet sites have been set up to cope with WAP transactions.
It is an obvious fact that the wireless revolution will have a positive impact on the economic and social development of Africa. Africa’s critical requirement is to build infrastructure. Wireless technology overcomes infrastructure costs of setting up fixed lines. International research has projected that wireless portals will become a US$42 billion revenue opportunity by 2005 as mobile users, including those in Africa, increasingly shift their businesses and other transactions from PCs to their handsets. Banking, email, surfing the Web, and even shopping will now be done anywhere and at any time.
There is a significant demand for WAP, with the prime candidate being small businesses, sales forces, and field support engineers as well as growing numbers of mobile managers equipped with PCs and cellular phones. In this way WAP is an important step toward third-generation mobile networks.
New WAP enabling phones provide the user with email, personal organizer and the ability to check bank accounts, time schedules, restaurant menus and more. All these online interactive services are especially written and formatted to be accessed on cellular phones. The growing popularity of WAP phones (currently 25,000 in South Africa alone) has meant that a number of companies are developing Internet sites with the content to service the WAP devices on the market.
The above analysis indicates how the wireless technology will revolutionize African business and particularly the small businesses run by individuals that may not be able to afford the luxury of a PC but will always need a phone and acquire the same services offered by the PC through their mobile phones. It should also be noted that the IT industry is an environment where small niche players and developers can compete with the larger groups and corporations. An individual can have the vision or development skills to deliver a meaningful concept, product or service, but the weak links in this process are the focus to end-user requirements, financial support in the development stages and the effective channels to market for the finished product or service.
4.3.1 Competition and Buying Patterns
The key element in purchase or subscription decisions made at the company’s client level is trust in the professional reputation and reliability of the firm. The most important factor in this market will be the quality of the service. This is particularly so considering the potential impact e-commerce will have on organizations meeting their bottom lines. The very nature of our services dictates that occasionally the pricing of our projects and billing rates will be variable, as different clients require different needs to be fulfilled in variable industry environments.
In our line of business clients rarely compare service providers directly, looking for two, or more, possible providers of a proposed project or job. Usually they follow word-of-mouth recommendations and either go for the job or not, rather than selecting from a menu of possible providers.
The most important element of general competition, by far, is what it takes to keep clients for repeat business. It is worth making concessions in any single service to maintain a client relationship that brings the client back for future services — realizing customer-lifetime value.
4.3.2 Main Competitors
In identifying competition in this new concept market, we find few companies currently offering services similar to ours. There are numerous providers of the older established ancillary services including traditional call centres. Hence there will be a need to strongly differentiate ourselves from these other businesses and market the benefit of utilizing our service(s). However on a broader scale our competition comes in several forms:
- The most significant competition will be the traditional communication systems currently in place within the respective organizations, particularly considering advances in technology enabling these organizations (potential clients) to better handle their calls, inquiries, and transactions. Many organizations are currently investing in technological instruments that will enable them to better handle their customers. This is particularly so considering the advances that have been made in terms of customer relationship management and all its related hardware and software programs, many of which have not yet been fully exposed on the local and African markets. The current onset and wave of customer relationship management overseas does pose a serious challenge for Aero Technologies’s intended services, as they are bound to infiltrate into the region in the form of software programs and hardware components.
- The increasing investment in training by organizations also represents competition in the area of intent. With organizations striving to instill a performance culture through training there will be a need to market the benefits of utilizing our service in conjunction with these organizations’ respective communications systems. This is due to the fact that these same organizations may feel that there is no need to utilize our service(s) as they would have invested large amounts into hardware and customer handling training of front office personnel.
- Major potential competitors will include all those service providers that offer Internet, email, e-commerce, and other related services to the market. Examples include (Discussion omitted). These companies already have a firm footing in their Internet businesses and are carefully analyzing the prospects of e-commerce.
- Though currently not engaged in e-commerce, numerous other IT, marketing and advertising companies are also contemplating entering this market. They are seeking to utilize or focus on their core competencies in their respective markets, whilst taking advantage of the technological revolution in conjunction with strategic partners who are well versed in the technical aspects. The recent installation of a top-of-the range computer network (with Internet) system by FFF is one case in point, as they seek to tap the vast opportunity presented by e-commerce. The majority of these have alliances with international firms.
However, upon closer analysis of the above competitors it may be observed that several of these potential competitors also represent client opportunities to be realized by us.
4.3.3 Distributing a Service
Service provision and consulting will be sold and purchased mainly on a word-of-mouth basis, with relationships and previous experience being, by far, the most important factor. In this regard we intend to provide a service that exceeds customer expectations so as to ensure they refer us to potential clients through word-of-mouth. New business shall be developed through industry associations, business associations, and in some cases, social associations such as country clubs.
As our services are relatively new on both the Botswana and regional markets we intend to host breakfast seminars and workshops primarily for senior managers and decision-makers, who may benefit from our services. This function will involve a considerable amount of networking on our part, as these individuals often do not have a lot of spare time.
Strategy and Implementation Summary
Initially, Aero Technologies will focus on the local and regional markets in the previously mentioned services. The target customers will include key decision-makers in the large, medium, and small-sized organizations, be they in a start-up, stable, or growth period.
Our marketing strategy will emphasize focus. This will be the key. We are a relatively new company on the market and must focus on certain kinds of services with certain kinds of clients. The project will focus on the local and regional markets, expanding into the international markets as time progresses, and as we gain the necessary experience. The form of growth that shall be initially pursued will be that of organic growth mainly due to limited resources and the need to instill awareness and confidence in our services. The target customers will include key decision-makers, sales and marketing personnel involved in decision-making and transaction sealing.
- We intend to build image and awareness through consistency and distinctiveness in our service provision.
- We intend to focus on delivering quality services and end products that in turn produces good referrals, which can then generate revenue.
- We intend to always have a relatively heavy personal selling component to our marketing.
Our strategy is to (Discussion omitted).
Through the implementation of a fair, effective and competitive remuneration policy we intend to optimize our human resource output and advancement. We need the right people in the right place at the right time if we are to ensure optimum growth. We intend to develop our team so that our people can grow as the company grows — a mutually beneficial relationship. As a result we intend to vigorously search and find the right people for our organization.
5.1 Competitive Edge
A key factor to the future success of this project is the background and experience of the management team and strategic partners, and their ability to work the market based on an innate understanding of both the business processes and market structures. The delivery of whole, end-to-end solutions will have a significant impact on gaining commitment from the market at all levels. Therefore, the company believes in partnering with its customers to bring the future in communication and information technology into the customer contact zone. Inevitably this shall involve constant liaison with the client, a customer-centric approach that is need-based.
5.2 Marketing Strategy
One core element of our strategy will be that of differentiation from our competitors. In terms of marketing, we intend to sell our company as a differentiated strategic ally, not just our services. In price, we intend to offer reasonable and competitive prices in comparison to competition and we need to be able to sustain that. Market penetration through lower prices shall be undertaken where need be whilst premium pricing in the case of high quality services targeted at the upper-end of the market. Our service marketing will strive to ensure that we establish long-term relationships with clients. Our primary intention will be to sell a relationship more than services.
Our service marketing will emphasize the benefits of speed, interaction and flexibility to be gained from utilizing our services. The approach will be entirely needs-driven and a thorough understanding of the business requirements, business processes and technology strategy of the customer being the basis on which an Aero Technologies solution will be built. Once the needs and processes are understood and described, leading edge products and best-of-industry skills will be applied to design and develop a fitting solution to satisfy the need and enable the customer’s business in the most cost effective way.
5.2.1 Positioning Statement
Aero Technologies intends to be uniquely positioned to help customers apply communication and information technology products and skills to meet the challenges facing their businesses today. Our competitive edge will be our dominance of the market as early entrants, customer orientation and traditional hard work. Though our clients might range from large corporations to medium or even small businesses, what is important to the client irrespective of the size or industry is total satisfaction with the end product matched to their capabilities and resources.
5.2.2 Pricing Strategy
Aero Technologies will be competitively priced in relation to the dictates of the market. The pricing fits with the general positioning of Aero Technologies as providing high-level quality service and expertise. Due to the introductory nature of the vast majority of our services we intend to implement a penetration pricing strategy which will ensure that potential clients are not frightened away by our prices up until our services are appreciated and fully operational. However this will dictate that our costs are prudently kept so as to ensure our financial goals come to fruition. Once development of the online applications is completed it is our intention to charge a monthly/six-monthly, or whichever the client prefers, recurring fee which will be charged to their account. This fee will be worked out in such a way that it covers for operating expenses as much as possible (Discussion omitted).
We will make sure that we charge for the service, expertise and any delivery with our aim being to achieve a gross profit margin of at least 60%. Naturally services targeted at the higher end of the market will have higher mark ups as these clients are less price sensitive. All in all we intend our prices to be extremely competitive on the market.
5.2.3 Promotion Strategy
Aero Technologies intends to utilize an aggressive promotional campaign to introduce its business units to the market. The intention will be to take advantage of several media sources in announcing the services and in the process reinforcing awareness of its existence. It should be stressed that these promotional campaigns shall be designed in such a way that they do not undermine the organization’s current corporate image but instead enhance it.
Our promotional activities shall be focused towards driving the organization’s overall strategy relentlessly, developing internal consistency and preparing it to confront any radical changes that may arise. This strategy will be based primarily on informing potential customers of the existence of our services and making the right information available to our target customer. The intention will be to highlight the benefit of utilizing our service(s) which will include:
- Ease of communication
- Improved corporate logistics
- Cost savings on transactions
- Chance to maintain if not improve the corporate image
- Improvements in the operations of the value chain
- Chance to improve corporate visibility regionally as well as globally, and develop niche strategies.
In such a market we cannot afford to appear in or produce second-rate material with poor labels that make our services look less than they are. We intend to leverage our presence using quality brochures and other sales literature, including promotional material such as pens, complimentary slips and pads. We intend to spread the word about our business through the following:
- Advertising (Discussion omitted)
- Personal Selling (Discussion omitted)
- Public Relations (Discussion omitted)
- Events (Discussion omitted)
- Direct Marketing (Discussion omitted)
- Internet Marketing (Discussion omitted).
In all the above we intend to communicate our ability to deliver a service of uncompromised nature and high quality that will satisfy the clients needs. Hence our messages will influence the decisions of prospective clients by emphasizing our unique selling proposition and, persuade prospective clients that we are different from our competitors. All the above promotional tools shall be well integrated and utilized in concert so as to maximize their effect.
5.3 Sales Strategy
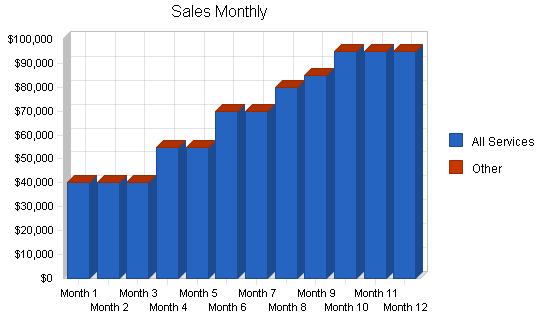
The sales forecast monthly table is included in the appendix. The annual sales projections are included here. It should be noted that as we become established and known on the market we project sales to increase at a faster rate than during the initial year.
5.3.1 Sales Forecast
Aero Technologies will receive its revenue streams from a combination of licensing agreements, royalties, sales commissions, monthly subscriptions, registration fees, network access charges, service fees, transaction charges, marketing fees, promotional incentive programs, etc. From this one can see the heavy service orientation nature of the project. The derived value of Aero Technologies will come from the key partnerships established and developed in order to deliver a service provision of transactionally based activities, providing opportunity to build brand and loyalty, around which relationship marketing will play a key role.

| Sales Forecast | |||
| Year 1 | Year 2 | Year 3 | |
| Sales | |||
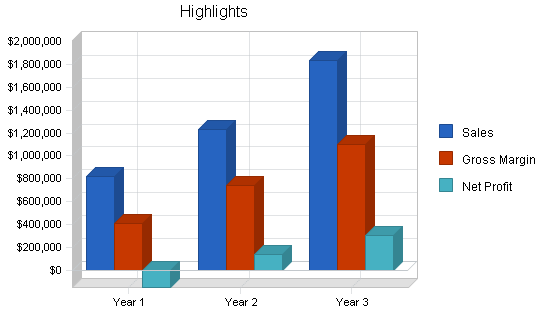
| All Services | $820,000 | $1,230,000 | $1,835,000 |
| Other | $0 | $0 | $0 |
| Total Sales | $820,000 | $1,230,000 | $1,835,000 |
| Direct Cost of Sales | Year 1 | Year 2 | Year 3 |
| All Services | $410,000 | $492,000 | $734,000 |
| Other | $0 | $0 | $0 |
| Subtotal Direct Cost of Sales | $410,000 | $492,000 | $734,000 |
5.4 Strategic Alliances
In today’s volatile and competitive environment it is becoming increasingly essential for organizations to concentrate on their core activities so as to gain and maintain a competitive advantage. This brings out the advantage of undertaking strategic alliances with organizations that the firm may benefit from and visa versa. The solid partnerships the company intends to entrench with several companies will ensure that its solutions are world-class, best-of-breed products and systems. They will also reassure our customers that they are investing in “winning” technology and service that is maintainable, flexible and scalable enough to meet future demands.
At this writing, strategic alliances with several firms are possibilities, including JJJ and KKK given the content of existing interest and discussions. By going into strategic partnerships with suitable organizations we intend to benefit from being able to concentrate on our core activities in the delivery of our service(s) to the end-user, whilst ensuring that we do not have to compromise on quality of execution or the number of services we are able to deliver.
Management Summary
The human resources element shall be an essential component in the delivery of the total service. By encouraging all employees close to our clients to think tactically about what the projects’ service offerings should be, and by having enthusiastic, capable and empowered people interacting with our clients, we intend to build the competitive advantage of being able to comprehensively meet our clients’ needs. We also intend to give our teams enough leverage in decision-making (empowerment) in order to ensure that clients are handled promptly and to reduce lead-time in actual delivery of the service.
There will be a need to evaluate jobs and remuneration packages against market benchmarks to ensure they are competitive. These principles extend to accident, medical, death and welfare benefits such as (but not limited to) support for housing finance, education and training. Consonant with its efforts to create added value by employees, Aero Technologies seeks to negotiate the provision of incentive pay delivery mechanisms against achievement of agreed targets relating to accomplishment in the areas of customer satisfaction, service provision, and other specific successes, that is, the implementation of an effective performance management system.
6.1 Organizational Structure
The organization structure the business units shall take will be that of a matrix structure where staff reports into a functional structure but are grouped together in project or product focus teams when necessary. A project focus team will typically be headed up by a project manager or supervisor, while a service/product focus team will typically be headed by another supervisor. In a highly volatile industry and environment, with increased competition and market entry, we recognize the need to be constantly changing so as to adapt to the prevailing environment. Hence we intend to have in place a highly flexible structure allowing for the above to be undertaken swiftly and smoothly. It shall be noted that the customer will be the focus in all instances as we strive to provide the ideal custom-designed service(s).
The following main functional groupings are to be recommended:
- Sales & Marketing
- Professional Services
- Customer Service
- Logistics
- Finance.
6.2 Management Team
Management style will reflect the participation of the shareholders. The company intends to respect its community and treat all employees well. We will develop and nurture the company as community. We do not intend to be very hierarchical. Management’s ongoing initiatives to drive sales, market share, and productivity will provide additional impetus (Discussion omitted).
6.3 Personnel Plan
The detailed monthly personnel plan for the first year is included in the appendix. The annual personnel estimates are included here. We believe this plan is an acceptable compromise between fairness and expedience, and meets the commitments of our vision and ethos. We do not intend to be a large organization or “top heavy” as our industry does not require our doing so. We want the company to stay lean and flexible so that we can respond to a client’s needs quickly. However as we expand and increase in size (increase in our client base) we do expect to increase our personnel.
We intend to compensate our personnel well, so as to retain their invaluable expertise and to ensure job satisfaction and enrichment through delegation of authority. Our compensation will include health care, generous profit sharing, plus a minimum of three weeks vacation. Since multifunctional teams have to be established there is need to establish a support system that will enable members to easily work together effectively, meshing well with each others’ activities. This will also allow members of a team to appreciate the implications of the concerns and issues that may be expressed by their colleagues. All the above point to the fact that there is need to instill a good corporate culture that nurtures a fruitful working relationship amongst all individuals/team members.
In-house training shall be continuous with regular external training being undertaken particularly following any new developments in the market. This is so as to ensure that we are continuously able to anticipate our markets needs — a proactive approach, which is so essential if we are to gain and maintain a competitive advantage (Discussion omitted).
| Personnel Plan | |||
| Year 1 | Year 2 | Year 3 | |
| Directors | $120,000 | $259,200 | $259,200 |
| Multimedia | $72,000 | $72,000 | $108,000 |
| Data Communications | $180,000 | $144,000 | $192,000 |
| Call Center | $48,600 | $38,880 | $58,320 |
| Conference secr. | $54,000 | $43,200 | $72,000 |
| Other | $0 | $0 | $0 |
| Total People | 23 | 23 | 31 |
| Total Payroll | $474,600 | $557,280 | $689,520 |
Financial Plan
We want to finance growth mainly through cash flow and equity. We recognize that this means we will have to grow more slowly than we might like.
The most important factor in our case is collection days. We can’t push our clients hard on collection days, because they are in larger companies and will normally have marketing authority, not financial authority. Therefore we need to develop a permanent system of receivables financing, using one of the established accounting systems. In turn we intend to ensure that our investors are compatible with our growth plan, management style and vision. Compatibility in this regard means:
- A fundamental respect for giving our customers value, and for maintaining a healthy and congenial workplace.
- Respect for realistic forecasts, and conservative cash flow and financial management.
- Cash flow as first priority, growth second, profits third.
- Willingness to follow the project objectives and contribute valuable input to strategy and implementation decisions.
With sufficient working capital the forecasted revenues and sales should be within the forecasted market demands for the company’s services. From the second year onwards, the various divisions should be able to bring in adequate sales revenues. It is assumed that by then the objective of investing in computer equipment and retraining will have taken effect, the trained technicians will have become adept at their crafts and new service offers for corporate clients will be added to the company’s product line on a regular basis.
7.1 Important Assumptions
The financial plan depends on important assumptions, most of which are shown in the following table as annual assumptions. The monthly assumptions are included in the appendix. From the beginning, we recognize that collection days are critical, but not a factor we can influence easily. At least we are planning on the problem, and dealing with it. Interest rates, tax rates, and personnel burden are based on conservative assumptions.
Some of the more important underlying assumptions are:
- We assume a strong economy, without major recession.
- We assume, of course, that there are no unforeseen changes in economic policy to make our clients’ products immediately obsolete, though we do forecast technological changes.
| General Assumptions | |||
| Year 1 | Year 2 | Year 3 | |
| Plan Month | 1 | 2 | 3 |
| Current Interest Rate | 10.00% | 10.00% | 10.00% |
| Long-term Interest Rate | 10.00% | 10.00% | 10.00% |
| Tax Rate | 25.42% | 25.00% | 25.42% |
| Other | 0 | 0 | 0 |
7.2 Key Financial Indicators
We foresee a slow initial growth in sales, though operating expenses will be relatively high, and a bump in our sales and revenue generation as we spread our services during expansion.
Collection days are very important. We do not want to let our average collection days get above the client’s actual subscription period under any circumstances. This could cause a serious problem with cash flow, because our working capital situation is chronically tight. However, we recognize that we cannot control this factor easily, because of the relationship we wish to create with our clients.

7.3 Break-even Analysis
Our Break-even Analysis will be based on running costs, that is, costs we shall incur in keeping the business running, including salaries and wages, rent, computer maintenance costs, water and electricity, and insurance amongst others. Hence many fixed costs shall be included in these costs. We will thus ensure that our sales levels are running comfortably above break-even.
The following table summarizes our break-even analysis.

| Break-even Analysis | |
| Monthly Revenue Break-even | $93,300 |
| Assumptions: | |
| Average Percent Variable Cost | 50% |
| Estimated Monthly Fixed Cost | $46,650 |
7.4 Projected Profit and Loss
The following table presents the profit and loss information for Aero Technologies.
Initial marketing and training expenses will be relatively high as we seek to become known on the market and staff get trained in provision of our services. This will be brought about by the development of sales literature, advertising expenses, function expenses including lunches and dinners with interested stakeholders. As our market share increases and capital is generated, further marketing programs and the expansion of those in existence at the time will be undertaken, to ensure market development. However with time these programs will start generating revenue for the business, which we shall in turn reinvest.


| Pro Forma Profit and Loss | |||
| Year 1 | Year 2 | Year 3 | |
| Sales | $820,000 | $1,230,000 | $1,835,000 |
| Direct Cost of Sales | $410,000 | $492,000 | $734,000 |
| Other | $0 | $0 | $0 |
| Total Cost of Sales | $410,000 | $492,000 | $734,000 |
| Gross Margin | $410,000 | $738,000 | $1,101,000 |
| Gross Margin % | 50.00% | 60.00% | 60.00% |
| Expenses | |||
| Payroll | $474,600 | $557,280 | $689,520 |
| Sales and Marketing and Other Expenses | $39,600 | $0 | $0 |
| Depreciation | $0 | $0 | $0 |
| Leased Equipment | $0 | $0 | $0 |
| Utilities | $3,600 | $0 | $0 |
| Insurance | $18,000 | $0 | $0 |
| Rent | $24,000 | $0 | $0 |
| Payroll Taxes | $0 | $0 | $0 |
| Other | $0 | $0 | $0 |
| Total Operating Expenses | $559,800 | $557,280 | $689,520 |
| Profit Before Interest and Taxes | ($149,800) | $180,720 | $411,480 |
| EBITDA | ($149,800) | $180,720 | $411,480 |
| Interest Expense | $0 | $0 | $0 |
| Taxes Incurred | $0 | $45,180 | $104,585 |
| Net Profit | ($149,800) | $135,540 | $306,895 |
| Net Profit/Sales | -18.27% | 11.02% | 16.72% |
7.5 Projected Cash Flow
The chart and table below provide details to the company’s cash flow situation. The chart shows a monthly breakdown while the table shows a year-end statement.

| Pro Forma Cash Flow | |||
| Year 1 | Year 2 | Year 3 | |
| Cash Received | |||
| Cash from Operations | |||
| Cash Sales | $205,000 | $307,500 | $458,750 |
| Cash from Receivables | $474,875 | $852,438 | $1,272,865 |
| Subtotal Cash from Operations | $679,875 | $1,159,938 | $1,731,615 |
| Additional Cash Received | |||
| Sales Tax, VAT, HST/GST Received | $0 | $0 | $0 |
| New Current Borrowing | $0 | $0 | $0 |
| New Other Liabilities (interest-free) | $0 | $0 | $0 |
| New Long-term Liabilities | $0 | $0 | $0 |
| Sales of Other Current Assets | $0 | $0 | $0 |
| Sales of Long-term Assets | $0 | $0 | $0 |
| New Investment Received | $0 | $0 | $0 |
| Subtotal Cash Received | $679,875 | $1,159,938 | $1,731,615 |
| Expenditures | Year 1 | Year 2 | Year 3 |
| Expenditures from Operations | |||
| Cash Spending | $474,600 | $557,280 | $689,520 |
| Bill Payments | $495,395 | $554,674 | $842,976 |
| Subtotal Spent on Operations | $969,995 | $1,111,954 | $1,532,496 |
| Additional Cash Spent | |||
| Sales Tax, VAT, HST/GST Paid Out | $0 | $0 | $0 |
| Principal Repayment of Current Borrowing | $0 | $0 | $0 |
| Other Liabilities Principal Repayment | $0 | $0 | $0 |
| Long-term Liabilities Principal Repayment | $0 | $0 | $0 |
| Purchase Other Current Assets | $0 | $0 | $0 |
| Purchase Long-term Assets | $0 | $0 | $0 |
| Dividends | $0 | $0 | $0 |
| Subtotal Cash Spent | $969,995 | $1,111,954 | $1,532,496 |
| Net Cash Flow | ($290,120) | $47,983 | $199,119 |
| Cash Balance | $59,880 | $107,863 | $306,982 |
7.6 Projected Balance Sheet
The Balance Sheet below highlights the important numbers for the company.
| Pro Forma Balance Sheet | |||
| Year 1 | Year 2 | Year 3 | |
| Assets | |||
| Current Assets | |||
| Cash | $59,880 | $107,863 | $306,982 |
| Accounts Receivable | $140,125 | $210,188 | $313,572 |
| Inventory | $52,250 | $62,700 | $93,540 |
| Other Current Assets | $0 | $0 | $0 |
| Total Current Assets | $252,255 | $380,751 | $714,095 |
| Long-term Assets | |||
| Long-term Assets | $1,012,400 | $1,012,400 | $1,012,400 |
| Accumulated Depreciation | $0 | $0 | $0 |
| Total Long-term Assets | $1,012,400 | $1,012,400 | $1,012,400 |
| Total Assets | $1,264,655 | $1,393,151 | $1,726,495 |
| Liabilities and Capital | Year 1 | Year 2 | Year 3 |
| Current Liabilities | |||
| Accounts Payable | $52,055 | $45,011 | $71,460 |
| Current Borrowing | $0 | $0 | $0 |
| Other Current Liabilities | $0 | $0 | $0 |
| Subtotal Current Liabilities | $52,055 | $45,011 | $71,460 |
| Long-term Liabilities | $0 | $0 | $0 |
| Total Liabilities | $52,055 | $45,011 | $71,460 |
| Paid-in Capital | $2,554,400 | $2,554,400 | $2,554,400 |
| Retained Earnings | ($1,192,000) | ($1,341,800) | ($1,206,260) |
| Earnings | ($149,800) | $135,540 | $306,895 |
| Total Capital | $1,212,600 | $1,348,140 | $1,655,036 |
| Total Liabilities and Capital | $1,264,655 | $1,393,151 | $1,726,495 |
| Net Worth | $1,212,600 | $1,348,140 | $1,655,035 |
7.7 Business Ratios
The following table presents important business ratios for Aero Technology. These figures come from the communications services industry, as determined by the Standard Industry Classification (SIC) Index.
| Ratio Analysis | ||||
| Year 1 | Year 2 | Year 3 | Industry Profile | |
| Sales Growth | 0.00% | 50.00% | 49.19% | 0.00% |
| Percent of Total Assets | ||||
| Accounts Receivable | 11.08% | 15.09% | 18.16% | 0.00% |
| Inventory | 4.13% | 4.50% | 5.42% | 0.00% |
| Other Current Assets | 0.00% | 0.00% | 0.00% | 100.00% |
| Total Current Assets | 19.95% | 27.33% | 41.36% | 100.00% |
| Long-term Assets | 80.05% | 72.67% | 58.64% | 0.00% |
| Total Assets | 100.00% | 100.00% | 100.00% | 100.00% |
| Current Liabilities | 4.12% | 3.23% | 4.14% | 0.00% |
| Long-term Liabilities | 0.00% | 0.00% | 0.00% | 0.00% |
| Total Liabilities | 4.12% | 3.23% | 4.14% | 0.00% |
| Net Worth | 95.88% | 96.77% | 95.86% | 100.00% |
| Percent of Sales | ||||
| Sales | 100.00% | 100.00% | 100.00% | 100.00% |
| Gross Margin | 50.00% | 60.00% | 60.00% | 0.00% |
| Selling, General & Administrative Expenses | 79.98% | 48.98% | 43.18% | 0.00% |
| Advertising Expenses | 2.56% | 0.00% | 0.00% | 0.00% |
| Profit Before Interest and Taxes | -18.27% | 14.69% | 22.42% | 0.00% |
| Main Ratios | ||||
| Current | 4.85 | 8.46 | 9.99 | 0.00 |
| Quick | 3.84 | 7.07 | 8.68 | 0.00 |
| Total Debt to Total Assets | 4.12% | 3.23% | 4.14% | 0.00% |
| Pre-tax Return on Net Worth | -12.35% | 13.41% | 24.86% | 0.00% |
| Pre-tax Return on Assets | -11.85% | 12.97% | 23.83% | 0.00% |
| Additional Ratios | Year 1 | Year 2 | Year 3 | |
| Net Profit Margin | -18.27% | 11.02% | 16.72% | n.a |
| Return on Equity | -12.35% | 10.05% | 18.54% | n.a |
| Activity Ratios | ||||
| Accounts Receivable Turnover | 4.39 | 4.39 | 4.39 | n.a |
| Collection Days | 56 | 69 | 69 | n.a |
| Inventory Turnover | 10.91 | 8.56 | 9.40 | n.a |
| Accounts Payable Turnover | 10.52 | 12.17 | 12.17 | n.a |
| Payment Days | 27 | 32 | 24 | n.a |
| Total Asset Turnover | 0.65 | 0.88 | 1.06 | n.a |
| Debt Ratios | ||||
| Debt to Net Worth | 0.04 | 0.03 | 0.04 | n.a |
| Current Liab. to Liab. | 1.00 | 1.00 | 1.00 | n.a |
| Liquidity Ratios | ||||
| Net Working Capital | $200,200 | $335,740 | $642,635 | n.a |
| Interest Coverage | 0.00 | 0.00 | 0.00 | n.a |
| Additional Ratios | ||||
| Assets to Sales | 1.54 | 1.13 | 0.94 | n.a |
| Current Debt/Total Assets | 4% | 3% | 4% | n.a |
| Acid Test | 1.15 | 2.40 | 4.30 | n.a |
| Sales/Net Worth | 0.68 | 0.91 | 1.11 | n.a |
| Dividend Payout | 0.00 | 0.00 | 0.00 | n.a |
Appendix
| Sales Forecast | |||||||||||||
| Month 1 | Month 2 | Month 3 | Month 4 | Month 5 | Month 6 | Month 7 | Month 8 | Month 9 | Month 10 | Month 11 | Month 12 | ||
| Sales | |||||||||||||
| All Services | 0% | $40,000 | $40,000 | $40,000 | $55,000 | $55,000 | $70,000 | $70,000 | $80,000 | $85,000 | $95,000 | $95,000 | $95,000 |
| Other | 0% | $0 | $0 | $0 | $0 | $0 | $0 | $0 | $0 | $0 | $0 | $0 | $0 |
| Total Sales | $40,000 | $40,000 | $40,000 | $55,000 | $55,000 | $70,000 | $70,000 | $80,000 | $85,000 | $95,000 | $95,000 | $95,000 | |
| Direct Cost of Sales | Month 1 | Month 2 | Month 3 | Month 4 | Month 5 | Month 6 | Month 7 | Month 8 | Month 9 | Month 10 | Month 11 | Month 12 | |
| All Services | $20,000 | $20,000 | $20,000 | $27,500 | $27,500 | $35,000 | $35,000 | $40,000 | $42,500 | $47,500 | $47,500 | $47,500 | |
| Other | $0 | $0 | $0 | $0 | $0 | $0 | $0 | $0 | $0 | $0 | $0 | $0 | |
| Subtotal Direct Cost of Sales | $20,000 | $20,000 | $20,000 | $27,500 | $27,500 | $35,000 | $35,000 | $40,000 | $42,500 | $47,500 | $47,500 | $47,500 | |
| Personnel Plan | |||||||||||||
| Month 1 | Month 2 | Month 3 | Month 4 | Month 5 | Month 6 | Month 7 | Month 8 | Month 9 | Month 10 | Month 11 | Month 12 | ||
| Directors | 0% | $10,000 | $10,000 | $10,000 | $10,000 | $10,000 | $10,000 | $10,000 | $10,000 | $10,000 | $10,000 | $10,000 | $10,000 |
| Multimedia | 0% | $4,000 | $4,000 | $4,000 | $4,000 | $4,000 | $4,000 | $8,000 | $8,000 | $8,000 | $8,000 | $8,000 | $8,000 |
| Data Communications | 0% | $10,000 | $10,000 | $10,000 | $10,000 | $10,000 | $10,000 | $20,000 | $20,000 | $20,000 | $20,000 | $20,000 | $20,000 |
| Call Center | 0% | $2,700 | $2,700 | $2,700 | $2,700 | $2,700 | $2,700 | $5,400 | $5,400 | $5,400 | $5,400 | $5,400 | $5,400 |
| Conference secr. | 0% | $3,000 | $3,000 | $3,000 | $3,000 | $3,000 | $3,000 | $6,000 | $6,000 | $6,000 | $6,000 | $6,000 | $6,000 |
| Other | 0% | $0 | $0 | $0 | $0 | $0 | $0 | $0 | $0 | $0 | $0 | $0 | $0 |
| Total People | 23 | 23 | 23 | 23 | 23 | 23 | 23 | 23 | 23 | 23 | 23 | 23 | |
| Total Payroll | $29,700 | $29,700 | $29,700 | $29,700 | $29,700 | $29,700 | $49,400 | $49,400 | $49,400 | $49,400 | $49,400 | $49,400 | |
| General Assumptions | |||||||||||||
| Month 1 | Month 2 | Month 3 | Month 4 | Month 5 | Month 6 | Month 7 | Month 8 | Month 9 | Month 10 | Month 11 | Month 12 | ||
| Plan Month | 1 | 2 | 3 | 4 | 5 | 6 | 7 | 8 | 9 | 10 | 11 | 12 | |
| Current Interest Rate | 10.00% | 10.00% | 10.00% | 10.00% | 10.00% | 10.00% | 10.00% | 10.00% | 10.00% | 10.00% | 10.00% | 10.00% | |
| Long-term Interest Rate | 10.00% | 10.00% | 10.00% | 10.00% | 10.00% | 10.00% | 10.00% | 10.00% | 10.00% | 10.00% | 10.00% | 10.00% | |
| Tax Rate | 30.00% | 25.00% | 25.00% | 25.00% | 25.00% | 25.00% | 25.00% | 25.00% | 25.00% | 25.00% | 25.00% | 25.00% | |
| Other | 0 | 0 | 0 | 0 | 0 | 0 | 0 | 0 | 0 | 0 | 0 | 0 | |
| Pro Forma Profit and Loss | |||||||||||||
| Month 1 | Month 2 | Month 3 | Month 4 | Month 5 | Month 6 | Month 7 | Month 8 | Month 9 | Month 10 | Month 11 | Month 12 | ||
| Sales | $40,000 | $40,000 | $40,000 | $55,000 | $55,000 | $70,000 | $70,000 | $80,000 | $85,000 | $95,000 | $95,000 | $95,000 | |
| Direct Cost of Sales | $20,000 | $20,000 | $20,000 | $27,500 | $27,500 | $35,000 | $35,000 | $40,000 | $42,500 | $47,500 | $47,500 | $47,500 | |
| Other | $0 | $0 | $0 | $0 | $0 | $0 | $0 | $0 | $0 | $0 | $0 | $0 | |
| Total Cost of Sales | $20,000 | $20,000 | $20,000 | $27,500 | $27,500 | $35,000 | $35,000 | $40,000 | $42,500 | $47,500 | $47,500 | $47,500 | |
| Gross Margin | $20,000 | $20,000 | $20,000 | $27,500 | $27,500 | $35,000 | $35,000 | $40,000 | $42,500 | $47,500 | $47,500 | $47,500 | |
| Gross Margin % | 50.00% | 50.00% | 50.00% | 50.00% | 50.00% | 50.00% | 50.00% | 50.00% | 50.00% | 50.00% | 50.00% | 50.00% | |
| Expenses | |||||||||||||
| Payroll | $29,700 | $29,700 | $29,700 | $29,700 | $29,700 | $29,700 | $49,400 | $49,400 | $49,400 | $49,400 | $49,400 | $49,400 | |
| Sales and Marketing and Other Expenses | $11,550 | $2,550 | $2,550 | $2,550 | $2,550 | $2,550 | $2,550 | $2,550 | $2,550 | $2,550 | $2,550 | $2,550 | |
| Depreciation | $0 | $0 | $0 | $0 | $0 | $0 | $0 | $0 | $0 | $0 | $0 | $0 | |
| Leased Equipment | $0 | $0 | $0 | $0 | $0 | $0 | $0 | $0 | $0 | $0 | $0 | $0 | |
| Utilities | $300 | $300 | $300 | $300 | $300 | $300 | $300 | $300 | $300 | $300 | $300 | $300 | |
| Insurance | $1,500 | $1,500 | $1,500 | $1,500 | $1,500 | $1,500 | $1,500 | $1,500 | $1,500 | $1,500 | $1,500 | $1,500 | |
| Rent | $2,000 | $2,000 | $2,000 | $2,000 | $2,000 | $2,000 | $2,000 | $2,000 | $2,000 | $2,000 | $2,000 | $2,000 | |
| Payroll Taxes | 0% | $0 | $0 | $0 | $0 | $0 | $0 | $0 | $0 | $0 | $0 | $0 | $0 |
| Other | $0 | $0 | $0 | $0 | $0 | $0 | $0 | $0 | $0 | $0 | $0 | $0 | |
| Total Operating Expenses | $45,050 | $36,050 | $36,050 | $36,050 | $36,050 | $36,050 | $55,750 | $55,750 | $55,750 | $55,750 | $55,750 | $55,750 | |
| Profit Before Interest and Taxes | ($25,050) | ($16,050) | ($16,050) | ($8,550) | ($8,550) | ($1,050) | ($20,750) | ($15,750) | ($13,250) | ($8,250) | ($8,250) | ($8,250) | |
| EBITDA | ($25,050) | ($16,050) | ($16,050) | ($8,550) | ($8,550) | ($1,050) | ($20,750) | ($15,750) | ($13,250) | ($8,250) | ($8,250) | ($8,250) | |
| Interest Expense | $0 | $0 | $0 | $0 | $0 | $0 | $0 | $0 | $0 | $0 | $0 | $0 | |
| Taxes Incurred | $0 | $0 | $0 | $0 | $0 | $0 | $0 | $0 | $0 | $0 | $0 | $0 | |
| Net Profit | ($25,050) | ($16,050) | ($16,050) | ($8,550) | ($8,550) | ($1,050) | ($20,750) | ($15,750) | ($13,250) | ($8,250) | ($8,250) | ($8,250) | |
| Net Profit/Sales | -62.63% | -40.13% | -40.13% | -15.55% | -15.55% | -1.50% | -29.64% | -19.69% | -15.59% | -8.68% | -8.68% | -8.68% | |
| Pro Forma Cash Flow | |||||||||||||
| Month 1 | Month 2 | Month 3 | Month 4 | Month 5 | Month 6 | Month 7 | Month 8 | Month 9 | Month 10 | Month 11 | Month 12 | ||
| Cash Received | |||||||||||||
| Cash from Operations | |||||||||||||
| Cash Sales | $10,000 | $10,000 | $10,000 | $13,750 | $13,750 | $17,500 | $17,500 | $20,000 | $21,250 | $23,750 | $23,750 | $23,750 | |
| Cash from Receivables | $0 | $1,000 | $30,000 | $30,000 | $30,375 | $41,250 | $41,625 | $52,500 | $52,750 | $60,125 | $64,000 | $71,250 | |
| Subtotal Cash from Operations | $10,000 | $11,000 | $40,000 | $43,750 | $44,125 | $58,750 | $59,125 | $72,500 | $74,000 | $83,875 | $87,750 | $95,000 | |
| Additional Cash Received | |||||||||||||
| Sales Tax, VAT, HST/GST Received | 0.00% | $0 | $0 | $0 | $0 | $0 | $0 | $0 | $0 | $0 | $0 | $0 | $0 |
| New Current Borrowing | $0 | $0 | $0 | $0 | $0 | $0 | $0 | $0 | $0 | $0 | $0 | $0 | |
| New Other Liabilities (interest-free) | $0 | $0 | $0 | $0 | $0 | $0 | $0 | $0 | $0 | $0 | $0 | $0 | |
| New Long-term Liabilities | $0 | $0 | $0 | $0 | $0 | $0 | $0 | $0 | $0 | $0 | $0 | $0 | |
| Sales of Other Current Assets | $0 | $0 | $0 | $0 | $0 | $0 | $0 | $0 | $0 | $0 | $0 | $0 | |
| Sales of Long-term Assets | $0 | $0 | $0 | $0 | $0 | $0 | $0 | $0 | $0 | $0 | $0 | $0 | |
| New Investment Received | $0 | $0 | $0 | $0 | $0 | $0 | $0 | $0 | $0 | $0 | $0 | $0 | |
| Subtotal Cash Received | $10,000 | $11,000 | $40,000 | $43,750 | $44,125 | $58,750 | $59,125 | $72,500 | $74,000 | $83,875 | $87,750 | $95,000 | |
| Expenditures | Month 1 | Month 2 | Month 3 | Month 4 | Month 5 | Month 6 | Month 7 | Month 8 | Month 9 | Month 10 | Month 11 | Month 12 | |
| Expenditures from Operations | |||||||||||||
| Cash Spending | $29,700 | $29,700 | $29,700 | $29,700 | $29,700 | $29,700 | $49,400 | $49,400 | $49,400 | $49,400 | $49,400 | $49,400 | |
| Bill Payments | $1,912 | $56,317 | $26,350 | $26,875 | $41,825 | $34,375 | $49,325 | $41,700 | $51,842 | $51,858 | $59,167 | $53,850 | |
| Subtotal Spent on Operations | $31,612 | $86,017 | $56,050 | $56,575 | $71,525 | $64,075 | $98,725 | $91,100 | $101,242 | $101,258 | $108,567 | $103,250 | |
| Additional Cash Spent | |||||||||||||
| Sales Tax, VAT, HST/GST Paid Out | $0 | $0 | $0 | $0 | $0 | $0 | $0 | $0 | $0 | $0 | $0 | $0 | |
| Principal Repayment of Current Borrowing | $0 | $0 | $0 | $0 | $0 | $0 | $0 | $0 | $0 | $0 | $0 | $0 | |
| Other Liabilities Principal Repayment | $0 | $0 | $0 | $0 | $0 | $0 | $0 | $0 | $0 | $0 | $0 | $0 | |
| Long-term Liabilities Principal Repayment | $0 | $0 | $0 | $0 | $0 | $0 | $0 | $0 | $0 | $0 | $0 | $0 | |
| Purchase Other Current Assets | $0 | $0 | $0 | $0 | $0 | $0 | $0 | $0 | $0 | $0 | $0 | $0 | |
| Purchase Long-term Assets | $0 | $0 | $0 | $0 | $0 | $0 | $0 | $0 | $0 | $0 | $0 | $0 | |
| Dividends | $0 | $0 | $0 | $0 | $0 | $0 | $0 | $0 | $0 | $0 | $0 | $0 | |
| Subtotal Cash Spent | $31,612 | $86,017 | $56,050 | $56,575 | $71,525 | $64,075 | $98,725 | $91,100 | $101,242 | $101,258 | $108,567 | $103,250 | |
| Net Cash Flow | ($21,612) | ($75,017) | ($16,050) | ($12,825) | ($27,400) | ($5,325) | ($39,600) | ($18,600) | ($27,242) | ($17,383) | ($20,817) | ($8,250) | |
| Cash Balance | $328,388 | $253,372 | $237,322 | $224,497 | $197,097 | $191,772 | $152,172 | $133,572 | $106,330 | $88,947 | $68,130 | $59,880 | |
| Pro Forma Balance Sheet | |||||||||||||
| Month 1 | Month 2 | Month 3 | Month 4 | Month 5 | Month 6 | Month 7 | Month 8 | Month 9 | Month 10 | Month 11 | Month 12 | ||
| Assets | Starting Balances | ||||||||||||
| Current Assets | |||||||||||||
| Cash | $350,000 | $328,388 | $253,372 | $237,322 | $224,497 | $197,097 | $191,772 | $152,172 | $133,572 | $106,330 | $88,947 | $68,130 | $59,880 |
| Accounts Receivable | $0 | $30,000 | $59,000 | $59,000 | $70,250 | $81,125 | $92,375 | $103,250 | $110,750 | $121,750 | $132,875 | $140,125 | $140,125 |
| Inventory | $0 | $22,000 | $22,000 | $22,000 | $30,250 | $30,250 | $38,500 | $38,500 | $44,000 | $46,750 | $52,250 | $52,250 | $52,250 |
| Other Current Assets | $0 | $0 | $0 | $0 | $0 | $0 | $0 | $0 | $0 | $0 | $0 | $0 | $0 |
| Total Current Assets | $350,000 | $380,388 | $334,372 | $318,322 | $324,997 | $308,472 | $322,647 | $293,922 | $288,322 | $274,830 | $274,072 | $260,505 | $252,255 |
| Long-term Assets | |||||||||||||
| Long-term Assets | $1,012,400 | $1,012,400 | $1,012,400 | $1,012,400 | $1,012,400 | $1,012,400 | $1,012,400 | $1,012,400 | $1,012,400 | $1,012,400 | $1,012,400 | $1,012,400 | $1,012,400 |
| Accumulated Depreciation | $0 | $0 | $0 | $0 | $0 | $0 | $0 | $0 | $0 | $0 | $0 | $0 | $0 |
| Total Long-term Assets | $1,012,400 | $1,012,400 | $1,012,400 | $1,012,400 | $1,012,400 | $1,012,400 | $1,012,400 | $1,012,400 | $1,012,400 | $1,012,400 | $1,012,400 | $1,012,400 | $1,012,400 |
| Total Assets | $1,362,400 | $1,392,788 | $1,346,772 | $1,330,722 | $1,337,397 | $1,320,872 | $1,335,047 | $1,306,322 | $1,300,722 | $1,287,230 | $1,286,472 | $1,272,905 | $1,264,655 |
| Liabilities and Capital | Month 1 | Month 2 | Month 3 | Month 4 | Month 5 | Month 6 | Month 7 | Month 8 | Month 9 | Month 10 | Month 11 | Month 12 | |
| Current Liabilities | |||||||||||||
| Accounts Payable | $0 | $55,438 | $25,472 | $25,472 | $40,697 | $32,722 | $47,947 | $39,972 | $50,122 | $49,880 | $57,372 | $52,055 | $52,055 |
| Current Borrowing | $0 | $0 | $0 | $0 | $0 | $0 | $0 | $0 | $0 | $0 | $0 | $0 | $0 |
| Other Current Liabilities | $0 | $0 | $0 | $0 | $0 | $0 | $0 | $0 | $0 | $0 | $0 | $0 | $0 |
| Subtotal Current Liabilities | $0 | $55,438 | $25,472 | $25,472 | $40,697 | $32,722 | $47,947 | $39,972 | $50,122 | $49,880 | $57,372 | $52,055 | $52,055 |
| Long-term Liabilities | $0 | $0 | $0 | $0 | $0 | $0 | $0 | $0 | $0 | $0 | $0 | $0 | $0 |
| Total Liabilities | $0 | $55,438 | $25,472 | $25,472 | $40,697 | $32,722 | $47,947 | $39,972 | $50,122 | $49,880 | $57,372 | $52,055 | $52,055 |
| Paid-in Capital | $2,554,400 | $2,554,400 | $2,554,400 | $2,554,400 | $2,554,400 | $2,554,400 | $2,554,400 | $2,554,400 | $2,554,400 | $2,554,400 | $2,554,400 | $2,554,400 | $2,554,400 |
| Retained Earnings | ($1,192,000) | ($1,192,000) | ($1,192,000) | ($1,192,000) | ($1,192,000) | ($1,192,000) | ($1,192,000) | ($1,192,000) | ($1,192,000) | ($1,192,000) | ($1,192,000) | ($1,192,000) | ($1,192,000) |
| Earnings | $0 | ($25,050) | ($41,100) | ($57,150) | ($65,700) | ($74,250) | ($75,300) | ($96,050) | ($111,800) | ($125,050) | ($133,300) | ($141,550) | ($149,800) |
| Total Capital | $1,362,400 | $1,337,350 | $1,321,300 | $1,305,250 | $1,296,700 | $1,288,150 | $1,287,100 | $1,266,350 | $1,250,600 | $1,237,350 | $1,229,100 | $1,220,850 | $1,212,600 |
| Total Liabilities and Capital | $1,362,400 | $1,392,788 | $1,346,772 | $1,330,722 | $1,337,397 | $1,320,872 | $1,335,047 | $1,306,322 | $1,300,722 | $1,287,230 | $1,286,472 | $1,272,905 | $1,264,655 |
| Net Worth | $1,362,400 | $1,337,350 | $1,321,300 | $1,305,250 | $1,296,700 | $1,288,150 | $1,287,100 | $1,266,350 | $1,250,600 | $1,237,350 | $1,229,100 | $1,220,850 | $1,212,600 |


