
Pegasus Sports
Executive Summary
Pegasus Sports International is the premier inline skate accessory manufacturer for the inline skate industry. Pegasus has developed three innovative and practical skate accessories. Pegasus is able to produce worthwhile products because the company is composed of skaters making products for skaters. Pegasus will quickly gain market penetration and establish themselves as an innovative inline skating product company.
Pegasus is a limited partnership located in Venice, CA. Venice was strategically chosen to provide Pegasus with credible product feedback since Venice is considered by many as the inline skating capital of the world.
The Products
Pegasus currently has three unique products available or soon to be released. The first is BladeBoots™, a fabric wheel cover that allows skaters to enter retail establishments or travel anywhere with their skates on while protecting the skates and the surface that they tread on. Pegasus’ second product is SkateSail, an innovative product that has created a new niche sport that combines inline skating and windsurfing. Not only has Pegasus released this innovative product, but they are supporting and growing the niche sport as a legitimate extension of inline skating. Their last product is SkateAid.
The Market
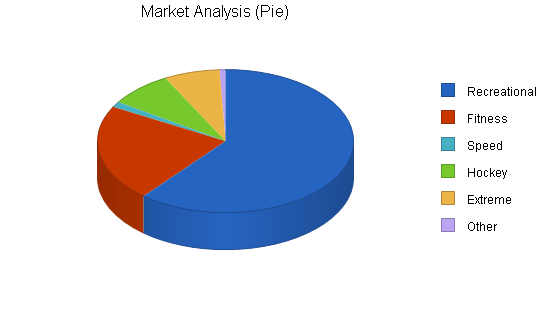
Pegasus will supply the rapidly growing inline skating market with useful accessories. The market has been established with over 31 million pairs of skates sold already. Of this number, 26 million have been sold to recreational and fitness skaters, the primary segment that Pegasus will target. Pegasus’ market can be broken down into five segments: recreational, fitness, speed, hockey, and extreme skaters.
Management Team
Key to Pegasus’ success is the fact that the entire basis of the company is skaters, not only are the products for skaters but the entire company lives and breathes inline skating. Sal Chavez, CEO, has 23 years of skating experience. He is so dedicated to skating that he no longer has an automobile, commuting by inline skates. Sal has worked for three different companies in the design department. Sal has also spent years in retail environments giving him first hand knowledge of skater’s preference.
Sandi Arnold is Pegasus’ Vice President and is also a true enthusiast. Sandi has seven years of product experience at Rollerblade, the industry leader. Lastly, Beth Laird, Administrator and Web Master support Pegasus. Beth’s amazing computer skills will support Pegasus’ ambitious Internet effort. Beth has come from Inline Skating Today, the premier Internet based industry newsletter.
Pegasus is an exciting business that leverages employee’s passions for the greater good of the company as well as the sport of inline skating. Pegasus will reach profitability quickly, by month three. Sales are forecasted to be healthy for year one and rise to several fold by the end of year three. Pegasus will generate respectable net profits for year one through year three.
1.1 Objectives
- To fulfill the after-market skate accessory demand with top quality products.
- To develop and manufacture SkateAids by month three.
- To develop Skate tours by Spring of next year.
- To break even by the end of the first year in business.
- To encourage our customers to live healthy lives by making skating more fun and convenient for them.
- To offer skaters support through our web page, such as interviews with Doctor Kaye, Podiatrist, with answers to skater-specific foot problems.
- To develop a solid e-commerce market and to maximize our profit margin. We make full retail profit through e-commerce.
1.2 Mission
Pegasus Sports International is planning on fulfilling the need for after-market products, a market we have identified, based on the large volume of skates that have been sold in the last five years.
Pegasus Sports International will establish a service network for in-line skaters by providing products that help people incorporate more skating into their daily lifestyles. Our goal is to:
- Expand skating as an alternative to driving to do local errands.
- Form a network of skating enthusiasts with an emphasis on health and fitness.
- To encourage SkateSailing as a new international sport.
- To develop SkateAids and other new products now on the drawing table.

1.3 Keys to Success
- Developing quality in-line skating accessories through feedback from skaters.
- Develop a niche market for our unique skating accessories.
- Maximizing profits by selling through the Internet at full retail price.
- Maintaining low overhead costs by monitoring and scheduling production.
- Developing a network with other businesses and experts, such as Podiatrist and skater Dr.Kaye, through interviews published on our website.
Company Summary
Pegasus Sports International was conceived by skaters who can devise practical ideas and designs for in-line skating accessories. Being avid health and fitness advocates, we promote in-line skating as a lifestyle.
Our products make the trip to the local store or coffee shop easier and an enjoyable way to get exercise. This will eliminate the stress of driving in traffic and having to search for parking.
The main problem skaters encounter is poor fit. Lateral ankle support is essential due to the narrow wheel footprint of in-line skates. Because of this, skate boots have to be worn tighter than shoes. We have invented a solution to this problem and are excited about its application to other footwear as well. There is a lack of inexpensive accessory products available. Other needs can be addressed with new products.
2.1 Company Ownership
Pegasus Sports International currently is a Limited Partnership.
Presently, Sal M. Chavez is Chief Executive Officer and owns eighty percent (80%) of the company.
Presently, Sandi M. Arnold is Vice President and owns twenty percent (20%) of the company.
Upon incorporating, Sal M. Chavez and Sandi M. Arnold will change their partnership agreement so Sandi and Sal will divide profits to 45% to Sandi and 55% to Sal.
Ten (10%) of Internet sales will go to Beth Laird, our Web Master and Office Administrator.
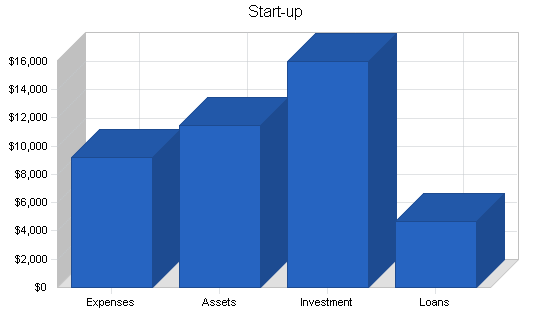
2.2 Start-up Summary
Our start-up cost has been $10,000. The money has primarily been for materials for prototypes, product development, trademark acquisition, rental equipment, operating and administrative costs, and establishing a website.
Upon receiving our loan for the first month, we plan on heavy advertising through the Internet, skating publications, and on-site events such as skating races.
The start-up costs are shown in the following tables and illustration.
| Start-up Funding | |
| Start-up Expenses to Fund | $9,204 |
| Start-up Assets to Fund | $11,496 |
| Total Funding Required | $20,700 |
| Assets | |
| Non-cash Assets from Start-up | $1,500 |
| Cash Requirements from Start-up | $9,996 |
| Additional Cash Raised | $0 |
| Cash Balance on Starting Date | $9,996 |
| Total Assets | $11,496 |
| Liabilities and Capital | |
| Liabilities | |
| Current Borrowing | $4,500 |
| Long-term Liabilities | $0 |
| Accounts Payable (Outstanding Bills) | $200 |
| Other Current Liabilities (interest-free) | $0 |
| Total Liabilities | $4,700 |
| Capital | |
| Planned Investment | |
| Paul Neugas | $3,000 |
| Garry Waldie | $3,000 |
| Mrs. Arnold | $2,000 |
| Beth Laird | $3,000 |
| Lamiah G. Arnold/Trower | $3,000 |
| David S. Chavez | $2,000 |
| Additional Investment Requirement | $0 |
| Total Planned Investment | $16,000 |
| Loss at Start-up (Start-up Expenses) | ($9,204) |
| Total Capital | $6,796 |
| Total Capital and Liabilities | $11,496 |
| Total Funding | $20,700 |
| Start-up | |
| Requirements | |
| Start-up Expenses | |
| Legal | $671 |
| Office & Computer Supply | $1,453 |
| Advertizing | $1,000 |
| Consultants | $20 |
| Insurance | $0 |
| Rent | $2,500 |
| Research and Development | $1,827 |
| Expensed Equipment | $233 |
| Other | $1,500 |
| Total Start-up Expenses | $9,204 |
| Start-up Assets | |
| Cash Required | $9,996 |
| Start-up Inventory | $1,500 |
| Other Current Assets | $0 |
| Long-term Assets | $0 |
| Total Assets | $11,496 |
| Total Requirements | $20,700 |
2.3 Company Locations and Facilities
At present we are located in Venice, California. From our location, we will warehouse, package, and ship our products. We will find a larger site as the business expands.
We have manufacturers lined up to sub-contract our large production jobs. We plan to produce products on a monthly basis to cut our need for large inventory space.

Products
Pegasus Sports International now offers several products:
- The first product we have developed is BladeBoots™, a cover for the wheels and frame of in-line skates, which allow skaters to enter places that normally would not allow them in. BladeBoots™ come with a small pouch and belt which converts to a well-designed skate carrier.
- The second product we have invented is our SkateSails. These sails are specifically designed for use while skating. Feedback that we have received from skaters indicate this could become a very popular sport. Trade marking this product is currently in progress.
- The third product will be referred to as SkateAid and be in production by December.
Other ideas for products are under development, but we must hold back until we can protect ourselves through pending patent applications.
3.1 Product Description
We have two products now being marketed on our website with two more products to be introduced in the near future.
- BladeBoots™ are made from Cordura, a nylon composite cloth that is extremely durable. BladeBoots enable the skater to enter places that normally don’t allow skates while wearing their skates. Our cost to manufacture is $10.00 per set, and they retail for $24.95 per set. The packaging is simple, inexpensive, elegant, and done in-house.
- SkateSails are made of Dacron. The window of the sail is made of carbon fiber-reinforced Mylar. This product is an original concept and design. Our sails come with an Alpha design, known for being very stable and easy to use. We incorporated a swallow-tail design for better upwind performance, speed, and excellent maneuverability. We have a choice of three (3) beautiful colors. The manufacturing cost is $100 and retails for $350 to $500, depending on size.
- We are developing SkateAids, a new product that we feel has a large potential for in this market. The estimated cost to manufacture each unit is $10. They will retail for $45.00. This product is in its advanced development stage so a pending patent and trademark have been applied for.
- Our fourth product is a service: Skate Tours. We are currently working out details with Terry’s Cafe, a skate outlet shop on Santa Monica Beach, and a major skate manufacturer. This tour will take skaters out to sail with SkateSails.
3.2 Competitive Comparison
Our products are unique in the existing skate accessory market. While there are other accessory companies, none produce products as versatile as ours. Our ideas come from listening to what other skaters have to say.
3.3 Sales Literature
For 1999, we are developing a company brochure which will include our products.
We are targeting our market by focusing on Internet sales. A large portion of our advertising budget will be used for Internet advertising such as banners and site-promoting services.
We also plan on a mass postcard mailing media blitz to skate shops and to advertise in most of the major in-line skate magazines by spring time.
3.4 Sourcing
Our Venice, California location is ideal, since Venice is considered the center and birthplace of roller skating. Major local skate shops in the area are now carrying our products.
Our supplier for Cordura is the major distributor on the West Coast. We have a supplier of Dacron (our sail cloth), and a source for aluminum.
All of our costs are at the manufacturer level, and the prices should drop as our production increases.
3.5 Technology
Pegasus Sports International is a progressive company that has been able to combine hi-tech materials and innovative ideas to produce new products with no present competition. We now have a trademark on BladeBoots™, and we are in the process of acquiring trademarks on our other products along with corresponding patents. Some of our hi-tech implementation will be more noticeable when we introduce our SkateAid. This product should make skating more comfortable due to the new chemical products. Our SkateSails are made of aircraft-quality aluminum, the lightest and strongest of sail materials.
We have already designed the next two generations of sails, and this should keep us ahead of any spin-off products that will try to copy us.
3.6 Future Products
We are constantly talking with skaters in order to develop unique products. We feel that the new products we are developing will be very useful, functional, and practical. There are a few more concepts on the drawing board. SkateAids, the newest one, will be in production by December of 1999. This product is being developed with the aid of a foot doctor who is also an avid skater.
Market Analysis Summary
With 31 million skates sold and no support products available, we have an opportunity to reach a market of approximately 26 million recreational and fitness enthusiasts.
There is now a growing trend towards fitness skating. With this large potential market, our products will be there to address their needs.
4.1 Market Segmentation
With a world skating market of over 31 million and steadily growing (statistics released by the Sporting Goods Manufacturers Association), our niche has been created. Our aim is to expand this market by promoting SkateSailing, a new sport which is popular at both Santa Monica and Venice Beach in California.
The Sporting Goods Manufacturers Association survey indicates that in-line skating now has more participation than football, softball, skiing, and snowboarding combined. The breakdown of participation in in-line skating is as follows: 1+% speed (growing), 8% hockey (declining), 7% extreme/aggressive (declining), 22% fitness (nearly 7 million–the fastest growing), and 61% recreational (first-timers). Our products are targeting the fitness and recreational groups, as they are the fastest growing. These groups are gearing themselves towards health and fitness, and combined, they can easily grow to 85% (or 26 million) of the market in the next five years.
| Market Analysis | |||||||
| Year 1 | Year 2 | Year 3 | Year 4 | Year 5 | |||
| Potential Customers | Growth | CAGR | |||||
| Recreational | 10% | 18,910,000 | 20,801,000 | 22,881,100 | 25,169,210 | 27,686,131 | 10.00% |
| Fitness | 15% | 6,820,000 | 7,843,000 | 9,019,450 | 10,372,368 | 11,928,223 | 15.00% |
| Speed | 10% | 387,500 | 426,250 | 468,875 | 515,763 | 567,339 | 10.00% |
| Hockey | -5% | 2,480,000 | 2,356,000 | 2,238,200 | 2,126,290 | 2,019,976 | -5.00% |
| Extreme | -10% | 2,170,000 | 1,953,000 | 1,757,700 | 1,581,930 | 1,423,737 | -10.00% |
| Other | 10% | 232,500 | 255,750 | 281,325 | 309,458 | 340,404 | 10.00% |
| Total | 9.13% | 31,000,000 | 33,635,000 | 36,646,650 | 40,075,019 | 43,965,810 | 9.13% |
4.2 Target Market Segment Strategy
Our target market is the recreational skater and the health and fitness enthusiast. This segment can be reached over the Internet and through skate magazine advertising.
We plan on developing the skate shop market through an inexpensive postcard method.
BladeBoots™ and SkateSails are now sold at the two major skate shops in Santa Monica and Venice, California. Surveys indicate that in the fitness and speed market, the average age is 34 years old, breaking down to 48% women, 52% men, an average of 1.8 years of college education, an average household income of $52,600, and 71% skate on four-wheel in-line skates.
4.2.1 Market Needs
We recognize the need for accessories for the growing market of skaters.
- We promote SkateSailing as a new sport by providing excursions to wide open areas. A major skate company is willing to lend us the new large-wheel skates for our SkateSailing excursions. However, conventional in-line skates will work just as well.
- Soon we will offer SkateAids. The sheer number of existing skates purchased has created a whole new market for products to help increase the life of skates.
We have learned what skaters need for accessories by interviewing experienced skaters.
A person does not have to make time to exercise if skating becomes a lifestyle and is worked into daily activities. Skating is fun and a great cardiovascular workout at the same time, and this is something everyone is looking for.
4.2.2 Market Trends
We will distinguish ourselves by marketing products not previously available to skaters. The emphasis in the past has been to sell skates and very few replacement parts.
The number of skaters is not restricted to any one single country, continent, or age group, so there is a world market. We have products for virtually every group of skaters.
The fastest growing segment of this sport is the fitness skater. Therefore, our marketing is being directed to service this group. BladeBoots™ will enable them to enter establishments without having to remove their skates. BladeBoots will be aimed at the recreational skater, the largest segment; however SkateAids are great for everyone.
There is one more way the sport of skating will grow, and that is through SkateSailing. This sport is primarily for the medium to advanced skater. The growth potential for this sport is tremendous. The sails we’ve manufactured so far have ended up in Europe. The same thing happened with windsurfing. It started out here in Santa Monica but did not take off until it had already grown big in Europe. More and more groups are getting together on skate excursions in cities all over the world. For example, San Francisco has night group skating that numbers in the hundreds of people. The market trends are are showing continued growth in all directions of skating.
4.2.3 Market Growth
With the price of skates going down due to competition by so many skate companies, the market has had steady growth throughout the world, with 22.5 million in 1995 to over 31 million in 1997.
By January 2000 we will get the growth statistics for this year; it is estimated to be over 35 million. More and more people are discovering, and in many cases rediscovering, the health benefits and fun of skating.
4.3 Industry Analysis
Skate sales have undergone tremendous growth and distribution throughout the country.
Presently we will concentrate on Internet marketing. This will maximize our profit.
The Internet is probably the best communication medium for skaters all over the world, and we believe this is the best way to retail our products. The sales on the World Wide Web are now over $28 billion, as quoted by Forester Research, on e-commerce.
4.3.1 Distribution Patterns
We plan on shipping our products using express mail at the U.S. Post Office as our way of distribution, because it is the least expensive way; however, some credit companies demand a shipping receipt and those will be handled by established shippers.
We are also in touch with a few foreign distribution companies that have contacted us and are interested in our products.
4.3.2 Industry Participants
The number of skate companies is very large as many shoe companies have joined in; however, the major and biggest companies are Rollerblade®, Roces®, Solomon®, and K2®.
Some companies make skate bags whose price is in the $20 range. None of them address the problem of entrance to areas that will not allow you to enter while wearing skates, and those products are for the most part bulky and impractical to skate with.
4.3.3 Competition and Buying Patterns
Each segment of skating has its own buying patterns depending on its own needs. The pertaining table in the Market Segmentation topic illustrates this.
4.3.4 Main Competitors
Pegasus Sports International is forming its own market. While there are a few companies that do make sails and foils that a few skaters are using, ours is the only one that is truly designed for and by skaters. Our few competitors’ sails are not designed for skating, but for windsurfing or for skateboards. In the case of foils, storage and carrying are not practical.
We need the capital to protect our inventions through patent application and trademark registration. Our other products do not have competition at this time.
Strategy and Implementation Summary
Our involvement in roller skating goes back 25+ years in Venice, California. We have the reputation and skill that has gained respect from some of the most skilled skaters. We remain close to the skating community through contact with the local skate shops and by giving lessons. Close contact with the public has put us in a unique position to be able to get feedback from skaters of all types on our products and ideas, designed for them.
5.1 Value Proposition
At Pegasus Sports International our emphasis is on quality at a fair price. Our pricing is determined by the cost of production and customer demand, so we pace production by need.
Speed skating’s demographics, as shown in the Market Segmentation and Target Market Strategy topics, show affluent and prime candidates for our higher ticket items. We develop our products for all skaters, but some of our products are more segment-specific, such as our SkateSails which are more for the experienced to expert skater. For example, the speed skating segment is only 1.5% of the entire market, but this is roughly 7 million skaters.
5.2 Competitive Edge
Our company’s competitive edge exists because we are the only company addressing the needs that have resulted from the extensive sales of in-line skates. We wish to fill the need for items which could double the life of a pair of skates.
Accessories such as BladeBoots™ encourage people and make it more convenient to include skating into their lifestyles.
There are several other projects we are currently working on that will broaden our product line and open up our market even more. We will be more than glad to discuss in length some of our future confidential plans, upon request.
5.3 Marketing Strategy
The key to our marketing strategy is focusing on the speed, health and fitness, and recreational skaters. We can cover about 80% of the skating market since we produce products geared towards each segment.
The speed and fitness skaters are an average age of 34 years old with a salary of about $54,000/year and an average of two years of college. This is our SkateSail market. We are in the process of designing more advanced safety equipment that is well-suited for skate sailing, in the future.
Our BladeBoots™ and SkateAids are items that can be useful to all segments of the market.
5.3.1 Pricing Strategy
Pegasus Sports products are priced to encourage the customer to impulse buy, experiment, and repeat buy.
SkateSails are priced from $350 to $500. Lower-priced items are BladeBoots™ at $24.95 and SkateAids for $45.00.
5.3.2 Promotion Strategy
Our long-range goal is to gain enough visibility to expand the product line into other industries and other regions, and to generate inquiries from potential inventors. To do that we need $50,000, or a Line of Credit.
We also plan on promoting our goods at various skating races held throughout the country.
5.3.3 Distribution Strategy
We plan to enter the now extensive specialty skate shop market with SkateAid. We feel this is the competitive edge skate shops need to compete with the large chain discount distributors. The additional products, such as BladeBoots™ and SkateSails, should also help stimulate skate shop sales.
5.3.4 Positioning Statement
We design our products for the skaters who depend on their skating products to be well-designed and practical. We want to help lengthen and improve the life of our customers’ investment–their skates.
The present skate companies concentrate on new skate sales with no support for products already sold, and that is our forte.
5.4 Sales Strategy
For now, our products are sold through our web site. This earns us full retail price.
In nine months, we will gear sales towards the skate shops with SkateAids. Through retail skate shops, we will increase our sales.
Visibility will be very important, and we will gain exposure at skate racing events. We will target our advertising through the major in-line skate magazines and on the Internet.
5.4.1 Sales Forecast
We feel that our sales forecasting is conservative. We will steadily increase sales as our advertising budget allows. Please refer to the Sales Forecast Chart in the Appendix portion of this plan.


| Sales Forecast | |||
| Year 1 | Year 2 | Year 3 | |
| Unit Sales | |||
| BladeBoots | 1,140 | 2,200 | 3,400 |
| SkateSails | 1,072 | 2,100 | 3,200 |
| SkateAid | 1,560 | 7,000 | 11,000 |
| Total Unit Sales | 3,772 | 11,300 | 17,600 |
| Unit Prices | Year 1 | Year 2 | Year 3 |
| BladeBoots | $24.95 | $24.95 | $24.95 |
| SkateSails | $350.00 | $350.00 | $350.00 |
| SkateAid | $45.00 | $45.00 | $45.00 |
| Sales | |||
| BladeBoots | $28,443 | $54,890 | $84,830 |
| SkateSails | $375,200 | $735,000 | $1,120,000 |
| SkateAid | $70,200 | $315,000 | $495,000 |
| Total Sales | $473,843 | $1,104,890 | $1,699,830 |
| Direct Unit Costs | Year 1 | Year 2 | Year 3 |
| BladeBoots | $10.00 | $10.00 | $10.00 |
| SkateSails | $100.00 | $100.00 | $100.00 |
| SkateAid | $7.00 | $7.00 | $7.00 |
| Direct Cost of Sales | |||
| BladeBoots | $11,400 | $22,000 | $34,000 |
| SkateSails | $107,200 | $210,000 | $320,000 |
| SkateAid | $10,920 | $49,000 | $77,000 |
| Subtotal Direct Cost of Sales | $129,520 | $281,000 | $431,000 |
5.4.2 Sales Programs
Our sales program consists of Internet advertising and skating magazine ads in order to target our market. On the Internet, banner advertising utilizing link exchange services and high search engine placement will be our primary method of selling.
We presently accept credit card orders through our website. We plan to capture the impulse buyer market, which makes up 80% of all Internet sales.
5.5 Strategic Alliances
Cooperation between Pegasus Sports International and the local skate shops in both Venice and Santa Monica, California, is very good. We hope that our growth will be mutual, since some of our products are designed for the skate shops.
Since Terry’s Cafe in Santa Monica is situated in a parking lot, where skate sailing can be taught and SkateSails can be sold, this can be our home site where we also can arrange the skate sailing excursions.
5.6 Milestones
Sal M. Chavez will concentrate on sales and promotion, teaching skate sailing lessons in addition to overseeing product development.
Sandi M. Arnold will be in charge of production by making sure we have ordered the products needed to maintain a smooth production. Sandi will see to it that our orders will be filled and shipped to their destination.
Beth A. Laird will be in charge of the administrative functions. Her duties will be to run the office. Beth is also our Web Master and will maintain and update our website.
We will work as a team and help each other with all the work required for a smooth running company. Together, we will do whatever it takes to succeed.
| Milestones | |||||
| Milestone | Start Date | End Date | Budget | Manager | Department |
| Sal Chavez | 10/10/1998 | 10/10/1998 | $20,000 | CEO | Sale-Reserch |
| Sandi Arnold | 1/1/1998 | 1/1/1998 | $15,600 | Vice Pres. | Producton |
| Beth Leird | 1/1/1998 | 1/1/1998 | $0 | Admin. | Administrative |
| Totals | $35,600 | ||||
Management Summary
Our group has very diverse talents that seem to complement each other well. Our common bond is our love for skating and fitness. We will create small businesses by teaching independent producers how to make our products. We have developed partnerships so we can control production quality and maintain exclusivity of all products produced.
6.1 Organizational Structure
Pegasus Sports International is organized in three main functional areas: production, sales, and administrative. We all have our assigned jobs but can and will help each other in other areas whenever necessary.
Sal and Sandi will continue to cooperate on product development. Sal Chavez and Sandi Arnold, as owners, are willing to accept the wages shown in the Personnel Table, for the first year in order to help Pegasus Sports International to grow past the break-even point, with the expectations of a steady growth in salary as Pegasus Sports International becomes more successful.
6.2 Management Team
Sal M. Chavez, CEO, has over 23 years of skating experience and is the main force behind our company having earned the respect and good standing in the skating community. He has not driven an automobile in five years, instead skating for all his transportation needs. Because of skating instead of driving, he has not only regained his health, but is now in the best health condition ever thanks to skating. He has worked as a designer of skate products in the past for companies such as ZFlex, Dog Town, and Cheap Skates. This has given him some insight into product development. For the last three years, he worked selling skates at local skate shops and has developed a feel for skaters’ needs and market trends. In college, he majored in chemistry and physics, which has helped tremendously in identifying and developing products that are applicable to our needs.
Sandi M. Arnold, Vice President, loves skating for fitness and speed, which is a real asset for the company. Her ability in the inventing process is invaluable. Sandi’s ability to input ideas when developing products and production procedures makes her a perfect partner in our endeavors.
Beth Laird, our Administrator, and Web Master, has been skating for many years. Beth has been doing our administration work and has been helping to make Pegasus Sports International a reality. Her computer and organizational skills are an imperative part of our development.
6.3 Management Team Gaps
To maintain a lower start-up budget, Sal and Sandi will be the only salaried employees until at least nine months into our operation. We wish to bring Beth into a salaried position as soon as possible. Beth will receive a 10% commission on website orders until the company can afford to hire her full-time. Beth will receive 10% of Pegasus Sports International ownership.
6.4 Personnel Plan
The personnel plan calls for increasing head count by one more employee by April, 2000 since an increase in forecasted sales necessitate more administrative help.
Our aim is to increase salary and compensation in line with a projected increase in sales and profits. Our overall personnel costs for the first 12 months, which includes principals only, is shown below. The present personnel cost figure is subject to change as business demands it.
| Personnel Plan | |||
| Year 1 | Year 2 | Year 3 | |
| Sal | $20,000 | $40,000 | $50,000 |
| Sandi | $15,000 | $40,000 | $50,000 |
| Other | $0 | $200,000 | $300,000 |
| Total People | 2 | 10 | 15 |
| Total Payroll | $35,000 | $280,000 | $400,000 |
Financial Plan
Our goal is to acquire a business loan for 10 years. Our present plan is to utilize the borrowed money for the first year’s operating capital, with cash input on a monthly basis. Such cash input will aid our operating costs and salaries. We should reach our break-even point after our first year. Upon receiving our loan, we would like to incorporate, as this will protect our company, investors, lenders, products, and stockholders. We expect sales to be healthy the first year, and grow steadily through the third year.
If sales don’t measure up to our expectations, this could add an additional six months and an influx of another $20,000, which could be carried by credit card, but we don’t expect this to happen.
These are our strong points:
- We want to finance growth mainly through cash flow. We recognize that this means we will will have to grow at a slower pace than we would like, but this will enable us to build sales through investing in more advertising.
- Our most important asset is inventory turnover. Our ability to schedule production from month to month will help to control inventory costs.
- Collection is not a problem, since we will be credited payment to our bank account in two days by American Merchant Center for all our credit card sales over the Internet.
7.1 Important Assumptions
The financial plan depends on important assumptions, most of which are shown in the General Assumptions table. The key underlying assumptions are:
- A slow-growth economy, without major recession.
- No unforeseen changes in technology to make our products immediately obsolete.
- Access to equity capital and financing sufficient to maintain our financial plan as presented in this table.
| General Assumptions | |||
| Year 1 | Year 2 | Year 3 | |
| Plan Month | 1 | 2 | 3 |
| Current Interest Rate | 12.00% | 12.00% | 12.00% |
| Long-term Interest Rate | 10.50% | 10.50% | 10.50% |
| Tax Rate | 25.00% | 25.00% | 25.00% |
| Other | 0 | 0 | 0 |
7.2 Break-even Analysis
Aside from the standard financial break-even shown, the following is a simplified breakdown of our first year’s overall numbers in broad terms:
| First Year’s Projected Sales: | $473,843 |
| Less 25%Tax: | – $11,846 |
| – | $461,997 |
| Less Production Costs: | -$129,520 |
| – | $332,477 |
| Less Operating Costs: | – $71,450 |
| Profit: | $261,027 |
| Plus Loan: | $ 50,000 |
| Cash at end of the first year: | $311,027 |
| Production Costs for Year 2001: | -$281,065 |
| Projected Profit 1st Year: | $29,962 |
For more detail, see the Projected Profit and Loss Table in the Appendix.

| Break-even Analysis | |
| Monthly Units Break-even | 70 |
| Monthly Revenue Break-even | $8,756 |
| Assumptions: | |
| Average Per-Unit Revenue | $125.62 |
| Average Per-Unit Variable Cost | $34.34 |
| Estimated Monthly Fixed Cost | $6,363 |
7.3 Key Financial Indicators
- The most important indicator is inventory turnover. We have to make sure that turnover stays above 10, or we are clogged with inventory.
- Collection is not a problem, since payment to our bank is two days after receiving our orders via credit card. However, by October 1999, we will initiate skate shop sales and experience an approximately 30-45 day average payment delay. This could cause a change in cash flow, but can be easily managed.

7.4 Projected Profit and Loss
Our goal is to acquire a business loan for a total of ten years. Our present plan is to utilize the borrowed money for the first year’s operating expenses, with cash input on a monthly basis. Such cash input will aid in our advertising, operating costs, and salaries. This loan should help us maintain production and operating costs while developing our customer base and sales. Should sales lag, we plan to maintain solvency with credit card financing. We should reach our break-even point after our first year. Our sales projection is very conservative, considering the sales potential.


| Pro Forma Profit and Loss | |||
| Year 1 | Year 2 | Year 3 | |
| Sales | $473,843 | $1,104,890 | $1,699,830 |
| Direct Cost of Sales | $129,520 | $281,000 | $431,000 |
| Other Costs of Goods | $0 | $0 | $0 |
| Total Cost of Sales | $129,520 | $281,000 | $431,000 |
| Gross Margin | $344,323 | $823,890 | $1,268,830 |
| Gross Margin % | 72.67% | 74.57% | 74.64% |
| Expenses | |||
| Payroll | $35,000 | $280,000 | $400,000 |
| Sales and Marketing and Other Expenses | $18,650 | $36,300 | $49,500 |
| Depreciation | $0 | $0 | $0 |
| Leased Equipment | $1,800 | $5,000 | $10,000 |
| Utilities | $600 | $1,500 | $2,000 |
| Insurance | $6,000 | $12,000 | $12,000 |
| Rent | $10,800 | $12,000 | $15,000 |
| Payroll Taxes | $3,500 | $28,000 | $40,000 |
| Other | $0 | $0 | $0 |
| Total Operating Expenses | $76,350 | $374,800 | $528,500 |
| Profit Before Interest and Taxes | $267,973 | $449,090 | $740,330 |
| EBITDA | $267,973 | $449,090 | $740,330 |
| Interest Expense | $5,330 | $6,880 | $8,148 |
| Taxes Incurred | $65,661 | $110,552 | $183,046 |
| Net Profit | $196,982 | $331,657 | $549,137 |
| Net Profit/Sales | 41.57% | 30.02% | 32.31% |
7.5 Projected Cash Flow
- We want to finance our first year’s growth through a loan.
- The most important indicator is inventory turnover. Our ability to schedule production from month to month will help control inventory costs.
- Collection is not a problem since we will be credited payment to our bank account in two days by American Merchants Center, our credit card company for Internet sales.
- Selling our products over the Internet will allow us full retail price and maximize our profit.

| Pro Forma Cash Flow | |||
| Year 1 | Year 2 | Year 3 | |
| Cash Received | |||
| Cash from Operations | |||
| Cash Sales | $473,843 | $1,104,890 | $1,699,830 |
| Subtotal Cash from Operations | $473,843 | $1,104,890 | $1,699,830 |
| Additional Cash Received | |||
| Sales Tax, VAT, HST/GST Received | $0 | $0 | $0 |
| New Current Borrowing | $0 | $0 | $0 |
| New Other Liabilities (interest-free) | $0 | $0 | $0 |
| New Long-term Liabilities | $50,000 | $34,500 | $0 |
| Sales of Other Current Assets | $0 | $0 | $0 |
| Sales of Long-term Assets | $0 | $0 | $0 |
| New Investment Received | $0 | $0 | $0 |
| Subtotal Cash Received | $523,843 | $1,139,390 | $1,699,830 |
| Expenditures | Year 1 | Year 2 | Year 3 |
| Expenditures from Operations | |||
| Cash Spending | $35,000 | $280,000 | $400,000 |
| Bill Payments | $219,748 | $532,692 | $762,618 |
| Subtotal Spent on Operations | $254,748 | $812,692 | $1,162,618 |
| Additional Cash Spent | |||
| Sales Tax, VAT, HST/GST Paid Out | $0 | $0 | $0 |
| Principal Repayment of Current Borrowing | $4,500 | $0 | $0 |
| Other Liabilities Principal Repayment | $0 | $0 | $0 |
| Long-term Liabilities Principal Repayment | $0 | $3,450 | $6,900 |
| Purchase Other Current Assets | $2,000 | $0 | $0 |
| Purchase Long-term Assets | $0 | $0 | $0 |
| Dividends | $0 | $0 | $0 |
| Subtotal Cash Spent | $261,248 | $816,142 | $1,169,518 |
| Net Cash Flow | $262,595 | $323,248 | $530,312 |
| Cash Balance | $272,591 | $595,839 | $1,126,152 |
7.6 Projected Balance Sheet
As shown on the balance sheet in the following table, we expect a healthy growth in the net worth by the end of the third year.
| Pro Forma Balance Sheet | |||
| Year 1 | Year 2 | Year 3 | |
| Assets | |||
| Current Assets | |||
| Cash | $272,591 | $595,839 | $1,126,152 |
| Inventory | $28,545 | $61,930 | $94,988 |
| Other Current Assets | $2,000 | $2,000 | $2,000 |
| Total Current Assets | $303,136 | $659,769 | $1,223,140 |
| Long-term Assets | |||
| Long-term Assets | $0 | $0 | $0 |
| Accumulated Depreciation | $0 | $0 | $0 |
| Total Long-term Assets | $0 | $0 | $0 |
| Total Assets | $303,136 | $659,769 | $1,223,140 |
| Liabilities and Capital | Year 1 | Year 2 | Year 3 |
| Current Liabilities | |||
| Accounts Payable | $49,358 | $43,284 | $64,418 |
| Current Borrowing | $0 | $0 | $0 |
| Other Current Liabilities | $0 | $0 | $0 |
| Subtotal Current Liabilities | $49,358 | $43,284 | $64,418 |
| Long-term Liabilities | $50,000 | $81,050 | $74,150 |
| Total Liabilities | $99,358 | $124,334 | $138,568 |
| Paid-in Capital | $16,000 | $16,000 | $16,000 |
| Retained Earnings | ($9,204) | $187,778 | $519,436 |
| Earnings | $196,982 | $331,657 | $549,137 |
| Total Capital | $203,778 | $535,436 | $1,084,572 |
| Total Liabilities and Capital | $303,136 | $659,769 | $1,223,140 |
| Net Worth | $203,778 | $535,436 | $1,084,572 |
7.7 Business Ratios
Standard business ratios are included in the table, based on NAICS code 339920 for the Sporting and Athletic Goods Manufacturing industry. The ratio shows a plan for balanced and healthy growth.
| Ratio Analysis | ||||
| Year 1 | Year 2 | Year 3 | Industry Profile | |
| Sales Growth | 0.00% | 133.18% | 53.85% | 8.66% |
| Percent of Total Assets | ||||
| Inventory | 9.42% | 9.39% | 7.77% | 23.04% |
| Other Current Assets | 0.66% | 0.30% | 0.16% | 22.61% |
| Total Current Assets | 100.00% | 100.00% | 100.00% | 75.65% |
| Long-term Assets | 0.00% | 0.00% | 0.00% | 24.35% |
| Total Assets | 100.00% | 100.00% | 100.00% | 100.00% |
| Current Liabilities | 16.28% | 6.56% | 5.27% | 37.93% |
| Long-term Liabilities | 16.49% | 12.28% | 6.06% | 14.30% |
| Total Liabilities | 32.78% | 18.85% | 11.33% | 52.23% |
| Net Worth | 67.22% | 81.15% | 88.67% | 47.77% |
| Percent of Sales | ||||
| Sales | 100.00% | 100.00% | 100.00% | 100.00% |
| Gross Margin | 72.67% | 74.57% | 74.64% | 22.53% |
| Selling, General & Administrative Expenses | 30.26% | 44.21% | 42.22% | 5.73% |
| Advertising Expenses | 2.53% | 2.26% | 2.06% | 0.36% |
| Profit Before Interest and Taxes | 56.55% | 40.65% | 43.55% | 2.95% |
| Main Ratios | ||||
| Current | 6.14 | 15.24 | 18.99 | 1.88 |
| Quick | 5.56 | 13.81 | 17.51 | 1.19 |
| Total Debt to Total Assets | 32.78% | 18.85% | 11.33% | 53.00% |
| Pre-tax Return on Net Worth | 128.89% | 82.59% | 67.51% | 4.52% |
| Pre-tax Return on Assets | 86.64% | 67.02% | 59.86% | 9.61% |
| Additional Ratios | Year 1 | Year 2 | Year 3 | |
| Net Profit Margin | 41.57% | 30.02% | 32.31% | n.a |
| Return on Equity | 96.67% | 61.94% | 50.63% | n.a |
| Activity Ratios | ||||
| Inventory Turnover | 10.85 | 6.21 | 5.49 | n.a |
| Accounts Payable Turnover | 5.45 | 12.17 | 12.17 | n.a |
| Payment Days | 27 | 32 | 25 | n.a |
| Total Asset Turnover | 1.56 | 1.67 | 1.39 | n.a |
| Debt Ratios | ||||
| Debt to Net Worth | 0.49 | 0.23 | 0.13 | n.a |
| Current Liab. to Liab. | 0.50 | 0.35 | 0.46 | n.a |
| Liquidity Ratios | ||||
| Net Working Capital | $253,778 | $616,486 | $1,158,722 | n.a |
| Interest Coverage | 50.28 | 65.27 | 90.86 | n.a |
| Additional Ratios | ||||
| Assets to Sales | 0.64 | 0.60 | 0.72 | n.a |
| Current Debt/Total Assets | 16% | 7% | 5% | n.a |
| Acid Test | 5.56 | 13.81 | 17.51 | n.a |
| Sales/Net Worth | 2.33 | 2.06 | 1.57 | n.a |
| Dividend Payout | 0.00 | 0.00 | 0.00 | n.a |
Appendix
| Sales Forecast | |||||||||||||
| Month 1 | Month 2 | Month 3 | Month 4 | Month 5 | Month 6 | Month 7 | Month 8 | Month 9 | Month 10 | Month 11 | Month 12 | ||
| Unit Sales | |||||||||||||
| BladeBoots | 0% | 20 | 35 | 40 | 50 | 70 | 75 | 75 | 80 | 125 | 160 | 175 | 235 |
| SkateSails | 0% | 5 | 15 | 40 | 52 | 70 | 75 | 80 | 100 | 100 | 150 | 170 | 215 |
| SkateAid | 0% | 15 | 30 | 60 | 70 | 75 | 80 | 115 | 160 | 175 | 200 | 280 | 300 |
| Total Unit Sales | 40 | 80 | 140 | 172 | 215 | 230 | 270 | 340 | 400 | 510 | 625 | 750 | |
| Unit Prices | Month 1 | Month 2 | Month 3 | Month 4 | Month 5 | Month 6 | Month 7 | Month 8 | Month 9 | Month 10 | Month 11 | Month 12 | |
| BladeBoots | $24.95 | $24.95 | $24.95 | $24.95 | $24.95 | $24.95 | $24.95 | $24.95 | $24.95 | $24.95 | $24.95 | $24.95 | |
| SkateSails | $350.00 | $350.00 | $350.00 | $350.00 | $350.00 | $350.00 | $350.00 | $350.00 | $350.00 | $350.00 | $350.00 | $350.00 | |
| SkateAid | $45.00 | $45.00 | $45.00 | $45.00 | $45.00 | $45.00 | $45.00 | $45.00 | $45.00 | $45.00 | $45.00 | $45.00 | |
| Sales | |||||||||||||
| BladeBoots | $499 | $873 | $998 | $1,248 | $1,747 | $1,871 | $1,871 | $1,996 | $3,119 | $3,992 | $4,366 | $5,863 | |
| SkateSails | $1,750 | $5,250 | $14,000 | $18,200 | $24,500 | $26,250 | $28,000 | $35,000 | $35,000 | $52,500 | $59,500 | $75,250 | |
| SkateAid | $675 | $1,350 | $2,700 | $3,150 | $3,375 | $3,600 | $5,175 | $7,200 | $7,875 | $9,000 | $12,600 | $13,500 | |
| Total Sales | $2,924 | $7,473 | $17,698 | $22,598 | $29,622 | $31,721 | $35,046 | $44,196 | $45,994 | $65,492 | $76,466 | $94,613 | |
| Direct Unit Costs | Month 1 | Month 2 | Month 3 | Month 4 | Month 5 | Month 6 | Month 7 | Month 8 | Month 9 | Month 10 | Month 11 | Month 12 | |
| BladeBoots | 0.00% | $10.00 | $10.00 | $10.00 | $10.00 | $10.00 | $10.00 | $10.00 | $10.00 | $10.00 | $10.00 | $10.00 | $10.00 |
| SkateSails | 0.00% | $100.00 | $100.00 | $100.00 | $100.00 | $100.00 | $100.00 | $100.00 | $100.00 | $100.00 | $100.00 | $100.00 | $100.00 |
| SkateAid | 0.00% | $7.00 | $7.00 | $7.00 | $7.00 | $7.00 | $7.00 | $7.00 | $7.00 | $7.00 | $7.00 | $7.00 | $7.00 |
| Direct Cost of Sales | |||||||||||||
| BladeBoots | $200 | $350 | $400 | $500 | $700 | $750 | $750 | $800 | $1,250 | $1,600 | $1,750 | $2,350 | |
| SkateSails | $500 | $1,500 | $4,000 | $5,200 | $7,000 | $7,500 | $8,000 | $10,000 | $10,000 | $15,000 | $17,000 | $21,500 | |
| SkateAid | $105 | $210 | $420 | $490 | $525 | $560 | $805 | $1,120 | $1,225 | $1,400 | $1,960 | $2,100 | |
| Subtotal Direct Cost of Sales | $805 | $2,060 | $4,820 | $6,190 | $8,225 | $8,810 | $9,555 | $11,920 | $12,475 | $18,000 | $20,710 | $25,950 | |
| Personnel Plan | |||||||||||||
| Month 1 | Month 2 | Month 3 | Month 4 | Month 5 | Month 6 | Month 7 | Month 8 | Month 9 | Month 10 | Month 11 | Month 12 | ||
| Sal | 0% | $1,667 | $1,667 | $1,667 | $1,667 | $1,667 | $1,667 | $1,667 | $1,667 | $1,667 | $1,667 | $1,667 | $1,667 |
| Sandi | 0% | $1,250 | $1,250 | $1,250 | $1,250 | $1,250 | $1,250 | $1,250 | $1,250 | $1,250 | $1,250 | $1,250 | $1,250 |
| Other | 0% | $0 | $0 | $0 | $0 | $0 | $0 | $0 | $0 | $0 | $0 | $0 | $0 |
| Total People | 2 | 2 | 2 | 2 | 2 | 2 | 2 | 2 | 2 | 2 | 2 | 2 | |
| Total Payroll | $2,917 | $2,917 | $2,917 | $2,917 | $2,917 | $2,917 | $2,917 | $2,917 | $2,917 | $2,917 | $2,917 | $2,917 | |
| General Assumptions | |||||||||||||
| Month 1 | Month 2 | Month 3 | Month 4 | Month 5 | Month 6 | Month 7 | Month 8 | Month 9 | Month 10 | Month 11 | Month 12 | ||
| Plan Month | 1 | 2 | 3 | 4 | 5 | 6 | 7 | 8 | 9 | 10 | 11 | 12 | |
| Current Interest Rate | 12.00% | 12.00% | 12.00% | 12.00% | 12.00% | 12.00% | 12.00% | 12.00% | 12.00% | 12.00% | 12.00% | 12.00% | |
| Long-term Interest Rate | 10.50% | 10.50% | 10.50% | 10.50% | 10.50% | 10.50% | 10.50% | 10.50% | 10.50% | 10.50% | 10.50% | 10.50% | |
| Tax Rate | 25.00% | 25.00% | 25.00% | 25.00% | 25.00% | 25.00% | 25.00% | 25.00% | 25.00% | 25.00% | 25.00% | 25.00% | |
| Other | 0 | 0 | 0 | 0 | 0 | 0 | 0 | 0 | 0 | 0 | 0 | 0 | |
| Pro Forma Profit and Loss | |||||||||||||
| Month 1 | Month 2 | Month 3 | Month 4 | Month 5 | Month 6 | Month 7 | Month 8 | Month 9 | Month 10 | Month 11 | Month 12 | ||
| Sales | $2,924 | $7,473 | $17,698 | $22,598 | $29,622 | $31,721 | $35,046 | $44,196 | $45,994 | $65,492 | $76,466 | $94,613 | |
| Direct Cost of Sales | $805 | $2,060 | $4,820 | $6,190 | $8,225 | $8,810 | $9,555 | $11,920 | $12,475 | $18,000 | $20,710 | $25,950 | |
| Other Costs of Goods | $0 | $0 | $0 | $0 | $0 | $0 | $0 | $0 | $0 | $0 | $0 | $0 | |
| Total Cost of Sales | $805 | $2,060 | $4,820 | $6,190 | $8,225 | $8,810 | $9,555 | $11,920 | $12,475 | $18,000 | $20,710 | $25,950 | |
| Gross Margin | $2,119 | $5,413 | $12,878 | $16,408 | $21,397 | $22,911 | $25,491 | $32,276 | $33,519 | $47,492 | $55,756 | $68,663 | |
| Gross Margin % | 72.47% | 72.44% | 72.77% | 72.61% | 72.23% | 72.23% | 72.74% | 73.03% | 72.88% | 72.52% | 72.92% | 72.57% | |
| Expenses | |||||||||||||
| Payroll | $2,917 | $2,917 | $2,917 | $2,917 | $2,917 | $2,917 | $2,917 | $2,917 | $2,917 | $2,917 | $2,917 | $2,917 | |
| Sales and Marketing and Other Expenses | $1,550 | $1,600 | $1,550 | $1,550 | $1,550 | $1,550 | $1,550 | $1,550 | $1,550 | $1,550 | $1,550 | $1,550 | |
| Depreciation | $0 | $0 | $0 | $0 | $0 | $0 | $0 | $0 | $0 | $0 | $0 | $0 | |
| Leased Equipment | $150 | $150 | $150 | $150 | $150 | $150 | $150 | $150 | $150 | $150 | $150 | $150 | |
| Utilities | $50 | $50 | $50 | $50 | $50 | $50 | $50 | $50 | $50 | $50 | $50 | $50 | |
| Insurance | $500 | $500 | $500 | $500 | $500 | $500 | $500 | $500 | $500 | $500 | $500 | $500 | |
| Rent | $900 | $900 | $900 | $900 | $900 | $900 | $900 | $900 | $900 | $900 | $900 | $900 | |
| Payroll Taxes | 10% | $292 | $292 | $292 | $292 | $292 | $292 | $292 | $292 | $292 | $292 | $292 | $292 |
| Other | $0 | $0 | $0 | $0 | $0 | $0 | $0 | $0 | $0 | $0 | $0 | $0 | |
| Total Operating Expenses | $6,358 | $6,408 | $6,358 | $6,358 | $6,358 | $6,358 | $6,358 | $6,358 | $6,358 | $6,358 | $6,358 | $6,358 | |
| Profit Before Interest and Taxes | ($4,239) | ($995) | $6,520 | $10,049 | $15,038 | $16,553 | $19,133 | $25,918 | $27,160 | $41,134 | $49,398 | $62,305 | |
| EBITDA | ($4,239) | ($995) | $6,520 | $10,049 | $15,038 | $16,553 | $19,133 | $25,918 | $27,160 | $41,134 | $49,398 | $62,305 | |
| Interest Expense | $473 | $463 | $453 | $443 | $438 | $438 | $438 | $438 | $438 | $438 | $438 | $438 | |
| Taxes Incurred | ($1,178) | ($364) | $1,517 | $2,402 | $3,650 | $4,029 | $4,674 | $6,370 | $6,681 | $10,174 | $12,240 | $15,467 | |
| Net Profit | ($3,534) | ($1,093) | $4,550 | $7,205 | $10,950 | $12,087 | $14,022 | $19,110 | $20,042 | $30,522 | $36,720 | $46,401 | |
| Net Profit/Sales | -120.86% | -14.63% | 25.71% | 31.88% | 36.97% | 38.10% | 40.01% | 43.24% | 43.58% | 46.60% | 48.02% | 49.04% | |
| Pro Forma Cash Flow | |||||||||||||
| Month 1 | Month 2 | Month 3 | Month 4 | Month 5 | Month 6 | Month 7 | Month 8 | Month 9 | Month 10 | Month 11 | Month 12 | ||
| Cash Received | |||||||||||||
| Cash from Operations | |||||||||||||
| Cash Sales | $2,924 | $7,473 | $17,698 | $22,598 | $29,622 | $31,721 | $35,046 | $44,196 | $45,994 | $65,492 | $76,466 | $94,613 | |
| Subtotal Cash from Operations | $2,924 | $7,473 | $17,698 | $22,598 | $29,622 | $31,721 | $35,046 | $44,196 | $45,994 | $65,492 | $76,466 | $94,613 | |
| Additional Cash Received | |||||||||||||
| Sales Tax, VAT, HST/GST Received | 0.00% | $0 | $0 | $0 | $0 | $0 | $0 | $0 | $0 | $0 | $0 | $0 | $0 |
| New Current Borrowing | $0 | $0 | $0 | $0 | $0 | $0 | $0 | $0 | $0 | $0 | $0 | $0 | |
| New Other Liabilities (interest-free) | $0 | $0 | $0 | $0 | $0 | $0 | $0 | $0 | $0 | $0 | $0 | $0 | |
| New Long-term Liabilities | $50,000 | $0 | $0 | $0 | $0 | $0 | $0 | $0 | $0 | $0 | $0 | $0 | |
| Sales of Other Current Assets | $0 | $0 | $0 | $0 | $0 | $0 | $0 | $0 | $0 | $0 | $0 | $0 | |
| Sales of Long-term Assets | $0 | $0 | $0 | $0 | $0 | $0 | $0 | $0 | $0 | $0 | $0 | $0 | |
| New Investment Received | $0 | $0 | $0 | $0 | $0 | $0 | $0 | $0 | $0 | $0 | $0 | $0 | |
| Subtotal Cash Received | $52,924 | $7,473 | $17,698 | $22,598 | $29,622 | $31,721 | $35,046 | $44,196 | $45,994 | $65,492 | $76,466 | $94,613 | |
| Expenditures | Month 1 | Month 2 | Month 3 | Month 4 | Month 5 | Month 6 | Month 7 | Month 8 | Month 9 | Month 10 | Month 11 | Month 12 | |
| Expenditures from Operations | |||||||||||||
| Cash Spending | $2,917 | $2,917 | $2,917 | $2,917 | $2,917 | $2,917 | $2,917 | $2,917 | $2,917 | $2,917 | $2,917 | $2,917 | |
| Bill Payments | $325 | $3,819 | $6,456 | $13,291 | $14,117 | $17,972 | $17,414 | $19,122 | $24,733 | $24,128 | $38,187 | $40,185 | |
| Subtotal Spent on Operations | $3,241 | $6,736 | $9,372 | $16,207 | $17,033 | $20,888 | $20,330 | $22,039 | $27,650 | $27,045 | $41,103 | $43,102 | |
| Additional Cash Spent | |||||||||||||
| Sales Tax, VAT, HST/GST Paid Out | $0 | $0 | $0 | $0 | $0 | $0 | $0 | $0 | $0 | $0 | $0 | $0 | |
| Principal Repayment of Current Borrowing | $1,000 | $1,000 | $1,000 | $1,000 | $500 | $0 | $0 | $0 | $0 | $0 | $0 | $0 | |
| Other Liabilities Principal Repayment | $0 | $0 | $0 | $0 | $0 | $0 | $0 | $0 | $0 | $0 | $0 | $0 | |
| Long-term Liabilities Principal Repayment | $0 | $0 | $0 | $0 | $0 | $0 | $0 | $0 | $0 | $0 | $0 | $0 | |
| Purchase Other Current Assets | $0 | $0 | $0 | $0 | $0 | $0 | $0 | $0 | $0 | $0 | $2,000 | $0 | |
| Purchase Long-term Assets | $0 | $0 | $0 | $0 | $0 | $0 | $0 | $0 | $0 | $0 | $0 | $0 | |
| Dividends | $0 | $0 | $0 | $0 | $0 | $0 | $0 | $0 | $0 | $0 | $0 | $0 | |
| Subtotal Cash Spent | $4,241 | $7,736 | $10,372 | $17,207 | $17,533 | $20,888 | $20,330 | $22,039 | $27,650 | $27,045 | $43,103 | $43,102 | |
| Net Cash Flow | $48,683 | ($262) | $7,326 | $5,390 | $12,088 | $10,833 | $14,716 | $22,157 | $18,344 | $38,447 | $33,363 | $51,511 | |
| Cash Balance | $58,679 | $58,416 | $65,742 | $71,132 | $83,220 | $94,053 | $108,769 | $130,926 | $149,270 | $187,717 | $221,080 | $272,591 | |
| Pro Forma Balance Sheet | |||||||||||||
| Month 1 | Month 2 | Month 3 | Month 4 | Month 5 | Month 6 | Month 7 | Month 8 | Month 9 | Month 10 | Month 11 | Month 12 | ||
| Assets | Starting Balances | ||||||||||||
| Current Assets | |||||||||||||
| Cash | $9,996 | $58,679 | $58,416 | $65,742 | $71,132 | $83,220 | $94,053 | $108,769 | $130,926 | $149,270 | $187,717 | $221,080 | $272,591 |
| Inventory | $1,500 | $1,695 | $2,266 | $5,302 | $6,809 | $9,048 | $9,691 | $10,511 | $13,112 | $13,723 | $19,800 | $22,781 | $28,545 |
| Other Current Assets | $0 | $0 | $0 | $0 | $0 | $0 | $0 | $0 | $0 | $0 | $0 | $2,000 | $2,000 |
| Total Current Assets | $11,496 | $60,374 | $60,682 | $71,044 | $77,941 | $92,268 | $103,744 | $119,279 | $144,038 | $162,992 | $207,517 | $245,861 | $303,136 |
| Long-term Assets | |||||||||||||
| Long-term Assets | $0 | $0 | $0 | $0 | $0 | $0 | $0 | $0 | $0 | $0 | $0 | $0 | $0 |
| Accumulated Depreciation | $0 | $0 | $0 | $0 | $0 | $0 | $0 | $0 | $0 | $0 | $0 | $0 | $0 |
| Total Long-term Assets | $0 | $0 | $0 | $0 | $0 | $0 | $0 | $0 | $0 | $0 | $0 | $0 | $0 |
| Total Assets | $11,496 | $60,374 | $60,682 | $71,044 | $77,941 | $92,268 | $103,744 | $119,279 | $144,038 | $162,992 | $207,517 | $245,861 | $303,136 |
| Liabilities and Capital | Month 1 | Month 2 | Month 3 | Month 4 | Month 5 | Month 6 | Month 7 | Month 8 | Month 9 | Month 10 | Month 11 | Month 12 | |
| Current Liabilities | |||||||||||||
| Accounts Payable | $200 | $3,612 | $6,013 | $12,825 | $13,517 | $17,393 | $16,783 | $18,297 | $23,945 | $22,857 | $36,860 | $38,483 | $49,358 |
| Current Borrowing | $4,500 | $3,500 | $2,500 | $1,500 | $500 | $0 | $0 | $0 | $0 | $0 | $0 | $0 | $0 |
| Other Current Liabilities | $0 | $0 | $0 | $0 | $0 | $0 | $0 | $0 | $0 | $0 | $0 | $0 | $0 |
| Subtotal Current Liabilities | $4,700 | $7,112 | $8,513 | $14,325 | $14,017 | $17,393 | $16,783 | $18,297 | $23,945 | $22,857 | $36,860 | $38,483 | $49,358 |
| Long-term Liabilities | $0 | $50,000 | $50,000 | $50,000 | $50,000 | $50,000 | $50,000 | $50,000 | $50,000 | $50,000 | $50,000 | $50,000 | $50,000 |
| Total Liabilities | $4,700 | $57,112 | $58,513 | $64,325 | $64,017 | $67,393 | $66,783 | $68,297 | $73,945 | $72,857 | $86,860 | $88,483 | $99,358 |
| Paid-in Capital | $16,000 | $16,000 | $16,000 | $16,000 | $16,000 | $16,000 | $16,000 | $16,000 | $16,000 | $16,000 | $16,000 | $16,000 | $16,000 |
| Retained Earnings | ($9,204) | ($9,204) | ($9,204) | ($9,204) | ($9,204) | ($9,204) | ($9,204) | ($9,204) | ($9,204) | ($9,204) | ($9,204) | ($9,204) | ($9,204) |
| Earnings | $0 | ($3,534) | ($4,627) | ($77) | $7,128 | $18,079 | $30,165 | $44,187 | $63,297 | $83,339 | $113,861 | $150,582 | $196,982 |
| Total Capital | $6,796 | $3,262 | $2,169 | $6,719 | $13,924 | $24,875 | $36,961 | $50,983 | $70,093 | $90,135 | $120,657 | $157,378 | $203,778 |
| Total Liabilities and Capital | $11,496 | $60,374 | $60,682 | $71,044 | $77,941 | $92,268 | $103,744 | $119,279 | $144,038 | $162,992 | $207,517 | $245,861 | $303,136 |
| Net Worth | $6,796 | $3,262 | $2,169 | $6,719 | $13,924 | $24,875 | $36,961 | $50,983 | $70,093 | $90,135 | $120,657 | $157,378 | $203,778 |

