
Information Management Hawaii
Executive Summary
By focusing on its strengths, its key customers, and the underlying values they need, Information Management Hawai’i, Inc. (IMH) will increase sales steadily in its first three years, while also maintaining the gross margin on sales, with a focus on cash management and working capital.
This business plan leads the way. It renews our vision and strategic focus: adding value to our target market segments, and reinforcing our ties with businesses in our local markets. It also provides the step-by-step plan for improving our sales, gross margin, and profitability.
This plan includes this summary, chapters on the company, products and services, market focus, action plans and forecasts, management team, and the financial plan.

1.1 Objectives
1. Achieve healthy earnings (EBIT) in the first year of operation.
2. Maintain a midrange gross margin throughout the entire operation.
3. Maintain just-in-time (JIT) inventory levels, or 11 turns per year.
4. Increase sales modestly but steadily in the second and third years.
1.2 Mission
To provide the Hawai’i business community with quality brand-name Information Technology business information solutions, reliable and professional Technical Support, and unparalleled Customer Service through the application of the principles of Kina`ole and heartfelt aloha, and to earn a fair profit for our employee-owners and stakeholders by embracing sound, ethical business practices.
1.3 Keys to Success
The keys to our success are:
- Building and maintaining strategic alliances with our manufacturers and other industry related business partners;
- Adopting a customer- and market-focused sales and marketing paradigm; and,
- Managing the business by implementing, and consistently measuring and adjusting the fundamentals of a Balanced Scorecard:
- Financial Goals vs. Results
- Internal Business Process Goals vs. Results
- Employee Learning and Growth Goals vs. Results
- Customer Satisfaction Goals vs. Results
Company Summary
Information Management Hawai’i, Inc., will sell and service digital office information systems for Hawai’i’s businesses, with a focus on the Neighbor Island business community. IMH will be formed as the result of the acquisition of three existing businesses: Maui Office Machines, Inc.; Electronics Hawai’i, Inc.; and, Kauai Office Equipment, Inc.
2.1 Company Ownership
IMH will be privately-held [C corporation] owned in majority by the IMH Employee Stock Ownership Trust. There are currently 15 employees, and all will own equal shares in the ESOT. New employees will be given the opportunity to become vested in the Employee Stock Ownership Plan (ESOP) after a suitable probationary period.
2.2 Start-up Summary
Our start-up costs will be $1M, which includes $450,000 for the acquisition of the Maui and Hilo operations of Servco Integrated Office Technology.
The remainder of the funds will be used for:
- Initial Inventory: $200,000
- Initial Capitalization: $225,000
- Legal, Insurance, Rent & Misc: $125,000
The start-up funding will be financed by loans arranged through the Small Business Development Center, and by the Hawai’i Community Loan Fund, and the Small Business Administration as a guarantor. Start-up assumptions are shown in the following table and chart.

| Start-up | |
| Requirements | |
| Start-up Expenses | |
| Legal/Accounting | $10,000 |
| Stationery etc. | $1,500 |
| Brochures | $1,000 |
| Consultants | $7,500 |
| Insurance | $25,000 |
| Rent | $15,000 |
| Software & IT (Web) | $40,000 |
| SPI Buyout | $450,000 |
| Setup New Company/ESOP | $25,000 |
| Total Start-up Expenses | $575,000 |
| Start-up Assets | |
| Cash Required | $225,000 |
| Start-up Inventory | $200,000 |
| Other Current Assets | $0 |
| Long-term Assets | $0 |
| Total Assets | $425,000 |
| Total Requirements | $1,000,000 |
| Start-up Funding | |
| Start-up Expenses to Fund | $575,000 |
| Start-up Assets to Fund | $425,000 |
| Total Funding Required | $1,000,000 |
| Assets | |
| Non-cash Assets from Start-up | $200,000 |
| Cash Requirements from Start-up | $225,000 |
| Additional Cash Raised | $0 |
| Cash Balance on Starting Date | $225,000 |
| Total Assets | $425,000 |
| Liabilities and Capital | |
| Liabilities | |
| Current Borrowing | $1,000,000 |
| Long-term Liabilities | $0 |
| Accounts Payable (Outstanding Bills) | $0 |
| Other Current Liabilities (interest-free) | $0 |
| Total Liabilities | $1,000,000 |
| Capital | |
| Planned Investment | |
| Investor 1 | $0 |
| Investor 2 | $0 |
| Other | $0 |
| Additional Investment Requirement | $0 |
| Total Planned Investment | $0 |
| Loss at Start-up (Start-up Expenses) | ($575,000) |
| Total Capital | ($575,000) |
| Total Capital and Liabilities | $425,000 |
| Total Funding | $1,000,000 |
2.3 Company Locations and Facilities
We have two locations, one in Kahului, Maui and the other in Hilo, Hawai’i. The two offices are presently being leased by Servco Pacific, Inc., and we will rent from them on a month-to-month basis until we are able to relocate to more suitable facilities. On Kauai, we have a sub-contractor agreement with Kauai Office Equipment to handle installations and service.
Products and Services
IMH will acquire an existing operation whose primary business has been the sale and service of business appliances (copiers, facsimiles, printers, etc.) and has operated as a part of the office equipment industry. We will build from this base to transform the business into a value-added provider of the emerging services and technologies of the new Information Industry. Following the lead of Canon, USA and other manufacturers which we represent, we will approach the marketplace from a total systems solutions viewpoint.
This new paradigm will begin with an analysis of the client’s existing and planned business processes, and will provide total workflow solutions utilizing multifunctional imaging platforms and information distribution systems. These systems will be backed by professional and reliable technical service and proactive customer service. By forming strategic alliances with local Information Industry Value-Added Resellers, we will be able to offer turnkey Local Area Network (LAN) systems and the ability to retrofit existing LAN and peer-to-peer systems.
3.1 Sales Literature
Copies of our product and sales literature are attached as appendices. Of course, one of our first tasks will be to change the message of our literature to make sure we are selling the company, rather than the product.
3.2 Product and Service Description
IMH will market and sell brand name business information distribution systems and hardware, technical service and support for these products, and the consumable supplies used by these systems. We will be a single-source provider for business information and imaging products and services.
After researching our various manufacturer’s offerings and evaluating our core competencies, we will focus our marketing and sales efforts around the digital products offered by Canon USA and eCopy, Inc. We will supplement this product line with Lexmark and Hewlett Packard printer products. As we continue to transition the company into the digital marketplace, we will form alliances with additional IT manufacturers and suppliers who can round out our product and services line.
Hardware product offerings will include:
- Canon ImageRunner multifunctional products (scan/copy/print/fax)
- Canon multifunctional facsimiles (print/fax)
- Canon Graphics reproduction products (commercial color)
- Canon Micrographics products (electronic document storage)
- Canon Printer products (color)
- Lexmark Printer products (monochrome and color)
- Hewlett Packard Printer products (laser)
Software offerings will include:
- eCopy ScanStation
- eCopy ShareScan
- eCopy Desktop
- Canon Image Platform (document distribution)
Service Products include:
- All-inclusive maintenance agreements (on-call service and supplies)
- Walk-in service (time and materials)
- Warranty Repairs (certain Canon consumer products)
- Sale of consumable products for all brand names (Canon, Ricoh, Xerox, HP, Lexmark)
Professional Services include:
- Information Workflow analysis and design
- Network design and installation (sub-contracted)
3.3 Competitive Comparison
The only way we can hope to differentiate well is to define the vision of the company to be an information technology ally to our clients. We will not be able to compete in any effective way with the large mainland-based office equipment companies by selling boxes or products as appliances. We need to offer a real alliance to our local customers.
The benefits we sell include many intangibles: confidence, reliability, knowing that somebody will be there to answer questions and help at the important times. These are complex products that require serious knowledge and experience to use. Our competitors tend to sell only the products themselves, and very little in the way of after-sale training and support.

Unfortunately, we cannot sell the products at a higher price just because we offer services; the market has shown that it will not support that concept. We have to also sell the service and consumable supplies and charge for them separately. This monthly recurring revenue is the foundation of our financial stability.
3.4 Technology
New technology has changed almost everything about the traditional office equipment (copier) industry, and for all practical purposes it no longer exists. The new Information Industry has emerged because of the technology of convergence. The primary driver of convergence of different forms of information is technological change, specifically the rapid diffusion of digital technology into an ever-wider array of information businesses. Beyond digitization, dramatic changes in computing and telecommunications industries (mainly in faster microprocessors and increasing bandwidth) are also driving convergence.
IMH will make convergence the theme of its vision, planning, and marketing strategies. We will move into the new Information Industry’s technology with the aim of bringing the most efficient workflow solutions to our clients while providing value-added customer support and service, and earning a reasonable profit in the process.
3.5 Service and Support
Our strategy hinges on providing unparalleled service and support, which is critical to setting us apart from the competition. We need to differentiate on service and support in order to become true partners with our clients. Our service offers will include:
- Uptime guarantees: we will include “uptime guarantees” with our all-inclusive service agreements to insure maximum productivity for our clients.
- Internal training: the “learning and growth” part of our Balanced Scorecard performance measurement strategy will include the requirement that our Systems Engineers and sales professionals become network and IT certified by the end of FY2003.
- Customer training: we will package comprehensive customer training programs with all of our offerings, to include systematic follow up and refresher training.
- Upgrade analysis: we will periodically assess our client’s business processes and requirements, and offer cost-effective upgrade solutions to meet changing needs.
3.6 Future Products and Services
Beginning at start up, we will explore and research new information technologies for inclusion in our product offerings. The products which we choose will be in line with our vision to transition the company from being an appliance seller, to being a provider of total information management solutions. These convergent information products will include:
- Wireless LAN systems
- Information management systems (hardware and software)
- Tele-business and E-Commerce systems
- Media transport and reproduction (distribute and print)
3.7 Fulfillment
We have an established relationship with our manufacturers and suppliers, and will be able to take advantage of all discounts and promotions in order to keep our margins at roughly 49% throughout the operation. We will also implement and employ “just-in-time” inventory strategies for hardware, supplies, and service parts orders to further strengthen our margins.
As we continue to grow the business, we will evaluate other IT industry manufacturers and product lines to strengthen our offerings with a view primarily to quality and margin advantages.
Market Analysis Summary
IMH will focus on local markets, including small offices and home offices (1-9 employees), medium to large businesses (10-99 employees), corporate Hawai’i (multiple locations or 100+ employees), and local government offices.
4.1 Market Segmentation
Our market segmentation scheme is fairly straightforward, and focuses on all Neighbor Island businesses. The information contained in our customer analysis table is taken directly from the 2000 US Census and government directories, and clearly shows that our largest market potential is the small office and home office (SOHO) segment. This segment is largely overlooked by most of our competitors because of its “low end” buying habits, and a reluctance to compete with the major retail chain box movers. We will target the SOHO market segment with value-added and affordable business solutions customized to its unique needs, and offer the same quality of service and support as are afforded the larger businesses.
The next largest market segment is medium to large businesses, and is the arena where we now focus most of our sales efforts. We will continue to target this segment, but with a different approach than our predecessors. The strategy used by former management has been to bring in selected products, and then attempt to find a buyer. This resulted in inventory overstock, and obsolescence. We will work with the medium to large businesses to determine their needs, and design customized solutions before ordering the required systems (JIT inventory strategy). This segment will remain an extremely important part of our marketing mix, and contains a large portion of our current clients. A majority of our systems upgrade opportunities and repeat business will come from this market segment initially.
Although the Corporate Hawai’i market segment is the smallest in numbers, it has the potential to provide a significant share of our revenues and growth (the 80/20 rule). We have a scattering of current clients in the Corporate Hawai’i segment, but we need to do a better job of penetrating this lucrative end of the market. We will accomplish this by offering professional services to include workflow and network design, MIS support, and other value-added support benefits such as “uptime guarantees.” We will develop long-term relationships within this segment, and earn their business.
The local government market segment is unique in that we act primarily as a “middle man” for our manufacturers due to GSA price schedules and other national government-only programs. This segment is fiercely competitive, very price-focused, and buying decisions are often influenced by “who you know,” as well as price. We are fortunate in that we have long-established relationships within the County and State government agencies, and have many loyal clients in this segment. We will increase our share of this market segment by offering the same value-added service and support benefits that we bring to our commercial clients.

| Market Analysis | |||||||
| Year 1 | Year 2 | Year 3 | Year 4 | Year 5 | |||
| Potential Customers | Growth | CAGR | |||||
| SOHO | 4% | 6,800 | 7,072 | 7,355 | 7,649 | 7,955 | 4.00% |
| Medium/Large Business | 4% | 2,100 | 2,184 | 2,271 | 2,362 | 2,456 | 3.99% |
| Corporate Hawaii | 3% | 140 | 144 | 148 | 152 | 157 | 2.91% |
| Government Offices | 2% | 1,225 | 1,243 | 1,262 | 1,281 | 1,300 | 1.50% |
| Total | 3.69% | 10,265 | 10,643 | 11,036 | 11,444 | 11,868 | 3.69% |
4.2 Target Market Segment Strategy
Developing a market strategy is a departure from the way the company has been managed in the past. We will change the paradigm of being a product- and price-focused sales organization, to that of becoming a customer- and market-focused organization, with all departments sharing responsibility for customer satisfaction. We will accomplish this paradigm shift through the implementation of a balanced scorecard philosophy of management, with special attention to employee learning and growth.
As mentioned previously our market segmentation strategy is straightforward, and addresses all components of the Neighbor Island business community. Planning and implementing specific strategies for each of the four identified segments will be an on-going process, and we will consult with marketing specialists, and our manufacturers, to further refine these efforts as we develop our marketing plan.
4.2.1 Market Trends
The most significant trend in today’s business-to-business marketplace is the move from analog to digital technology, and from stand-alone workflow functions to multifunctional platforms which are connected to a network. It is this trend that has caused many of the major players in the outdated office equipment (copier) industry (Xerox, IKON, etc.) to falter, and see their profits decline. This is true mainly because of their inability to change rapidly from an “analog mentality” and move forward in applying the emerging convergence of digital information technologies to the marketplace.
That is the primary reason that IMH has chosen Canon USA as its preferred manufacturer. Canon has led the way in the industry with it’s digital technology innovations, and its ability to bring both the product and the concept to the marketplace. We will follow Canon’s lead and bring this efficient, productivity-enhancing technology to Neighbor Island businesses.
4.2.2 Market Growth
As computer prices continue to fall, unit sales increase. The published market research on sales of personal computers is astounding, as the United States market alone is absorbing more than 30 million units per year, and sales are growing at more than 20 percent per year. We could quote Dataquest, Infocorp, IDC, or others; it doesn’t matter, they all agree on high growth of CPU sales.
This rapid growth rate holds true for productivity systems which connect to the computers being sold. The stand-alone analog systems and appliances which abound in the business marketplace today, will be replaced by connected digital convergence systems in the coming months and years. IMH will position itself to be a value-added provider of this rapidly emerging technology for new businesses, while continuing to maintain and upgrade our current analog customer base.
4.2.3 Market Needs
All businesses have in common a need to be continuously productive, and they rely on their service providers and vendors to sustain their productivity. Effectively filling this need requires that the vendor bring to the table sound planning, quality products, reliable service, and a true partnership and support relationship.
Specific business needs include the ability to gather, compile, analyze, and distribute information in various media formats. This is where IMH’s strengths will be most beneficial to our clients, both big and small. Anyone can sell the “box” at an attractive price, but only a true value-added provider can offer the peace-of-mind that comes from a customer-focused approach to the relationship.
Primarily due to geographic isolation and smaller populations, the Neighbor Island business community has an additional common need of being able to rely on other locally-based vendors and suppliers for quick, reliable, customer service and support. Having to call someone on Oahu, or the mainland, to place a service call, or to order supplies, or get an answer to a simple billing question, is both an irritant and a hindrance to most Neighbor Island-based businesses. Our primary goal is to fill this need by bringing true pro-active, and total, customer service to the Neighbor Island business community, and to gain their confidence and loyalty. This will become one of our underlying strengths.
4.3 Service Business Analysis
IMH is a part of the Information Industry, and specializes in providing information management systems and technology for business processes. We envision that a converged information industry operating within the context of an advanced information infrastructure will be a huge boost for U.S. businesses. Several Washington think tanks estimate that it could spur more than $300 billion annually in new sales and increase worker productivity by 20 to 40 percent.
At the present time, an estimated two-thirds of all American jobs are information related, and that number will increase as the shift from manufacturing to service industries continues. The convergence of information industries will continue because the technological and business imperatives are compelling. If one company does not see the possibilities, another will.
4.3.1 Competition and Buying Patterns
Business decision makers and finance managers understand the concept and value of service and support, and are much more likely to pay for it when the offering is clearly stated.
There is no doubt that we compete more against the box pushers than against other service providers. We need to effectively compete against the idea that businesses should buy information platforms as plug-in appliances that don’t need ongoing service, support, and training.
Our research and experience has indicated that our target market segments think about price, but would buy based on quality service if the offering were properly presented. They think about price because that is what is traditionally presented to them first. We have very good indications that many would rather pay 10-20% more for a relationship with a long-term vendor providing back-up and quality service and support. They end up in the box-pusher channels because they are not aware of the alternatives.
Availability is also very important. The business decision makers tend to want immediate, local solutions to problems.
4.3.2 Distributing a Service
Medium to large business segment buyers are accustomed to buying from vendors who visit their offices. They expect the copy machine vendors, office products vendors, and office furniture vendors, as well as the local graphic artists, freelance writers, or whomever, to visit their office to make their sales.
Unfortunately our SOHO target segment buyers may not expect to buy from us. Many of them turn immediately to the retail superstores (office equipment, office supplies, and electronics), the Web, and mail order to look for the best price, without realizing that there is a better option for them for only a little bit more. We will overcome this hurdle through innovative service offerings, and targeted marketing.
4.3.3 Main Competitors
In our higher-end targeted segments (medium to large businesses, corporate Hawai’i, and government offices), the primary competitors are Xerox and Lanier. The secondary “low end” competitors on the Neighbor Islands are Maui Office Machines and Business Equipment on Maui, and Electronics Hawai’i and Stationers on the Big Island. Our overall competitive strategy in these segments will be Canon’s superior technology, and superior value-added service and support.
In our SOHO target segment, the primary competitors are the superstores: Office Max, Office Depot, Sears, and to some extent Costco, Hopaco, and the Web. While these outlets can offer lower prices, they offer no (or very little) aftermarket service or support. That is our competitive advantage in this segment, and will differentiate us from these “box movers.”
4.3.4 Business Participants
The traditional office equipment (copier) industry has been dominated by only a few major manufacturers: Xerox, Canon, Oce, and Ricoh (and its OEM products – Lanier, Savin, and Gestetner); and then come the low-end players: Sharp, Toshiba, and Minolta. With the exception of Xerox, which maintains its own sales force, the other manufacturers distribute and sell mainly through authorized dealers.
The rapidly emerging Information Industry’s digital convergence products will most likely be dominated by the same participants as described above. While Xerox has been a past leader in the manufacture and sales of analog products, Canon has emerged as both an innovator, and the leader, in the new Information Industry with their ImageRunner digital products and Image Platform information distribution systems. Canon is also (and has been for many years) the front runner in color repro-graphic systems, and holds the most patents of any manufacturer in the industry.
Strategy and Implementation Summary
We must differentiate ourselves from the box pushers. We need to establish our business offering as a clear and viable alternative for our target markets, to the price oriented sales pitch to which they are accustomed.
From the standpoint of the office equipment (copier) industry the paradigm has been:
- Copier centric – if they’re not in the market for a copier, they’re not a prospect.
- Price, price, price – must save prospect money in order to gain interest.
- Box movers – selling features.
- Calling on influencers – office managers and purchasing departments.
- 30-day sales window – war with competition mainly on price.
The industry’s cheese has been moved. In order to shift to a more contemporary paradigm, our marketing and sales efforts will need:
- A new attitude – we are at the beginning of a product/technology convergence.
- A new approach – total account management and control.
- A new set of behaviors – solution selling, joint prospecting, systems auditing.
- A new marketing concept – customer oriented, profit oriented, integrated efforts.
5.1 Competitive Edge
Our competitive edge is our positioning as a strategic ally with our clients, who are clients more than customers. By building a business based on long-standing relationships with satisfied clients, we simultaneously build defenses against competition. The longer the relationship stands, the more we help our clients understand what we offer them and why they should both stay with IMH, and refer us to other businesses. In close-knit communities like the Neighbor Islands, reputation is extremely important, and word-of-mouth advertising is invaluable.
5.2 Strategy Pyramid
Our main strategy will be placing emphasis on service and support, and our main tactics are networking expertise, systems training, and implementing a customer relationship management system (CRM) from e-automate. Our specific programs for networking include mailers and internal training. Specific programs for end user training include direct mail promotion, and on-site customer programs. Implementing the CRM software and training will be coordinated with the e-automate Corporation.
Our second strategy is emphasizing relationships. The tactics are marketing the company (instead of the products), more regular contacts with the customer, and increasing sales per customer. Programs for marketing the company include new sales literature, and direct mail. Programs for more regular contacts include call-backs after installation, direct mail, and sales management. Programs for increasing sales per customer include upgrade mailings and sales training.
5.3 Value Proposition
IMH offers its clients peace-of-mind by being a vendor who acts as a strategic ally, and delivers quality products backed by premium service and support, at a premium price.
5.4 Sales Strategy
We will sell the company and its ability to act as an ally. We will sell IMH, and the reputation of the industry-leading manufacturers it represents.
We will sell our service and support. The hardware is like the razor, and the support, service, software, and training, are the razor blades. We need to serve our customers with total solutions, and not just product features. The products are a means to arriving at end solutions.
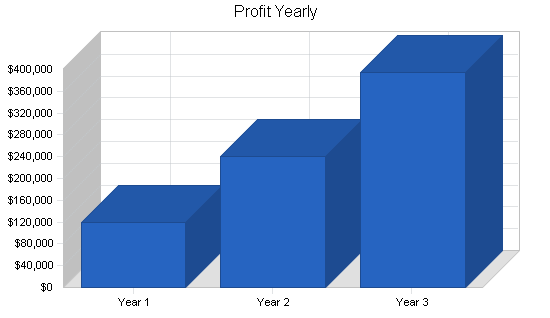
The Yearly Total Sales chart summarizes our conservative sales forecast. We expect sales to increase from $3.1 million in the first year to more than $4 million in the third year of this plan.
5.4.1 Sales Forecast
The important elements of the sales forecast are shown in the following Chart, and Table 5.4.1. Non-hardware sales increase to almost $2 million total in the third year, or 47% of total sales.


| Sales Forecast | |||
| Year 1 | Year 2 | Year 3 | |
| Sales | |||
| Hardware – Image Platforms | $1,092,956 | $1,256,899 | $1,445,434 |
| Hardware – Printers | $69,615 | $80,057 | $92,066 |
| Hardware – Facsimiles | $142,711 | $164,117 | $188,735 |
| Hardware – Misc (TW, Shrd) | $45,250 | $52,037 | $59,843 |
| Professional Services | $29,808 | $34,279 | $39,420 |
| Government (Comp) | $87,019 | $100,072 | $115,082 |
| Supplies (Toner/Paper) | $501,228 | $576,412 | $662,874 |
| Service – Agreements/Repairs | $946,764 | $1,088,779 | $1,252,095 |
| Equipment Rentals | $243,653 | $280,200 | $322,230 |
| Other | $31,327 | $36,026 | $41,430 |
| Total Sales | $3,190,329 | $3,668,878 | $4,219,209 |
| Direct Cost of Sales | Year 1 | Year 2 | Year 3 |
| Hardware – Image Platforms | $677,632 | $772,501 | $880,651 |
| Hardware – Printers | $45,250 | $51,585 | $58,807 |
| Hardware – Facsimiles | $88,481 | $100,868 | $114,989 |
| Hardware – Misc (TW, Shrd) | $31,675 | $36,109 | $41,165 |
| Professional Services | $14,904 | $16,990 | $19,369 |
| Government (Comp) | $30,457 | $34,720 | $39,581 |
| Supplies (Toner/Paper) | $225,553 | $257,130 | $293,128 |
| Service – Agreements/Repairs | $378,706 | $431,724 | $492,166 |
| Equipment Rentals | $134,009 | $152,770 | $174,158 |
| Other | $7,832 | $8,928 | $10,178 |
| Subtotal Direct Cost of Sales | $1,634,497 | $1,863,326 | $2,124,192 |
5.5 Milestones
The following table lists important program milestones, with dates and managers in charge, and budgets for each. The milestone schedule indicates our emphasis on planning for implementation. The most important programs are the sales and marketing programs listed in detail in the previous topics.
| Milestones | |||||
| Milestone | Start Date | End Date | Budget | Manager | Department |
| SIOT (NI) Valuation | 5/1/2001 | 5/31/2001 | $0 | BH | Admin |
| Complete Business Plan | 5/14/2001 | 6/22/2001 | $200 | BH | Admin |
| Submit Letter of Intent | 6/1/2001 | 6/15/2001 | $0 | BH | Admin |
| Choose New Company Name | 6/15/2001 | 7/31/2001 | $0 | All | All |
| Secure Startup Funding | 6/15/2001 | 7/31/2001 | $0 | BH/All | All |
| Retain Attorney/CPA | 6/15/2001 | 7/31/2001 | $10,000 | BH | Marketing |
| Negotiate Purchase Agreement | 6/18/2001 | 8/15/2001 | $0 | BH/All | Admin |
| Set Up ESOT/ESOP | 6/30/2001 | 8/31/2001 | $12,500 | BH/LW | All |
| Set Up New Corporation | 6/30/2001 | 8/31/2001 | $12,500 | BH/LW | All |
| Solicit Board Members | 6/30/2001 | 8/31/2001 | $0 | BH | All |
| HR Roll-Over Plan (SPI to IMH) | 7/1/2001 | 8/31/2001 | $0 | BH/LW | Admin |
| Purchase e-Automate Software | 8/1/2001 | 8/31/2001 | $20,000 | BH/LW | Admin |
| A/P & A/R into e-Automate | 8/1/2001 | 8/31/2001 | $0 | LW | Admin |
| Business Licenses/Permits | 8/1/2001 | 8/31/2001 | $500 | BH/LW | Admin |
| Customers into e-Automate | 8/1/2001 | 8/31/2001 | $0 | JM/BK | Sales |
| Inventory into e-Automate | 8/1/2001 | 8/31/2001 | $0 | LW/JA/EO | Service |
| Letter To Vendors/Customers | 8/1/2001 | 8/31/2001 | $0 | LW | Admin |
| New Stationary/Brochures | 8/1/2001 | 8/31/2001 | $2,500 | LW | Admin |
| Obtain Insurance | 8/1/2001 | 8/31/2001 | $25,000 | BH/LW | Admin |
| Switch Utilities To IMH | 8/1/2001 | 8/31/2001 | $1,000 | LW | Admin |
| Web Site Development | 8/1/2001 | 8/31/2001 | $10,000 | BH | Admin |
| Complete Marketing Plan | 8/1/2001 | 8/31/2001 | $2,500 | All | Sales |
| IMH Operations – Day 1 | 9/3/2001 | 9/3/2001 | $0 | All | All |
| Bd. of Dir. Mtg. (First) | 9/4/2001 | 9/7/2001 | $1,000 | All | All |
| All Company – Kick Off Mtg. | 9/4/2001 | 9/7/2001 | $750 | All | All |
| Sales Strategies & Programs | 9/4/2001 | 9/30/2001 | $2,500 | JM | Sales |
| Marketing Strategy & Programs | 9/4/2001 | 9/30/2001 | $3,500 | BK | Sales |
| First Quarter BP Review | 12/10/2001 | 12/14/2001 | $0 | All | All |
| Headcount Review | 12/10/2001 | 12/14/2001 | $0 | BH/EO/JA | Sales/Svc |
| Bd. of Dir. Mtg. (Qtrly) | 12/10/2001 | 12/14/2001 | $1,000 | All | All |
| Cost IT Training Sources | 3/4/2002 | 3/8/2002 | $0 | BH/EO/JA/BK | Sales/Svc |
| Second Quarter BP/MP Review | 3/4/2002 | 3/8/2002 | $0 | All | All |
| Enroll Team in IT Training | 3/18/2002 | 3/29/2002 | $2,500 | All | All |
| Third Quarter BP/MP Review | 6/3/2002 | 6/7/2002 | $0 | All | All |
| Bd. of Dir. Mtg. (Qtrly) | 6/3/2002 | 6/7/2002 | $1,000 | All | All |
| Fourth Quarter BP/MP Review | 9/2/2002 | 9/5/2002 | $0 | All | All |
| Bd. of Dir. Mtg. (Qtrly) | 9/2/2002 | 9/5/2002 | $1,000 | All | All |
| New 3-Year BP Due | 9/2/2002 | 9/13/2002 | $0 | All | All |
| New 3-Year Mktg. Plan Due | 9/2/2002 | 9/13/2002 | $0 | All | All |
| Name me | 9/16/2002 | 9/30/2002 | $1,000 | All | All |
| Totals | $110,950 | ||||
5.6 Marketing Strategy
The marketing strategy is the core of our main strategy:
- Emphasize service and support
- Build a relationship business
- Develop specific programs for each target market segment:
- SOHO – cost effective service/product “turn key” packages, wireless LAN systems
- Medium to Large Businesses – customer recovery incentives, uptime guarantees, workflow/process surveys
- Corporate Hawai’i – workflow/process surveys, uptime guarantees, LAN installation and administration
- Government Offices – workflow/process surveys, uptime guarantees, GSA rates and incentives
5.6.1 Sales Programs
Specific sales programs will be included in our new Marketing Plan, and will be included in this Business Plan as they are finalized. In general however, our sales programs will be centered around conducting workflow and information distribution analyses, direct mail, and placing an emphasis on the benefits which IMH and its manufacturers will be able to offer its clients through “total care” service and support.
5.6.2 Positioning Statement
For businesses who want to be sure their information distribution systems are always working reliably, IMH is a vendor and trusted strategic ally who makes certain their systems work, their people are trained, and their down time is minimal. Unlike the product/price oriented vendors, it knows the customer and goes to their site when needed, and offers proactive support, service, training, and installation.
5.6.3 Pricing Strategy
We must charge appropriately for the high-end, high-quality service and support we offer. Our revenue structure has to match our cost structure, so the salaries we pay to assure good service and support must be balanced by the revenue we charge.
We cannot build the service and support revenue into the price of products. The market can’t bear the higher prices and the buyer feels ill-used when they see a similar product priced lower with the competition. Despite the logic behind this, the market doesn’t support this concept.
5.6.4 Promotion Strategy
We will employ the following general promotional strategies for the various market segments:
- SOHO: We will depend on periodic local newspaper advertising, to reach new buyers in this segment. We will also utilize direct mail and and the resources of the local Chambers of Commerce and other affinity groups to reach this segment. The message will emphasize service first, and “complete product and service packaging” as a secondary theme.
- Medium to Large Businesses: Direct face-to-face contact (direct sales) will continue to be our primary strategy for this market segment. Direct selling will be supplemented by periodic promotional direct mailings and personalized system upgrade opportunities.
- Corporate Hawai’i: This segment will be handled by direct contact and relationship building only. We will make personal presentations to the decision makers in this group, and stress our service and technical benefits and advantages.
- Government Offices: We will utilize a combination of direct mail and face-to-face promotional strategies with this segment, and the message will be the local service and technical advantages of IMH. We will produce an attractive RFQ/RFP response package to accompany our submissions.
5.6.5 Distribution Strategy
IMH is first and foremost a direct sales organization, meaning that we must present our services and products directly to the majority of our customers and clients. Having said that, for our planned penetration into the SOHO market, we will need to establish a presence as a Value-Added Reseller (VAR) for certain low-end product lines which don’t carry the margins necessary to sustain the costs of direct sales. We will plan our new locations accordingly.
5.6.6 Marketing Programs
As we work to complete this Business Plan, we are simultaneously working on our Marketing Plan. As you can see from the milestones table, we anticipate completion of our detailed Marketing Plan by 9/30/01, or one month from start-up. Because we are acquiring an on-going business, the shift to our vision of customer- and market-focused strategies will not happen overnight. We must plan this shift carefully, and implement it judiciously, so as not to disrupt our immediate operations. We have budgeted for, and will utilize, marketing advisors and consultants (including our manufacturers) in the design of our Marketing Plan.
5.7 Strategic Alliances
Our alliances with our manufacturers, and especially Canon USA, will be the most pivotal to our success. We will remain a Canon Authorized Dealer, and continue to enjoy all of the benefits of this long-standing relationship.
We will form alliances with other locally-based VARs and computer network providers to enable us to provide complete turnkey packages for our clients. These relationships will be included in our Marketing Plan.
Management Summary
Our management philosophy is simple and is an integral part of our values: doing right things right, the first time (Kina’ole).
IMH will be an employee-owned company and we all share the same vision of providing our clients (who in many cases are friends and neighbors) with the very best in customer service – period. We will encourage personal growth, creativity, and enable individual empowerment to achieve this goal. We will manage the business by setting achievable Balanced Scorecard goals, measuring them, and making mid-stream adjustments as necessary.
6.1 Organizational Structure
Our team includes 15 employees initially, and is organizationally flat. The departmental divisions are sales and marketing, service, and administration. Operational managers include:
- President and General Manager: Oversees all operations, with primary responsibilities for sales and marketing. Functioning as the GM, this position will spend a good deal of time in the field assisting the Account Managers, and helping to build and maintain client relationships.
- Secretary/Treasurer and Administrative Manager: Oversees all administrative functions including inventory, A/P and A/R, banking, HR, and vendor and manufacturer relations. Primary contact point for customer service issues and follow up. Will be assisted by an Office Manager in the Hilo branch.
- Systems Manager (two positions – Big Island and Maui): Oversees all service issues including service agreements, service call prioritization and response, carry-in service, customer support, and systems training and development. Will be assisted by Systems Engineers, and Systems Technicians.
6.2 Personnel Plan
The total head count moving over from Servco at the time of the acquisition will be 13. We are adding two former employees at startup to round out our team, for a total startup head count of 15.
There are an additional six positions shown as “vacant” in the Personnel plan. During each quarterly business plan review, we will assess the need to fund these positions to sustain our growth, and more evenly distribute the workload.
| Personnel Plan | |||
| Year 1 | Year 2 | Year 3 | |
| Production Personnel | |||
| None planned | $0 | $0 | $0 |
| Other | $0 | $0 | $0 |
| Subtotal | $0 | $0 | $0 |
| Sales and Marketing Personnel | |||
| Alan Fukuyama – Sales (Maui) | $38,250 | $40,545 | $42,978 |
| Brian Kurlansky – Sales (Kona) | $38,250 | $40,545 | $42,978 |
| Jay Moore – Sales (Maui) | $38,250 | $40,545 | $42,978 |
| Wilbert Shimabukuro – Sales (Hilo) | $38,250 | $40,545 | $42,978 |
| Vacant – Aftermarket Sales (Maui) | $0 | $0 | $0 |
| Vacant – Aftermarket Sales (Hilo) | $0 | $0 | $0 |
| Subtotal | $153,000 | $162,180 | $171,911 |
| General and Administrative Personnel | |||
| Bill Harding – General Manager | $57,600 | $61,056 | $64,719 |
| Laurie Watson – Admin Manager | $45,600 | $48,336 | $51,236 |
| Vacant – Office Manager (Hilo) | $31,200 | $33,072 | $35,056 |
| Vacant – Whse & Delivery (Maui) | $0 | $0 | $0 |
| Vacant – Whse & Delivery (Hilo) | $0 | $0 | $0 |
| Other | $0 | $0 | $0 |
| Subtotal | $134,400 | $142,464 | $151,012 |
| Other Personnel | |||
| Earle Oshiro – Systems Manager (Hilo) | $49,800 | $52,788 | $55,955 |
| Joe Alfonsi – Systems Manager (Maui) | $49,800 | $52,788 | $55,955 |
| Wane Ogawa – Syst Engineer (Hilo) | $39,600 | $41,976 | $44,495 |
| Francis Takahashi – Syst Engineer (Hilo) | $39,600 | $41,976 | $44,495 |
| Baron Ganeko – Syst Engineer (Kona) | $39,600 | $41,976 | $44,495 |
| Abe Braceros – Sr. Syst Engineer (Maui) | $41,100 | $43,566 | $46,180 |
| Arlo Villanueva – Syst Tech (Maui) | $28,800 | $30,528 | $32,360 |
| Caroline Nacua – Syst Tech (Maui) | $28,800 | $30,528 | $32,360 |
| Vacant – Syst Tech (Kona) | $0 | $0 | $0 |
| Vacant – Syst Tech (Maui) | $0 | $0 | $0 |
| Subtotal | $317,100 | $336,126 | $356,294 |
| Total People | 15 | 15 | 15 |
| Total Payroll | $604,500 | $640,770 | $679,216 |
6.3 Management Team
Bill Harding, president and general manager: XX years old, and has lived on Maui for 43 years. Joined SIOT in 1998 as Maui branch manager, and became general manager for Neighbor Island operations six months later. Prior management experience includes: BTA market manager of the Neighbor Islands for VoiceStream Wireless, Neighbor Island area sales manager for Central Security Systems, and radar project manager for Telcom International in Nigeria, West Africa. Bill has attended numerous management and sales training courses and seminars throughout his career.
Laurie Watson, secretary/treasurer and administrative manager: XX years old, and local Maui resident. Has been at the same location through three different owners prior to Servco’s acquisition of The Office Place in 1995, for a total of 15 years of local office equipment industry experience. Laurie has extensive knowledge of service procedures and dispatching, A/R and A/P procedures, inventory control and tracking, as well as an intimate knowledge of our customer base. Her experience and knowledge will be invaluable in recovering our customer base, and in growing the business.
Anne Tioganco, office manager (Hilo): XX years old, and local Hilo resident. Anne has also been with the company through all of the acquisitions, and has XX years experience in the office equipment industry. She will assist Laurie by handling the administrative and customer service tasks for our Hilo branch, and will be instrumental in our Big Island customer recovery efforts.
Earle Oshiro, systems manager (Big Island): XX years old, and local Hilo resident. Like Laurie and Anne above, Earle has been with the company through four different owners, and has XX years of local office equipment service management experience. Earle has also completed Canon’s “train the trainer” course, and will be a great asset in the on-going training and development of our systems engineers and technicians.
Joseph Alfonsi, systems manager (Maui): XX years old, and local Maui resident. Joe joined the Maui branch of SIOT in 1999 as field service manager, after transferring from the SIOT Honolulu branch. He has XX years of local office equipment industry service experience, and is familiar with both Canon and Ricoh products. Joe is an asset to the Maui team, and has outstanding customer service skills.
6.4 Management Team Gaps
We believe we have a good team for covering the main points of the business plan. Key members have the experience and knowledge to manage and grow the business, and are highly motivated by the employee-owner concept.
The obvious management gap is a plan to fill the general manager’s position at some point in the future, before the current GM reaches retirement age. As an employee-owned company, the preferred strategy will be to promote from within, and fill vacancies as they occur. As the company grows, we will seek out additional talent in all operational areas.
Financial Plan
Although we are treating the business as a start-up company, the financial plan is solidly based on past performance. We have taken actual SIOT P&L income and expenses from the past three years, and eliminated corporate overhead expenses such as warehouse and administrative costs, inventory penalties, and corporate nominal interest. We then projected income based on actual past performance, and factored back in the revenue base that was relocated to Honolulu over the past two years (mainly service and supplies).
We approached the financial planning from a conservative standpoint, and based those numbers on achievable gross margins. Also, our actual interest and tax rates will most likely be lower than the assumed rates due to our being structured as an employee-owned corporation (ESOT).
7.1 Important Assumptions
The financial plan depends on important assumptions, most of which are shown in Table 7.1. As mentioned previously, we assumed interest and tax rates based on a “worst case” scenario, and these will be adjusted once we have finalized the initial funding and establish the ESOT. We have also assumed our personnel burden at 30% of payroll in order to allow for above-average benefits for our employees. As we shop around for benefits vendors, this assumption will be subject to revision as well.
Other key business assumptions are:
- We assume continued steady economic growth on the Neighbor Islands as predicted by Bank of Hawaii, and other Hawai’i economists.
- We assume the continued move towards convergence technology in the Information Industry.
- We assume access to the start-up funding necessary to re-shape and re-build the company, and to provide adequate initial capitalization.
| General Assumptions | |||
| Year 1 | Year 2 | Year 3 | |
| Plan Month | 1 | 2 | 3 |
| Current Interest Rate | 14.00% | 14.00% | 14.00% |
| Long-term Interest Rate | 10.00% | 10.00% | 10.00% |
| Tax Rate | 37.33% | 38.00% | 37.33% |
| Other | 0 | 0 | 0 |
7.2 Key Financial Indicators
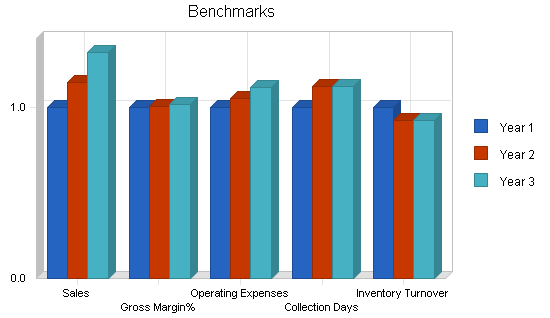
As shown in the Benchmarks chart below, our key financial indicators are:
- Projected Sales: Projections are based on actual past performance, and are conservative. We will increase sales at an average rate of 15% per year.
- Gross Margins: Average gross margins are based on: hardware sales = 37%; service = 57%; supplies = 52%; and, other = 50%, for an overall operating gross margin of 49%.
- Operating Expenses: Operating expenses are based on providing our employee-owners with above average wages and benefits, and providing superior customer service. Expenses are projected to increase at the rate of 6% per year.
- Collection Days (A/R): Based on the extensive use of leasing, and including service and supply agreements into leasing packages, we will maintain an average A/R turnover of 30 days. This is projected to be reduced to 28 days in subsequent years by increasing efficiencies in our internal business processes.
- Inventory Turnover: We will maintain just-in-time inventory levels, or 11 turns per year. This will require accurate sales forecasting, and working closely with our manufacturers. We have already begun this process under SIOT, and the Neighbor Island inventory levels are well below previous years.
7.3 Break-even Analysis
For our break-even analysis, we assume running costs which include our full payroll, rent, and utilities, and an estimation of other running costs. Payroll alone, at present, is about $65,500 per month (including benefits and taxes).
We will monitor gross margins very closely, and maintain them at a midrange percentage by taking advantage of all promotions and discounts offered by our manufacturers. Canon USA has tentatively agreed to offer us “end column” pricing as a new dealer incentive.
The chart shows what we need to sell per month to break even, according to these assumptions. This is about 78% of our projected sales for our first year, and is well below what we have achieved annually over the past three years under more adverse operating conditions.

| Break-even Analysis | |
| Monthly Revenue Break-even | $209,018 |
| Assumptions: | |
| Average Percent Variable Cost | 51% |
| Estimated Monthly Fixed Cost | $101,932 |
7.4 Projected Profit and Loss
Our Pro Forma Profit and Loss statement was constructed from a conservative point-of-view, and is based in large part on past performance. By strengthening our service position, and rebuilding our customer relationships, we will widen our customer base and increase sales.
Month-to-month assumptions for profit and loss are included in the appendix.


| Pro Forma Profit and Loss | |||
| Year 1 | Year 2 | Year 3 | |
| Sales | $3,190,329 | $3,668,878 | $4,219,209 |
| Direct Cost of Sales | $1,634,497 | $1,863,326 | $2,124,192 |
| Production Payroll | $0 | $0 | $0 |
| Other | $0 | $0 | $0 |
| Total Cost of Sales | $1,634,497 | $1,863,326 | $2,124,192 |
| Gross Margin | $1,555,832 | $1,805,552 | $2,095,017 |
| Gross Margin % | 48.77% | 49.21% | 49.65% |
| Operating Expenses | |||
| Sales and Marketing Expenses | |||
| Sales and Marketing Payroll | $153,000 | $162,180 | $171,911 |
| Advertising/Promotion | $10,500 | $11,130 | $11,798 |
| Commissions | $159,516 | $169,087 | $179,233 |
| Travel – Sales | $22,500 | $23,850 | $25,281 |
| Learning & Growth – Sales | $6,150 | $6,519 | $6,910 |
| Entertainment | $5,400 | $5,724 | $6,067 |
| Total Sales and Marketing Expenses | $357,066 | $378,490 | $401,200 |
| Sales and Marketing % | 11.19% | 10.32% | 9.51% |
| General and Administrative Expenses | |||
| General and Administrative Payroll | $134,400 | $142,464 | $151,012 |
| Sales and Marketing and Other Expenses | $0 | $0 | $0 |
| Depreciation | $0 | $0 | $0 |
| Depreciation | $0 | $0 | $0 |
| Utilities | $9,000 | $9,540 | $10,112 |
| Telephone & ISP | $34,200 | $36,252 | $38,427 |
| Office Supplies | $4,200 | $4,452 | $4,719 |
| Insurance | $16,800 | $17,808 | $18,876 |
| Bank Charges | $6,000 | $6,360 | $6,742 |
| Postage | $10,020 | $10,621 | $11,258 |
| Taxes & Licenses | $10,200 | $10,812 | $11,461 |
| Bonuses | $0 | $0 | $0 |
| Learning & Growth – Admin | $3,150 | $3,339 | $3,539 |
| Accounting | $6,000 | $6,360 | $6,742 |
| Rent | $72,000 | $72,000 | $72,000 |
| Payroll Taxes | $181,350 | $192,231 | $203,765 |
| Other General and Administrative Expenses | $0 | $0 | $0 |
| Total General and Administrative Expenses | $487,320 | $512,239 | $538,654 |
| General and Administrative % | 15.27% | 13.96% | 12.77% |
| Other Expenses: | |||
| Other Payroll | $317,100 | $336,126 | $356,294 |
| Consultants | $0 | $0 | $0 |
| Learning & Growth – Service | $9,200 | $9,752 | $10,337 |
| Travel – Service | $22,500 | $23,850 | $25,281 |
| Freight & Cartage | $30,000 | $31,800 | $33,708 |
| Total Other Expenses | $378,800 | $401,528 | $425,620 |
| Other % | 11.87% | 10.94% | 10.09% |
| Total Operating Expenses | $1,223,186 | $1,292,258 | $1,365,473 |
| Profit Before Interest and Taxes | $332,645 | $513,294 | $729,544 |
| EBITDA | $332,645 | $513,294 | $729,544 |
| Interest Expense | $140,000 | $127,050 | $99,750 |
| Taxes Incurred | $72,797 | $146,773 | $235,123 |
| Net Profit | $119,848 | $239,471 | $394,671 |
| Net Profit/Sales | 3.76% | 6.53% | 9.35% |
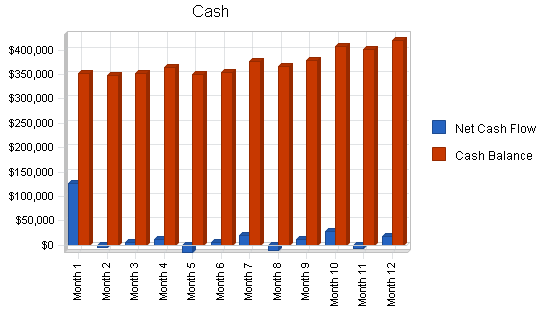
7.5 Projected Cash Flow
Because we are treating the new company as a start-up, the cash flow for FY2002 is somewhat exaggerated by the instant influx of new capital. Subsequent years however show a healthy growth in cash flow, mainly due to the short 60-month repayment of the start-up loan and increased sales.
| Pro Forma Cash Flow | |||
| Year 1 | Year 2 | Year 3 | |
| Cash Received | |||
| Cash from Operations | |||
| Cash Sales | $2,073,714 | $2,384,771 | $2,742,486 |
| Cash from Receivables | $906,354 | $1,252,568 | $1,440,453 |
| Subtotal Cash from Operations | $2,980,067 | $3,637,339 | $4,182,939 |
| Additional Cash Received | |||
| Sales Tax, VAT, HST/GST Received | $0 | $0 | $0 |
| New Current Borrowing | $0 | $0 | $0 |
| New Other Liabilities (interest-free) | $0 | $0 | $0 |
| New Long-term Liabilities | $0 | $0 | $0 |
| Sales of Other Current Assets | $0 | $0 | $0 |
| Sales of Long-term Assets | $0 | $0 | $0 |
| New Investment Received | $30,000 | $0 | $0 |
| Subtotal Cash Received | $3,010,067 | $3,637,339 | $4,182,939 |
| Expenditures | Year 1 | Year 2 | Year 3 |
| Expenditures from Operations | |||
| Cash Spending | $604,500 | $640,770 | $679,216 |
| Bill Payments | $2,210,315 | $2,809,360 | $3,143,202 |
| Subtotal Spent on Operations | $2,814,815 | $3,450,130 | $3,822,418 |
| Additional Cash Spent | |||
| Sales Tax, VAT, HST/GST Paid Out | $0 | $0 | $0 |
| Principal Repayment of Current Borrowing | $0 | $185,000 | $205,000 |
| Other Liabilities Principal Repayment | $0 | $0 | $0 |
| Long-term Liabilities Principal Repayment | $0 | $0 | $0 |
| Purchase Other Current Assets | $0 | $0 | $0 |
| Purchase Long-term Assets | $0 | $0 | $0 |
| Dividends | $0 | $0 | $0 |
| Subtotal Cash Spent | $2,814,815 | $3,635,130 | $4,027,418 |
| Net Cash Flow | $195,252 | $2,209 | $155,521 |
| Cash Balance | $420,252 | $422,461 | $577,982 |
7.6 Projected Balance Sheet
The Projected Balance Sheet is quite solid. We do not project any trouble meeting our debt obligations as long as we achieve our specific objectives.
| Pro Forma Balance Sheet | |||
| Year 1 | Year 2 | Year 3 | |
| Assets | |||
| Current Assets | |||
| Cash | $420,252 | $422,461 | $577,982 |
| Accounts Receivable | $210,261 | $241,801 | $278,071 |
| Inventory | $172,142 | $196,241 | $223,715 |
| Other Current Assets | $0 | $0 | $0 |
| Total Current Assets | $802,655 | $860,503 | $1,079,768 |
| Long-term Assets | |||
| Long-term Assets | $0 | $0 | $0 |
| Accumulated Depreciation | $0 | $0 | $0 |
| Total Long-term Assets | $0 | $0 | $0 |
| Total Assets | $802,655 | $860,503 | $1,079,768 |
| Liabilities and Capital | Year 1 | Year 2 | Year 3 |
| Current Liabilities | |||
| Accounts Payable | $227,807 | $231,184 | $260,778 |
| Current Borrowing | $1,000,000 | $815,000 | $610,000 |
| Other Current Liabilities | $0 | $0 | $0 |
| Subtotal Current Liabilities | $1,227,807 | $1,046,184 | $870,778 |
| Long-term Liabilities | $0 | $0 | $0 |
| Total Liabilities | $1,227,807 | $1,046,184 | $870,778 |
| Paid-in Capital | $30,000 | $30,000 | $30,000 |
| Retained Earnings | ($575,000) | ($455,152) | ($215,681) |
| Earnings | $119,848 | $239,471 | $394,671 |
| Total Capital | ($425,152) | ($185,681) | $208,990 |
| Total Liabilities and Capital | $802,655 | $860,503 | $1,079,768 |
| Net Worth | ($425,152) | ($185,681) | $208,990 |
7.7 Business Ratios
The following table shows our main business ratios, and is compared to national averages. Our SIC industry class is currently: Office equipment, nec – 5044.99.
| Ratio Analysis | ||||
| Year 1 | Year 2 | Year 3 | Industry Profile | |
| Sales Growth | 0.00% | 15.00% | 15.00% | 1.50% |
| Percent of Total Assets | ||||
| Accounts Receivable | 26.20% | 28.10% | 25.75% | 30.97% |
| Inventory | 21.45% | 22.81% | 20.72% | 38.08% |
| Other Current Assets | 0.00% | 0.00% | 0.00% | 16.04% |
| Total Current Assets | 100.00% | 100.00% | 100.00% | 85.09% |
| Long-term Assets | 0.00% | 0.00% | 0.00% | 14.91% |
| Total Assets | 100.00% | 100.00% | 100.00% | 100.00% |
| Current Liabilities | 152.97% | 121.58% | 80.64% | 44.30% |
| Long-term Liabilities | 0.00% | 0.00% | 0.00% | 8.46% |
| Total Liabilities | 152.97% | 121.58% | 80.64% | 52.76% |
| Net Worth | -52.97% | -21.58% | 19.36% | 47.24% |
| Percent of Sales | ||||
| Sales | 100.00% | 100.00% | 100.00% | 100.00% |
| Gross Margin | 48.77% | 49.21% | 49.65% | 26.76% |
| Selling, General & Administrative Expenses | 45.02% | 42.69% | 40.40% | 15.95% |
| Advertising Expenses | 0.33% | 0.30% | 0.28% | 0.95% |
| Profit Before Interest and Taxes | 10.43% | 13.99% | 17.29% | 2.55% |
| Main Ratios | ||||
| Current | 0.65 | 0.82 | 1.24 | 1.80 |
| Quick | 0.51 | 0.63 | 0.98 | 0.87 |
| Total Debt to Total Assets | 152.97% | 121.58% | 80.64% | 6.22% |
| Pre-tax Return on Net Worth | -45.31% | -208.01% | 301.35% | 55.95% |
| Pre-tax Return on Assets | 24.00% | 44.89% | 58.33% | 14.11% |
| Additional Ratios | Year 1 | Year 2 | Year 3 | |
| Net Profit Margin | 3.76% | 6.53% | 9.35% | n.a |
| Return on Equity | 0.00% | 0.00% | 188.85% | n.a |
| Activity Ratios | ||||
| Accounts Receivable Turnover | 5.31 | 5.31 | 5.31 | n.a |
| Collection Days | 57 | 64 | 64 | n.a |
| Inventory Turnover | 10.91 | 10.12 | 10.12 | n.a |
| Accounts Payable Turnover | 10.70 | 12.17 | 12.17 | n.a |
| Payment Days | 27 | 30 | 28 | n.a |
| Total Asset Turnover | 3.97 | 4.26 | 3.91 | n.a |
| Debt Ratios | ||||
| Debt to Net Worth | 0.00 | 0.00 | 4.17 | n.a |
| Current Liab. to Liab. | 1.00 | 1.00 | 1.00 | n.a |
| Liquidity Ratios | ||||
| Net Working Capital | ($425,152) | ($185,681) | $208,990 | n.a |
| Interest Coverage | 2.38 | 4.04 | 7.31 | n.a |
| Additional Ratios | ||||
| Assets to Sales | 0.25 | 0.23 | 0.26 | n.a |
| Current Debt/Total Assets | 153% | 122% | 81% | n.a |
| Acid Test | 0.34 | 0.40 | 0.66 | n.a |
| Sales/Net Worth | 0.00 | 0.00 | 20.19 | n.a |
| Dividend Payout | 0.00 | 0.00 | 0.00 | n.a |
Appendix
| Sales Forecast | |||||||||||||
| Month 1 | Month 2 | Month 3 | Month 4 | Month 5 | Month 6 | Month 7 | Month 8 | Month 9 | Month 10 | Month 11 | Month 12 | ||
| Sales | |||||||||||||
| Hardware – Image Platforms | 0% | $78,500 | $78,500 | $78,500 | $86,350 | $86,350 | $86,350 | $94,985 | $94,985 | $94,985 | $104,484 | $104,484 | $104,484 |
| Hardware – Printers | 0% | $5,000 | $5,000 | $5,000 | $5,500 | $5,500 | $5,500 | $6,050 | $6,050 | $6,050 | $6,655 | $6,655 | $6,655 |
| Hardware – Facsimiles | 0% | $10,250 | $10,250 | $10,250 | $11,275 | $11,275 | $11,275 | $12,403 | $12,403 | $12,403 | $13,643 | $13,643 | $13,643 |
| Hardware – Misc (TW, Shrd) | 0% | $3,250 | $3,250 | $3,250 | $3,575 | $3,575 | $3,575 | $3,933 | $3,933 | $3,933 | $4,326 | $4,326 | $4,326 |
| Professional Services | 0% | $0 | $0 | $2,500 | $2,750 | $2,750 | $2,750 | $3,025 | $3,025 | $3,025 | $3,328 | $3,328 | $3,328 |
| Government (Comp) | 0% | $6,250 | $6,250 | $6,250 | $6,875 | $6,875 | $6,875 | $7,563 | $7,563 | $7,563 | $8,319 | $8,319 | $8,319 |
| Supplies (Toner/Paper) | 0% | $36,000 | $36,000 | $36,000 | $39,600 | $39,600 | $39,600 | $43,560 | $43,560 | $43,560 | $47,916 | $47,916 | $47,916 |
| Service – Agreements/Repairs | 0% | $68,000 | $68,000 | $68,000 | $74,800 | $74,800 | $74,800 | $82,280 | $82,280 | $82,280 | $90,508 | $90,508 | $90,508 |
| Equipment Rentals | 0% | $17,500 | $17,500 | $17,500 | $19,250 | $19,250 | $19,250 | $21,175 | $21,175 | $21,175 | $23,293 | $23,293 | $23,293 |
| Other | 0% | $2,250 | $2,250 | $2,250 | $2,475 | $2,475 | $2,475 | $2,723 | $2,723 | $2,723 | $2,995 | $2,995 | $2,995 |
| Total Sales | $227,000 | $227,000 | $229,500 | $252,450 | $252,450 | $252,450 | $277,695 | $277,695 | $277,695 | $305,465 | $305,465 | $305,465 | |
| Direct Cost of Sales | Month 1 | Month 2 | Month 3 | Month 4 | Month 5 | Month 6 | Month 7 | Month 8 | Month 9 | Month 10 | Month 11 | Month 12 | |
| Hardware – Image Platforms | $48,670 | $48,670 | $48,670 | $53,537 | $53,537 | $53,537 | $58,891 | $58,891 | $58,891 | $64,780 | $64,780 | $64,780 | |
| Hardware – Printers | $3,250 | $3,250 | $3,250 | $3,575 | $3,575 | $3,575 | $3,933 | $3,933 | $3,933 | $4,326 | $4,326 | $4,326 | |
| Hardware – Facsimiles | $6,355 | $6,355 | $6,355 | $6,991 | $6,991 | $6,991 | $7,690 | $7,690 | $7,690 | $8,459 | $8,459 | $8,459 | |
| Hardware – Misc (TW, Shrd) | $2,275 | $2,275 | $2,275 | $2,503 | $2,503 | $2,503 | $2,753 | $2,753 | $2,753 | $3,028 | $3,028 | $3,028 | |
| Professional Services | $0 | $0 | $1,250 | $1,375 | $1,375 | $1,375 | $1,513 | $1,513 | $1,513 | $1,664 | $1,664 | $1,664 | |
| Government (Comp) | $2,188 | $2,188 | $2,188 | $2,406 | $2,406 | $2,406 | $2,647 | $2,647 | $2,647 | $2,912 | $2,912 | $2,912 | |
| Supplies (Toner/Paper) | $16,200 | $16,200 | $16,200 | $17,820 | $17,820 | $17,820 | $19,602 | $19,602 | $19,602 | $21,562 | $21,562 | $21,562 | |
| Service – Agreements/Repairs | $27,200 | $27,200 | $27,200 | $29,920 | $29,920 | $29,920 | $32,912 | $32,912 | $32,912 | $36,203 | $36,203 | $36,203 | |
| Equipment Rentals | $9,625 | $9,625 | $9,625 | $10,588 | $10,588 | $10,588 | $11,646 | $11,646 | $11,646 | $12,811 | $12,811 | $12,811 | |
| Other | $563 | $563 | $563 | $619 | $619 | $619 | $681 | $681 | $681 | $749 | $749 | $749 | |
| Subtotal Direct Cost of Sales | $116,325 | $116,325 | $117,575 | $129,333 | $129,333 | $129,333 | $142,266 | $142,266 | $142,266 | $156,492 | $156,492 | $156,492 | |
| Personnel Plan | |||||||||||||
| Month 1 | Month 2 | Month 3 | Month 4 | Month 5 | Month 6 | Month 7 | Month 8 | Month 9 | Month 10 | Month 11 | Month 12 | ||
| Production Personnel | |||||||||||||
| None planned | $0 | $0 | $0 | $0 | $0 | $0 | $0 | $0 | $0 | $0 | $0 | $0 | |
| Other | $0 | $0 | $0 | $0 | $0 | $0 | $0 | $0 | $0 | $0 | $0 | $0 | |
| Subtotal | $0 | $0 | $0 | $0 | $0 | $0 | $0 | $0 | $0 | $0 | $0 | $0 | |
| Sales and Marketing Personnel | |||||||||||||
| Alan Fukuyama – Sales (Maui) | $3,000 | $3,000 | $3,000 | $3,250 | $3,250 | $3,250 | $3,250 | $3,250 | $3,250 | $3,250 | $3,250 | $3,250 | |
| Brian Kurlansky – Sales (Kona) | $3,000 | $3,000 | $3,000 | $3,250 | $3,250 | $3,250 | $3,250 | $3,250 | $3,250 | $3,250 | $3,250 | $3,250 | |
| Jay Moore – Sales (Maui) | $3,000 | $3,000 | $3,000 | $3,250 | $3,250 | $3,250 | $3,250 | $3,250 | $3,250 | $3,250 | $3,250 | $3,250 | |
| Wilbert Shimabukuro – Sales (Hilo) | $3,000 | $3,000 | $3,000 | $3,250 | $3,250 | $3,250 | $3,250 | $3,250 | $3,250 | $3,250 | $3,250 | $3,250 | |
| Vacant – Aftermarket Sales (Maui) | $0 | $0 | $0 | $0 | $0 | $0 | $0 | $0 | $0 | $0 | $0 | $0 | |
| Vacant – Aftermarket Sales (Hilo) | $0 | $0 | $0 | $0 | $0 | $0 | $0 | $0 | $0 | $0 | $0 | $0 | |
| Subtotal | $12,000 | $12,000 | $12,000 | $13,000 | $13,000 | $13,000 | $13,000 | $13,000 | $13,000 | $13,000 | $13,000 | $13,000 | |
| General and Administrative Personnel | |||||||||||||
| Bill Harding – General Manager | $4,500 | $4,500 | $4,500 | $4,900 | $4,900 | $4,900 | $4,900 | $4,900 | $4,900 | $4,900 | $4,900 | $4,900 | |
| Laurie Watson – Admin Manager | $3,650 | $3,650 | $3,650 | $3,850 | $3,850 | $3,850 | $3,850 | $3,850 | $3,850 | $3,850 | $3,850 | $3,850 | |
| Vacant – Office Manager (Hilo) | $2,450 | $2,450 | $2,450 | $2,650 | $2,650 | $2,650 | $2,650 | $2,650 | $2,650 | $2,650 | $2,650 | $2,650 | |
| Vacant – Whse & Delivery (Maui) | $0 | $0 | $0 | $0 | $0 | $0 | $0 | $0 | $0 | $0 | $0 | $0 | |
| Vacant – Whse & Delivery (Hilo) | $0 | $0 | $0 | $0 | $0 | $0 | $0 | $0 | $0 | $0 | $0 | $0 | |
| Other | $0 | $0 | $0 | $0 | $0 | $0 | $0 | $0 | $0 | $0 | $0 | $0 | |
| Subtotal | $10,600 | $10,600 | $10,600 | $11,400 | $11,400 | $11,400 | $11,400 | $11,400 | $11,400 | $11,400 | $11,400 | $11,400 | |
| Other Personnel | |||||||||||||
| Earle Oshiro – Systems Manager (Hilo) | $4,000 | $4,000 | $4,000 | $4,200 | $4,200 | $4,200 | $4,200 | $4,200 | $4,200 | $4,200 | $4,200 | $4,200 | |
| Joe Alfonsi – Systems Manager (Maui) | $4,000 | $4,000 | $4,000 | $4,200 | $4,200 | $4,200 | $4,200 | $4,200 | $4,200 | $4,200 | $4,200 | $4,200 | |
| Wane Ogawa – Syst Engineer (Hilo) | $3,150 | $3,150 | $3,150 | $3,350 | $3,350 | $3,350 | $3,350 | $3,350 | $3,350 | $3,350 | $3,350 | $3,350 | |
| Francis Takahashi – Syst Engineer (Hilo) | $3,150 | $3,150 | $3,150 | $3,350 | $3,350 | $3,350 | $3,350 | $3,350 | $3,350 | $3,350 | $3,350 | $3,350 | |
| Baron Ganeko – Syst Engineer (Kona) | $3,150 | $3,150 | $3,150 | $3,350 | $3,350 | $3,350 | $3,350 | $3,350 | $3,350 | $3,350 | $3,350 | $3,350 | |
| Abe Braceros – Sr. Syst Engineer (Maui) | $3,200 | $3,200 | $3,200 | $3,500 | $3,500 | $3,500 | $3,500 | $3,500 | $3,500 | $3,500 | $3,500 | $3,500 | |
| Arlo Villanueva – Syst Tech (Maui) | $2,250 | $2,250 | $2,250 | $2,450 | $2,450 | $2,450 | $2,450 | $2,450 | $2,450 | $2,450 | $2,450 | $2,450 | |
| Caroline Nacua – Syst Tech (Maui) | $2,250 | $2,250 | $2,250 | $2,450 | $2,450 | $2,450 | $2,450 | $2,450 | $2,450 | $2,450 | $2,450 | $2,450 | |
| Vacant – Syst Tech (Kona) | $0 | $0 | $0 | $0 | $0 | $0 | $0 | $0 | $0 | $0 | $0 | $0 | |
| Vacant – Syst Tech (Maui) | $0 | $0 | $0 | $0 | $0 | $0 | $0 | $0 | $0 | $0 | $0 | $0 | |
| Subtotal | $25,150 | $25,150 | $25,150 | $26,850 | $26,850 | $26,850 | $26,850 | $26,850 | $26,850 | $26,850 | $26,850 | $26,850 | |
| Total People | 15 | 15 | 15 | 15 | 15 | 15 | 15 | 15 | 15 | 15 | 15 | 15 | |
| Total Payroll | $47,750 | $47,750 | $47,750 | $51,250 | $51,250 | $51,250 | $51,250 | $51,250 | $51,250 | $51,250 | $51,250 | $51,250 | |
| General Assumptions | |||||||||||||
| Month 1 | Month 2 | Month 3 | Month 4 | Month 5 | Month 6 | Month 7 | Month 8 | Month 9 | Month 10 | Month 11 | Month 12 | ||
| Plan Month | 1 | 2 | 3 | 4 | 5 | 6 | 7 | 8 | 9 | 10 | 11 | 12 | |
| Current Interest Rate | 14.00% | 14.00% | 14.00% | 14.00% | 14.00% | 14.00% | 14.00% | 14.00% | 14.00% | 14.00% | 14.00% | 14.00% | |
| Long-term Interest Rate | 10.00% | 10.00% | 10.00% | 10.00% | 10.00% | 10.00% | 10.00% | 10.00% | 10.00% | 10.00% | 10.00% | 10.00% | |
| Tax Rate | 30.00% | 38.00% | 38.00% | 38.00% | 38.00% | 38.00% | 38.00% | 38.00% | 38.00% | 38.00% | 38.00% | 38.00% | |
| Other | 0 | 0 | 0 | 0 | 0 | 0 | 0 | 0 | 0 | 0 | 0 | 0 | |
| Pro Forma Profit and Loss | |||||||||||||
| Month 1 | Month 2 | Month 3 | Month 4 | Month 5 | Month 6 | Month 7 | Month 8 | Month 9 | Month 10 | Month 11 | Month 12 | ||
| Sales | $227,000 | $227,000 | $229,500 | $252,450 | $252,450 | $252,450 | $277,695 | $277,695 | $277,695 | $305,465 | $305,465 | $305,465 | |
| Direct Cost of Sales | $116,325 | $116,325 | $117,575 | $129,333 | $129,333 | $129,333 | $142,266 | $142,266 | $142,266 | $156,492 | $156,492 | $156,492 | |
| Production Payroll | $0 | $0 | $0 | $0 | $0 | $0 | $0 | $0 | $0 | $0 | $0 | $0 | |
| Other | $0 | $0 | $0 | $0 | $0 | $0 | $0 | $0 | $0 | $0 | $0 | $0 | |
| Total Cost of Sales | $116,325 | $116,325 | $117,575 | $129,333 | $129,333 | $129,333 | $142,266 | $142,266 | $142,266 | $156,492 | $156,492 | $156,492 | |
| Gross Margin | $110,675 | $110,675 | $111,925 | $123,118 | $123,118 | $123,118 | $135,429 | $135,429 | $135,429 | $148,972 | $148,972 | $148,972 | |
| Gross Margin % | 48.76% | 48.76% | 48.77% | 48.77% | 48.77% | 48.77% | 48.77% | 48.77% | 48.77% | 48.77% | 48.77% | 48.77% | |
| Operating Expenses | |||||||||||||
| Sales and Marketing Expenses | |||||||||||||
| Sales and Marketing Payroll | $12,000 | $12,000 | $12,000 | $13,000 | $13,000 | $13,000 | $13,000 | $13,000 | $13,000 | $13,000 | $13,000 | $13,000 | |
| Advertising/Promotion | $500 | $500 | $500 | $1,000 | $1,000 | $1,000 | $1,000 | $1,000 | $1,000 | $1,000 | $1,000 | $1,000 | |
| Commissions | $11,350 | $11,350 | $11,475 | $12,623 | $12,623 | $12,623 | $13,885 | $13,885 | $13,885 | $15,273 | $15,273 | $15,273 | |
| Travel – Sales | $1,500 | $1,500 | $1,500 | $2,000 | $2,000 | $2,000 | $2,000 | $2,000 | $2,000 | $2,000 | $2,000 | $2,000 | |
| Learning & Growth – Sales | $0 | $0 | $0 | $400 | $400 | $400 | $400 | $400 | $400 | $1,250 | $1,250 | $1,250 | |
| Entertainment | $450 | $450 | $450 | $450 | $450 | $450 | $450 | $450 | $450 | $450 | $450 | $450 | |
| Total Sales and Marketing Expenses | $25,800 | $25,800 | $25,925 | $29,473 | $29,473 | $29,473 | $30,735 | $30,735 | $30,735 | $32,973 | $32,973 | $32,973 | |
| Sales and Marketing % | 11.37% | 11.37% | 11.30% | 11.67% | 11.67% | 11.67% | 11.07% | 11.07% | 11.07% | 10.79% | 10.79% | 10.79% | |
| General and Administrative Expenses | |||||||||||||
| General and Administrative Payroll | $10,600 | $10,600 | $10,600 | $11,400 | $11,400 | $11,400 | $11,400 | $11,400 | $11,400 | $11,400 | $11,400 | $11,400 | |
| Sales and Marketing and Other Expenses | $0 | $0 | $0 | $0 | $0 | $0 | $0 | $0 | $0 | $0 | $0 | $0 | |
| Depreciation | $0 | $0 | $0 | $0 | $0 | $0 | $0 | $0 | $0 | $0 | $0 | $0 | |
| Depreciation | $0 | $0 | $0 | $0 | $0 | $0 | $0 | $0 | $0 | $0 | $0 | $0 | |
| Utilities | $750 | $750 | $750 | $750 | $750 | $750 | $750 | $750 | $750 | $750 | $750 | $750 | |
| Telephone & ISP | $2,850 | $2,850 | $2,850 | $2,850 | $2,850 | $2,850 | $2,850 | $2,850 | $2,850 | $2,850 | $2,850 | $2,850 | |
| Office Supplies | $350 | $350 | $350 | $350 | $350 | $350 | $350 | $350 | $350 | $350 | $350 | $350 | |
| Insurance | $1,400 | $1,400 | $1,400 | $1,400 | $1,400 | $1,400 | $1,400 | $1,400 | $1,400 | $1,400 | $1,400 | $1,400 | |
| Bank Charges | $500 | $500 | $500 | $500 | $500 | $500 | $500 | $500 | $500 | $500 | $500 | $500 | |
| Postage | $835 | $835 | $835 | $835 | $835 | $835 | $835 | $835 | $835 | $835 | $835 | $835 | |
| Taxes & Licenses | $850 | $850 | $850 | $850 | $850 | $850 | $850 | $850 | $850 | $850 | $850 | $850 | |
| Bonuses | $0 | $0 | $0 | $0 | $0 | $0 | $0 | $0 | $0 | $0 | $0 | $0 | |
| Learning & Growth – Admin | $0 | $0 | $0 | $150 | $150 | $150 | $150 | $150 | $150 | $750 | $750 | $750 | |
| Accounting | $500 | $500 | $500 | $500 | $500 | $500 | $500 | $500 | $500 | $500 | $500 | $500 | |
| Rent | $6,000 | $6,000 | $6,000 | $6,000 | $6,000 | $6,000 | $6,000 | $6,000 | $6,000 | $6,000 | $6,000 | $6,000 | |
| Payroll Taxes | 30% | $14,325 | $14,325 | $14,325 | $15,375 | $15,375 | $15,375 | $15,375 | $15,375 | $15,375 | $15,375 | $15,375 | $15,375 |
| Other General and Administrative Expenses | $0 | $0 | $0 | $0 | $0 | $0 | $0 | $0 | $0 | $0 | $0 | $0 | |
| Total General and Administrative Expenses | $38,960 | $38,960 | $38,960 | $40,960 | $40,960 | $40,960 | $40,960 | $40,960 | $40,960 | $41,560 | $41,560 | $41,560 | |
| General and Administrative % | 17.16% | 17.16% | 16.98% | 16.22% | 16.22% | 16.22% | 14.75% | 14.75% | 14.75% | 13.61% | 13.61% | 13.61% | |
| Other Expenses: | |||||||||||||
| Other Payroll | $25,150 | $25,150 | $25,150 | $26,850 | $26,850 | $26,850 | $26,850 | $26,850 | $26,850 | $26,850 | $26,850 | $26,850 | |
| Consultants | $0 | $0 | $0 | $0 | $0 | $0 | $0 | $0 | $0 | $0 | $0 | $0 | |
| Learning & Growth – Service | $0 | $0 | $0 | $850 | $850 | $850 | $650 | $650 | $850 | $1,500 | $1,500 | $1,500 | |
| Travel – Service | $1,500 | $1,500 | $1,500 | $2,000 | $2,000 | $2,000 | $2,000 | $2,000 | $2,000 | $2,000 | $2,000 | $2,000 | |
| Freight & Cartage | $2,500 | $2,500 | $2,500 | $2,500 | $2,500 | $2,500 | $2,500 | $2,500 | $2,500 | $2,500 | $2,500 | $2,500 | |
| Total Other Expenses | $29,150 | $29,150 | $29,150 | $32,200 | $32,200 | $32,200 | $32,000 | $32,000 | $32,200 | $32,850 | $32,850 | $32,850 | |
| Other % | 12.84% | 12.84% | 12.70% | 12.76% | 12.76% | 12.76% | 11.52% | 11.52% | 11.60% | 10.75% | 10.75% | 10.75% | |
| Total Operating Expenses | $93,910 | $93,910 | $94,035 | $102,633 | $102,633 | $102,633 | $103,695 | $103,695 | $103,895 | $107,383 | $107,383 | $107,383 | |
| Profit Before Interest and Taxes | $16,765 | $16,765 | $17,890 | $20,485 | $20,485 | $20,485 | $31,735 | $31,735 | $31,535 | $41,589 | $41,589 | $41,589 | |
| EBITDA | $16,765 | $16,765 | $17,890 | $20,485 | $20,485 | $20,485 | $31,735 | $31,735 | $31,535 | $41,589 | $41,589 | $41,589 | |
| Interest Expense | $11,667 | $11,667 | $11,667 | $11,667 | $11,667 | $11,667 | $11,667 | $11,667 | $11,667 | $11,667 | $11,667 | $11,667 | |
| Taxes Incurred | $1,530 | $1,937 | $2,365 | $3,351 | $3,351 | $3,351 | $7,626 | $7,626 | $7,550 | $11,370 | $11,370 | $11,370 | |
| Net Profit | $3,569 | $3,161 | $3,858 | $5,467 | $5,467 | $5,467 | $12,442 | $12,442 | $12,318 | $18,552 | $18,552 | $18,552 | |
| Net Profit/Sales | 1.57% | 1.39% | 1.68% | 2.17% | 2.17% | 2.17% | 4.48% | 4.48% | 4.44% | 6.07% | 6.07% | 6.07% | |
| Pro Forma Cash Flow | |||||||||||||
| Month 1 | Month 2 | Month 3 | Month 4 | Month 5 | Month 6 | Month 7 | Month 8 | Month 9 | Month 10 | Month 11 | Month 12 | ||
| Cash Received | |||||||||||||
| Cash from Operations | |||||||||||||
| Cash Sales | $147,550 | $147,550 | $149,175 | $164,093 | $164,093 | $164,093 | $180,502 | $180,502 | $180,502 | $198,552 | $198,552 | $198,552 | |
| Cash from Receivables | $0 | $2,648 | $79,450 | $79,479 | $80,593 | $88,358 | $88,358 | $88,652 | $97,193 | $97,193 | $97,517 | $106,913 | |
| Subtotal Cash from Operations | $147,550 | $150,198 | $228,625 | $243,572 | $244,685 | $252,450 | $268,859 | $269,154 | $277,695 | $295,745 | $296,069 | $305,465 | |
| Additional Cash Received | |||||||||||||
| Sales Tax, VAT, HST/GST Received | 0.00% | $0 | $0 | $0 | $0 | $0 | $0 | $0 | $0 | $0 | $0 | $0 | $0 |
| New Current Borrowing | $0 | $0 | $0 | $0 | $0 | $0 | $0 | $0 | $0 | $0 | $0 | $0 | |
| New Other Liabilities (interest-free) | $0 | $0 | $0 | $0 | $0 | $0 | $0 | $0 | $0 | $0 | $0 | $0 | |
| New Long-term Liabilities | $0 | $0 | $0 | $0 | $0 | $0 | $0 | $0 | $0 | $0 | $0 | $0 | |
| Sales of Other Current Assets | $0 | $0 | $0 | $0 | $0 | $0 | $0 | $0 | $0 | $0 | $0 | $0 | |
| Sales of Long-term Assets | $0 | $0 | $0 | $0 | $0 | $0 | $0 | $0 | $0 | $0 | $0 | $0 | |
| New Investment Received | $30,000 | $0 | $0 | $0 | $0 | $0 | $0 | $0 | $0 | $0 | $0 | $0 | |
| Subtotal Cash Received | $177,550 | $150,198 | $228,625 | $243,572 | $244,685 | $252,450 | $268,859 | $269,154 | $277,695 | $295,745 | $296,069 | $305,465 | |
| Expenditures | Month 1 | Month 2 | Month 3 | Month 4 | Month 5 | Month 6 | Month 7 | Month 8 | Month 9 | Month 10 | Month 11 | Month 12 | |
| Expenditures from Operations | |||||||||||||
| Cash Spending | $47,750 | $47,750 | $47,750 | $51,250 | $51,250 | $51,250 | $51,250 | $51,250 | $51,250 | $51,250 | $51,250 | $51,250 | |
| Bill Payments | $3,455 | $106,054 | $176,195 | $180,247 | $208,235 | $195,733 | $196,816 | $227,755 | $214,007 | $215,366 | $250,790 | $235,663 | |
| Subtotal Spent on Operations | $51,205 | $153,804 | $223,945 | $231,497 | $259,485 | $246,983 | $248,066 | $279,005 | $265,257 | $266,616 | $302,040 | $286,913 | |
| Additional Cash Spent | |||||||||||||
| Sales Tax, VAT, HST/GST Paid Out | $0 | $0 | $0 | $0 | $0 | $0 | $0 | $0 | $0 | $0 | $0 | $0 | |
| Principal Repayment of Current Borrowing | $0 | $0 | $0 | $0 | $0 | $0 | $0 | $0 | $0 | $0 | $0 | $0 | |
| Other Liabilities Principal Repayment | $0 | $0 | $0 | $0 | $0 | $0 | $0 | $0 | $0 | $0 | $0 | $0 | |
| Long-term Liabilities Principal Repayment | $0 | $0 | $0 | $0 | $0 | $0 | $0 | $0 | $0 | $0 | $0 | $0 | |
| Purchase Other Current Assets | $0 | $0 | $0 | $0 | $0 | $0 | $0 | $0 | $0 | $0 | $0 | $0 | |
| Purchase Long-term Assets | $0 | $0 | $0 | $0 | $0 | $0 | $0 | $0 | $0 | $0 | $0 | $0 | |
| Dividends | $0 | $0 | $0 | $0 | $0 | $0 | $0 | $0 | $0 | $0 | $0 | $0 | |
| Subtotal Cash Spent | $51,205 | $153,804 | $223,945 | $231,497 | $259,485 | $246,983 | $248,066 | $279,005 | $265,257 | $266,616 | $302,040 | $286,913 | |
| Net Cash Flow | $126,345 | ($3,605) | $4,680 | $12,075 | ($14,800) | $5,467 | $20,793 | ($9,852) | $12,438 | $29,129 | ($5,971) | $18,552 | |
| Cash Balance | $351,345 | $347,740 | $352,420 | $364,495 | $349,696 | $355,163 | $375,956 | $366,105 | $378,543 | $407,672 | $401,700 | $420,252 | |
| Pro Forma Balance Sheet | |||||||||||||
| Month 1 | Month 2 | Month 3 | Month 4 | Month 5 | Month 6 | Month 7 | Month 8 | Month 9 | Month 10 | Month 11 | Month 12 | ||
| Assets | Starting Balances | ||||||||||||
| Current Assets | |||||||||||||
| Cash | $225,000 | $351,345 | $347,740 | $352,420 | $364,495 | $349,696 | $355,163 | $375,956 | $366,105 | $378,543 | $407,672 | $401,700 | $420,252 |
| Accounts Receivable | $0 | $79,450 | $156,252 | $157,127 | $166,005 | $173,770 | $173,770 | $182,606 | $191,147 | $191,147 | $200,866 | $210,261 | $210,261 |
| Inventory | $200,000 | $127,958 | $127,958 | $129,333 | $142,266 | $142,266 | $142,266 | $156,492 | $156,492 | $156,492 | $172,142 | $172,142 | $172,142 |
| Other Current Assets | $0 | $0 | $0 | $0 | $0 | $0 | $0 | $0 | $0 | $0 | $0 | $0 | $0 |
| Total Current Assets | $425,000 | $558,753 | $631,949 | $638,879 | $672,766 | $665,731 | $671,199 | $715,054 | $713,744 | $726,182 | $780,679 | $784,103 | $802,655 |
| Long-term Assets | |||||||||||||
| Long-term Assets | $0 | $0 | $0 | $0 | $0 | $0 | $0 | $0 | $0 | $0 | $0 | $0 | $0 |
| Accumulated Depreciation | $0 | $0 | $0 | $0 | $0 | $0 | $0 | $0 | $0 | $0 | $0 | $0 | $0 |
| Total Long-term Assets | $0 | $0 | $0 | $0 | $0 | $0 | $0 | $0 | $0 | $0 | $0 | $0 | $0 |
| Total Assets | $425,000 | $558,753 | $631,949 | $638,879 | $672,766 | $665,731 | $671,199 | $715,054 | $713,744 | $726,182 | $780,679 | $784,103 | $802,655 |
| Liabilities and Capital | Month 1 | Month 2 | Month 3 | Month 4 | Month 5 | Month 6 | Month 7 | Month 8 | Month 9 | Month 10 | Month 11 | Month 12 | |
| Current Liabilities | |||||||||||||
| Accounts Payable | $0 | $100,184 | $170,219 | $173,291 | $201,710 | $189,208 | $189,208 | $220,622 | $206,870 | $206,989 | $242,935 | $227,807 | $227,807 |
| Current Borrowing | $1,000,000 | $1,000,000 | $1,000,000 | $1,000,000 | $1,000,000 | $1,000,000 | $1,000,000 | $1,000,000 | $1,000,000 | $1,000,000 | $1,000,000 | $1,000,000 | $1,000,000 |
| Other Current Liabilities | $0 | $0 | $0 | $0 | $0 | $0 | $0 | $0 | $0 | $0 | $0 | $0 | $0 |
| Subtotal Current Liabilities | $1,000,000 | $1,100,184 | $1,170,219 | $1,173,291 | $1,201,710 | $1,189,208 | $1,189,208 | $1,220,622 | $1,206,870 | $1,206,989 | $1,242,935 | $1,227,807 | $1,227,807 |
| Long-term Liabilities | $0 | $0 | $0 | $0 | $0 | $0 | $0 | $0 | $0 | $0 | $0 | $0 | $0 |
| Total Liabilities | $1,000,000 | $1,100,184 | $1,170,219 | $1,173,291 | $1,201,710 | $1,189,208 | $1,189,208 | $1,220,622 | $1,206,870 | $1,206,989 | $1,242,935 | $1,227,807 | $1,227,807 |
| Paid-in Capital | $0 | $30,000 | $30,000 | $30,000 | $30,000 | $30,000 | $30,000 | $30,000 | $30,000 | $30,000 | $30,000 | $30,000 | $30,000 |
| Retained Earnings | ($575,000) | ($575,000) | ($575,000) | ($575,000) | ($575,000) | ($575,000) | ($575,000) | ($575,000) | ($575,000) | ($575,000) | ($575,000) | ($575,000) | ($575,000) |
| Earnings | $0 | $3,569 | $6,730 | $10,588 | $16,056 | $21,523 | $26,990 | $39,432 | $51,874 | $64,193 | $82,744 | $101,296 | $119,848 |
| Total Capital | ($575,000) | ($541,431) | ($538,270) | ($534,412) | ($528,944) | ($523,477) | ($518,010) | ($505,568) | ($493,126) | ($480,807) | ($462,256) | ($443,704) | ($425,152) |
| Total Liabilities and Capital | $425,000 | $558,753 | $631,949 | $638,879 | $672,766 | $665,731 | $671,199 | $715,054 | $713,744 | $726,182 | $780,679 | $784,103 | $802,655 |
| Net Worth | ($575,000) | ($541,431) | ($538,270) | ($534,412) | ($528,944) | ($523,477) | ($518,010) | ($505,568) | ($493,126) | ($480,807) | ($462,256) | ($443,704) | ($425,152) |


