
Independent Choice Flicks
Executive Summary
Independent Choice Flicks (ICF) is an alternative video rental store located in Eugene, Ore. ICF will rent movies not often available from the larger chains: film festival movies, independent releases, foreign films and other “arts” films. Eugene clearly has the market for these types of films, as evidenced by the general demographics (liberal, educated, college town) and the popularity of the Bijou Arts Cinema, a first run movie theatre concentrating on this same genre of movies.
This market has been ignored by the dominant stores in Eugene. They may have a few films that fit these descriptions, but in general they are far and few between. It is too difficult for the large corporations to market to this specific segment, particularly with their current business model which is putting a stores in all cities that are very similar in feel and library with a concentration on large scale commercial releases.
Through the use of ICF’s competitive advantage attention to customers, ICF will grow steadily to profitability. This is manifested in two ways, 1) providing outstanding customer service and knowledgeable help, and 2) supplying movies that have a demand in Eugene but the demand has yet to be addressed by the other players who leave it off their radar, assuming it is only for the fringe of the general population. Fortunately, the fringe in Eugene make up a large part of the general population here. ICF will begin profitability in the first year and will have projected revenues of over $230,000 by year three.

1.1 Objectives
The objectives for the first three years of operation include:
- To create a movie rental store whose goal it is to exceed customers’ expectations.
- To develop an alternative to the traditional franchise movie rental store.
- To increase the number of clients by 20% per year through superior selection and customer service.
1.2 Mission
The Independent Choice Flick’s mission is to provide the customer with independent, non commercial movies. We exist to attract and maintain customers. When we adhere to this maxim, everything else will fall into place. Our services will exceed the expectations of our customers.
Company Summary
ICF will be based in Eugene Ore. It will offer Eugene an alternative to the traditional large franchise, commercial movie rental stores. ICF’s selections will be made up of non-commercial releases, independent films, foreign films, and films that are present at the international film festivals, including the Sundance Film Festival.
ICF will offer a wide range of business hours and exceptional customer service. ICF will generally be willing to special order a movie for a customer if the movie falls within a genre of films that ICF currently stocks. The business will be located in a high traffic area in Eugene and will have a total of five employees by the end of year one. ICF is forecasted to reach profitability by month nine and will have $32,000 in profit by year three.
2.1 Company Ownership
ICF will be a sole proprietorship owned by Janet Sinemma.
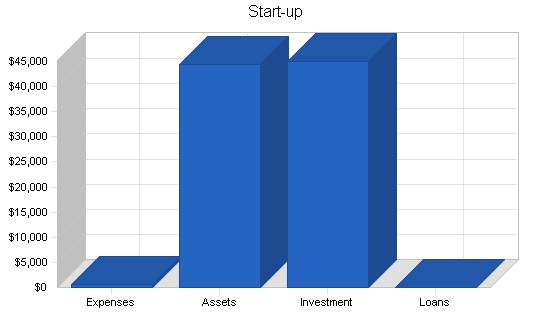
2.2 Start-up Summary
ICF will have the following start-up costs, of which everything that is a long-term asset (any asset that will be used for more than one year) will be depreciated using the straight-line method.
- Legal fees: used for business formation and generation and review of contracts.
- Advertising costs: costs attributed to advertisements placed in the Register Guard, Eugene Weekly, and Bijou Arts Cinema.
- Display shelves (purchased used).
- Cash register, with bar code printer, scanner, and software for tracking inventory.
- Cases for the video cassettes.
- Computer for the back office including a printer, CD-RW, and Internet connection.
- Furniture for the back office.
- Phone lines (2).
- Fax machine and copier.
- Movies (these are listed under long-term assets).
| Start-up | |
| Requirements | |
| Start-up Expenses | |
| Legal | $300 |
| Stationery etc. | $200 |
| Rent | $0 |
| Other | $0 |
| Total Start-up Expenses | $500 |
| Start-up Assets | |
| Cash Required | $28,800 |
| Start-up Inventory | $0 |
| Other Current Assets | $0 |
| Long-term Assets | $15,700 |
| Total Assets | $44,500 |
| Total Requirements | $45,000 |
| Start-up Funding | |
| Start-up Expenses to Fund | $500 |
| Start-up Assets to Fund | $44,500 |
| Total Funding Required | $45,000 |
| Assets | |
| Non-cash Assets from Start-up | $15,700 |
| Cash Requirements from Start-up | $28,800 |
| Additional Cash Raised | $0 |
| Cash Balance on Starting Date | $28,800 |
| Total Assets | $44,500 |
| Liabilities and Capital | |
| Liabilities | |
| Current Borrowing | $0 |
| Long-term Liabilities | $0 |
| Accounts Payable (Outstanding Bills) | $0 |
| Other Current Liabilities (interest-free) | $0 |
| Total Liabilities | $0 |
| Capital | |
| Planned Investment | |
| Janet | $45,000 |
| Other | $0 |
| Additional Investment Requirement | $0 |
| Total Planned Investment | $45,000 |
| Loss at Start-up (Start-up Expenses) | ($500) |
| Total Capital | $44,500 |
| Total Capital and Liabilities | $44,500 |
| Total Funding | $45,000 |
Services
ICF will provide Eugene will an alternative movie rental store, a service that is not yet offered in Eugene. The current offerings of typical rental stores are based on popular, commercial releases. There is a market for alternative releases, evidenced by the popularity of the Bijou Arts Cinema which shows this exact genre of movies in a first run movie theatre format. In essence, ICF will be the home extension of the Bijou.
Market Analysis Summary
ICF will be focusing on two distinct groups that utilize movie rental stores. These groups can be differentiated by age, a younger group and and older group. Although both of the groups enjoy non-commercial releases, they have different tastes in movies which are not being addressed by the current offerings of the “corporate” movie stores.
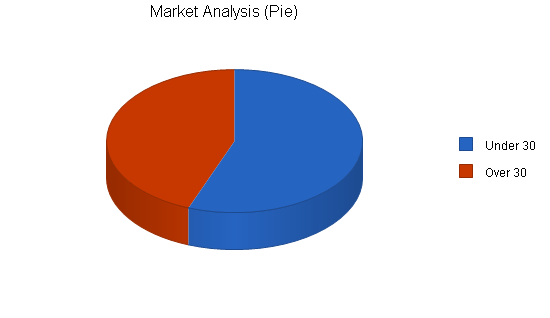
4.1 Market Segmentation
ICF’s customers can be divided into two general groups that are differentiated by age, over 30 and under 30.
- Under 30: this market segment has a diverse interest that certainly overlaps with the over 30 crowd. The under 30 movies might have more of a concentration on action, violence, drugs, sex, etc. This is not to say that the movies are about these subjects solely, it is just that these topics might relate better to someone under 30 than over 30.
- Over 30: this market segment has a bit more mature tastes, the humor may be more sophisticated, they are more likely to enjoy a foreign film relative to the under 30 group. Generally the topics of the movies will reflect issues that this group is most used to or closer to their experiences.
| Market Analysis | |||||||
| Year 1 | Year 2 | Year 3 | Year 4 | Year 5 | |||
| Potential Customers | Growth | CAGR | |||||
| Under 30 | 12% | 36,000 | 40,320 | 45,158 | 50,577 | 56,646 | 12.00% |
| Over 30 | 9% | 28,500 | 31,065 | 33,861 | 36,908 | 40,230 | 9.00% |
| Total | 10.70% | 64,500 | 71,385 | 79,019 | 87,485 | 96,876 | 10.70% |
4.2 Target Market Segment Strategy
ICF is focusing on these two groups because they are underserved in Eugene. Currently, there are two large corporate rental chains, Hollywood Video and Blockbuster that hold the majority of the market. In order for them to be successful, they must concentrate on the middle of the market, the mean. This allows them to use economies of scale to drive down the costs of operating a movie rental business. While this works for the general population, it does not address the fringes at all. ICF is addressing the fringe movie rental market.
Please note that while the term fringe market sounds almost derogatory or abnormal, in Eugene it really is not. The alternative market in Eugene is thriving, particularly relative to most other cities. Eugene, demographically, is also a much higher educated population than most cities. Alternative movies generally appeal to a more educated crowd. The masses can have their commercialized movies, they generally appreciate movies where they can watch without thinking. This is evidenced by the general popularity of television, mindless entertainment of no real thematic value and little cultural value.

Through targeted advertising, ICF will reach the crowd that appreciates these type of movies and turn then into long term customers. After the advertising brings in customers, new customers will be generated through word of mouth referrals. Our target markets are particularly vocal when it comes to referrals, because they like to spread good news/services around when it occurs because it does not occur that often in today’s mainstream society.
4.3 Service Business Analysis
ICF is a specialty movie rental store that competes in the broader movie rental business. The industry can be characterized as the “big two,” Hollywood Video and Blockbuster. To be sure, there are some independent video rental stores, generally in small neighborhoods and towns, but in general the big gorillas control everything and target the middle, the mainstream.
The movie rental business can be further characterized by selection and rental turnover. If a store offers a good selection and has a large number of rental turnovers, then it is likely going to be successful. This is the gorilla’s strategy. They support this strategy even more by selling of some of their rentals as they become less popular to be able to reinvest the money into the newest releases. This last strategy only works with the mainstream market and not ICF’s market because the mainstream market is attracted to what is new, the current releases. Once something has been out for a while, interest wanes. With ICF customers, the age of the video is irrelevant, it is the thematic quality, irrespective of popularity and newness that dictates acceptance.
4.3.1 Competition and Buying Patterns
Currently in Eugene there are two different types of competitors:
- The industry gorillas: This refers to Hollywood Video and Blockbuster. For all intents and purposes these two are indistinguishable. Both are large and very corporate in the sense that every store is the same, just like a McDonald’s. Both stores compete on location, there is little that differentiates them. One guarantees that new releases will always by in stock, but you only get them for a two day rental. The other does not guarantee them in stock, but you get them for five days. For the gorillas, they concentrate the most energy on the new releases, this is what their customers seem to want.
- Local video rentals: These stores are small, locally owner companies that typically cater to a neighborhood. Generally, they do not specialize in any one thing, they usually have a wide range of offerings and the bulk of their customers live within blocks of the store. Eugene has several of these.
People make video rental decisions based on a few factors, typically selection and convenience. If they want selection of the latest and most popular movies they go to the gorillas. If they do not rent movies that often and are more interested in convenience then they might visit the local video store.
Strategy and Implementation Summary
Currently, the alternative film rental market is not being addressed. This is shown through: 1) Eugene’s demographics that typically support these types of films and 2) the success of the same genre first run movie theatre in Eugene. Having recognized this open space, ICF will come into Eugene and capitalize on the demand.
ICF will be marketing the store with advertisements in several local publications whose reader base appreciates this style of movies. Additionally, ICF will be advertising with the Bijou Arts Cinema, a first run movie house of this movie genre.
ICF will be turning sales leads into long term customer relationships through the use of superior attention of the customer. This is a combination of customer service, knowledgeable staff, and company policy that dictates pleasing the customer as the most important goal. These strategies will lead ICF into the Eugene community and establish a steady growth pattern.
5.1 Competitive Edge
ICF’s competitive edge is their attention to the customers in Eugene. Their product offering is based on a need of Eugene’s that is currently unfulfilled. While this approach only works with small applications, meaning it is not the best for a country wide implementation, it is also costly. Time must be spent doing marketing research to determine where the unmet need is. This strategy in unrealistic for a large corporate chain.
It is ideal for ICF however. Eugene has a large “arts” population that is currently not being addressed in the video rental market. ICF’s competitive advantage is creating a store that fills a need specifically in Eugene, in contrast to opening a general store that will have broad, pedestrian appeal.
ICF will meet this need by basing their selection of videos that are in general hard to find in Eugene. ICF recognizes that by doing this they are decreasing the base of possible users. However, at the same time, they are developing loyalty among the smaller user base.
5.2 Sales Strategy
ICF’s sales strategy will be based on targeted selection and personalized service.
- Selection: ICF’s selection will be based on a few genres of films that are currently unavailable (for all intent and purposes) in Eugene. Having a selection of films that people want will be instrumental in turning leads into customers
- Personalized service: Typically at a video rental store you expect reasonably friendly service, although not necessarily informative service. At ICF, the employees are people that have an interest in these types of movies, that is why in part we have chosen them as employees. They also receive free rental privileges to encourage them to be more familiar with the rentals. In addition to having helpful and knowledgeable employees, ICF will have a very customer oriented service approach. If the customer is interested in a movie that falls within a certain genre of film that ICF carries, they will order the film for the customer. When was a normal video store willing to do this? It is the attention to details like this that will give the customer the impression that the store was opened for them personally, and this is what will turn a prospective lead into a long term customer who is vocal with his/ her friends about the services they like.
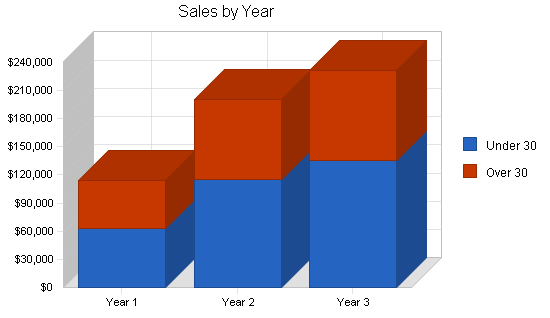
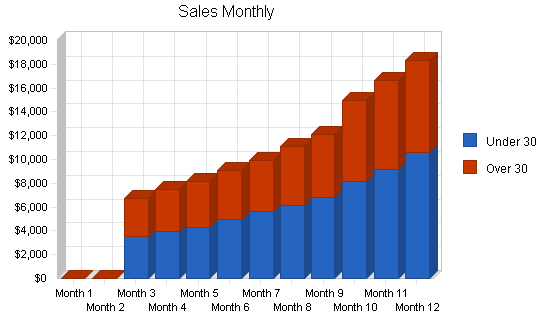
5.2.1 Sales Forecast
The first two months will be spent setting up the store and ordering inventory. There will not be any sales activity. During this time period ICF will be interviewing people with the expectation of bringing on board three part time employees for the third month. By the fifth month, sales will be steadily increasing and ICF will have the need for a full time employee. In addition to these employees, Janet will be working full time. ICF expects a fairly linear sales growth pattern month to month.
| Sales Forecast | |||
| Year 1 | Year 2 | Year 3 | |
| Sales | |||
| Under 30 | $63,293 | $115,476 | $135,214 |
| Over 30 | $51,190 | $85,475 | $95,878 |
| Total Sales | $114,483 | $200,951 | $231,092 |
| Direct Cost of Sales | Year 1 | Year 2 | Year 3 |
| Under 30 | $22,153 | $40,417 | $47,325 |
| Over 30 | $17,917 | $29,916 | $33,557 |
| Subtotal Direct Cost of Sales | $40,069 | $70,333 | $80,882 |
5.3 Milestones
ICF will have several milestones early on:
- Business plan completion. This will be done as a roadmap for the organization. While we do not need a business plan to raise capital, it will be an indispensable tool for the ongoing performance and improvement of the company.
- Set up the store.
- Revenues of $50,000.
- Achieve 55% rental usage per day.
| Milestones | |||||
| Milestone | Start Date | End Date | Budget | Manager | Department |
| Business plan completion | 1/1/2001 | 1/1/2001 | $0 | ABC | Janet |
| Set up the store | 1/1/2001 | 3/1/2001 | $0 | ABC | Janet |
| Revenues of $50,000 | 1/1/2001 | 11/30/2001 | $0 | ABC | everyone |
| Achieve 55% rental usage per day | 1/1/2001 | 12/31/2001 | $0 | ABC | everyone |
| Totals | $0 | ||||
Management Summary
Independent Choice Flicks is owned and operated by Janet Sinemma. It will be formed as a sole proprietorship as there is no compelling reason to incorporate. Janet will have ample insurance to help ward against personal liability issues.
Janet has a degree in marketing from University of Michigan. While at Michigan she worked at a local video rental store. Though she worked out of a need for money, she choose a video rental store out of her love for the cinema. Upon graduation, Janet worked for Hollywood Video’s corporate headquarters in Portland, Ore. She found this to be a very valuable experience. Not only did it help strengthen her marketing skills by learning from a industry leading company, but it also gave her tremendous insight into the video rental industry. After four years at Hollywood Video, Janet finally got the gumption to leave Hollywood Video, move to Eugene and open her own store.
Janet believed that in order for her to be truly happy that she needed to be running her own store and that she wanted to concentrate on quality movies instead of mainstream commercial society releases. She thought she would be able to apply her in depth industry knowledge and create a store that addresses an unmet demand. Having done a lot of research, she concluded Eugene was a very good place for an alternative video rental store.
6.1 Personnel Plan
The staff will consist of Janet working full time. By month three there will be three part-time employees. This will suffice until month five when a full-time employee will be brought on board. The employees will be chosen based on their people skills and on their love and knowledge of the genre of movies that ICF rents.
| Personnel Plan | |||
| Year 1 | Year 2 | Year 3 | |
| Janet | $24,000 | $24,000 | $24,000 |
| Part-time employee | $9,000 | $11,000 | $11,000 |
| Part-time employee | $9,000 | $11,000 | $11,000 |
| Part-time employee | $9,000 | $11,000 | $11,000 |
| Full-time employee | $14,400 | $21,600 | $21,600 |
| Total People | 5 | 5 | 5 |
| Total Payroll | $65,400 | $78,600 | $78,600 |
Financial Plan
The following section will outline important financial information.
7.1 Important Assumptions
The following table indicates the important financial assumptions.
| General Assumptions | |||
| Year 1 | Year 2 | Year 3 | |
| Plan Month | 1 | 2 | 3 |
| Current Interest Rate | 10.00% | 10.00% | 10.00% |
| Long-term Interest Rate | 10.00% | 10.00% | 10.00% |
| Tax Rate | 25.42% | 25.00% | 25.42% |
| Other | 0 | 0 | 0 |
7.2 Break-even Analysis
The Break-even Analysis is shown below.

| Break-even Analysis | |
| Monthly Revenue Break-even | $12,113 |
| Assumptions: | |
| Average Percent Variable Cost | 35% |
| Estimated Monthly Fixed Cost | $7,874 |
7.3 Projected Profit and Loss
The following table shows projected profit and loss.


| Pro Forma Profit and Loss | |||
| Year 1 | Year 2 | Year 3 | |
| Sales | $114,483 | $200,951 | $231,092 |
| Direct Cost of Sales | $40,069 | $70,333 | $80,882 |
| Other | $0 | $0 | $0 |
| Total Cost of Sales | $40,069 | $70,333 | $80,882 |
| Gross Margin | $74,414 | $130,618 | $150,210 |
| Gross Margin % | 65.00% | 65.00% | 65.00% |
| Expenses | |||
| Payroll | $65,400 | $78,600 | $78,600 |
| Sales and Marketing and Other Expenses | $2,400 | $2,400 | $2,400 |
| Depreciation | $3,072 | $3,072 | $3,072 |
| Leased Equipment | $0 | $0 | $0 |
| Utilities | $1,800 | $1,800 | $1,800 |
| Insurance | $1,800 | $1,800 | $1,800 |
| Rent | $10,200 | $10,200 | $10,200 |
| Payroll Taxes | $9,810 | $11,790 | $11,790 |
| Other | $0 | $0 | $0 |
| Total Operating Expenses | $94,482 | $109,662 | $109,662 |
| Profit Before Interest and Taxes | ($20,068) | $20,956 | $40,548 |
| EBITDA | ($16,996) | $24,028 | $43,620 |
| Interest Expense | $0 | $0 | $0 |
| Taxes Incurred | $0 | $5,239 | $10,306 |
| Net Profit | ($20,068) | $15,717 | $30,242 |
| Net Profit/Sales | -17.53% | 7.82% | 13.09% |
7.4 Projected Cash Flow
The following chart and table will display projected cash flow.

| Pro Forma Cash Flow | |||
| Year 1 | Year 2 | Year 3 | |
| Cash Received | |||
| Cash from Operations | |||
| Cash Sales | $114,483 | $200,951 | $231,092 |
| Subtotal Cash from Operations | $114,483 | $200,951 | $231,092 |
| Additional Cash Received | |||
| Sales Tax, VAT, HST/GST Received | $0 | $0 | $0 |
| New Current Borrowing | $0 | $0 | $0 |
| New Other Liabilities (interest-free) | $0 | $0 | $0 |
| New Long-term Liabilities | $0 | $0 | $0 |
| Sales of Other Current Assets | $0 | $0 | $0 |
| Sales of Long-term Assets | $0 | $0 | $0 |
| New Investment Received | $0 | $0 | $0 |
| Subtotal Cash Received | $114,483 | $200,951 | $231,092 |
| Expenditures | Year 1 | Year 2 | Year 3 |
| Expenditures from Operations | |||
| Cash Spending | $65,400 | $78,600 | $78,600 |
| Bill Payments | $64,059 | $109,005 | $120,035 |
| Subtotal Spent on Operations | $129,459 | $187,605 | $198,635 |
| Additional Cash Spent | |||
| Sales Tax, VAT, HST/GST Paid Out | $0 | $0 | $0 |
| Principal Repayment of Current Borrowing | $0 | $0 | $0 |
| Other Liabilities Principal Repayment | $0 | $0 | $0 |
| Long-term Liabilities Principal Repayment | $0 | $0 | $0 |
| Purchase Other Current Assets | $0 | $0 | $0 |
| Purchase Long-term Assets | $0 | $0 | $0 |
| Dividends | $0 | $0 | $0 |
| Subtotal Cash Spent | $129,459 | $187,605 | $198,635 |
| Net Cash Flow | ($14,976) | $13,346 | $32,457 |
| Cash Balance | $13,824 | $27,170 | $59,627 |
7.5 Projected Balance Sheet
The following table indicates the projected balance sheet.
| Pro Forma Balance Sheet | |||
| Year 1 | Year 2 | Year 3 | |
| Assets | |||
| Current Assets | |||
| Cash | $13,824 | $27,170 | $59,627 |
| Inventory | $7,049 | $12,372 | $14,228 |
| Other Current Assets | $0 | $0 | $0 |
| Total Current Assets | $20,873 | $39,543 | $73,855 |
| Long-term Assets | |||
| Long-term Assets | $15,700 | $15,700 | $15,700 |
| Accumulated Depreciation | $3,072 | $6,144 | $9,216 |
| Total Long-term Assets | $12,628 | $9,556 | $6,484 |
| Total Assets | $33,501 | $49,099 | $80,339 |
| Liabilities and Capital | Year 1 | Year 2 | Year 3 |
| Current Liabilities | |||
| Accounts Payable | $9,069 | $8,950 | $9,948 |
| Current Borrowing | $0 | $0 | $0 |
| Other Current Liabilities | $0 | $0 | $0 |
| Subtotal Current Liabilities | $9,069 | $8,950 | $9,948 |
| Long-term Liabilities | $0 | $0 | $0 |
| Total Liabilities | $9,069 | $8,950 | $9,948 |
| Paid-in Capital | $45,000 | $45,000 | $45,000 |
| Retained Earnings | ($500) | ($20,568) | ($4,851) |
| Earnings | ($20,068) | $15,717 | $30,242 |
| Total Capital | $24,432 | $40,149 | $70,391 |
| Total Liabilities and Capital | $33,501 | $49,099 | $80,339 |
| Net Worth | $24,432 | $40,149 | $70,391 |
7.6 Business Ratios
Business ratios for the years of this plan are shown below. Industry profile ratios based on the Standard Industrial Classification (SIC) code 7841, Video Tape Rental, are shown for comparison.
| Ratio Analysis | ||||
| Year 1 | Year 2 | Year 3 | Industry Profile | |
| Sales Growth | 0.00% | 75.53% | 15.00% | 11.90% |
| Percent of Total Assets | ||||
| Inventory | 21.04% | 25.20% | 17.71% | 4.10% |
| Other Current Assets | 0.00% | 0.00% | 0.00% | 42.90% |
| Total Current Assets | 62.31% | 80.54% | 91.93% | 54.80% |
| Long-term Assets | 37.69% | 19.46% | 8.07% | 45.20% |
| Total Assets | 100.00% | 100.00% | 100.00% | 100.00% |
| Current Liabilities | 27.07% | 18.23% | 12.38% | 37.70% |
| Long-term Liabilities | 0.00% | 0.00% | 0.00% | 23.20% |
| Total Liabilities | 27.07% | 18.23% | 12.38% | 60.90% |
| Net Worth | 72.93% | 81.77% | 87.62% | 39.10% |
| Percent of Sales | ||||
| Sales | 100.00% | 100.00% | 100.00% | 100.00% |
| Gross Margin | 65.00% | 65.00% | 65.00% | 0.00% |
| Selling, General & Administrative Expenses | 82.53% | 57.18% | 51.84% | 75.80% |
| Advertising Expenses | 2.10% | 1.19% | 1.04% | 1.50% |
| Profit Before Interest and Taxes | -17.53% | 10.43% | 17.55% | 1.90% |
| Main Ratios | ||||
| Current | 2.30 | 4.42 | 7.42 | 0.68 |
| Quick | 1.52 | 3.04 | 5.99 | 0.35 |
| Total Debt to Total Assets | 27.07% | 18.23% | 12.38% | 60.90% |
| Pre-tax Return on Net Worth | -82.14% | 52.20% | 57.60% | 2.70% |
| Pre-tax Return on Assets | -59.90% | 42.68% | 50.47% | 6.80% |
| Additional Ratios | Year 1 | Year 2 | Year 3 | |
| Net Profit Margin | -17.53% | 7.82% | 13.09% | n.a |
| Return on Equity | -82.14% | 39.15% | 42.96% | n.a |
| Activity Ratios | ||||
| Inventory Turnover | 10.91 | 7.24 | 6.08 | n.a |
| Accounts Payable Turnover | 8.06 | 12.17 | 12.17 | n.a |
| Payment Days | 27 | 30 | 28 | n.a |
| Total Asset Turnover | 3.42 | 4.09 | 2.88 | n.a |
| Debt Ratios | ||||
| Debt to Net Worth | 0.37 | 0.22 | 0.14 | n.a |
| Current Liab. to Liab. | 1.00 | 1.00 | 1.00 | n.a |
| Liquidity Ratios | ||||
| Net Working Capital | $11,804 | $30,593 | $63,907 | n.a |
| Interest Coverage | 0.00 | 0.00 | 0.00 | n.a |
| Additional Ratios | ||||
| Assets to Sales | 0.29 | 0.24 | 0.35 | n.a |
| Current Debt/Total Assets | 27% | 18% | 12% | n.a |
| Acid Test | 1.52 | 3.04 | 5.99 | n.a |
| Sales/Net Worth | 4.69 | 5.01 | 3.28 | n.a |
| Dividend Payout | 0.00 | 0.00 | 0.00 | n.a |
Appendix
| Sales Forecast | |||||||||||||
| Month 1 | Month 2 | Month 3 | Month 4 | Month 5 | Month 6 | Month 7 | Month 8 | Month 9 | Month 10 | Month 11 | Month 12 | ||
| Sales | |||||||||||||
| Under 30 | 0% | $0 | $0 | $3,500 | $3,954 | $4,315 | $4,998 | $5,621 | $6,174 | $6,825 | $8,154 | $9,198 | $10,554 |
| Over 30 | 0% | $0 | $0 | $3,200 | $3,552 | $3,845 | $4,085 | $4,310 | $4,887 | $5,287 | $6,845 | $7,425 | $7,754 |
| Total Sales | $0 | $0 | $6,700 | $7,506 | $8,160 | $9,083 | $9,931 | $11,061 | $12,112 | $14,999 | $16,623 | $18,308 | |
| Direct Cost of Sales | Month 1 | Month 2 | Month 3 | Month 4 | Month 5 | Month 6 | Month 7 | Month 8 | Month 9 | Month 10 | Month 11 | Month 12 | |
| Under 30 | $0 | $0 | $1,225 | $1,384 | $1,510 | $1,749 | $1,967 | $2,161 | $2,389 | $2,854 | $3,219 | $3,694 | |
| Over 30 | $0 | $0 | $1,120 | $1,243 | $1,346 | $1,430 | $1,509 | $1,710 | $1,850 | $2,396 | $2,599 | $2,714 | |
| Subtotal Direct Cost of Sales | $0 | $0 | $2,345 | $2,627 | $2,856 | $3,179 | $3,476 | $3,871 | $4,239 | $5,250 | $5,818 | $6,408 | |
| Personnel Plan | |||||||||||||
| Month 1 | Month 2 | Month 3 | Month 4 | Month 5 | Month 6 | Month 7 | Month 8 | Month 9 | Month 10 | Month 11 | Month 12 | ||
| Janet | 0% | $2,000 | $2,000 | $2,000 | $2,000 | $2,000 | $2,000 | $2,000 | $2,000 | $2,000 | $2,000 | $2,000 | $2,000 |
| Part-time employee | 0% | $0 | $0 | $900 | $900 | $900 | $900 | $900 | $900 | $900 | $900 | $900 | $900 |
| Part-time employee | 0% | $0 | $0 | $900 | $900 | $900 | $900 | $900 | $900 | $900 | $900 | $900 | $900 |
| Part-time employee | 0% | $0 | $0 | $900 | $900 | $900 | $900 | $900 | $900 | $900 | $900 | $900 | $900 |
| Full-time employee | 0% | $0 | $0 | $0 | $0 | $1,800 | $1,800 | $1,800 | $1,800 | $1,800 | $1,800 | $1,800 | $1,800 |
| Total People | 1 | 1 | 4 | 4 | 5 | 5 | 5 | 5 | 5 | 5 | 5 | 5 | |
| Total Payroll | $2,000 | $2,000 | $4,700 | $4,700 | $6,500 | $6,500 | $6,500 | $6,500 | $6,500 | $6,500 | $6,500 | $6,500 | |
| General Assumptions | |||||||||||||
| Month 1 | Month 2 | Month 3 | Month 4 | Month 5 | Month 6 | Month 7 | Month 8 | Month 9 | Month 10 | Month 11 | Month 12 | ||
| Plan Month | 1 | 2 | 3 | 4 | 5 | 6 | 7 | 8 | 9 | 10 | 11 | 12 | |
| Current Interest Rate | 10.00% | 10.00% | 10.00% | 10.00% | 10.00% | 10.00% | 10.00% | 10.00% | 10.00% | 10.00% | 10.00% | 10.00% | |
| Long-term Interest Rate | 10.00% | 10.00% | 10.00% | 10.00% | 10.00% | 10.00% | 10.00% | 10.00% | 10.00% | 10.00% | 10.00% | 10.00% | |
| Tax Rate | 30.00% | 25.00% | 25.00% | 25.00% | 25.00% | 25.00% | 25.00% | 25.00% | 25.00% | 25.00% | 25.00% | 25.00% | |
| Other | 0 | 0 | 0 | 0 | 0 | 0 | 0 | 0 | 0 | 0 | 0 | 0 | |
| Pro Forma Profit and Loss | |||||||||||||
| Month 1 | Month 2 | Month 3 | Month 4 | Month 5 | Month 6 | Month 7 | Month 8 | Month 9 | Month 10 | Month 11 | Month 12 | ||
| Sales | $0 | $0 | $6,700 | $7,506 | $8,160 | $9,083 | $9,931 | $11,061 | $12,112 | $14,999 | $16,623 | $18,308 | |
| Direct Cost of Sales | $0 | $0 | $2,345 | $2,627 | $2,856 | $3,179 | $3,476 | $3,871 | $4,239 | $5,250 | $5,818 | $6,408 | |
| Other | $0 | $0 | $0 | $0 | $0 | $0 | $0 | $0 | $0 | $0 | $0 | $0 | |
| Total Cost of Sales | $0 | $0 | $2,345 | $2,627 | $2,856 | $3,179 | $3,476 | $3,871 | $4,239 | $5,250 | $5,818 | $6,408 | |
| Gross Margin | $0 | $0 | $4,355 | $4,879 | $5,304 | $5,904 | $6,455 | $7,190 | $7,873 | $9,749 | $10,805 | $11,900 | |
| Gross Margin % | 0.00% | 0.00% | 65.00% | 65.00% | 65.00% | 65.00% | 65.00% | 65.00% | 65.00% | 65.00% | 65.00% | 65.00% | |
| Expenses | |||||||||||||
| Payroll | $2,000 | $2,000 | $4,700 | $4,700 | $6,500 | $6,500 | $6,500 | $6,500 | $6,500 | $6,500 | $6,500 | $6,500 | |
| Sales and Marketing and Other Expenses | $200 | $200 | $200 | $200 | $200 | $200 | $200 | $200 | $200 | $200 | $200 | $200 | |
| Depreciation | $256 | $256 | $256 | $256 | $256 | $256 | $256 | $256 | $256 | $256 | $256 | $256 | |
| Leased Equipment | $0 | $0 | $0 | $0 | $0 | $0 | $0 | $0 | $0 | $0 | $0 | $0 | |
| Utilities | $150 | $150 | $150 | $150 | $150 | $150 | $150 | $150 | $150 | $150 | $150 | $150 | |
| Insurance | $150 | $150 | $150 | $150 | $150 | $150 | $150 | $150 | $150 | $150 | $150 | $150 | |
| Rent | $850 | $850 | $850 | $850 | $850 | $850 | $850 | $850 | $850 | $850 | $850 | $850 | |
| Payroll Taxes | 15% | $300 | $300 | $705 | $705 | $975 | $975 | $975 | $975 | $975 | $975 | $975 | $975 |
| Other | $0 | $0 | $0 | $0 | $0 | $0 | $0 | $0 | $0 | $0 | $0 | $0 | |
| Total Operating Expenses | $3,906 | $3,906 | $7,011 | $7,011 | $9,081 | $9,081 | $9,081 | $9,081 | $9,081 | $9,081 | $9,081 | $9,081 | |
| Profit Before Interest and Taxes | ($3,906) | ($3,906) | ($2,656) | ($2,132) | ($3,777) | ($3,177) | ($2,626) | ($1,891) | ($1,208) | $668 | $1,724 | $2,819 | |
| EBITDA | ($3,650) | ($3,650) | ($2,400) | ($1,876) | ($3,521) | ($2,921) | ($2,370) | ($1,635) | ($952) | $924 | $1,980 | $3,075 | |
| Interest Expense | $0 | $0 | $0 | $0 | $0 | $0 | $0 | $0 | $0 | $0 | $0 | $0 | |
| Taxes Incurred | $0 | $0 | $0 | $0 | $0 | $0 | $0 | $0 | $0 | $0 | $0 | $0 | |
| Net Profit | ($3,906) | ($3,906) | ($2,656) | ($2,132) | ($3,777) | ($3,177) | ($2,626) | ($1,891) | ($1,208) | $668 | $1,724 | $2,819 | |
| Net Profit/Sales | 0.00% | 0.00% | -39.64% | -28.41% | -46.29% | -34.98% | -26.44% | -17.10% | -9.98% | 4.46% | 10.37% | 15.40% | |
| Pro Forma Cash Flow | |||||||||||||
| Month 1 | Month 2 | Month 3 | Month 4 | Month 5 | Month 6 | Month 7 | Month 8 | Month 9 | Month 10 | Month 11 | Month 12 | ||
| Cash Received | |||||||||||||
| Cash from Operations | |||||||||||||
| Cash Sales | $0 | $0 | $6,700 | $7,506 | $8,160 | $9,083 | $9,931 | $11,061 | $12,112 | $14,999 | $16,623 | $18,308 | |
| Subtotal Cash from Operations | $0 | $0 | $6,700 | $7,506 | $8,160 | $9,083 | $9,931 | $11,061 | $12,112 | $14,999 | $16,623 | $18,308 | |
| Additional Cash Received | |||||||||||||
| Sales Tax, VAT, HST/GST Received | 0.00% | $0 | $0 | $0 | $0 | $0 | $0 | $0 | $0 | $0 | $0 | $0 | $0 |
| New Current Borrowing | $0 | $0 | $0 | $0 | $0 | $0 | $0 | $0 | $0 | $0 | $0 | $0 | |
| New Other Liabilities (interest-free) | $0 | $0 | $0 | $0 | $0 | $0 | $0 | $0 | $0 | $0 | $0 | $0 | |
| New Long-term Liabilities | $0 | $0 | $0 | $0 | $0 | $0 | $0 | $0 | $0 | $0 | $0 | $0 | |
| Sales of Other Current Assets | $0 | $0 | $0 | $0 | $0 | $0 | $0 | $0 | $0 | $0 | $0 | $0 | |
| Sales of Long-term Assets | $0 | $0 | $0 | $0 | $0 | $0 | $0 | $0 | $0 | $0 | $0 | $0 | |
| New Investment Received | $0 | $0 | $0 | $0 | $0 | $0 | $0 | $0 | $0 | $0 | $0 | $0 | |
| Subtotal Cash Received | $0 | $0 | $6,700 | $7,506 | $8,160 | $9,083 | $9,931 | $11,061 | $12,112 | $14,999 | $16,623 | $18,308 | |
| Expenditures | Month 1 | Month 2 | Month 3 | Month 4 | Month 5 | Month 6 | Month 7 | Month 8 | Month 9 | Month 10 | Month 11 | Month 12 | |
| Expenditures from Operations | |||||||||||||
| Cash Spending | $2,000 | $2,000 | $4,700 | $4,700 | $6,500 | $6,500 | $6,500 | $6,500 | $6,500 | $6,500 | $6,500 | $6,500 | |
| Bill Payments | $55 | $1,650 | $1,828 | $6,913 | $5,007 | $5,447 | $5,868 | $6,144 | $6,643 | $7,026 | $8,689 | $8,789 | |
| Subtotal Spent on Operations | $2,055 | $3,650 | $6,528 | $11,613 | $11,507 | $11,947 | $12,368 | $12,644 | $13,143 | $13,526 | $15,189 | $15,289 | |
| Additional Cash Spent | |||||||||||||
| Sales Tax, VAT, HST/GST Paid Out | $0 | $0 | $0 | $0 | $0 | $0 | $0 | $0 | $0 | $0 | $0 | $0 | |
| Principal Repayment of Current Borrowing | $0 | $0 | $0 | $0 | $0 | $0 | $0 | $0 | $0 | $0 | $0 | $0 | |
| Other Liabilities Principal Repayment | $0 | $0 | $0 | $0 | $0 | $0 | $0 | $0 | $0 | $0 | $0 | $0 | |
| Long-term Liabilities Principal Repayment | $0 | $0 | $0 | $0 | $0 | $0 | $0 | $0 | $0 | $0 | $0 | $0 | |
| Purchase Other Current Assets | $0 | $0 | $0 | $0 | $0 | $0 | $0 | $0 | $0 | $0 | $0 | $0 | |
| Purchase Long-term Assets | $0 | $0 | $0 | $0 | $0 | $0 | $0 | $0 | $0 | $0 | $0 | $0 | |
| Dividends | $0 | $0 | $0 | $0 | $0 | $0 | $0 | $0 | $0 | $0 | $0 | $0 | |
| Subtotal Cash Spent | $2,055 | $3,650 | $6,528 | $11,613 | $11,507 | $11,947 | $12,368 | $12,644 | $13,143 | $13,526 | $15,189 | $15,289 | |
| Net Cash Flow | ($2,055) | ($3,650) | $172 | ($4,107) | ($3,347) | ($2,864) | ($2,437) | ($1,583) | ($1,031) | $1,473 | $1,434 | $3,019 | |
| Cash Balance | $26,745 | $23,095 | $23,267 | $19,160 | $15,813 | $12,949 | $10,512 | $8,929 | $7,898 | $9,371 | $10,805 | $13,824 | |
| Pro Forma Balance Sheet | |||||||||||||
| Month 1 | Month 2 | Month 3 | Month 4 | Month 5 | Month 6 | Month 7 | Month 8 | Month 9 | Month 10 | Month 11 | Month 12 | ||
| Assets | Starting Balances | ||||||||||||
| Current Assets | |||||||||||||
| Cash | $28,800 | $26,745 | $23,095 | $23,267 | $19,160 | $15,813 | $12,949 | $10,512 | $8,929 | $7,898 | $9,371 | $10,805 | $13,824 |
| Inventory | $0 | $0 | $0 | $2,580 | $2,890 | $3,142 | $3,497 | $3,823 | $4,258 | $4,663 | $5,775 | $6,400 | $7,049 |
| Other Current Assets | $0 | $0 | $0 | $0 | $0 | $0 | $0 | $0 | $0 | $0 | $0 | $0 | $0 |
| Total Current Assets | $28,800 | $26,745 | $23,095 | $25,847 | $22,050 | $18,955 | $16,446 | $14,335 | $13,187 | $12,561 | $15,145 | $17,205 | $20,873 |
| Long-term Assets | |||||||||||||
| Long-term Assets | $15,700 | $15,700 | $15,700 | $15,700 | $15,700 | $15,700 | $15,700 | $15,700 | $15,700 | $15,700 | $15,700 | $15,700 | $15,700 |
| Accumulated Depreciation | $0 | $256 | $512 | $768 | $1,024 | $1,280 | $1,536 | $1,792 | $2,048 | $2,304 | $2,560 | $2,816 | $3,072 |
| Total Long-term Assets | $15,700 | $15,444 | $15,188 | $14,932 | $14,676 | $14,420 | $14,164 | $13,908 | $13,652 | $13,396 | $13,140 | $12,884 | $12,628 |
| Total Assets | $44,500 | $42,189 | $38,283 | $40,779 | $36,726 | $33,375 | $30,610 | $28,243 | $26,839 | $25,957 | $28,285 | $30,089 | $33,501 |
| Liabilities and Capital | Month 1 | Month 2 | Month 3 | Month 4 | Month 5 | Month 6 | Month 7 | Month 8 | Month 9 | Month 10 | Month 11 | Month 12 | |
| Current Liabilities | |||||||||||||
| Accounts Payable | $0 | $1,595 | $1,595 | $6,747 | $4,826 | $5,252 | $5,664 | $5,923 | $6,410 | $6,737 | $8,397 | $8,476 | $9,069 |
| Current Borrowing | $0 | $0 | $0 | $0 | $0 | $0 | $0 | $0 | $0 | $0 | $0 | $0 | $0 |
| Other Current Liabilities | $0 | $0 | $0 | $0 | $0 | $0 | $0 | $0 | $0 | $0 | $0 | $0 | $0 |
| Subtotal Current Liabilities | $0 | $1,595 | $1,595 | $6,747 | $4,826 | $5,252 | $5,664 | $5,923 | $6,410 | $6,737 | $8,397 | $8,476 | $9,069 |
| Long-term Liabilities | $0 | $0 | $0 | $0 | $0 | $0 | $0 | $0 | $0 | $0 | $0 | $0 | $0 |
| Total Liabilities | $0 | $1,595 | $1,595 | $6,747 | $4,826 | $5,252 | $5,664 | $5,923 | $6,410 | $6,737 | $8,397 | $8,476 | $9,069 |
| Paid-in Capital | $45,000 | $45,000 | $45,000 | $45,000 | $45,000 | $45,000 | $45,000 | $45,000 | $45,000 | $45,000 | $45,000 | $45,000 | $45,000 |
| Retained Earnings | ($500) | ($500) | ($500) | ($500) | ($500) | ($500) | ($500) | ($500) | ($500) | ($500) | ($500) | ($500) | ($500) |
| Earnings | $0 | ($3,906) | ($7,812) | ($10,468) | ($12,600) | ($16,377) | ($19,554) | ($22,180) | ($24,071) | ($25,280) | ($24,611) | ($22,887) | ($20,068) |
| Total Capital | $44,500 | $40,594 | $36,688 | $34,032 | $31,900 | $28,123 | $24,946 | $22,320 | $20,429 | $19,220 | $19,889 | $21,613 | $24,432 |
| Total Liabilities and Capital | $44,500 | $42,189 | $38,283 | $40,779 | $36,726 | $33,375 | $30,610 | $28,243 | $26,839 | $25,957 | $28,285 | $30,089 | $33,501 |
| Net Worth | $44,500 | $40,594 | $36,688 | $34,032 | $31,900 | $28,123 | $24,946 | $22,320 | $20,429 | $19,220 | $19,889 | $21,613 | $24,432 |


