
FynbosFarm
Executive Summary
Introduction
FynbosFarm will be a project built around a highly successful businessman and the development and training of skilled and semi-skilled staff in the hydroponics and instant turf market. The project aim is to carry out intensive and high turnover production, off a small area, while providing work and leadership experience for local women.
The company is a combination of cutting edge, high quality, efficient food technology and production. It is committed to the improvement of taste in vegetables and excellent quality and nutritional value. The company will provide education, experience and research in the hydroponic field. It has the experience and extensive knowledge of well-known grower Mike Shelly as a consultant. This project will be KZN-based, and will supply vegetables for the national and international markets, and instant turf for the local market.
Products
The 4 main crops to be grown will be instant turf, long life tomatoes, cucumbers, and coloured peppers.
- Tomatoes: 4ha under plastic which will produce 2100 000 kgs per year
- Cucumbers: 1ha under plastic which will produce 205 000 kgs per year
- Peppers: 1ha under plastic which will produce 250 000 kgs per year
- Turf: 30ha in the open.
Financial considerations
The company is seeking both short-term and long-term funding to finance the purchase of a new farm and development costs of the project. This will cover startup expenses and first year loses. It is estimated that the company will begin to make a profit in year 2 of operations. The project is expected to begin production within 8 months from start of the first tunnel being erected.

1.1 Objectives
The objective of this project is to establish an intensive farm, producing high-quality produce for both the national and international market year round.
1.2 Mission
FynbosFarm is a KZN-based company with a two-fold mission:
- to produce high quality, nutritional, and flavourful vegetables for consumption in both local and international markets.
- to create opportunities for leadership and highly productive teamwork for local women who work on the farm.
The women working on the farm will be organized into intensive work groups, and each group will be paid incentives on production and performances, in addition to the standard wages.
1.3 Keys to Success
- Efficient production utilizing greenhouses.
- No existing projects of this magnitude in the KZN region.
- Experience in the vegetable industry goes back to 1996.
Company Summary
FynbosFarm will be a partnership of successful businessmen developing a small farm into a highly productive hydroponics and instant turf project.
Hydroponics is the growing of high-quality vegetables in high-tech, multi-span greenhouses. The produce is grown in 15L bags with a medium used to support the root system. The plants are automatically fed nutrients through irrigation systems.The plants are grown in the best suitable growing conditions, which allows each plant to produce the maximum fruit possible.
Instant turf will be grown out in open field production. The turf will be irrigated via overhead spray units, using the run-off fertilizer from the multispan tunnels. This fertilizer is highly effective and will provide all the requirements the instant turf will require. The turf will be cut and sold by the square meter, and is harvested with a sod cutter.
The company will concentrate on the production of tomatoes, peppers and cucumbers in the tunnels, and in time will pursue more selective vegetables and the fresh cut flower market.
2.1 Company Ownership
FynbosFarm is owned jointly by its two founders, one of whom will serve as the project manager.
2.2 Start-up Summary
The company is seeking to raise investment for the purpose of financing the acquisition of the vegetable farm, facilities modifications, multi-spans and equipment, and funding operating expenses.
Facilities
The operation will utilise :
- Six large greenhouses enclosing the vegetable area
- irrigation, fertilization, temperature control and water treatment devices
- outdoor production of instant lawn
- pack houses and washbay facilities
- business office building
An additional portion of the operation will be the growing of instant lawn. Local landscape operations have trouble with meeting the demands of instant turf supply, and the company has recognised the need in the market. The company plans to supply the local nurseries and landscapers with top quality, premium garden lawn.
The largest portion of the start-up requirements is for purchase of the site and construction of the necessary buildings and infrastructure, including well-digging. These are listed below as long-term assets.
The start-up period is five months long, and includes construction and one and a half months for growing the first crops, to be sold beginning in July.
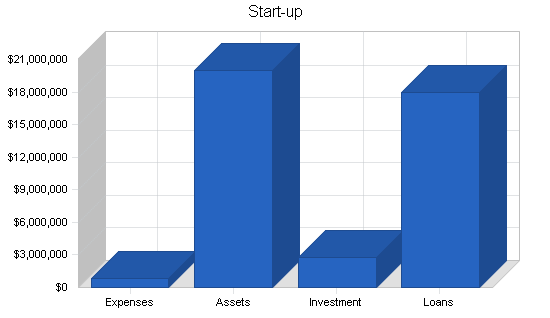
| Start-up | |
| Requirements | |
| Start-up Expenses | |
| Legal | R70,000 |
| Borehole testing | R10,000 |
| Seedlings | R128,000 |
| Sawdust | R155,000 |
| Plant bags | R57,753 |
| Twine and clips | R28,000 |
| Site leveling | R250,000 |
| Other | R95,000 |
| Total Start-up Expenses | R793,753 |
| Start-up Assets | |
| Cash Required | R5,000 |
| Other Current Assets | R0 |
| Long-term Assets | R20,000,000 |
| Total Assets | R20,005,000 |
| Total Requirements | R20,798,753 |
Products
Hydroponics is the production of vegetables in state-of-the-art, temperature-controlled, multi-span tunnels. The structures being used are richelle multi-spans, which come complete with computer temperature sensors, automatic opening and closing vents, automatic misting units and temperature controlled fans. The advantages of growing in high-tech tunnels are:
- faster, longer growth
- harvest labour reduced by 80%
- harvest time reduced, and by doing so:
- decrease loss in weight gain
- eliminate weight loss from shock
- allow greater yield per plant
- provide optimum temperature for plant growth
Vegetables
FynbosFarm’s first line of production will be tomatoes, peppers and cucumbers. The farm will have the capacity sufficient to produce in excess of 2 550 000 kg of vegetables per year.
Instant lawn
The company’s outdoor horticultural aspects include the production of 30ha of instant lawn. The company will sell between 20 – 25ha per annum.
Research and development
The company will seek contact with local and international companies in order to learn about and acquire new hybrids of vegetables that are hardier and grow faster in our local climate. These and other available species and systems will be constantly tracked. In addition to the above, the company will seek contacts at universities and researchers that are involved in greens, and will continue the quest for the best flavoured, large, and firm vegetable throughout the year.
Future product plans
In the future the company would like to explore the possibility of flower production. FynbosFarm believes this to be a high revenue venture, which, if successful, could become our number one endeavour.
We are also considering the production of bananas. Currently there is a huge shortage of bananas, and the selling price has been above average for the past 2 years.
Market Analysis Summary
In an era of big-box food stores, when 4 major grocery chains control the purchase of vegetables, the proliferation of open air markets has come out of nowhere, giving more consumers an option to purchase fresh vegetables. Such markets include retailers such as Fruit and Veg City and VegExpress. FynbosFarm will not only supply the major supermarkets, but also the markets mentioned above.
With these trends in mind, FynbosFarm will also concentrate on wholesale live vegetable markets that sell hydroponic produce, fresh farmers’ markets, and export to neighbouring states and international markets.
4.1 Market Segmentation
For the purposes of this plan, we are focusing on retail outlets and VegCity shops within 45 miles of our location.

| Market Analysis | |||||||
| Year 1 | Year 2 | Year 3 | Year 4 | Year 5 | |||
| Potential Customers | Growth | CAGR | |||||
| Retail outlets | 25% | 100 | 125 | 156 | 195 | 244 | 24.98% |
| vegcities | 10% | 20 | 22 | 24 | 26 | 29 | 9.73% |
| Other | 25% | 50 | 63 | 79 | 99 | 124 | 25.49% |
| Total | 23.62% | 170 | 210 | 259 | 320 | 397 | 23.62% |

4.2 Target Market Segment Strategy
The target customers include the major retail outlets and export markets for the vegetables.
The target customers for instant lawn include nursery and garden centres, landscapers, and private customers.
4.3 Industry Analysis
The hydroponic industry is still fairly new in the S.A. market, in terms of research and the number of completely developed farms. The biggest negative is the start-up costs to erect a fully state-of-the-art project. Therefore, if a project is going to be developed, two major factors need to be taken into account.
- Selected Markets. Due to high quality, vegetables must be sold retail outlets, etc. to retrieve highest price.
- Project size. The project must be able to supply produce all year round; if not, retail outlets will not be interested.
The Industry is still small, and therefore a project of this magnitude will create interest among all the major veg outlet markets.
4.3.1 Competition and Buying Patterns
FynbosFarm aims to be the biggest growers of hydroponics in the KZN region. At present there are very few big growers, minimizing the competition. The advantage of hydroponics on a large scale is the availability to produce vegetables all year round in large quantities. This immediately becomes a positive factor with major retail outlets and exporters.
Strategy and Implementation Summary
The FynbosFarm group strategy is to profitably and efficiently utilize present and future agricultural technology in the production of vegetables. The company, by developing a profitable vegetable farm with all the necessary custom-innovated equipment, will gain a significant industry advantage.
Additional application and utilization of horticultural technology in the production of vegetables will double utilization of the climate controlled portion of the overhead.
The company’s goals in the first year are to:
- Develop the complete project.
- To have all 6ha planted and ready for production.
- To have the instant turf planted and ready for production early in year 2.
- To have grading and pack shed constructed.
The company’s long term plan is to also produce more selective vegetables as well as looking to get into the fresh flower market.
5.1 Competitive Edge
FynbosFarm’s main competitive advantages are:
- Efficient production utilizing greenhouses.
- No existing projects of this magnitude in the KZN region.
- Experience in the vegetable industry goes back to 1996.
5.2 Marketing Strategy
FynbosFarm will market and supply its products to the selected outlets aggressively, focusing at first on local markets, and then on export options. We will emphasize the reliable year-round output of our climate-controlled hydroponics facilities, as well as the ability to produce in-demand, non-native vegetables.
Marketing for turf will take place with direct contact between FynbosFarm and regional greenhouses and landscapers.
The company will also eventually develop a website and advertise on the Internet, although these future marketing avenues are not included in this plan.
5.3 Sales Strategy
At FynbosFarm, the sales process is primarily the same for vegetables as it is for instant turf, in that both products will be mainly sold through wholesale marketing. Shipments of vegetables will be transported in refrigerated trucks as per orders, and instant turf will be palletized on open back trucks as per orders.
5.3.1 Sales Forecast
We expect to have exceptional sales in the first year. Our direct unit costs include the costs for the agricultural labor force who will tend and manage the vegetables and turf, including incentives and bonuses. These costs are roughly 35% of all direct costs each month.


| Sales Forecast | |||||
| Year 1 | Year 2 | Year 3 | Year 4 | Year 5 | |
| Unit Sales | |||||
| Tomatoes | 2,100,000 | 1,500,000 | 2,100,000 | 1,500,000 | 2,100,000 |
| Peppers | 205,000 | 210,000 | 205,000 | 210,000 | 205,000 |
| Cucumbers | 250,000 | 250,000 | 250,000 | 250,000 | 250,000 |
| Instant Turf | 150,000 | 200,000 | 200,000 | 200,000 | 200,000 |
| Total Unit Sales | 2,705,000 | 2,160,000 | 2,755,000 | 2,160,000 | 2,755,000 |
| Unit Prices | Year 1 | Year 2 | Year 3 | Year 4 | Year 5 |
| Tomatoes | R4.00 | R4.25 | R4.50 | R4.75 | R5.00 |
| Peppers | R10.00 | R10.50 | R11.00 | R11.50 | R12.00 |
| Cucumbers | R1.80 | R1.90 | R2.10 | R2.20 | R2.30 |
| Instant Turf | R10.00 | R11.00 | R12.00 | R13.00 | R14.00 |
| Sales | |||||
| Tomatoes | R8,400,000 | R6,375,000 | R9,450,000 | R7,125,000 | R10,500,000 |
| Peppers | R2,050,000 | R2,205,000 | R2,255,000 | R2,415,000 | R2,460,000 |
| Cucumbers | R450,000 | R475,000 | R525,000 | R550,000 | R575,000 |
| Instant Turf | R1,500,000 | R2,200,000 | R2,400,000 | R2,600,000 | R2,800,000 |
| Total Sales | R12,400,000 | R11,255,000 | R14,630,000 | R12,690,000 | R16,335,000 |
| Direct Unit Costs | Year 1 | Year 2 | Year 3 | Year 4 | Year 5 |
| Tomatoes | R2.00 | R2.13 | R2.25 | R2.38 | R2.50 |
| Peppers | R5.00 | R5.25 | R5.50 | R5.75 | R6.00 |
| Cucumbers | R0.90 | R0.95 | R1.05 | R1.10 | R1.15 |
| Instant Turf | R4.80 | R5.28 | R5.76 | R6.24 | R6.72 |
| Direct Cost of Sales | |||||
| Tomatoes | R4,200,000 | R3,187,500 | R4,725,000 | R3,562,500 | R5,250,000 |
| Peppers | R1,025,000 | R1,102,500 | R1,127,500 | R1,207,500 | R1,230,000 |
| Cucumbers | R225,000 | R237,500 | R262,500 | R275,000 | R287,500 |
| Instant Turf | R720,000 | R1,056,000 | R1,152,000 | R1,248,000 | R1,344,000 |
| Subtotal Direct Cost of Sales | R6,170,000 | R5,583,500 | R7,267,000 | R6,293,000 | R8,111,500 |
5.4 Milestones
The following table and chart show the main milestones for the first year.

| Milestones | |||||
| Milestone | Start Date | End Date | Budget | Manager | Department |
| Raise funding | 11/1/2004 | 1/15/2005 | R0 | ABC | Department |
| Begin Construction | 2/1/2005 | 2/5/2005 | R15,000,000 | ABC | Department |
| Begin First Crop Planting | 5/10/2005 | 5/15/2005 | R5,000,000 | ABC | Department |
| Begin Sales | 7/1/2005 | 7/10/2005 | R0 | ABC | Department |
| Begin Turf Sales | 10/1/2005 | 10/10/2005 | R0 | ABC | Department |
| Total Sales over R12 Million | 7/1/2005 | 6/30/2006 | R0 | ABC | Department |
| Totals | R20,000,000 | ||||
Management Summary
The project manager has 10 years of experience in the vegetable industry.
[Proprietary and confidential information removed.]
6.1 Personnel Plan
The personnel plan includes the project manager, who will oversee all design and construction of the hydroponics facilities, and a consultant specializing in hydroponics. Wages for the agricultural laborers who will tend the produce are included in the Sales Forecast table as part of the direct unit costs.
| Personnel Plan | |||||
| Year 1 | Year 2 | Year 3 | Year 4 | Year 5 | |
| Project manager | R420,000 | R420,000 | R453,600 | R489,888 | R529,079 |
| Consultant | R60,000 | R63,000 | R66,150 | R69,457 | R72,930 |
| Total People | 2 | 2 | 2 | 2 | 2 |
| Total Payroll | R480,000 | R483,000 | R519,750 | R559,345 | R602,009 |
Financial Plan
The financial plan is outlined in the following tables and charts. With initial loans, we can construct the hydroponics facilities and begin crop development. Based on the high demand for these products, we expect solid sales in the first year, with improving margins.
7.1 Start-up Funding
FynbosFarm needs to fund its start-up requirements. The owner will provide personal investment, and is seeking long-term borrowing, using as collateral two other successful agricultural ventures he owns.
| Start-up Funding | |
| Start-up Expenses to Fund | R793,753 |
| Start-up Assets to Fund | R20,005,000 |
| Total Funding Required | R20,798,753 |
| Assets | |
| Non-cash Assets from Start-up | R20,000,000 |
| Cash Requirements from Start-up | R5,000 |
| Additional Cash Raised | R0 |
| Cash Balance on Starting Date | R5,000 |
| Total Assets | R20,005,000 |
| Liabilities and Capital | |
| Liabilities | |
| Current Borrowing | R0 |
| Long-term Liabilities | R18,000,000 |
| Accounts Payable (Outstanding Bills) | R0 |
| Other Current Liabilities (interest-free) | R0 |
| Total Liabilities | R18,000,000 |
| Capital | |
| Planned Investment | |
| Owners | R2,798,753 |
| Investor | R0 |
| Additional Investment Requirement | R0 |
| Total Planned Investment | R2,798,753 |
| Loss at Start-up (Start-up Expenses) | (R793,753) |
| Total Capital | R2,005,000 |
| Total Capital and Liabilities | R20,005,000 |
| Total Funding | R20,798,753 |
7.2 Important Assumptions
We assume:
- Steady demand for these products
- No major climate change that would make these products easier to grow without hydroponics in this area
7.3 Break-even Analysis
Based upon our monthly fixed costs we need to sell the number units, shown below, each month to break-even. Given the high demand for these products and our expertise in this industry, we should exceed this amount even in the first month of the plan, after our initial start-up period for construction and first crop growth.

| Break-even Analysis | |
| Monthly Units Break-even | 57,047 |
| Monthly Revenue Break-even | R261,511 |
| Assumptions: | |
| Average Per-Unit Revenue | R4.58 |
| Average Per-Unit Variable Cost | R2.28 |
| Estimated Monthly Fixed Cost | R131,388 |
7.4 Projected Profit and Loss
The following table and charts show our projected Profit and Loss statement. Monthly details for the first year can be found in the appendix.


| Pro Forma Profit and Loss | |||||
| Year 1 | Year 2 | Year 3 | Year 4 | Year 5 | |
| Sales | R12,400,000 | R11,255,000 | R14,630,000 | R12,690,000 | R16,335,000 |
| Direct Cost of Sales | R6,170,000 | R5,583,500 | R7,267,000 | R6,293,000 | R8,111,500 |
| Other Costs of Sales | R0 | R0 | R0 | R0 | R0 |
| Total Cost of Sales | R6,170,000 | R5,583,500 | R7,267,000 | R6,293,000 | R8,111,500 |
| Gross Margin | R6,230,000 | R5,671,500 | R7,363,000 | R6,397,000 | R8,223,500 |
| Gross Margin % | 50.24% | 50.39% | 50.33% | 50.41% | 50.34% |
| Expenses | |||||
| Payroll | R480,000 | R483,000 | R519,750 | R559,345 | R602,009 |
| Marketing/Promotion | R10,000 | R10,500 | R11,025 | R11,907 | R12,860 |
| Depreciation | R666,660 | R666,700 | R666,700 | R666,700 | R666,700 |
| H.P.s | R120,000 | R120,600 | R121,203 | R121,203 | R120,600 |
| Fuel | R100,000 | R105,000 | R110,250 | R115,726 | R121,550 |
| maintenance | R20,000 | R21,000 | R22,050 | R23,153 | R24,310 |
| Payroll Taxes | R0 | R0 | R0 | R0 | R0 |
| Other | R180,000 | R189,000 | R198,450 | R208,373 | R218,719 |
| Total Operating Expenses | R1,576,660 | R1,595,800 | R1,649,428 | R1,706,407 | R1,766,748 |
| Profit Before Interest and Taxes | R4,653,340 | R4,075,700 | R5,713,572 | R4,690,593 | R6,456,752 |
| EBITDA | R5,320,000 | R4,742,400 | R6,380,272 | R5,357,293 | R7,123,452 |
| Interest Expense | R1,759,750 | R1,663,000 | R1,550,500 | R1,413,000 | R1,138,000 |
| Taxes Incurred | R868,077 | R723,810 | R1,248,922 | R983,278 | R1,595,626 |
| Net Profit | R2,025,513 | R1,688,890 | R2,914,150 | R2,294,315 | R3,723,126 |
| Net Profit/Sales | 16.33% | 15.01% | 19.92% | 18.08% | 22.79% |
7.5 Projected Cash Flow
The following table and chart show our projected cash flow, including estimate repayments of the principal borrowing amount.

| Pro Forma Cash Flow | |||||
| Year 1 | Year 2 | Year 3 | Year 4 | Year 5 | |
| Cash Received | |||||
| Cash from Operations | |||||
| Cash Sales | R1,860,000 | R1,688,250 | R2,194,500 | R1,903,500 | R2,450,250 |
| Cash from Receivables | R9,471,833 | R9,665,383 | R12,144,769 | R10,953,616 | R13,570,761 |
| Subtotal Cash from Operations | R11,331,833 | R11,353,633 | R14,339,269 | R12,857,116 | R16,021,011 |
| Additional Cash Received | |||||
| Sales Tax, VAT, HST/GST Received | R0 | R0 | R0 | R0 | R0 |
| New Current Borrowing | R0 | R0 | R0 | R0 | R0 |
| New Other Liabilities (interest-free) | R0 | R0 | R0 | R0 | R0 |
| New Long-term Liabilities | R0 | R0 | R0 | R0 | R0 |
| Sales of Other Current Assets | R0 | R0 | R0 | R0 | R0 |
| Sales of Long-term Assets | R0 | R0 | R0 | R0 | R0 |
| New Investment Received | R0 | R0 | R0 | R0 | R0 |
| Subtotal Cash Received | R11,331,833 | R11,353,633 | R14,339,269 | R12,857,116 | R16,021,011 |
| Expenditures | Year 1 | Year 2 | Year 3 | Year 4 | Year 5 |
| Expenditures from Operations | |||||
| Cash Spending | R480,000 | R483,000 | R519,750 | R559,345 | R602,009 |
| Bill Payments | R8,317,863 | R8,899,410 | R10,090,933 | R9,728,985 | R10,716,935 |
| Subtotal Spent on Operations | R8,797,863 | R9,382,410 | R10,610,683 | R10,288,330 | R11,318,944 |
| Additional Cash Spent | |||||
| Sales Tax, VAT, HST/GST Paid Out | R0 | R0 | R0 | R0 | R0 |
| Principal Repayment of Current Borrowing | R0 | R0 | R0 | R0 | R0 |
| Other Liabilities Principal Repayment | R0 | R0 | R0 | R0 | R0 |
| Long-term Liabilities Principal Repayment | R870,000 | R1,000,000 | R1,250,000 | R1,500,000 | R4,000,000 |
| Purchase Other Current Assets | R0 | R0 | R0 | R0 | R0 |
| Purchase Long-term Assets | R0 | R0 | R0 | R0 | R0 |
| Dividends | R0 | R0 | R0 | R0 | R0 |
| Subtotal Cash Spent | R9,667,863 | R10,382,410 | R11,860,683 | R11,788,330 | R15,318,944 |
| Net Cash Flow | R1,663,970 | R971,223 | R2,478,586 | R1,068,786 | R702,067 |
| Cash Balance | R1,668,970 | R2,640,193 | R5,118,779 | R6,187,566 | R6,889,633 |
7.6 Projected Balance Sheet
The Balance Sheet shows a steady increase in Net Worth over the next five years.
| Pro Forma Balance Sheet | |||||
| Year 1 | Year 2 | Year 3 | Year 4 | Year 5 | |
| Assets | |||||
| Current Assets | |||||
| Cash | R1,668,970 | R2,640,193 | R5,118,779 | R6,187,566 | R6,889,633 |
| Accounts Receivable | R1,068,167 | R969,534 | R1,260,264 | R1,093,148 | R1,407,137 |
| Other Current Assets | R0 | R0 | R0 | R0 | R0 |
| Total Current Assets | R2,737,137 | R3,609,727 | R6,379,044 | R7,280,714 | R8,296,770 |
| Long-term Assets | |||||
| Long-term Assets | R20,000,000 | R20,000,000 | R20,000,000 | R20,000,000 | R20,000,000 |
| Accumulated Depreciation | R666,660 | R1,333,360 | R2,000,060 | R2,666,760 | R3,333,460 |
| Total Long-term Assets | R19,333,340 | R18,666,640 | R17,999,940 | R17,333,240 | R16,666,540 |
| Total Assets | R22,070,477 | R22,276,367 | R24,378,984 | R24,613,954 | R24,963,310 |
| Liabilities and Capital | Year 1 | Year 2 | Year 3 | Year 4 | Year 5 |
| Current Liabilities | |||||
| Accounts Payable | R909,964 | R426,964 | R865,430 | R306,085 | R932,315 |
| Current Borrowing | R0 | R0 | R0 | R0 | R0 |
| Other Current Liabilities | R0 | R0 | R0 | R0 | R0 |
| Subtotal Current Liabilities | R909,964 | R426,964 | R865,430 | R306,085 | R932,315 |
| Long-term Liabilities | R17,130,000 | R16,130,000 | R14,880,000 | R13,380,000 | R9,380,000 |
| Total Liabilities | R18,039,964 | R16,556,964 | R15,745,430 | R13,686,085 | R10,312,315 |
| Paid-in Capital | R2,798,753 | R2,798,753 | R2,798,753 | R2,798,753 | R2,798,753 |
| Retained Earnings | (R793,753) | R1,231,760 | R2,920,650 | R5,834,800 | R8,129,116 |
| Earnings | R2,025,513 | R1,688,890 | R2,914,150 | R2,294,315 | R3,723,126 |
| Total Capital | R4,030,513 | R5,719,403 | R8,633,553 | R10,927,869 | R14,650,995 |
| Total Liabilities and Capital | R22,070,477 | R22,276,367 | R24,378,984 | R24,613,954 | R24,963,310 |
| Net Worth | R4,030,513 | R5,719,403 | R8,633,553 | R10,927,868 | R14,650,995 |
7.7 Business Ratios
The following table outlines some of the more important ratios from the Hydroponic Crops Grown Under Cover industry. The final column, Industry Profile, details specific ratios based on the industry as it is classified by the Standard Industry Classification (SIC) code, 0182.9902.
| Ratio Analysis | ||||||
| Year 1 | Year 2 | Year 3 | Year 4 | Year 5 | Industry Profile | |
| Sales Growth | 0.00% | -9.23% | 29.99% | -13.26% | 28.72% | -1.70% |
| Percent of Total Assets | ||||||
| Accounts Receivable | 4.84% | 4.35% | 5.17% | 4.44% | 5.64% | 2.94% |
| Other Current Assets | 0.00% | 0.00% | 0.00% | 0.00% | 0.00% | 24.83% |
| Total Current Assets | 12.40% | 16.20% | 26.17% | 29.58% | 33.24% | 39.79% |
| Long-term Assets | 87.60% | 83.80% | 73.83% | 70.42% | 66.76% | 60.21% |
| Total Assets | 100.00% | 100.00% | 100.00% | 100.00% | 100.00% | 100.00% |
| Current Liabilities | 4.12% | 1.92% | 3.55% | 1.24% | 3.73% | 22.33% |
| Long-term Liabilities | 77.61% | 72.41% | 61.04% | 54.36% | 37.58% | 22.42% |
| Total Liabilities | 81.74% | 74.33% | 64.59% | 55.60% | 41.31% | 44.75% |
| Net Worth | 18.26% | 25.67% | 35.41% | 44.40% | 58.69% | 55.25% |
| Percent of Sales | ||||||
| Sales | 100.00% | 100.00% | 100.00% | 100.00% | 100.00% | 100.00% |
| Gross Margin | 50.24% | 50.39% | 50.33% | 50.41% | 50.34% | 46.28% |
| Selling, General & Administrative Expenses | 33.91% | 35.39% | 30.41% | 32.33% | 27.55% | 29.76% |
| Advertising Expenses | 0.00% | 0.00% | 0.00% | 0.00% | 0.00% | 0.36% |
| Profit Before Interest and Taxes | 37.53% | 36.21% | 39.05% | 36.96% | 39.53% | 0.30% |
| Main Ratios | ||||||
| Current | 3.01 | 8.45 | 7.37 | 23.79 | 8.90 | 1.08 |
| Quick | 3.01 | 8.45 | 7.37 | 23.79 | 8.90 | 0.38 |
| Total Debt to Total Assets | 81.74% | 74.33% | 64.59% | 55.60% | 41.31% | 54.22% |
| Pre-tax Return on Net Worth | 71.79% | 42.18% | 48.22% | 29.99% | 36.30% | 0.29% |
| Pre-tax Return on Assets | 13.11% | 10.83% | 17.08% | 13.32% | 21.31% | 0.63% |
| Additional Ratios | Year 1 | Year 2 | Year 3 | Year 4 | Year 5 | |
| Net Profit Margin | 16.33% | 15.01% | 19.92% | 18.08% | 22.79% | n.a |
| Return on Equity | 50.25% | 29.53% | 33.75% | 21.00% | 25.41% | n.a |
| Activity Ratios | ||||||
| Accounts Receivable Turnover | 9.87 | 9.87 | 9.87 | 9.87 | 9.87 | n.a |
| Collection Days | 29 | 39 | 33 | 40 | 33 | n.a |
| Accounts Payable Turnover | 10.14 | 19.71 | 12.17 | 29.96 | 12.17 | n.a |
| Payment Days | 27 | 29 | 22 | 23 | 20 | n.a |
| Total Asset Turnover | 0.56 | 0.51 | 0.60 | 0.52 | 0.65 | n.a |
| Debt Ratios | ||||||
| Debt to Net Worth | 4.48 | 2.89 | 1.82 | 1.25 | 0.70 | n.a |
| Current Liab. to Liab. | 0.05 | 0.03 | 0.05 | 0.02 | 0.09 | n.a |
| Liquidity Ratios | ||||||
| Net Working Capital | R1,827,173 | R3,182,763 | R5,513,613 | R6,974,628 | R7,364,455 | n.a |
| Interest Coverage | 2.64 | 2.45 | 3.68 | 3.32 | 5.67 | n.a |
| Additional Ratios | ||||||
| Assets to Sales | 1.78 | 1.98 | 1.67 | 1.94 | 1.53 | n.a |
| Current Debt/Total Assets | 4% | 2% | 4% | 1% | 4% | n.a |
| Acid Test | 1.83 | 6.18 | 5.91 | 20.22 | 7.39 | n.a |
| Sales/Net Worth | 3.08 | 1.97 | 1.69 | 1.16 | 1.11 | n.a |
| Dividend Payout | 0.00 | 0.00 | 0.00 | 0.00 | 0.00 | n.a |
Appendix
| Sales Forecast | |||||||||||||
| Month 1 | Month 2 | Month 3 | Month 4 | Month 5 | Month 6 | Month 7 | Month 8 | Month 9 | Month 10 | Month 11 | Month 12 | ||
| Unit Sales | |||||||||||||
| Tomatoes | 0% | 100,000 | 200,000 | 300,000 | 300,000 | 200,000 | 100,000 | 0 | 0 | 100,000 | 200,000 | 300,000 | 300,000 |
| Peppers | 0% | 10,000 | 15,000 | 20,000 | 30,000 | 30,000 | 30,000 | 25,000 | 20,000 | 15,000 | 0 | 0 | 10,000 |
| Cucumbers | 0% | 20,000 | 45,000 | 45,000 | 15,000 | 0 | 0 | 20,000 | 45,000 | 45,000 | 15,000 | 0 | 0 |
| Instant Turf | 0% | 0 | 0 | 0 | 30,000 | 30,000 | 30,000 | 30,000 | 30,000 | 0 | 0 | 0 | 0 |
| Total Unit Sales | 130,000 | 260,000 | 365,000 | 375,000 | 260,000 | 160,000 | 75,000 | 95,000 | 160,000 | 215,000 | 300,000 | 310,000 | |
| Unit Prices | Month 1 | Month 2 | Month 3 | Month 4 | Month 5 | Month 6 | Month 7 | Month 8 | Month 9 | Month 10 | Month 11 | Month 12 | |
| Tomatoes | R4.00 | R4.00 | R4.00 | R4.00 | R4.00 | R4.00 | R4.00 | R4.00 | R4.00 | R4.00 | R4.00 | R4.00 | |
| Peppers | R10.00 | R10.00 | R10.00 | R10.00 | R10.00 | R10.00 | R10.00 | R10.00 | R10.00 | R10.00 | R10.00 | R10.00 | |
| Cucumbers | R1.80 | R1.80 | R1.80 | R1.80 | R1.80 | R1.80 | R1.80 | R1.80 | R1.80 | R1.80 | R1.80 | R1.80 | |
| Instant Turf | R10.00 | R10.00 | R10.00 | R10.00 | R10.00 | R10.00 | R10.00 | R10.00 | R10.00 | R10.00 | R10.00 | R10.00 | |
| Sales | |||||||||||||
| Tomatoes | R400,000 | R800,000 | R1,200,000 | R1,200,000 | R800,000 | R400,000 | R0 | R0 | R400,000 | R800,000 | R1,200,000 | R1,200,000 | |
| Peppers | R100,000 | R150,000 | R200,000 | R300,000 | R300,000 | R300,000 | R250,000 | R200,000 | R150,000 | R0 | R0 | R100,000 | |
| Cucumbers | R36,000 | R81,000 | R81,000 | R27,000 | R0 | R0 | R36,000 | R81,000 | R81,000 | R27,000 | R0 | R0 | |
| Instant Turf | R0 | R0 | R0 | R300,000 | R300,000 | R300,000 | R300,000 | R300,000 | R0 | R0 | R0 | R0 | |
| Total Sales | R536,000 | R1,031,000 | R1,481,000 | R1,827,000 | R1,400,000 | R1,000,000 | R586,000 | R581,000 | R631,000 | R827,000 | R1,200,000 | R1,300,000 | |
| Direct Unit Costs | Month 1 | Month 2 | Month 3 | Month 4 | Month 5 | Month 6 | Month 7 | Month 8 | Month 9 | Month 10 | Month 11 | Month 12 | |
| Tomatoes | 50.00% | R2.00 | R2.00 | R2.00 | R2.00 | R2.00 | R2.00 | R2.00 | R2.00 | R2.00 | R2.00 | R2.00 | R2.00 |
| Peppers | 50.00% | R5.00 | R5.00 | R5.00 | R5.00 | R5.00 | R5.00 | R5.00 | R5.00 | R5.00 | R5.00 | R5.00 | R5.00 |
| Cucumbers | 50.00% | R0.90 | R0.90 | R0.90 | R0.90 | R0.90 | R0.90 | R0.90 | R0.90 | R0.90 | R0.90 | R0.90 | R0.90 |
| Instant Turf | 48.00% | R4.80 | R4.80 | R4.80 | R4.80 | R4.80 | R4.80 | R4.80 | R4.80 | R4.80 | R4.80 | R4.80 | R4.80 |
| Direct Cost of Sales | |||||||||||||
| Tomatoes | R200,000 | R400,000 | R600,000 | R600,000 | R400,000 | R200,000 | R0 | R0 | R200,000 | R400,000 | R600,000 | R600,000 | |
| Peppers | R50,000 | R75,000 | R100,000 | R150,000 | R150,000 | R150,000 | R125,000 | R100,000 | R75,000 | R0 | R0 | R50,000 | |
| Cucumbers | R18,000 | R40,500 | R40,500 | R13,500 | R0 | R0 | R18,000 | R40,500 | R40,500 | R13,500 | R0 | R0 | |
| Instant Turf | R0 | R0 | R0 | R144,000 | R144,000 | R144,000 | R144,000 | R144,000 | R0 | R0 | R0 | R0 | |
| Subtotal Direct Cost of Sales | R268,000 | R515,500 | R740,500 | R907,500 | R694,000 | R494,000 | R287,000 | R284,500 | R315,500 | R413,500 | R600,000 | R650,000 | |
| Personnel Plan | |||||||||||||
| Month 1 | Month 2 | Month 3 | Month 4 | Month 5 | Month 6 | Month 7 | Month 8 | Month 9 | Month 10 | Month 11 | Month 12 | ||
| Project manager | 0% | R35,000 | R35,000 | R35,000 | R35,000 | R35,000 | R35,000 | R35,000 | R35,000 | R35,000 | R35,000 | R35,000 | R35,000 |
| Consultant | 0% | R5,000 | R5,000 | R5,000 | R5,000 | R5,000 | R5,000 | R5,000 | R5,000 | R5,000 | R5,000 | R5,000 | R5,000 |
| Total People | 2 | 2 | 2 | 2 | 2 | 2 | 2 | 2 | 2 | 2 | 2 | 2 | |
| Total Payroll | R40,000 | R40,000 | R40,000 | R40,000 | R40,000 | R40,000 | R40,000 | R40,000 | R40,000 | R40,000 | R40,000 | R40,000 | |
| Pro Forma Profit and Loss | |||||||||||||
| Month 1 | Month 2 | Month 3 | Month 4 | Month 5 | Month 6 | Month 7 | Month 8 | Month 9 | Month 10 | Month 11 | Month 12 | ||
| Sales | R536,000 | R1,031,000 | R1,481,000 | R1,827,000 | R1,400,000 | R1,000,000 | R586,000 | R581,000 | R631,000 | R827,000 | R1,200,000 | R1,300,000 | |
| Direct Cost of Sales | R268,000 | R515,500 | R740,500 | R907,500 | R694,000 | R494,000 | R287,000 | R284,500 | R315,500 | R413,500 | R600,000 | R650,000 | |
| Other Costs of Sales | R0 | R0 | R0 | R0 | R0 | R0 | R0 | R0 | R0 | R0 | R0 | R0 | |
| Total Cost of Sales | R268,000 | R515,500 | R740,500 | R907,500 | R694,000 | R494,000 | R287,000 | R284,500 | R315,500 | R413,500 | R600,000 | R650,000 | |
| Gross Margin | R268,000 | R515,500 | R740,500 | R919,500 | R706,000 | R506,000 | R299,000 | R296,500 | R315,500 | R413,500 | R600,000 | R650,000 | |
| Gross Margin % | 50.00% | 50.00% | 50.00% | 50.33% | 50.43% | 50.60% | 51.02% | 51.03% | 50.00% | 50.00% | 50.00% | 50.00% | |
| Expenses | |||||||||||||
| Payroll | R40,000 | R40,000 | R40,000 | R40,000 | R40,000 | R40,000 | R40,000 | R40,000 | R40,000 | R40,000 | R40,000 | R40,000 | |
| Marketing/Promotion | R833 | R833 | R833 | R833 | R833 | R833 | R833 | R833 | R833 | R833 | R833 | R833 | |
| Depreciation | R55,555 | R55,555 | R55,555 | R55,555 | R55,555 | R55,555 | R55,555 | R55,555 | R55,555 | R55,555 | R55,555 | R55,555 | |
| H.P.s | R10,000 | R10,000 | R10,000 | R10,000 | R10,000 | R10,000 | R10,000 | R10,000 | R10,000 | R10,000 | R10,000 | R10,000 | |
| Fuel | R8,333 | R8,333 | R8,333 | R8,333 | R8,333 | R8,333 | R8,333 | R8,333 | R8,333 | R8,333 | R8,333 | R8,333 | |
| maintenance | R1,667 | R1,667 | R1,667 | R1,667 | R1,667 | R1,667 | R1,667 | R1,667 | R1,667 | R1,667 | R1,667 | R1,667 | |
| Payroll Taxes | 15% | R0 | R0 | R0 | R0 | R0 | R0 | R0 | R0 | R0 | R0 | R0 | R0 |
| Other | R15,000 | R15,000 | R15,000 | R15,000 | R15,000 | R15,000 | R15,000 | R15,000 | R15,000 | R15,000 | R15,000 | R15,000 | |
| Total Operating Expenses | R131,388 | R131,388 | R131,388 | R131,388 | R131,388 | R131,388 | R131,388 | R131,388 | R131,388 | R131,388 | R131,388 | R131,388 | |
| Profit Before Interest and Taxes | R136,612 | R384,112 | R609,112 | R788,112 | R574,612 | R374,612 | R167,612 | R165,112 | R184,112 | R282,112 | R468,612 | R518,612 | |
| EBITDA | R192,167 | R439,667 | R664,667 | R843,667 | R630,167 | R430,167 | R223,167 | R220,667 | R239,667 | R337,667 | R524,167 | R574,167 | |
| Interest Expense | R149,750 | R149,500 | R149,000 | R148,500 | R148,000 | R147,250 | R146,500 | R145,750 | R145,000 | R144,250 | R143,500 | R142,750 | |
| Taxes Incurred | (R3,942) | R70,383 | R138,033 | R191,883 | R127,983 | R68,208 | R6,333 | R5,808 | R11,733 | R41,358 | R97,533 | R112,758 | |
| Net Profit | (R9,197) | R164,228 | R322,078 | R447,728 | R298,628 | R159,153 | R14,778 | R13,553 | R27,378 | R96,503 | R227,578 | R263,103 | |
| Net Profit/Sales | -1.72% | 15.93% | 21.75% | 24.51% | 21.33% | 15.92% | 2.52% | 2.33% | 4.34% | 11.67% | 18.96% | 20.24% | |
| Pro Forma Cash Flow | |||||||||||||
| Month 1 | Month 2 | Month 3 | Month 4 | Month 5 | Month 6 | Month 7 | Month 8 | Month 9 | Month 10 | Month 11 | Month 12 | ||
| Cash Received | |||||||||||||
| Cash from Operations | |||||||||||||
| Cash Sales | R80,400 | R154,650 | R222,150 | R274,050 | R210,000 | R150,000 | R87,900 | R87,150 | R94,650 | R124,050 | R180,000 | R195,000 | |
| Cash from Receivables | R15,187 | R469,625 | R889,100 | R1,268,653 | R1,540,852 | R1,178,667 | R838,270 | R497,958 | R495,267 | R541,903 | R713,518 | R1,022,833 | |
| Subtotal Cash from Operations | R95,587 | R624,275 | R1,111,250 | R1,542,703 | R1,750,852 | R1,328,667 | R926,170 | R585,108 | R589,917 | R665,953 | R893,518 | R1,217,833 | |
| Additional Cash Received | |||||||||||||
| Sales Tax, VAT, HST/GST Received | 0.00% | R0 | R0 | R0 | R0 | R0 | R0 | R0 | R0 | R0 | R0 | R0 | R0 |
| New Current Borrowing | R0 | R0 | R0 | R0 | R0 | R0 | R0 | R0 | R0 | R0 | R0 | R0 | |
| New Other Liabilities (interest-free) | R0 | R0 | R0 | R0 | R0 | R0 | R0 | R0 | R0 | R0 | R0 | R0 | |
| New Long-term Liabilities | R0 | R0 | R0 | R0 | R0 | R0 | R0 | R0 | R0 | R0 | R0 | R0 | |
| Sales of Other Current Assets | R0 | R0 | R0 | R0 | R0 | R0 | R0 | R0 | R0 | R0 | R0 | R0 | |
| Sales of Long-term Assets | R0 | R0 | R0 | R0 | R0 | R0 | R0 | R0 | R0 | R0 | R0 | R0 | |
| New Investment Received | R0 | R0 | R0 | R0 | R0 | R0 | R0 | R0 | R0 | R0 | R0 | R0 | |
| Subtotal Cash Received | R95,587 | R624,275 | R1,111,250 | R1,542,703 | R1,750,852 | R1,328,667 | R926,170 | R585,108 | R589,917 | R665,953 | R893,518 | R1,217,833 | |
| Expenditures | Month 1 | Month 2 | Month 3 | Month 4 | Month 5 | Month 6 | Month 7 | Month 8 | Month 9 | Month 10 | Month 11 | Month 12 | |
| Expenditures from Operations | |||||||||||||
| Cash Spending | R40,000 | R40,000 | R40,000 | R40,000 | R40,000 | R40,000 | R40,000 | R40,000 | R40,000 | R40,000 | R40,000 | R40,000 | |
| Bill Payments | R14,988 | R460,361 | R780,955 | R1,070,712 | R1,274,454 | R997,133 | R736,304 | R475,541 | R473,098 | R512,296 | R643,006 | R879,016 | |
| Subtotal Spent on Operations | R54,988 | R500,361 | R820,955 | R1,110,712 | R1,314,454 | R1,037,133 | R776,304 | R515,541 | R513,098 | R552,296 | R683,006 | R919,016 | |
| Additional Cash Spent | |||||||||||||
| Sales Tax, VAT, HST/GST Paid Out | R0 | R0 | R0 | R0 | R0 | R0 | R0 | R0 | R0 | R0 | R0 | R0 | |
| Principal Repayment of Current Borrowing | R0 | R0 | R0 | R0 | R0 | R0 | R0 | R0 | R0 | R0 | R0 | R0 | |
| Other Liabilities Principal Repayment | R0 | R0 | R0 | R0 | R0 | R0 | R0 | R0 | R0 | R0 | R0 | R0 | |
| Long-term Liabilities Principal Repayment | R30,000 | R30,000 | R60,000 | R60,000 | R60,000 | R90,000 | R90,000 | R90,000 | R90,000 | R90,000 | R90,000 | R90,000 | |
| Purchase Other Current Assets | R0 | R0 | R0 | R0 | R0 | R0 | R0 | R0 | R0 | R0 | R0 | R0 | |
| Purchase Long-term Assets | R0 | R0 | R0 | R0 | R0 | R0 | R0 | R0 | R0 | R0 | R0 | R0 | |
| Dividends | R0 | R0 | R0 | R0 | R0 | R0 | R0 | R0 | R0 | R0 | R0 | R0 | |
| Subtotal Cash Spent | R84,988 | R530,361 | R880,955 | R1,170,712 | R1,374,454 | R1,127,133 | R866,304 | R605,541 | R603,098 | R642,296 | R773,006 | R1,009,016 | |
| Net Cash Flow | R10,599 | R93,914 | R230,295 | R371,991 | R376,398 | R201,534 | R59,866 | (R20,433) | (R13,181) | R23,657 | R120,512 | R208,817 | |
| Cash Balance | R15,599 | R109,513 | R339,807 | R711,799 | R1,088,197 | R1,289,731 | R1,349,597 | R1,329,164 | R1,315,983 | R1,339,640 | R1,460,153 | R1,668,970 | |
| Pro Forma Balance Sheet | |||||||||||||
| Month 1 | Month 2 | Month 3 | Month 4 | Month 5 | Month 6 | Month 7 | Month 8 | Month 9 | Month 10 | Month 11 | Month 12 | ||
| Assets | Starting Balances | ||||||||||||
| Current Assets | |||||||||||||
| Cash | R5,000 | R15,599 | R109,513 | R339,807 | R711,799 | R1,088,197 | R1,289,731 | R1,349,597 | R1,329,164 | R1,315,983 | R1,339,640 | R1,460,153 | R1,668,970 |
| Accounts Receivable | R0 | R440,413 | R847,138 | R1,216,888 | R1,501,185 | R1,150,333 | R821,667 | R481,497 | R477,388 | R518,472 | R679,518 | R986,000 | R1,068,167 |
| Other Current Assets | R0 | R0 | R0 | R0 | R0 | R0 | R0 | R0 | R0 | R0 | R0 | R0 | R0 |
| Total Current Assets | R5,000 | R456,012 | R956,651 | R1,556,696 | R2,212,984 | R2,238,530 | R2,111,398 | R1,831,093 | R1,806,552 | R1,834,455 | R2,019,159 | R2,446,153 | R2,737,137 |
| Long-term Assets | |||||||||||||
| Long-term Assets | R20,000,000 | R20,000,000 | R20,000,000 | R20,000,000 | R20,000,000 | R20,000,000 | R20,000,000 | R20,000,000 | R20,000,000 | R20,000,000 | R20,000,000 | R20,000,000 | R20,000,000 |
| Accumulated Depreciation | R0 | R55,555 | R111,110 | R166,665 | R222,220 | R277,775 | R333,330 | R388,885 | R444,440 | R499,995 | R555,550 | R611,105 | R666,660 |
| Total Long-term Assets | R20,000,000 | R19,944,445 | R19,888,890 | R19,833,335 | R19,777,780 | R19,722,225 | R19,666,670 | R19,611,115 | R19,555,560 | R19,500,005 | R19,444,450 | R19,388,895 | R19,333,340 |
| Total Assets | R20,005,000 | R20,400,457 | R20,845,541 | R21,390,031 | R21,990,764 | R21,960,755 | R21,778,068 | R21,442,208 | R21,362,112 | R21,334,460 | R21,463,609 | R21,835,048 | R22,070,477 |
| Liabilities and Capital | Month 1 | Month 2 | Month 3 | Month 4 | Month 5 | Month 6 | Month 7 | Month 8 | Month 9 | Month 10 | Month 11 | Month 12 | |
| Current Liabilities | |||||||||||||
| Accounts Payable | R0 | R434,654 | R745,510 | R1,027,921 | R1,240,926 | R972,290 | R720,449 | R459,811 | R456,162 | R491,131 | R613,777 | R847,638 | R909,964 |
| Current Borrowing | R0 | R0 | R0 | R0 | R0 | R0 | R0 | R0 | R0 | R0 | R0 | R0 | R0 |
| Other Current Liabilities | R0 | R0 | R0 | R0 | R0 | R0 | R0 | R0 | R0 | R0 | R0 | R0 | R0 |
| Subtotal Current Liabilities | R0 | R434,654 | R745,510 | R1,027,921 | R1,240,926 | R972,290 | R720,449 | R459,811 | R456,162 | R491,131 | R613,777 | R847,638 | R909,964 |
| Long-term Liabilities | R18,000,000 | R17,970,000 | R17,940,000 | R17,880,000 | R17,820,000 | R17,760,000 | R17,670,000 | R17,580,000 | R17,490,000 | R17,400,000 | R17,310,000 | R17,220,000 | R17,130,000 |
| Total Liabilities | R18,000,000 | R18,404,654 | R18,685,510 | R18,907,921 | R19,060,926 | R18,732,290 | R18,390,449 | R18,039,811 | R17,946,162 | R17,891,131 | R17,923,777 | R18,067,638 | R18,039,964 |
| Paid-in Capital | R2,798,753 | R2,798,753 | R2,798,753 | R2,798,753 | R2,798,753 | R2,798,753 | R2,798,753 | R2,798,753 | R2,798,753 | R2,798,753 | R2,798,753 | R2,798,753 | R2,798,753 |
| Retained Earnings | (R793,753) | (R793,753) | (R793,753) | (R793,753) | (R793,753) | (R793,753) | (R793,753) | (R793,753) | (R793,753) | (R793,753) | (R793,753) | (R793,753) | (R793,753) |
| Earnings | R0 | (R9,197) | R155,031 | R477,109 | R924,838 | R1,223,466 | R1,382,619 | R1,397,397 | R1,410,950 | R1,438,328 | R1,534,832 | R1,762,410 | R2,025,513 |
| Total Capital | R2,005,000 | R1,995,803 | R2,160,031 | R2,482,110 | R2,929,838 | R3,228,466 | R3,387,619 | R3,402,397 | R3,415,950 | R3,443,329 | R3,539,832 | R3,767,410 | R4,030,513 |
| Total Liabilities and Capital | R20,005,000 | R20,400,457 | R20,845,541 | R21,390,031 | R21,990,764 | R21,960,755 | R21,778,068 | R21,442,208 | R21,362,112 | R21,334,460 | R21,463,609 | R21,835,048 | R22,070,477 |
| Net Worth | R2,005,000 | R1,995,803 | R2,160,031 | R2,482,110 | R2,929,838 | R3,228,466 | R3,387,619 | R3,402,397 | R3,415,950 | R3,443,329 | R3,539,832 | R3,767,410 | R4,030,513 |


