
Human Capital Maximizers
Executive Summary
Human Capital Maximizers (HCM) is a human resource consulting company located in Portland, Oregon. HCM has expertise in a wide range of HR areas and is targeting the emerging company market. HCM will offer this market the ability to compensate client’s employees with stock options from their company. This will be especially appealing to many start-up companies that find capital scarce.
Major Adversity, the founder and owner will be leveraging his past and current personal/professional relationships to generate business for Human Capital Maximizers. Major will be the sole employee until month six when he will be hiring a human resource specialist/manager to help out with the consulting. Human Capital Maximizers will show increasing profitability over the next three years.

1.1 Keys to Success
The keys to success are to provide a needed service while providing a flexible means of compensation.
1.2 Mission
Human Capital Maximizers’ mission is to provide human resource consulting for emerging companies. We exist to attract and maintain customers. When we adhere to this maxim, everything else will fall into place. Our services will exceed the expectations of our customers.
1.3 Objectives
The objectives for the first three years of operation include:
- To create a service-based company whose primary goal is to exceed customer’s expectations.
- To increase our number of clients served by 20% per year through superior performance and word-of-mouth referrals.
- To develop a sustainable start-up consultancy firm that can survive off its own cash flow and has significant equity holdings in emerging companies.
Company Summary
Human Capital Maximizers is a HR consultancy firm serving the Portland area market. HCM will be set up as an Oregon Corporation owned by Major Adversity and will focus on emerging companies.
2.1 Company Ownership
Human Capital Maximizers is a privately held Oregon corporation founded and owned by Major Adversity.
2.2 Start-up Summary
Human Capital Maximizers will incur the following start-up expenses:
- Two desks, two chairs, and two lockable file cabinets.
- Two computer systems including a CD-RW, printer and a third computer to serve as a server.
- DSL router and DSL connections.
- Two telephones, fax machine, and copier.
Please note that the following items which are considered assets to be used for more than a year will labeled long-term assets and will be depreciated using G.A.A.P. approved straight-line depreciation method.

| Start-up | |
| Requirements | |
| Start-up Expenses | |
| Legal | $1,000 |
| Stationery etc. | $150 |
| Website development | $0 |
| Other | $0 |
| Total Start-up Expenses | $1,150 |
| Start-up Assets | |
| Cash Required | $10,050 |
| Other Current Assets | $0 |
| Long-term Assets | $4,800 |
| Total Assets | $14,850 |
| Total Requirements | $16,000 |
| Start-up Funding | |
| Start-up Expenses to Fund | $1,150 |
| Start-up Assets to Fund | $14,850 |
| Total Funding Required | $16,000 |
| Assets | |
| Non-cash Assets from Start-up | $4,800 |
| Cash Requirements from Start-up | $10,050 |
| Additional Cash Raised | $0 |
| Cash Balance on Starting Date | $10,050 |
| Total Assets | $14,850 |
| Liabilities and Capital | |
| Liabilities | |
| Current Borrowing | $0 |
| Long-term Liabilities | $0 |
| Accounts Payable (Outstanding Bills) | $0 |
| Other Current Liabilities (interest-free) | $0 |
| Total Liabilities | $0 |
| Capital | |
| Planned Investment | |
| Major | $16,000 |
| Investor 2 | $0 |
| Other | $0 |
| Additional Investment Requirement | $0 |
| Total Planned Investment | $16,000 |
| Loss at Start-up (Start-up Expenses) | ($1,150) |
| Total Capital | $14,850 |
| Total Capital and Liabilities | $14,850 |
| Total Funding | $16,000 |
Services
Human Capital Maximizers provides human resource consulting to emerging companies in the Portland/Vancouver market. Human Capital Maximizers will charge a below market rate and take stock options in the company. Human Capital Maximizers will provide consulting for the following service areas:
- Human resource management.
- Organizational management.
- Professional development.
- Employee relations.
- Labor relations.
- Benefits and compensation.
- HR policy and procedure.
- Executive search.
- Sexual harassment.
- Position classification.
- Personnel management systems.
- Performance evaluations.
- Diversity.
The pricing structure will either be an hourly rate or a per project fee. These options will be settled on in negotiation with the client. In general, Human Capital Maximizers is willing to be as flexible as possible.
Market Analysis Summary
Emerging companies will be the target market for several reasons:
- They are in need of HR services as they are growing rapidly.
- They often do not have a large enough in-house solution as they are increasing in size.
- Capital is a scarce resource for emerging companies so the ability to accept stock options in replace of cash is appealing.
The emerging company market can be further broken down into two categories, technology and non-technology. The significance of the breakdown is not that significant because many of the networking activities are occurring in settings that do not differentiate between technology and non-technology.
4.1 Market Segmentation
Human Capital Maximizers market can be segmented into two different groups, emerging high-tech companies and emerging non-high tech companies. The emerging high-tech companies are going to be the larger of the two segments. Even with the Internet bubble bursting within the last year, there are still many different emerging high-tech companies proliferating. This is evidenced by the Business Journal of Portland which in their annual list of fastest growing companies for this year, 18 of the top 25 were technology companies.
There are also non-technology companies that are emerging in the Portland area and Human Capital Maximizers will be able to serve them as well.

| Market Analysis | |||||||
| Year 1 | Year 2 | Year 3 | Year 4 | Year 5 | |||
| Potential Customers | Growth | CAGR | |||||
| Emerging technology companies | 10% | 345 | 380 | 418 | 460 | 506 | 10.05% |
| Emerging non-technology companies | 9% | 225 | 245 | 267 | 291 | 317 | 8.95% |
| Other | 0% | 0 | 0 | 0 | 0 | 0 | 0.00% |
| Total | 9.62% | 570 | 625 | 685 | 751 | 823 | 9.62% |
4.2 Target Market Segment Strategy
Human Capital Maximizers’ two markets will be primarily targeted through networking activities. Some networking will be conducted through the Oregon Entrepreneur Association, an association that supports entrepreneurial ventures in the local area. This organization has monthly meetings that are in round-table format, allowing members to socialize.
Human Capital Maximizers will also be networking from personal/professional contacts that Major has developed professionally in the last five years in the HR/start-up industry. HCM will also be relying on word of mouth to grow its customer base.
Strategy and Implementation Summary
Human Capital Maximizers will use their competitive edge of compensation flexibility to attract emerging companies. This competitive advantage is especially valuable to emerging companies who are typically struggling to find enough capital to grow their business. Accepting stock options as compensation is useful because equity is one thing these companies have lots of (that is of course if they haven’t given it all away to the Venture Capitalists).
5.1 Milestones
Human Capital Maximizers will have several milestones early on:
- Business plan completion. This will be done as a roadmap for the organization. This will be an indispensable tool for the ongoing performance and improvement of the company.
- Set up office.
- HCM’s first five customers.
- Profitability.
| Milestones | |||||
| Milestone | Start Date | End Date | Budget | Manager | Department |
| Business plan completion | 1/1/2001 | 2/1/2001 | $0 | ABC | Marketing |
| Set up office | 1/1/2001 | 2/1/2001 | $0 | ABC | Department |
| HCM’s first five customers | 1/1/2001 | 3/31/2001 | $0 | ABC | Department |
| Profitability | 1/1/2001 | ****** | $0 | ABC | Department |
| Totals | $0 | ||||
5.2 Sales Strategy
As stated earlier, the marketing and sales will be done primarily through networking. This means the bulk of the leads will have been developed through a personal/professional relationship that Major has developed either in his previous professional work or through his activities with the Oregon Entrepreneurs Association and other similar associations. The sales spiel will be based on Human Capital Maximizers experience in the field as well as their flexibility for compensation. Major will be able to explain to the prospective client the areas that he has experience in and the solutions that he can offer.

Major will also be able to speak about Human Capital Maximizers ability to accept options in lieu of cash. This will be appealing to companies, particularly in the current capital market which is quite scarce. Since capital is more difficult to come by now than in the last few years, emerging companies will be excited about this option.
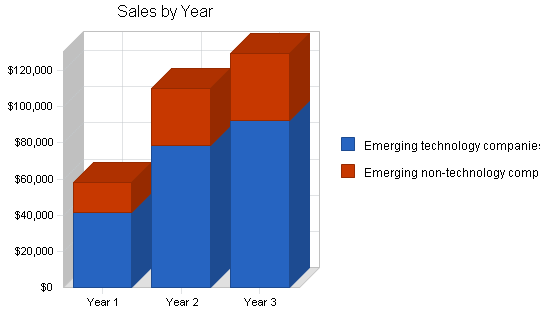
5.2.1 Sales Forecast
The first month will be used to set up the office. Additionally, during the first month Major will be working hard on developing contracts. The second month will see some activity, but it will not be until month six when business will be picking up at a higher rate. Sales will continue to grow through year three.

| Sales Forecast | |||
| Year 1 | Year 2 | Year 3 | |
| Sales | |||
| Emerging technology companies | $41,500 | $78,455 | $92,541 |
| Emerging non-technology companies | $16,600 | $31,382 | $37,016 |
| Total Sales | $58,100 | $109,837 | $129,557 |
| Direct Cost of Sales | Year 1 | Year 2 | Year 3 |
| Emerging technology companies | $2,075 | $3,923 | $4,627 |
| Emerging non-technology companies | $830 | $1,569 | $1,851 |
| Subtotal Direct Cost of Sales | $2,905 | $5,492 | $6,478 |
5.3 Competitive Edge
Human Capital Maximizers competitive edge is their flexibility for compensation. Most or all other companies require compensation to be in the form of cash, for them cash is king. Human Capital Maximizers is able to take stock options in lieu of some cash. While Human Capital Maximizers needs some cash to float the business, it can take up to 75% of its fees in equity. Human Capital Maximizers is able to do this because they have secured an office space that is low in cost, helping them reduce their overhead. In addition, Major’s wife contributes a significant portion of money to the household so Major is not in need of a lot of monthly compensation. This allows him to accept options as payment in hopes of an upside to come several years for now. (Please note the the HR industry, unlike law firms and accounting firms do not run into conflict of interests situations regarding receiving equity as compensation.)
Web Plan Summary
The website will be used as a resource that prospective companies can view to gain more information about the company. In essence it is Human Capital Maximizers’ brochure. On the site there will be information about the management of the company and corresponding bios indicating all of their experience. Also on the website will be a list of present and past clients and information regarding Human Capital Maximizers’ fee structure and willingness to accept stakes of option.
6.1 Website Marketing Strategy
The marketing of the website will consist of submitting it to the popular search engines. The website will be used more as a information tool that prospective companies can be sent to for more information about Human Capital Maximizers as opposed to marketing the website in order for the website to develop new leads.
6.2 Development Requirements
The development requirements will entail hiring an individual (preferably a student for cost saving purposes) to develop and produce the site.
Management Summary
Major Adversity, the founder and owner received his undergraduate degree in marketing from Reed College. After completing college Major recognized that he would eventually need to go to graduate school but was not ready to yet.
Major worked in a large bicycle store for four years after college. Major started out as a mechanic but quickly moved up to manager where he was responsible for much of the operation. Some of the new responsibilities that Major enjoyed was the interviewing, selection & hiring, compensation, and employee relations. After fours years in the bike shop Major was looking for a new challenge so he entered the University of Portland to pursue his MBA.
Major received his MBA within two years and went to work for Nike out of school in their HR department. After a year and half Major left Nike to work for a HR consultancy boutique that worked primarily with technology companies, many of them start ups. Major enjoyed this thoroughly because of the dynamic environment that his clients worked in. Major stayed with this firm for a total of four years.
Toward the end of Major’s four years he got married and his wife, as a professional, was contributing large amounts of salary to the household. This led Major to consider opening his own HR consultancy because he would be able to undertake some risk since the household was supported to a large degree by his wife. Additionally, Major was could consider taking equity as compensation because a monthly salary was not a necessity.
7.1 Personnel Plan
Major will work full time for Human Capital Maximizers. By month six Major will have developed more work than he will be able to manage himself and he will hire an additional HR consultant to help him out. The employee will receive a straight salary and will have no future equity options in the client’s companies. This employee will be given HR projects and will do the research and sometimes present the findings to the client, other times will allow Major to present to the client.
| Personnel Plan | |||
| Year 1 | Year 2 | Year 3 | |
| Major | $24,000 | $24,000 | $24,000 |
| Full time employee | $24,500 | $42,000 | $42,000 |
| Total People | 2 | 2 | 2 |
| Total Payroll | $48,500 | $66,000 | $66,000 |
Financial Plan
The following sections will outline important financial information. Please note that the stock options granted in lieu of compensation are not entered into the financial plan as they are not yet of value. Upon exercising the options there will be tax consequences (because one of the realizing events has occurred) as well as assets to be accounted for.
8.1 Important Assumptions
The following table details important financial assumptions.
| General Assumptions | |||
| Year 1 | Year 2 | Year 3 | |
| Plan Month | 1 | 2 | 3 |
| Current Interest Rate | 10.00% | 10.00% | 10.00% |
| Long-term Interest Rate | 10.00% | 10.00% | 10.00% |
| Tax Rate | 30.00% | 30.00% | 30.00% |
| Other | 0 | 0 | 0 |
8.2 Break-even Analysis
The Break-even Analysis is shown below.

| Break-even Analysis | |
| Monthly Revenue Break-even | $5,766 |
| Assumptions: | |
| Average Percent Variable Cost | 5% |
| Estimated Monthly Fixed Cost | $5,478 |
8.3 Projected Profit and Loss
The following table will indicate projected profit and loss.


| Pro Forma Profit and Loss | |||
| Year 1 | Year 2 | Year 3 | |
| Sales | $58,100 | $109,837 | $129,557 |
| Direct Cost of Sales | $2,905 | $5,492 | $6,478 |
| Other Production Expenses | $0 | $0 | $0 |
| Total Cost of Sales | $2,905 | $5,492 | $6,478 |
| Gross Margin | $55,195 | $104,345 | $123,080 |
| Gross Margin % | 95.00% | 95.00% | 95.00% |
| Expenses | |||
| Payroll | $48,500 | $66,000 | $66,000 |
| Sales and Marketing and Other Expenses | $0 | $0 | $0 |
| Depreciation | $960 | $960 | $960 |
| Leased Equipment | $0 | $0 | $0 |
| Utilities | $1,200 | $1,200 | $1,200 |
| Insurance | $1,800 | $1,800 | $1,800 |
| Rent | $6,000 | $6,000 | $6,000 |
| Payroll Taxes | $7,275 | $9,900 | $9,900 |
| Other | $0 | $0 | $0 |
| Total Operating Expenses | $65,735 | $85,860 | $85,860 |
| Profit Before Interest and Taxes | ($10,540) | $18,485 | $37,220 |
| EBITDA | ($9,580) | $19,445 | $38,180 |
| Interest Expense | $0 | $0 | $0 |
| Taxes Incurred | $0 | $5,546 | $11,166 |
| Net Profit | ($10,540) | $12,940 | $26,054 |
| Net Profit/Sales | -18.14% | 11.78% | 20.11% |
8.4 Projected Cash Flow
The following chart and table will indicate projected cash flow.

| Pro Forma Cash Flow | |||
| Year 1 | Year 2 | Year 3 | |
| Cash Received | |||
| Cash from Operations | |||
| Cash Sales | $58,100 | $109,837 | $129,557 |
| Subtotal Cash from Operations | $58,100 | $109,837 | $129,557 |
| Additional Cash Received | |||
| Sales Tax, VAT, HST/GST Received | $0 | $0 | $0 |
| New Current Borrowing | $0 | $0 | $0 |
| New Other Liabilities (interest-free) | $0 | $0 | $0 |
| New Long-term Liabilities | $0 | $0 | $0 |
| Sales of Other Current Assets | $0 | $0 | $0 |
| Sales of Long-term Assets | $0 | $0 | $0 |
| New Investment Received | $0 | $0 | $0 |
| Subtotal Cash Received | $58,100 | $109,837 | $129,557 |
| Expenditures | Year 1 | Year 2 | Year 3 |
| Expenditures from Operations | |||
| Cash Spending | $48,500 | $66,000 | $66,000 |
| Bill Payments | $17,265 | $29,392 | $36,001 |
| Subtotal Spent on Operations | $65,765 | $95,392 | $102,001 |
| Additional Cash Spent | |||
| Sales Tax, VAT, HST/GST Paid Out | $0 | $0 | $0 |
| Principal Repayment of Current Borrowing | $0 | $0 | $0 |
| Other Liabilities Principal Repayment | $0 | $0 | $0 |
| Long-term Liabilities Principal Repayment | $0 | $0 | $0 |
| Purchase Other Current Assets | $0 | $0 | $0 |
| Purchase Long-term Assets | $0 | $0 | $0 |
| Dividends | $0 | $0 | $0 |
| Subtotal Cash Spent | $65,765 | $95,392 | $102,001 |
| Net Cash Flow | ($7,665) | $14,445 | $27,557 |
| Cash Balance | $2,385 | $16,830 | $44,387 |
8.5 Projected Balance Sheet
The following table will indicate the projected balance sheet.
| Pro Forma Balance Sheet | |||
| Year 1 | Year 2 | Year 3 | |
| Assets | |||
| Current Assets | |||
| Cash | $2,385 | $16,830 | $44,387 |
| Other Current Assets | $0 | $0 | $0 |
| Total Current Assets | $2,385 | $16,830 | $44,387 |
| Long-term Assets | |||
| Long-term Assets | $4,800 | $4,800 | $4,800 |
| Accumulated Depreciation | $960 | $1,920 | $2,880 |
| Total Long-term Assets | $3,840 | $2,880 | $1,920 |
| Total Assets | $6,225 | $19,710 | $46,307 |
| Liabilities and Capital | Year 1 | Year 2 | Year 3 |
| Current Liabilities | |||
| Accounts Payable | $1,915 | $2,461 | $3,004 |
| Current Borrowing | $0 | $0 | $0 |
| Other Current Liabilities | $0 | $0 | $0 |
| Subtotal Current Liabilities | $1,915 | $2,461 | $3,004 |
| Long-term Liabilities | $0 | $0 | $0 |
| Total Liabilities | $1,915 | $2,461 | $3,004 |
| Paid-in Capital | $16,000 | $16,000 | $16,000 |
| Retained Earnings | ($1,150) | ($11,690) | $1,250 |
| Earnings | ($10,540) | $12,940 | $26,054 |
| Total Capital | $4,310 | $17,250 | $43,303 |
| Total Liabilities and Capital | $6,225 | $19,710 | $46,307 |
| Net Worth | $4,310 | $17,250 | $43,303 |
8.6 Business Ratios
The following table outlines some of the more important ratios from the Management Consulting Resources industry. The final column, Industry Profile, details specific ratios based on the industry as it is classified by the Standard Industry Classification (SIC) code, 8742.
| Ratio Analysis | ||||
| Year 1 | Year 2 | Year 3 | Industry Profile | |
| Sales Growth | 0.00% | 89.05% | 17.95% | 8.60% |
| Percent of Total Assets | ||||
| Other Current Assets | 0.00% | 0.00% | 0.00% | 46.70% |
| Total Current Assets | 38.31% | 85.39% | 95.85% | 74.90% |
| Long-term Assets | 61.69% | 14.61% | 4.15% | 25.10% |
| Total Assets | 100.00% | 100.00% | 100.00% | 100.00% |
| Current Liabilities | 30.76% | 12.48% | 6.49% | 42.80% |
| Long-term Liabilities | 0.00% | 0.00% | 0.00% | 17.20% |
| Total Liabilities | 30.76% | 12.48% | 6.49% | 60.00% |
| Net Worth | 69.24% | 87.52% | 93.51% | 40.00% |
| Percent of Sales | ||||
| Sales | 100.00% | 100.00% | 100.00% | 100.00% |
| Gross Margin | 95.00% | 95.00% | 95.00% | 0.00% |
| Selling, General & Administrative Expenses | 113.14% | 83.22% | 74.89% | 83.50% |
| Advertising Expenses | 0.00% | 0.00% | 0.00% | 1.20% |
| Profit Before Interest and Taxes | -18.14% | 16.83% | 28.73% | 2.60% |
| Main Ratios | ||||
| Current | 1.25 | 6.84 | 14.78 | 1.59 |
| Quick | 1.25 | 6.84 | 14.78 | 1.26 |
| Total Debt to Total Assets | 30.76% | 12.48% | 6.49% | 60.00% |
| Pre-tax Return on Net Worth | -244.55% | 107.16% | 85.95% | 4.40% |
| Pre-tax Return on Assets | -169.32% | 93.78% | 80.38% | 10.90% |
| Additional Ratios | Year 1 | Year 2 | Year 3 | |
| Net Profit Margin | -18.14% | 11.78% | 20.11% | n.a |
| Return on Equity | -244.55% | 75.01% | 60.17% | n.a |
| Activity Ratios | ||||
| Accounts Payable Turnover | 10.02 | 12.17 | 12.17 | n.a |
| Payment Days | 27 | 27 | 27 | n.a |
| Total Asset Turnover | 9.33 | 5.57 | 2.80 | n.a |
| Debt Ratios | ||||
| Debt to Net Worth | 0.44 | 0.14 | 0.07 | n.a |
| Current Liab. to Liab. | 1.00 | 1.00 | 1.00 | n.a |
| Liquidity Ratios | ||||
| Net Working Capital | $470 | $14,370 | $41,383 | n.a |
| Interest Coverage | 0.00 | 0.00 | 0.00 | n.a |
| Additional Ratios | ||||
| Assets to Sales | 0.11 | 0.18 | 0.36 | n.a |
| Current Debt/Total Assets | 31% | 12% | 6% | n.a |
| Acid Test | 1.25 | 6.84 | 14.78 | n.a |
| Sales/Net Worth | 13.48 | 6.37 | 2.99 | n.a |
| Dividend Payout | 0.00 | 0.00 | 0.00 | n.a |
Appendix
| Sales Forecast | |||||||||||||
| Month 1 | Month 2 | Month 3 | Month 4 | Month 5 | Month 6 | Month 7 | Month 8 | Month 9 | Month 10 | Month 11 | Month 12 | ||
| Sales | |||||||||||||
| Emerging technology companies | 0% | $1,000 | $1,500 | $1,900 | $2,600 | $2,800 | $3,200 | $3,800 | $4,100 | $4,300 | $5,100 | $5,400 | $5,800 |
| Emerging non-technology companies | 0% | $400 | $600 | $760 | $1,040 | $1,120 | $1,280 | $1,520 | $1,640 | $1,720 | $2,040 | $2,160 | $2,320 |
| Total Sales | $1,400 | $2,100 | $2,660 | $3,640 | $3,920 | $4,480 | $5,320 | $5,740 | $6,020 | $7,140 | $7,560 | $8,120 | |
| Direct Cost of Sales | Month 1 | Month 2 | Month 3 | Month 4 | Month 5 | Month 6 | Month 7 | Month 8 | Month 9 | Month 10 | Month 11 | Month 12 | |
| Emerging technology companies | $50 | $75 | $95 | $130 | $140 | $160 | $190 | $205 | $215 | $255 | $270 | $290 | |
| Emerging non-technology companies | $20 | $30 | $38 | $52 | $56 | $64 | $76 | $82 | $86 | $102 | $108 | $116 | |
| Subtotal Direct Cost of Sales | $70 | $105 | $133 | $182 | $196 | $224 | $266 | $287 | $301 | $357 | $378 | $406 | |
| Personnel Plan | |||||||||||||
| Month 1 | Month 2 | Month 3 | Month 4 | Month 5 | Month 6 | Month 7 | Month 8 | Month 9 | Month 10 | Month 11 | Month 12 | ||
| Major | 0% | $2,000 | $2,000 | $2,000 | $2,000 | $2,000 | $2,000 | $2,000 | $2,000 | $2,000 | $2,000 | $2,000 | $2,000 |
| Full time employee | 0% | $0 | $0 | $0 | $0 | $0 | $3,500 | $3,500 | $3,500 | $3,500 | $3,500 | $3,500 | $3,500 |
| Total People | 1 | 1 | 1 | 1 | 1 | 2 | 2 | 2 | 2 | 2 | 2 | 2 | |
| Total Payroll | $2,000 | $2,000 | $2,000 | $2,000 | $2,000 | $5,500 | $5,500 | $5,500 | $5,500 | $5,500 | $5,500 | $5,500 | |
| General Assumptions | |||||||||||||
| Month 1 | Month 2 | Month 3 | Month 4 | Month 5 | Month 6 | Month 7 | Month 8 | Month 9 | Month 10 | Month 11 | Month 12 | ||
| Plan Month | 1 | 2 | 3 | 4 | 5 | 6 | 7 | 8 | 9 | 10 | 11 | 12 | |
| Current Interest Rate | 10.00% | 10.00% | 10.00% | 10.00% | 10.00% | 10.00% | 10.00% | 10.00% | 10.00% | 10.00% | 10.00% | 10.00% | |
| Long-term Interest Rate | 10.00% | 10.00% | 10.00% | 10.00% | 10.00% | 10.00% | 10.00% | 10.00% | 10.00% | 10.00% | 10.00% | 10.00% | |
| Tax Rate | 30.00% | 30.00% | 30.00% | 30.00% | 30.00% | 30.00% | 30.00% | 30.00% | 30.00% | 30.00% | 30.00% | 30.00% | |
| Other | 0 | 0 | 0 | 0 | 0 | 0 | 0 | 0 | 0 | 0 | 0 | 0 | |
| Pro Forma Profit and Loss | |||||||||||||
| Month 1 | Month 2 | Month 3 | Month 4 | Month 5 | Month 6 | Month 7 | Month 8 | Month 9 | Month 10 | Month 11 | Month 12 | ||
| Sales | $1,400 | $2,100 | $2,660 | $3,640 | $3,920 | $4,480 | $5,320 | $5,740 | $6,020 | $7,140 | $7,560 | $8,120 | |
| Direct Cost of Sales | $70 | $105 | $133 | $182 | $196 | $224 | $266 | $287 | $301 | $357 | $378 | $406 | |
| Other Production Expenses | $0 | $0 | $0 | $0 | $0 | $0 | $0 | $0 | $0 | $0 | $0 | $0 | |
| Total Cost of Sales | $70 | $105 | $133 | $182 | $196 | $224 | $266 | $287 | $301 | $357 | $378 | $406 | |
| Gross Margin | $1,330 | $1,995 | $2,527 | $3,458 | $3,724 | $4,256 | $5,054 | $5,453 | $5,719 | $6,783 | $7,182 | $7,714 | |
| Gross Margin % | 95.00% | 95.00% | 95.00% | 95.00% | 95.00% | 95.00% | 95.00% | 95.00% | 95.00% | 95.00% | 95.00% | 95.00% | |
| Expenses | |||||||||||||
| Payroll | $2,000 | $2,000 | $2,000 | $2,000 | $2,000 | $5,500 | $5,500 | $5,500 | $5,500 | $5,500 | $5,500 | $5,500 | |
| Sales and Marketing and Other Expenses | $0 | $0 | $0 | $0 | $0 | $0 | $0 | $0 | $0 | $0 | $0 | $0 | |
| Depreciation | $80 | $80 | $80 | $80 | $80 | $80 | $80 | $80 | $80 | $80 | $80 | $80 | |
| Leased Equipment | $0 | $0 | $0 | $0 | $0 | $0 | $0 | $0 | $0 | $0 | $0 | $0 | |
| Utilities | $100 | $100 | $100 | $100 | $100 | $100 | $100 | $100 | $100 | $100 | $100 | $100 | |
| Insurance | $150 | $150 | $150 | $150 | $150 | $150 | $150 | $150 | $150 | $150 | $150 | $150 | |
| Rent | $500 | $500 | $500 | $500 | $500 | $500 | $500 | $500 | $500 | $500 | $500 | $500 | |
| Payroll Taxes | 15% | $300 | $300 | $300 | $300 | $300 | $825 | $825 | $825 | $825 | $825 | $825 | $825 |
| Other | $0 | $0 | $0 | $0 | $0 | $0 | $0 | $0 | $0 | $0 | $0 | $0 | |
| Total Operating Expenses | $3,130 | $3,130 | $3,130 | $3,130 | $3,130 | $7,155 | $7,155 | $7,155 | $7,155 | $7,155 | $7,155 | $7,155 | |
| Profit Before Interest and Taxes | ($1,800) | ($1,135) | ($603) | $328 | $594 | ($2,899) | ($2,101) | ($1,702) | ($1,436) | ($372) | $27 | $559 | |
| EBITDA | ($1,720) | ($1,055) | ($523) | $408 | $674 | ($2,819) | ($2,021) | ($1,622) | ($1,356) | ($292) | $107 | $639 | |
| Interest Expense | $0 | $0 | $0 | $0 | $0 | $0 | $0 | $0 | $0 | $0 | $0 | $0 | |
| Taxes Incurred | $0 | $0 | $0 | $0 | $0 | $0 | $0 | $0 | $0 | $0 | $0 | $0 | |
| Net Profit | ($1,800) | ($1,135) | ($603) | $328 | $594 | ($2,899) | ($2,101) | ($1,702) | ($1,436) | ($372) | $27 | $559 | |
| Net Profit/Sales | -128.57% | -54.05% | -22.67% | 9.01% | 15.15% | -64.71% | -39.49% | -29.65% | -23.85% | -5.21% | 0.36% | 6.88% | |
| Pro Forma Cash Flow | |||||||||||||
| Month 1 | Month 2 | Month 3 | Month 4 | Month 5 | Month 6 | Month 7 | Month 8 | Month 9 | Month 10 | Month 11 | Month 12 | ||
| Cash Received | |||||||||||||
| Cash from Operations | |||||||||||||
| Cash Sales | $1,400 | $2,100 | $2,660 | $3,640 | $3,920 | $4,480 | $5,320 | $5,740 | $6,020 | $7,140 | $7,560 | $8,120 | |
| Subtotal Cash from Operations | $1,400 | $2,100 | $2,660 | $3,640 | $3,920 | $4,480 | $5,320 | $5,740 | $6,020 | $7,140 | $7,560 | $8,120 | |
| Additional Cash Received | |||||||||||||
| Sales Tax, VAT, HST/GST Received | 0.00% | $0 | $0 | $0 | $0 | $0 | $0 | $0 | $0 | $0 | $0 | $0 | $0 |
| New Current Borrowing | $0 | $0 | $0 | $0 | $0 | $0 | $0 | $0 | $0 | $0 | $0 | $0 | |
| New Other Liabilities (interest-free) | $0 | $0 | $0 | $0 | $0 | $0 | $0 | $0 | $0 | $0 | $0 | $0 | |
| New Long-term Liabilities | $0 | $0 | $0 | $0 | $0 | $0 | $0 | $0 | $0 | $0 | $0 | $0 | |
| Sales of Other Current Assets | $0 | $0 | $0 | $0 | $0 | $0 | $0 | $0 | $0 | $0 | $0 | $0 | |
| Sales of Long-term Assets | $0 | $0 | $0 | $0 | $0 | $0 | $0 | $0 | $0 | $0 | $0 | $0 | |
| New Investment Received | $0 | $0 | $0 | $0 | $0 | $0 | $0 | $0 | $0 | $0 | $0 | $0 | |
| Subtotal Cash Received | $1,400 | $2,100 | $2,660 | $3,640 | $3,920 | $4,480 | $5,320 | $5,740 | $6,020 | $7,140 | $7,560 | $8,120 | |
| Expenditures | Month 1 | Month 2 | Month 3 | Month 4 | Month 5 | Month 6 | Month 7 | Month 8 | Month 9 | Month 10 | Month 11 | Month 12 | |
| Expenditures from Operations | |||||||||||||
| Cash Spending | $2,000 | $2,000 | $2,000 | $2,000 | $2,000 | $5,500 | $5,500 | $5,500 | $5,500 | $5,500 | $5,500 | $5,500 | |
| Bill Payments | $37 | $1,121 | $1,156 | $1,185 | $1,232 | $1,264 | $1,800 | $1,842 | $1,862 | $1,878 | $1,933 | $1,954 | |
| Subtotal Spent on Operations | $2,037 | $3,121 | $3,156 | $3,185 | $3,232 | $6,764 | $7,300 | $7,342 | $7,362 | $7,378 | $7,433 | $7,454 | |
| Additional Cash Spent | |||||||||||||
| Sales Tax, VAT, HST/GST Paid Out | $0 | $0 | $0 | $0 | $0 | $0 | $0 | $0 | $0 | $0 | $0 | $0 | |
| Principal Repayment of Current Borrowing | $0 | $0 | $0 | $0 | $0 | $0 | $0 | $0 | $0 | $0 | $0 | $0 | |
| Other Liabilities Principal Repayment | $0 | $0 | $0 | $0 | $0 | $0 | $0 | $0 | $0 | $0 | $0 | $0 | |
| Long-term Liabilities Principal Repayment | $0 | $0 | $0 | $0 | $0 | $0 | $0 | $0 | $0 | $0 | $0 | $0 | |
| Purchase Other Current Assets | $0 | $0 | $0 | $0 | $0 | $0 | $0 | $0 | $0 | $0 | $0 | $0 | |
| Purchase Long-term Assets | $0 | $0 | $0 | $0 | $0 | $0 | $0 | $0 | $0 | $0 | $0 | $0 | |
| Dividends | $0 | $0 | $0 | $0 | $0 | $0 | $0 | $0 | $0 | $0 | $0 | $0 | |
| Subtotal Cash Spent | $2,037 | $3,121 | $3,156 | $3,185 | $3,232 | $6,764 | $7,300 | $7,342 | $7,362 | $7,378 | $7,433 | $7,454 | |
| Net Cash Flow | ($637) | ($1,021) | ($496) | $455 | $688 | ($2,284) | ($1,980) | ($1,602) | ($1,342) | ($238) | $127 | $666 | |
| Cash Balance | $9,413 | $8,392 | $7,896 | $8,351 | $9,038 | $6,754 | $4,774 | $3,172 | $1,829 | $1,592 | $1,719 | $2,385 | |
| Pro Forma Balance Sheet | |||||||||||||
| Month 1 | Month 2 | Month 3 | Month 4 | Month 5 | Month 6 | Month 7 | Month 8 | Month 9 | Month 10 | Month 11 | Month 12 | ||
| Assets | Starting Balances | ||||||||||||
| Current Assets | |||||||||||||
| Cash | $10,050 | $9,413 | $8,392 | $7,896 | $8,351 | $9,038 | $6,754 | $4,774 | $3,172 | $1,829 | $1,592 | $1,719 | $2,385 |
| Other Current Assets | $0 | $0 | $0 | $0 | $0 | $0 | $0 | $0 | $0 | $0 | $0 | $0 | $0 |
| Total Current Assets | $10,050 | $9,413 | $8,392 | $7,896 | $8,351 | $9,038 | $6,754 | $4,774 | $3,172 | $1,829 | $1,592 | $1,719 | $2,385 |
| Long-term Assets | |||||||||||||
| Long-term Assets | $4,800 | $4,800 | $4,800 | $4,800 | $4,800 | $4,800 | $4,800 | $4,800 | $4,800 | $4,800 | $4,800 | $4,800 | $4,800 |
| Accumulated Depreciation | $0 | $80 | $160 | $240 | $320 | $400 | $480 | $560 | $640 | $720 | $800 | $880 | $960 |
| Total Long-term Assets | $4,800 | $4,720 | $4,640 | $4,560 | $4,480 | $4,400 | $4,320 | $4,240 | $4,160 | $4,080 | $4,000 | $3,920 | $3,840 |
| Total Assets | $14,850 | $14,133 | $13,032 | $12,456 | $12,831 | $13,438 | $11,074 | $9,014 | $7,332 | $5,909 | $5,592 | $5,639 | $6,225 |
| Liabilities and Capital | Month 1 | Month 2 | Month 3 | Month 4 | Month 5 | Month 6 | Month 7 | Month 8 | Month 9 | Month 10 | Month 11 | Month 12 | |
| Current Liabilities | |||||||||||||
| Accounts Payable | $0 | $1,083 | $1,117 | $1,144 | $1,191 | $1,204 | $1,739 | $1,780 | $1,800 | $1,813 | $1,868 | $1,888 | $1,915 |
| Current Borrowing | $0 | $0 | $0 | $0 | $0 | $0 | $0 | $0 | $0 | $0 | $0 | $0 | $0 |
| Other Current Liabilities | $0 | $0 | $0 | $0 | $0 | $0 | $0 | $0 | $0 | $0 | $0 | $0 | $0 |
| Subtotal Current Liabilities | $0 | $1,083 | $1,117 | $1,144 | $1,191 | $1,204 | $1,739 | $1,780 | $1,800 | $1,813 | $1,868 | $1,888 | $1,915 |
| Long-term Liabilities | $0 | $0 | $0 | $0 | $0 | $0 | $0 | $0 | $0 | $0 | $0 | $0 | $0 |
| Total Liabilities | $0 | $1,083 | $1,117 | $1,144 | $1,191 | $1,204 | $1,739 | $1,780 | $1,800 | $1,813 | $1,868 | $1,888 | $1,915 |
| Paid-in Capital | $16,000 | $16,000 | $16,000 | $16,000 | $16,000 | $16,000 | $16,000 | $16,000 | $16,000 | $16,000 | $16,000 | $16,000 | $16,000 |
| Retained Earnings | ($1,150) | ($1,150) | ($1,150) | ($1,150) | ($1,150) | ($1,150) | ($1,150) | ($1,150) | ($1,150) | ($1,150) | ($1,150) | ($1,150) | ($1,150) |
| Earnings | $0 | ($1,800) | ($2,935) | ($3,538) | ($3,210) | ($2,616) | ($5,515) | ($7,616) | ($9,318) | ($10,754) | ($11,126) | ($11,099) | ($10,540) |
| Total Capital | $14,850 | $13,050 | $11,915 | $11,312 | $11,640 | $12,234 | $9,335 | $7,234 | $5,532 | $4,096 | $3,724 | $3,751 | $4,310 |
| Total Liabilities and Capital | $14,850 | $14,133 | $13,032 | $12,456 | $12,831 | $13,438 | $11,074 | $9,014 | $7,332 | $5,909 | $5,592 | $5,639 | $6,225 |
| Net Worth | $14,850 | $13,050 | $11,915 | $11,312 | $11,640 | $12,234 | $9,335 | $7,234 | $5,532 | $4,096 | $3,724 | $3,751 | $4,310 |


