
Houses on the Lake
Executive Summary
Houses On The Lake will create a competitive business model for vacation houseboat rental on Lake Shasta in Northern California. Rather than purchasing houseboats, the business will offer rentals to families and young couples of small (up to 6 persons) houseboats on loan from existing owners. The business will offer vacationers other services to compete with luxury vacation houseboat companies and moorage and revenue sharing for existing owners. The business must acquire loans to launch.
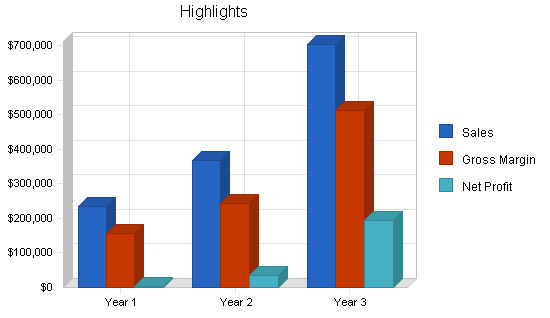
The business will become profitable in its second year and quite profitable in its third, as the owner and founder, Robert Hopkins, expands the offering from three to eight houseboats. Rental rates will be on the low end for the market, starting at around $600 for 3 days during an off season.
Objectives
Houses On The Lake will launch its business with three vacation houseboats. Over the first three years, Houses On The Lake has the following objectives:
- Rent land for marina and marina facilities
- Create a pool of eight houseboats from current owners interested in renting them out
- Steadily increase revenues each year
- Achieve a 50% retention rate of customers from year 2 to year 3
Mission
Houses On The Lake will offer competitively priced vacation houseboat rentals oriented for families and couples to enjoy Lake Shasta, California. The business will seek to offer families and couples the balance of relaxation and excitement they seek by providing options for activities to suit both individuals and groups.
Keys to Success
Keys to success in the vacation houseboat business include:
- Impeccable upkeep of the rental boats to maintain the luxury of the accommodations
- A wide variety of activities and services to promote and suggest to families
- Seasonal pricing to encourage year-round utilization of the boats
Company Summary
Houses On The Lake offers vacation-houseboat rentals on Lake Shasta, California to large families and groups of families. The business was incorporated in 2009 and will launch in 2010 upon funding. Houses On The Lake was founded by Robert Hopkins, a previous bed and breakfast owner who relocated to California after twenty years running his business in Vermont.
Company Ownership
Robert Hopkins established Houses On The Lake as an LLC. Robert will retain 100% of the company and will receive a loan to make up additional required capital.
Start-up Summary
Houses On The Lake will invest in the establishment of an office/small store at an existing marina (for light renovations, adding signage, office equipment and furniture, setting up Internet and phone, shelves and displays) and for the purchase of three ski boats ($5,000 each). The marina where Houses On The Lake will set up will have docking space for 3 houseboats and the 3 ski boats, courtesy ramps, gas and ice, and other basic facilities.
Legal and Permits includes legal consultation for the business and related to financing agreements, building permits from local authorities and the US Forest Service, a business license, and motor vehicle rental permits.
Rent is for the marina space for one month of set-up before launch at $1000 per month. The security deposit of one month is part of current assets.
Insurance will be liability both for the marina usage and the boats when in use by Houses On The Lake renters. To limit liability, the renter (captain) must be at least 25 years of age and have a valid driver’s license.
The website, brochure, and advertisements will be detailed in the marketing strategy section and Web plan.
Houseboats will not be purchased, but will be provided by current owners under contract with Houses On The Lake to provide use of the boats for up to 90% of the year, including some use during peak periods. These owners are provided with a share of revenue as well as moorage and maintenance on their boats.
The cash required will see the business through the first year’s losses until it has achieved the scale needed to support itself with positive cash flows.

Services
The standard House On The Lake houseboat will vary in its amenities, as it will be used under contract from an owner and not purchased new. The type of houseboat sought out will include the following features:
- Sleeps a total of 6, with at least one private room
- 1 full bathroom
- Fully equipped kitchen (refrigerator, freezer, range/oven, etc.)
- Central air and heat
- Gas barbecue
- Generator
The Houses On The Lake marina will offer:
- Ski boats
- Gas and ice (through existing marina facilities)
- Small convenience store within the office facility (sells bait and tackle, other basic items)
- Moorage and courtesy docks
- Launch ramp
Basic rental rates will depend on the specifications of a specific boat and the season:
Summer Season (June 1 – August 31)
- Weekly – $1650
- 4 Days – $1400
- 3 Days – $1200
Spring/Fall Seasons (May and September)
- Weekly – $1400
- 4 Days – $1200
- 3 Days – $1000
Off Season (October 1 to April 30)
- Weekly – $1100
- 4 Days – $650
- 3 Days – $600
Seasonal rates are based on peak usage times at Lake Shasta. Prices are competitive with other small houseboat rentals on Lake Shasta.
Services for houseboat owners include:
- Renting out the boat when it is not in use by the owner to create an additional revenue stream
- Providing basic maintenance and upkeep of the boat (basic standards must be met by the houseboat owner)
- Providing insurance and proper licensing to rent out the boat legally and limit the owner’s liability
- Scheduling commercial vehicle inspections as required by the state
- Providing moorage for the boat
Market Analysis Summary
The U.S. vacation houseboat market includes vacationers who are both local and from afar, including other countries. Renters are interested in rental periods of up to a week and use the houseboat to travel within inland lakes for activities both on the boat and in the surrounding area.
The market is primarily segmented by age and family status, as these different groups have different preferences when looking at vacation houseboats. These groups are broken into younger couples, older couples, and families. Single individuals are generally not interested in renting houseboats. The most economical houseboat rentals sleep 14 to 18 or more individuals and are rented by 2, 3, or 4 families at a time (or up to 9 pairs of couples). Generally, these families organize themselves into groups and plan vacations together, although some services assist with matching groups to share rentals.
Research and Markets writes that “vacation rentals represent a more than $24 billion opportunity in the US – that’s more than one fifth of all hotel room revenue and 8% of the total US travel market. And vacation rental consumers are a market to covet. They’re well-off, well-educated, and they travel – a lot. Nine in 10 take at least four leisure trips a year.”
The market discussed is based on vacationers to Northern California. However, vacationers who do not travel to Northern California or consider houseboats an option can be converted through exposure to Houses On The Lake’s marketing and collective marketing for the industry. The estimated growth rates given show this expected growth in Northern California vacationers over the next few years. Due to an aging population, the market for older couples is expected to grow faster than other segments.

Market Segmentation
The key market segments for houseboat rentals are described more fully below:
Young Couples: Aged 21 to 39, young couples without children look for romantic getaways as well as high-energy activities (ski boats, hiking, diving, etc.). While some may be wealthy enough to rent a luxurious houseboat with all the extras, many have to stretch to rent a basic houseboat. It is more difficult for these young couples to put together a group large enough to afford a large houseboat, but they may be able to use smaller houseboats with fewer amenities.
Older Couples: Aged 40 and up, although some within this age bracket will still be very active and self-identify with young couples, older couples without children look for romance and relaxation. They seek quieter activities such as fishing, light hiking, etc. Some cannot use a boat that requires a great deal of physical exertion to operate.
Families: Couples or individuals with children. They require a mix of relaxation for parents and high-energy activities for children. They may also require creature comforts for the children, such as entertainment centers, which couples can do without on a vacation. Sometimes a few large families band together to rent a large houseboat. Other families are less inclined to do this and more interested in being alone with their nuclear unit.

Target Market Segment Strategy
Houses On The Lake will focus specifically on families with children and young couples at the lower end of the market. With each boat sleeping up to 6, a couple or family will be very comfortable on these boats. By avoiding the market for older couples, there is more leeway as to the type of boat that can be rented and marketing can be more focused. Also, by offering only houseboats on the smaller side (compared to those that sleep 14 to 18) the business can better stand out among the options for houseboat rentals on Lake Shasta. Offering lower price rentals without luxurious accommodations means that costs can be limited as well.
Service Business Analysis
The vacation houseboat rental industry is comprised of hundreds of independent businesses in the United States, as well as owners of individual boats who rent out their boat for weeks without meeting the state requirements for commercial vehicles. Legal vacation houseboat businesses include those which own their own boats and those which create networks of independent owners and rent out those boats when they are not reserved for their owner’s use. These boats are checked to meet the state’s safety requirements and carry proper insurance to cover their use.
Research and Markets writes in January, 2009 that “the majority of bookings are done the old-fashioned way, at a time when nearly $100 billion in leisure travel will be booked online in 2008. Many property managers have yet to leverage the emerging business models, technologies and services that are spurring change.” That is to say that Web services and bookings are still not prevalent in the industry. Most rentals are made over the phone, even if the customer first learns about the business on the Internet.
Competitors in the Lake Shasta region include:
- Shasta Marina Resort: Offering ski boats, and three 14 or 16 sleeper houseboats, they offer dock hands and full services. Marketing for their business focuses on a mix of older groups, twenty-somethings, and children.
- Antlers Resort and Marina: Offers 8 houseboats, cabin rentals, and other watercraft. The business is forty years old and is the largest of the small resorts on Lake Shasta.
- Holiday Harbor: Also offers 7 houseboats, toy rentals, camping & RVs. Offers much the same information on its website as the others, with little differentiation.
Competition and Buying Patterns
The vacation houseboat industry is an asset-intensive business for some players who must purchase expensive houseboats and set up marinas to serve them. However, small players can enter the market with just one boat or by managing the rentals for existing owners. With reduced barriers to entry, an opportunity exists for boat rentals at the low end of the market.
When choosing a vacation houseboat, vacationers look at the following:
- Location: Most vacationers will choose the geographic area they intend to visit first and then look at the houseboat rental companies available there. They will generally not be swayed to a different geographic area based on the company.
- Availability and promotion of appropriate activities: Families and couples are all looking for rental companies which make activities easy to find and take part in, either by providing them directly or providing resources and help to access those activities.
- Boat amenities: For customers at the high end of the market, luxurious accommodations and creature comforts on the boats are extremely important. For those new to the market, “roughing it” somewhat is more important. It is the latter group which Houses On The Lake will focus on.
- Price: For customers at the lower end of the market, price is more important than amenities. For most groups, houseboat rentals can be much less expensive than hotel accommodations for the same sized group. Like cruise tickets, houseboat rentals can offer some luxury at prices which most vacationing Americans find reasonable, assuming they can assemble a group of enough passengers for the boat.
Web Plan Summary
The website for Houses On The Lake will offer a great deal of information both for potential renters/vacationers and for houseboat owners interested in supplying their houseboats to the company. The site will inform these parties about the offering of Houses On The Lake and availability of boats and allow them to move forward by using a simple reservation form to make reservations online.
Website Marketing Strategy
The website will target young couples and families interested in Lake Shasta vacations and current houseboat owners on Lake Shasta. The site will be marketed through the following tactics:
- Banner ads on travel-related websites
- Google AdWords text ads
- Listing in houseboat rental databases for Lake Shasta
- Search engine optimization undertaken by the initial Web developer and an ongoing SEO firm
Development Requirements
The website will provide the following information:
- Services offered by Houses On The Lake for renters (descriptions and photos)
- Basic Rates
- Activities on Lake Shasta (links, photos and more information)
- Contact information (email only as phone is withheld to reduce time spent on phone by Hopkins)
- About Us – Robert Hopkins background, business values, vision
- Services for houseboat owners (moorage, revenue sharing, maintenance, etc.)
- Policies and procedures for rental
- FAQs – How to pack, details on other rules, etc.
- Availability Calendar (updated by Robert Hopkins as rentals are entered into and owners reserve the boats)
- Reservation request form (with credit card payment)
All copy will be produced by Robert Hopkins and the coding and design of the website will be through a Web design firm for $5,000.
Strategy and Implementation Summary
The basic strategy for Houses On The Lake is to target families and young couples interested in small, private houseboats on the inexpensive side for Lake Shasta. The business will offer additional activities and recommendations, but will be perfect for vacationers who can do without some creature comforts as they enjoy Lake Shasta.
Key elements of the strategy implementation include:
- Website advertising
- Awareness of and relationships with travel agents who will be offered discounted rates to bundle with packages for their clients
- Reaching houseboat owners whose houseboats are not in use 90% of the time.
Competitive Edge
Houses On The Lake has a competitive edge in the hospitality experience of Robert Hopkins, who can bring the experience of an upscale bed and breakfast to his vacation houseboat business. This will be manifested in the marketing, sales experience, and operations of the business. The effect of this edge will be a high customer retention rate. Customers who think of the houseboat as “their” house on Lake Shasta will return to Lake Shasta, allowing marketing and sales efforts to be reduced due to the lower expense of keeping an existing customer than finding new ones. This will build the customer retention rate to 50% from the second to third full years of operation.
Marketing Strategy
Marketing for Houses On The Lake will focus in on the target markets of families and young couples. Materials will show families and couples having fun together, both together and in separate activities (waterskiing, fishing, slides, hiking, camping, swimming, using the spa, etc). Upon the launch, images will be provided by the manufacturers of the houseboats and other sources, as they will not yet be photos of actual customers using Houses On The Lake.
Marketing will include:
- Local advertising in California vacation and travel magazines
- Website creation and promotion (see Web plan)
- Direct mail to travel agents across the U.S. and Northern California tourism
- Partnerships with travel agents. These will be sought over time, not expected until year 3 or later
The marketing to vacationers will also be seen by owners, alerting them to this opportunity to rent out their boats.
Sales Strategy
Houses On The Lake’s sales will be managed entirely by Robert Hopkins. He will receive reservation requests from interested customers, approve them by email, respond by phone to answer specific questions raised, and pursue business through partnerships with travel agents. This will include offering a discount to travel agents so they can bundle the rentals with travel packages to their customers. Sales will depend in large part on the online reservation request form to close business. The website will prepare customers with a great deal of information so they are better informed before reserving.
As an owner, Robert Hopkins will be paid a base salary and compensated for sales through the profits of the business. He will have the authority to vary from the advertised prices, but will use this at his discretion to book dates which are unlikely to be used otherwise (i.e., off season or last-minute bookings). Special higher rates for holidays and certain weekends in the spring, summer, and fall are expected to balance out these discounted dates. He will update the rates offered on the website and the availability calendar as needed.
An additional sales strategy exists to establish relationships with houseboat owners. Robert Hopkins will contact owners directly to advertise the services of Houses On The Lake to these “suppliers.” This work will begin well before the business’s launch in order to have a roster of at least three houseboats to rent for the first year.
Sales Forecast
The business will seek to launch in October, to allow a full winter to promote the upcoming summer rental period.
In the first year of operation, the average price for a week-long summer rental will be $1650, $1400, for a spring/fall rental, and $1100 for an off season rental. Rentals for fewer days are available at a lower price. Additional fees and services purchased are estimated to average $400 for summer rentals, $300 for spring/fall, and $200 for off-season. These additional fees include ski boat rentals, convenience store purchases, added fees to bring pets on-board. The prices listed reflect these totals and will be increased roughly with inflation in future years.
Direct cost of sales includes post-rental cleaning (generally $75 per houseboat) and basic amenities (shampoo, soap, tissue paper, etc.) to stock the boats for each rental ($25 per rental). These costs are expected to grow with inflation as well. Other costs of sales include gas and ice which is anticipated to cost 8% of sales as each rental will start with a boat fully stocked with both. An additional 20% of sales will be payment to the houseboat owners. This cost of sales would be higher, but houseboat owners will benefit from free moorage, maintenance, and discounted services at the Houses On The Lake marina.


Milestones
The milestones table illustrates the key marketing activities around the launch of the business. Before the business officially opens in October 2010, the marketing campaign will begin with the development of the website, brochure, and print ads. Internet advertising, direct mail, and the running of those print ads will occur after October 2010.

Management Summary
Houses On The Lake will be directed and managed by Robert Hopkins. He will be personally responsible for sales and marketing (working with designers where necessary), provide all copy for ads, the website, and brochures, and the launch of the business. Robert will sell additional services to renters who arrive and personally greet them all to find out how he can help them with recommendations.
Hopkins will also run operations. Specifically, he will run the marina, provide renter orientations and support, schedule and supervise boat cleanings by a contracted cleaning service, repair, and maintenance. He will establish operations procedures and renter policies and procedures.
Hopkins will work out of the office at the marina which will be equipped with a phone, computer with Internet, cash register, and credit card reader.
Personnel Plan
Boating assistants will be hired for the second summer. Before that point, Hopkins will fulfill their role of supporting the renters during their stays. One boating assistant will be brought on for the second summer and two for the third summer. The boating assistants will not work year-round, but will work from June to August to handle the peak season.
Financial Plan
The business is expected to grow through additional relationships with houseboat owners. These relationships do not require investments of capital, just the work of Robert Hopkins. The business will grow from three boats offered in the first year to eight offered in the third year. This can be done without expanding the marina, as these will all be relatively small boats.
Start-up Funding
Robert Hopkins will provide the bulk of the equity investment from the proceeds of the sale of his bed and breakfast business. Credit cards will provide a small amount of current borrowing. Additionally, a three-year loan will be taken out for the remaining required financing.
Important Assumptions
For the purpose of simplifying projections, Houses On The Lake projects that an average rental length will be a four-day period and that the houseboats will be filled with an average of three individuals per boat.
Break-even Analysis
An average of 11 four-week rentals is projected to produce the monthly break even revenue per month. At first this will be difficult with three boats in the off season, although it will be possible once the first summer arrives.

Projected Profit and Loss
Gross margins will improve in the summers and in future years as cost of sales are a lower rate during summer when rates and prices are higher.
Print marketing includes additional brochure printing and press kits for travel agents as needed. Marketing will increase as efforts intensify to market an increased number of boats and to market to owners.
Depreciation is for the depreciable assets of the marina (~$25,000) over a five year period.
Website marketing includes $1000 per month for ongoing search engine marketing, $750 per month for search engine optimization, and $250 per month for website hosting and maintenance.
Rent is set at $2,000 per month and utilities (electricity, phone, Internet for the office/store space) at $150 per month in the first year. Rent will increase based on increased space for moorage of boats at the marina.
Payroll burden includes payroll taxes and insurance/benefits for employees.
Office and boat maintenance covers light maintenance of the office/store and boats and general supplies.
Most costs are expected to rise at least with inflation.
Based on these projections, the business will have a loss in the first year and move to profit in the second, with significant profit in the third for Hopkins as the number of boats under management increases.


Projected Cash Flow
The business will continue to invest in some equipment for the marina in years 2 and 3 ($5000 per year). The business loan will be repaid over three years with 10% interest. Dividends can be paid to the owner starting in the third year and will be withdrawn with the goal of keeping approximately $40,000 in cash in the business to see it through off season months and to fund needs for renovation or repair to the marina or boats as needed. The credit card borrowing will be paid off over the first year.

Projected Balance Sheet
The business will not be asset-intensive, as shown, as the houseboats themselves will be used through contract and revenue sharing with their owners. The office furnishings and the ski boats are the main assets of the business, and could be sold if the business folded. The liabilities of the business will decrease as the debts are paid off, improving the net worth of the business.
Business Ratios
The ratios for Houses On The Lake are compared here to those for the Recreational Goods Rental – Houseboat Rental industry; NAICS code 532292/SIC code 7999, for businesses with less than $500,000 in sales. The gross margins for the business will not be as high as industry averages due to the revenue sharing that the Houses On The Lake business model requires with the boat owners. This also leads to a much reduced level of assets in the business.

