
Ereidi Farm
Executive Summary
The Company
Ereidi Farm began as a home-based part-time endeavor while the owner raised her young child. Her many years in the industry made her well suited for the services offered by the farm. Ereidi Farm functions as a quality thoroughbred breeding and training farm specializing in highly individualized care programs designed for each horse’s needs. Ereidi Farm has always focused on its clients and their equine investments and genuinely enjoys assisting clients.
Our committment to our clients is long term, our focus has never ended at the point of sale – we are absolutely committed to the success of our clients and we go above and beyond the normal practices when providing our clients with all the information they require to make knowledgeable, informed decisions concerning their bloodstock investments. Due to the demand for our services, our farm is planning on relocating to a larger facility and is now in the process of incorporating to better facilitate the accounting end of the business management.
The Product
Ereidi Farm provides the following services to its market: breaking and training of young racehorses, broodmare care, and rehabilitative care for injured racehorses. Our programs are individualized and no horse is pushed through a program just to get the job done. Horses graduating from our programs are confident, fit, healthy and relaxed about the work, they are winners!! We offer exceptional care for pregnant and foaling mares. We will except high-risk mares – our farm has had a 100% live foal ratio every single year despite foaling out older and problem mares, we take very good care of these special ladies! Our rehabilitative services have horses from all states of the region arriving at our farm for post-operative work and therapy.
The thoroughness of our care insures that these athletes recover completely with minimal complications. All of the horses rehabilitated by the farm have gone on to useful careers, many returning to racing and running in improved form. Our home-grown sales reflect the owner’s knowledge of equine genetics; horses from the farm’s breeding program have won races at their very first asking and have posted bullet works in training. They are bright stars and have done a fabulous job representing the farm and their owners. Most importantly we provide “Full Circle” service for our clients. Our committment to their success is long lasting and at a depth not found in the racing community at large. Their success is our success and we are deeply aware of this need within the industry.
The Market
The thoroughbred industry continues to grow in the United States. The racing industry within the state of Pennsylvania is poised for an explosive period of growth within the next year as slot machine legislation is approved and passed. The demand for Pennsylvania-bred horses is on the rise as is the need to raise and train these individuals. Pennsylvania is focused on becoming the premier racing state in the country, surpassing all other states in its purse and bonus monies awards, this is attracting large numbers of horses to Pennsylvania and the need for facilities to house them is growing rapidly.
This growth, coupled with the deterioration of traditionally strong racing state programs has caused a flurry of activity as owners of breeding and racing stock within these declining states seek to relocate their investments. We have targeted these owners as well as brand new investors and Pennsylvania owners looking to upgrade their programs as clients for our expanded farm. Our marketing programs are focused on promoting using the venues that are commonly used by those in our target market. These programs are designed to bring potential clients to our farm, the location where sales are most frequently completed. We realize that technology is absolutely necessary in today’s markets and we have embraced its use happily and with success.
Financial Projections
Our farm has started out small for specific reasons, we are now looking forward to an expansion that will allow us to utilize all of our skills. The owner’s husband is currently the parts and service director at his place of business, responsible for $13.3 million dollars of parts and service sales annually and maintaining a large inventory. He has 65 employees reporting to him. He will be mentoring the owner on the financials.
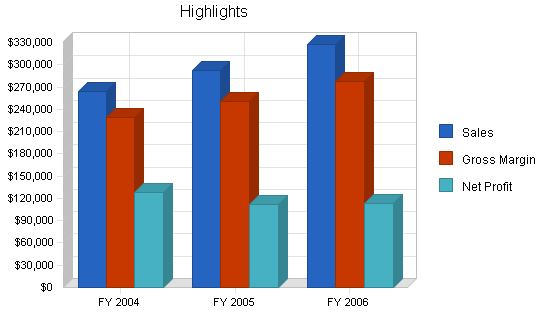
In summary, the financial projections represent the growth that will occur upon the relocation of the farm to its new world class facility. They represent the planned growth that is possible with the securing of a facility that is large enough to accommodate the ever-growing needs of the marketplace. We expect profits for two reasons: 1) we are timing our market expansion at a critical time, just as the Pennsylvania thoroughbred industry enters its largest growth phase in its history and 2) our services to clients and their bloodstock is exceptional, it is simply world class.
1.1 Keys to Success
A well-targeted marketing plan utilizing modern technologies as well as traditional formats.
Providing a quality facility that is attractive to our clients.
Following through on delivering the quality of service that our marketing and facility images promise. Ereidi Farm has built its reputation by exceeding our client’s expectations. Our attention to detail and our commitment to our clients remains unsurpassed within the industry.
1.2 Mission
The purpose of Ereidi Farm is to increase our clients’ opportunities for successful thoroughbred investment by providing word class quality, individualized care and training programs at a safe facility which is staffed by caring, experienced personnel. Everyone at Ereidi Farm has a deep commitment to our clients. We believe that constant communication, unquestionable integrity and our ability to provide “Full Circle” services are the hallmarks of the success and growth of our farm.
1.3 Objectives
- Secure financing to purchase a turn-key facility that is located on a parcel of land in a developing area. The facility must represent real value, selling for less than its cost to build and having a location that is targeted for long-term growth and development, thus increasing the value of the land.
Land parcel must be suitable for other uses than farming to provide long-term development options. Interstate access, both locally and regionally must be excellent. Land must be located in an area that has required support structures in place suitable to a horse farm. - Close sale on current farm facility to generate approximately $300,000 of capital to reinvest into business expansion.
- Achieve break-even status within one year of relocating to the larger facility.
- Maintain a comfortable net profit into the second and third years.
Company Summary
Ereidi Farm, Inc. is a subchapter S corporation (incorporation is in progress at this time) currently located in Schwenksville, Pennsylvania. Ereidi Farm began as a part-time business when its owner’s only child was a toddler. Ereidi Farm’s owner has worked within the horse industry for over twenty years and the services offered by the farm are in high demand.

Due to changes in Pennsylvania’s thoroughbred racing program, the demand for quality services has escalated dramatically. After the planned purchase of our new facility is complete, we will relocate to Pine Grove, Pennsylvania. The farm offers exceptional “Full Circle” services to owners and breeders of thoroughbred bloodstock. Our specialty is our highly individualized training and care programs with a strong focus on client communications and education. We are committed to the success of our clients’ thoroughbred investments and go above and beyond the normal requirements to secure the best opportunities for our clients and their horses.
2.1 Company Ownership
Ereidi Farm was formed as a sole proprietorship by its current owner, Heidi Trimbur. Current growth patterns of the farm have made it prudent to incorporate and its new subchapter S corporation status is now pending. The business remains a private entity, held by its owner.
2.2 Company History
The owner of Ereidi Farm, in addition to being formally educated in equine science and management, has worked within the equine industry for over 20 years. Ereidi Farm was officially formed as a thoroughbred facility three years ago. The farm, despite being a part-time venture at start-up, as the owner’s child was a toddler, held close to the break-even point in its first year.
Second year sales were directly affected by the events of September 11, 2001 as the Fall yearling thoroughbred sales began on September 10th of that year. Despite this loss, Ereidi Farm came back strong in 2002, generating a profit and sales have been profitable in 2003 with the farm’s largest sales quarter in the Fall.
The need for expansion has become obvious as the farm has had to turn clients away due to lack of space at its current location. With the pending growth of Pennsylvania’s thoroughbred industry poised to enter an extremely lucrative period, expansion strategy and its timing have become top priorities of the farm.
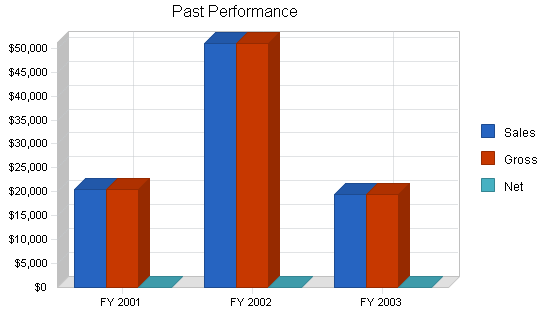
| Past Performance | |||
| FY 2001 | FY 2002 | FY 2003 | |
| Sales | $20,485 | $50,905 | $19,347 |
| Gross Margin | $20,485 | $50,905 | $19,347 |
| Gross Margin % | 100.00% | 100.00% | 100.00% |
| Operating Expenses | $35,144 | $45,863 | $17,000 |
| Collection Period (days) | 0 | 0 | 0 |
| Balance Sheet | |||
| FY 2001 | FY 2002 | FY 2003 | |
| Current Assets | |||
| Cash | $2,000 | $9,192 | $3,282 |
| Accounts Receivable | $0 | $0 | $12,937 |
| Other Current Assets | $79,300 | $85,485 | $87,684 |
| Total Current Assets | $81,300 | $94,677 | $103,903 |
| Long-term Assets | |||
| Long-term Assets | $480,000 | $480,000 | $490,000 |
| Accumulated Depreciation | $5,815 | $5,616 | $2,800 |
| Total Long-term Assets | $474,185 | $474,384 | $487,200 |
| Total Assets | $555,485 | $569,061 | $591,103 |
| Current Liabilities | |||
| Accounts Payable | $0 | $0 | $0 |
| Current Borrowing | $0 | $4,300 | $13,000 |
| Other Current Liabilities (interest free) | $0 | $0 | $0 |
| Total Current Liabilities | $0 | $4,300 | $13,000 |
| Long-term Liabilities | $200,000 | $195,000 | $193,000 |
| Total Liabilities | $200,000 | $199,300 | $206,000 |
| Paid-in Capital | $0 | $0 | $0 |
| Retained Earnings | $355,485 | $369,761 | $385,103 |
| Earnings | $0 | $0 | $0 |
| Total Capital | $355,485 | $369,761 | $385,103 |
| Total Capital and Liabilities | $555,485 | $569,061 | $591,103 |
| Other Inputs | |||
| Payment Days | 0 | 0 | 0 |
| Sales on Credit | $0 | $0 | $0 |
| Receivables Turnover | 0.00 | 0.00 | 0.00 |
Services
Ereidi Farm specializes in providing highly individualized services to the thoroughbred racehorse industry. These services include breaking and training of youngsters with a personalized, non-production line type of focus; broodmare management and foaling, we specialize in high-risk pregnancies and older mares; boarding for youngsters with daily attention and handling; and intensive care, post-operative rehabilitative service for recovering race horses.
Ereidi Farm breeds and sells a few quality Pennsylvania-bred foals per year and offers consulting and genetic services for those new to the industry and/or developing their own breeding programs.
Market Analysis Summary
Ereidi Farm’s largest market segment will be owners of quality thoroughbreds who do not reside in Pennsylvania. As racing purses and breeding fund monies begin or continue to decline in several traditionally strong racing states, owners are searching for more profitable venues in which to place their horses. This coupled with the anticipated growth in purse and bonus monies available to Pennsylvania-breds and in Pennsylvania races, has made this state an attractive possibility for owners relocating their bloodstock to more lucrative markets.
This trend is beginning to reveal itself in statistical data. Pennsylvania has increased its U.S. Foal Crop share (2.7%) and is now in the top ten of all producing states. The average stallion book size has also increased and Pennsylvania now is ranked in the top ten for stallion book size. Top ten states posting a decrease include: California, Texas, Maryland, Oklahoma and Illinois, indicating declines in their racing programs. Neighboring New Jersey has also posted a decline (-38.1%) reflecting the health of the industry within its borders. Ereidi Farm has received many requests for boarding and foaling services from residents of Maryland and New Jersey reflecting the need of residents from these states to relocate their thoroughbred operations.
Research indicates that today’s thoroughbred owner is most likely to fit the following profile: male (special note: women thoroughbred investors are on the rise although they usually invest in ownership through partnerships); average age is 45+, lower than previous years supporting overall national salary statistics and many more owners are pooling their resources and forming partnerships; income in excess of $90,500 per year; is a knowledgeable investor and takes a business approach to thoroughbred investing; focus is on quality not quantity and understands and expects to pay for better quality services; over 80% utilize the Internet and its resources.
Pennsylvania provides great opportunity for new or migrating investors as our state’s historical position of thoroughbred production and racing has been one of “low end” quality. These facts make Pennsylvania an opportunity zone for those with quality bloodstock programs and for those who can offer quality services and facilities to accommodate incoming horses.
4.1 Market Segmentation
Ereidi Farm has targeted the following markets for its growth strategy:
- Potential clients who are currently breeding and racing their horses in states with declining racing and breeding programs. These clients are not only looking to relocate, they are used to spending more per horse than the traditional Pennsylvania thoroughbred owner. States with declining racing programs will have declining Foal Crop share percentages as owners relocate their mares to more lucrative states.
Declining US Foal Crop share is present in: California (-26.6%), Texas (-12.4%), Louisiana (-19.0%), Maryland (-35.8%), Oklahoma (-39.6%), Illinois (-35.4%), New Jersey (-38.1%), Virginia (-32.9%). These figures correspond directly to overall racing programs and conditions within each of these states. Thoroughbred owners within these states have been specifically targeted by Ereidi Farm. - Pennsylvania thoroughbred owners who are looking to upgrade the quality of their racing and breeding programs. Small owners who fail to upgrade their programs within the state will get squeezed out by incoming competition, upgrading will become key to staying in business.
Pennsylvania has begun to prepare for the upgrading that slot machines will have on racing purses within the state by bringing in new, better quality stallions. Pennsylvania is now in the top ten for Distribution of Active Stallions and Mares Bred, standing 103 stallions in 2002, breeding 1,009 mares in 2002 posting an average book size of 9.8% (increasing from 2001’s 8.5%). - New thoroughbred investors/partnerships represent great opportunities and investors are comparing state programs. Pennsylvania scores high posting not only increasing purse monies but also substantial owner/breeder/stallion owner awards. The breeder of any registered Pennsylvania-bred foal earns 20% to 30% (depending on state stallion stands in) residual income from the bonus program if a foal finishes first through third in any Pennsylvania race, not including stakes races.
The owner of the horse at the time of racing is eligible for an additional 40% in bonus awards and the stallion owner (if a registered Pennsylvania stallion) receives a 10% bonus – all residual income! Ereidi Farm will specifically market to non-thoroughbred owners with incomes in excess of $90,500 who are professionals with investment backgrounds. We have attracted several new clients this way including non-U.S. residents.
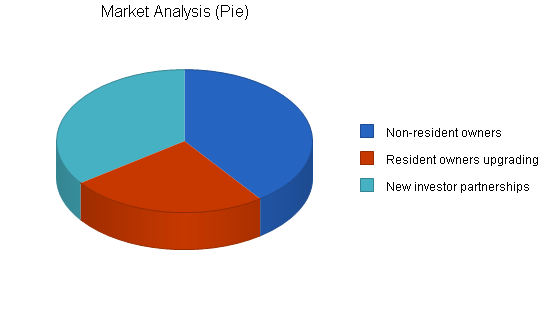
| Market Analysis | |||||||
| 2003 | 2004 | 2005 | 2006 | 2007 | |||
| Potential Customers | Growth | CAGR | |||||
| Non-resident owners | 65% | 56,211 | 92,748 | 153,034 | 252,506 | 416,635 | 65.00% |
| Resident owners upgrading | 32% | 35,132 | 46,374 | 61,214 | 80,802 | 106,659 | 32.00% |
| New investor partnerships | 26% | 49,185 | 61,973 | 78,086 | 98,388 | 123,969 | 26.00% |
| Total | 46.50% | 140,528 | 201,095 | 292,334 | 431,696 | 647,263 | 46.50% |
4.2 Target Market Segment Strategy
Ereidi Farm provides a high-end type of quality and service within our industry, it is therefore imperative that we define, locate and attract clients who have the funds available in which to purchase our services. Understanding the historical flow of regional racing is important to client recruiting.
The better regional racing stables traditionally raced on the New York, New Jersey and Maryland circuit. Horse that could not win in these states were shipped to the “low-end” racing circuits (i.e., smaller purse sizes) of Pennsylvania and West Virginia. Because horses racing in these “low-end” states did not earn as much money, their owners did not have the means to pay higher prices for services, hence most farms in Pennsylvania (there are some exceptions) focus on price before quality and rely on quantity numbering to reach their quotas.
As our standards for acceptable care are quite different from the traditional Pennsylvania farm, it was most important to define and locate clients who would meet our defined “ideal client” profile. Our clients are well-educated professionals, they utilize Internet resources to stay current with industry changes and trends. They expect outstanding service and are willing to pay for it.
Upon securing financing for our expansion, Ereidi Farm is prepared to roll out its marketing campaign. We will target our client base through the use of: Internet advertising of sites frequently visited by our clients, our website, print advertising in selected magazines and national newspapers, industry sales, seminars and trade shows, business-to-business contacts, organizational memberships and open houses at our facility.
4.3 Service Business Analysis
The thoroughbred industry in the United States is the largest in the world, offering 55,127 yearly races (2001). Japan is ranked second with 23,820 races and Australia third with 21,218 races. Thoroughbred racing as an entertainment choice is growing. Pari-mutual handle on thoroughbred racing in the United States topped $15 billion for the first time last year according to the statistics contained in the 13th edition of The Jockey Club Fact Book released 02/07/03. Handle on U.S. races in 2002 reached $15,062,131,835. (including separate pool first reported in 2000), an increase of 3.5% against 2001. This marked the ninth consecutive year of growth in handle.
U.S. purses, meanwhile, advanced 0.6% in 2002 to $1,074,247,738. The bulk of the increase was derived from states whose tracks offer expanded forms of gaming, namely Delaware, Louisiana, New Mexico and West Virginia. Pennsylvania will join this list upon the passing of current slot machine legislation and its purse sizes will increase as will the number of thoroughbreds racing for the increased purse offerings.
In addition to purse offerings, owners and breeders have another source of income and this income is residual. The Pennsylvania Horse Breeders Association (www.pabred.com) manages the Pennsylvania Breeding Fund Program. This program distributes more money, on a per foal basis, than nearly every other state-bred program now in operation. Currently, it distributes approximately $9.5 million annually with specific percentages being awarded to owners, breeders and stallion owners.
These specific percentages are awarded to the human connections of the horses finishing first, second or third in Pennsylvania races. The criteria for qualifying for these residual income awards are simply that the horse must be a registered Pennsylvania-bred foal. To be a registered Pennsylvania-bred foal, a mare must foal in the state of Pennsylvania and meet residency requirements. This has increased the demand for quality foaling and boarding facilities within the state. Awards are based off of percentages from purse monies earned and they are a very attractive incentive to draw clients from outside of Pennsylvania.
Pennsylvania racing is poised for a lucrative and dramatic growth period, smart investors are positioning themselves within the state, preparing to capitalize on the new purse structure that slot machines will provide. This has already lead to a shortage of stall space at tracks and farms throughout the state as well as increased demand for quality services and programs.
Ereidi Farm realizes that market entry into any expanding market is always time critical, it is our intention to be properly positioned to absorb the expanding growth as it occurs within our state. Research indicated that most of the expected growth will occur as outside owners enter Pennsylvania. These owners have already been targeted as those most desired by our farm, it is our strategy to have completed our relocation prior to this time in order to better provide the services the incoming owners will be searching for.
4.3.1 Competition and Buying Patterns
Pennsylvania has many small farms operating with a “Price is Vital” philosophy. These farms were created to service the traditional Pennsylvania thoroughbred owner. It is not our intention to run our facility in this manner, our focus has always been on exceptional quality care and outstanding customer service.
Pennsylvania does have a few large farms that do market themselves as being full service facilities. A few of them do attempt to market to our intended client base. These farms include: Pin Oak Stud, Xanthus Farm, Reigle Heir Farm, Castle Rock Farm and Swatara Farm. Of these, only Pin Oak Stud positions itself as a full service facility, the others are focused on the stallion and breeding market.
One of the most frequent comments we hear from our clients is how happy they are with the care their horses receive while at our farm. We exceed their expectations. Another frequent comment is how comfortable our clients feel talking with us. Their focus is on the quality of our programs and our business relationship. Price has not been an issue for our clientele as they understand the cost of delivering world class care and service. These are the driving factors our clients consider when making decisions about where to send their horses.
Strategy and Implementation Summary
Ereidi Farm will focus its expansion on the following markets: Thoroughbred owners and breeders in state racing programs that are in decline, Pennsylvania thoroughbred owners and breeders that realize they must upgrade their current stock in order to remain competitive and new potential first time owners, usually in the form of partnerships.
Attracting these clients will be done using modern technology (i.e., Internet and website resources) as well as specifically defined print advertising. We will make ourselves more present at public venues where our potential clients gather. Locations such as public thoroughbred sales, seminars, racetracks and trade shows have been targeted.
Our farm has been built on its reputation for exceeding clients expectations on the care of their horses and providing outstanding customer service. These are and will remain the hallmarks of our farm.
5.1 Competitive Edge
Ereidi Farm’s competitive advantage is multi-faceted. We are different from our competitors for the following reasons:
- Our people: We invest in quality, client-focused people and provide them with opportunities for continued learning and skill utilization. Our people are well-informed, engaging and embrace the Ereidi Farm “Full Circle” service philosophy.
- Our programs: Our programs are comprehensive and individualized. No detail is overlooked and no horse gets lost in a “production line” type of program. Our intensive management practices have made us a number one choice for difficult youngsters and “high risk” pregnant mares.
The results are tangible: Untrainable horses have gone on to the races and our farm has a 100% live foal percentage for every year. Our programs consistently exceed our client’s expectations, it is the number one reason our current facility is full to capacity. - Our “Full Circle” service: We genuinely love what we do and enjoy sharing with others! We build long-lasting relationships with our clients through constant communication and our abilities to procure the information and resources clients need to make knowledgeable decisions regarding their thoroughbred investments. We adhere to a high level of integrity and make sure we deliver as promised.
- Our facilities and location: Our expanded facility will offer world class amenities in a conveniently accessible location for local and East Coast regional commutes.
5.2 Sales Strategy
Our marketing programs are designed to create a desire for new potential clients to contact us and schedule a visit to our farm as most sales within our industry are closed upon visual inspection of the facilities, personnel and current horses in training.
Our sales strategy therefore is to provide our clients with an immaculate, safe facility, staffed by knowledgeable, service-oriented people that allows them the opportunity to thoroughly inspect the quality of our programs and the health and condition of the horses in our care. We permit inspections during training hours and our clients are always welcome. These details, coupled with outstanding references and recorded results make closing the sale at a profitable margin possible and pleasant for all parties.
5.2.1 Sales Forecast
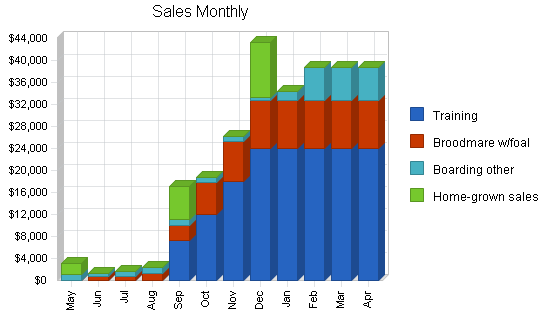
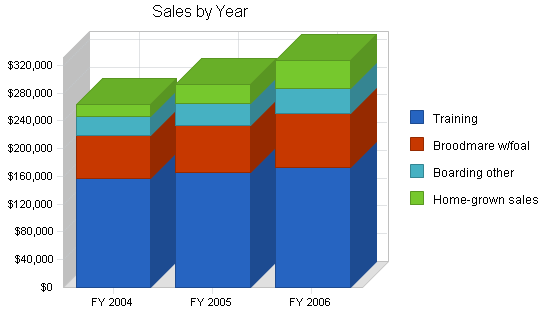
Sales forecasting is based on the yearly cycle of the demand for each particular service. Training requests will increase as the Fall months arrive and grow steadily into the Winter when they will stabilize. Broodmare services will begin to climb as Winter approaches and the foaling season begins (late Winter through Spring). The boarding of weanlings, yearlings and rehabilitative horses (classified together as Other in the sales charts) will begin to grow as the Fall months commence.
Our home-grown sales always occur during the fall months, it is the time of year when the market is actively looking to buy. The dramatic rise is sales reflects the expansion of our facility. Horses require lots of space and our current facility cannot handle a large number of horses. This expansion will enable us to make our services available to a larger group of clients and we will gain more market share.
| Sales Forecast | |||
| FY 2004 | FY 2005 | FY 2006 | |
| Sales | |||
| Training | $157,200 | $165,060 | $173,313 |
| Broodmare w/foal | $61,680 | $69,082 | $77,371 |
| Boarding other | $27,370 | $31,476 | $36,197 |
| Home-grown sales | $18,000 | $27,000 | $40,500 |
| Total Sales | $264,250 | $292,617 | $327,381 |
| Direct Cost of Sales | FY 2004 | FY 2005 | FY 2006 |
| Training | $13,100 | $13,755 | $14,443 |
| Broodmare w/foal | $8,500 | $9,520 | $10,662 |
| Boarding other | $5,400 | $6,210 | $7,142 |
| Home-grown sales | $8,000 | $12,000 | $18,000 |
| Subtotal Direct Cost of Sales | $35,000 | $41,485 | $50,247 |
5.3 Marketing Strategy
Our top marketing strategy is an ecstatic client!
Ereidi Farm’s owner has extensive experience in developing marketing campaigns, direct mail campaigns, editing communications and utilizing technology. Our target market consists primarily of: Thoroughbred owners and breeders based outside of Pennsylvania, currently in deteriorating state racing/breeding programs; Pennsylvania thoroughbred owners and breeders who realize they must upgrade their programs to remain competitive in our state’s changing market; new investors in the thoroughbred industry, usually working within a partnership to minimize cost and risk while realizing a set quality level.
We will rely heavily on technology to generate awareness of our expansion, utilizing the Internet to reach those potential clients who are known Internet users. Our farm utilizes digital imaging, it was the number one reason for our increased sales in the past twelve months. Specific Internet sites in which to advertise our expansion have been identified and our farm maintains its own website.
We are building an e-mail mailing list to mass market at high speed. Selected print publications have been targeted to reach those in deteriorating racing states as well as potential new investors. We will increase our presence at industry sales, seminars and trade shows, continue to build our-business-to-business network and provide open houses (open farm days) for interested individuals to visit our farm.
5.4 Milestones
The accompanying table lists important program milestones, with dates and managers in charge, and budgets for each. The milestone schedule indicates our emphasis on planning for implementation.
What the table doesn’t show is the commitment behind it. Our business plan includes complete provisions for plan-vs.-actual analysis, and we will hold monthly follow-up meetings to discuss the variance and course corrections.

| Milestones | |||||
| Milestone | Start Date | End Date | Budget | Manager | Department |
| Locate suitable expansion property | 1/1/2002 | 5/15/2003 | $1,500,000 | ABC | Marketing |
| Secure financing | 5/15/2003 | 6/30/2003 | $22,000 | Eric & Heidi | Accounting |
| Expand current website | 7/5/2003 | 8/31/2003 | $0 | Heidi Trimbur | Marketing |
| Complete expansion marketing roll out | 7/5/2003 | 8/31/2003 | $1,000 | Heidi Trimbur | Marketing |
| Contract 20 training horses | 7/10/2003 | 12/1/2003 | $0 | Heidi Trimbur | Marketing |
| Contracting 12 broodmares | 7/10/2003 | 12/1/2003 | $0 | Heidi Trimbur | Marketing |
| Set up accounting system | 8/1/2003 | 9/15/2003 | $0 | Eric Trimbur | Accounting |
| Contracting head trainer | 7/4/2003 | 10/1/2003 | $0 | Heidi Trimbur | Admin |
| Hiring farm hand(s) | 9/15/2003 | 10/15/2003 | $150 | Eric Trimbur | Admin |
| Build public awareness of PA | 9/5/2003 | 12/31/2003 | $1,000 | Eric & Heidi | Marketing |
| Totals | $1,524,150 | ||||
Web Plan Summary
The owner of Ereidi Farm built and maintains the farm’s website. The site was created to provide an Internet presence that represented the farm through digital images and text. Our farm site provides the viewer with actual images of the horses in our care and gives them a visual comparison, easily accessible when they are shopping for services.
The text gives us the opportunity to share our philosophy on horse care and condition plus supporting our sales photographs. Ereidi Farm has attracted new clients through its website. Due to our viewing audience, construction was done with overall ease of use in mind. We plan on adding digital video to the site in early fall of 2003, just in time for the sales and training seasons. Our Web address is: www.ereidifarm.net – Welcome!
6.1 Website Marketing Strategy
As our expansion occurs, the search engines will be reviewed and updated as will direct links to our site from other targeted sites. As viewers visit our site, their addresses will be utilized on our e-mail direct mail list.
All print advertising will feature the Web address as will all communications.
Management Summary
The current management team consists of the owner and her husband. As expansion occurs we will expand our personnel as required beginning with a training manager to oversee the actual training of the horses.
As growth continues we will need to expand management opportunities into the broodmare, young stock, financial and maintenance areas. Long-term development might include a Stallion manager as well. All will report to the owner and the owner will maintain an in-depth contact with all horses on the farm as well as the clients themselves.
7.1 Personnel Plan
The Personnel table indicates the number of employees required during the initial expansion. This table will grow as the farm fills with client horses.
Additional employees that will be added during the expansion phase will be: additional grooms, exercise riders, maintenance workers, broodmare specialists and office workers. A stallion manager and specially skilled stallion grooms will be long-term additions.
| Personnel Plan | |||
| FY 2004 | FY 2005 | FY 2006 | |
| Owner | $14,000 | $24,000 | $36,000 |
| Head Trainer | $14,000 | $24,000 | $30,000 |
| Groom 1 | $7,218 | $14,436 | $15,900 |
| Groom 2 | $4,812 | $14,436 | $15,900 |
| Total People | 4 | 4 | 4 |
| Total Payroll | $40,030 | $76,872 | $97,800 |
Financial Plan
Ereidi Farm is intending to grow its cash profits by expanding to a larger turn-key facility. Although more expensive to purchase, a turn-key facility of world class quality allows the immediate generation of cash flow at the higher end of the market. The facility we are purchasing does not require the additional expenditure of capital resources to be fully functional, it is ready for business.
Our farm sells a service and does not maintain an inventory.
We operate on a “Cash Only” basis and choose our clients accordingly. It is very rare that we except payments of any type although we may do so when selling one of our home-grown foals to a well-known and trusted client. Our cash only approach allows us to maintain sufficient cash on hand and not waste valuable time and resources collecting amounts due.
At this time, the owner’s husband supplies additional capital as needed from his current job. He will continue in his current employ.
8.1 Important Assumptions
Important assumptions concerning the thoroughbred market and Ereidi Farm’s targeted market include:
The thoroughbred market industry in Pennsylvania will continue to grow. The added slot machine legislation will cause a dramatic growth spurt in racing programs within the state, quickly causing an increase in the demand for services within the state.
Statistics will continue to indicate the decline of racing programs in traditionally strong racing states. Owners of bloodstock within these distressed states will actively seek out new locations in which to relocate their horses and operate a profitable, quality stable.
New owners will invest in the industry, they will be reached by large industry umbrella operations such as the NTRA and TOBA. (National Thoroughbred Racing Association and Thoroughbred Owners and Breeders Association) respectively.
Our targeted markets will continue to post personal income growth despite fluctuating economic conditions. They will continue to invest in non-traditional “exotic” investments such as thoroughbred racehorses.
| General Assumptions | |||
| FY 2004 | FY 2005 | FY 2006 | |
| Plan Month | 1 | 2 | 3 |
| Current Interest Rate | 5.88% | 6.00% | 5.88% |
| Long-term Interest Rate | 7.00% | 7.00% | 7.00% |
| Tax Rate | 23.58% | 23.00% | 23.58% |
| Other | 0 | 0 | 0 |
8.2 Break-even Analysis
Break-even assumptions are as follows:
- Per unit cost is based off of one horse with total start up-units equal to 33 horses.
- Variable costs include: salaries, advertising, maintenance and office expenses.
- Fixed costs include: mortgage/loan, taxes, insurance, utilities and cost to keep 33 horses.
Break-even calculations are shown in the following table and chart.

| Break-even Analysis | |
| Monthly Revenue Break-even | $4,652 |
| Assumptions: | |
| Average Percent Variable Cost | 13% |
| Estimated Monthly Fixed Cost | $4,036 |
8.3 Projected Profit and Loss
Our planned expansion realizes a profit after total expenses are deducted from gross profit. As growth occurs, expenses increase accordingly, however our net profit also continues to grow. This reflects the typical cost of doing business in the horse industry as a whole.


| Pro Forma Profit and Loss | |||
| FY 2004 | FY 2005 | FY 2006 | |
| Sales | $264,250 | $292,617 | $327,381 |
| Direct Cost of Sales | $35,000 | $41,485 | $50,247 |
| Other Costs of Sales | $0 | $0 | $0 |
| Total Cost of Sales | $35,000 | $41,485 | $50,247 |
| Gross Margin | $229,250 | $251,132 | $277,135 |
| Gross Margin % | 86.75% | 85.82% | 84.65% |
| Expenses | |||
| Payroll | $40,030 | $76,872 | $97,800 |
| Sales and Marketing and Other Expenses | $0 | $0 | $0 |
| Depreciation | $2,400 | $2,400 | $2,400 |
| Rent | $0 | $0 | $0 |
| Payroll Taxes | $6,005 | $11,531 | $14,670 |
| Other | $0 | $0 | $0 |
| Total Operating Expenses | $48,435 | $90,803 | $114,870 |
| Profit Before Interest and Taxes | $180,816 | $160,329 | $162,265 |
| EBITDA | $183,216 | $162,729 | $164,665 |
| Interest Expense | $14,274 | $14,290 | $14,274 |
| Taxes Incurred | $38,402 | $33,589 | $34,901 |
| Net Profit | $128,140 | $112,450 | $113,090 |
| Net Profit/Sales | 48.49% | 38.43% | 34.54% |
8.4 Projected Cash Flow
Ereidi Farm is a “Cash Only” type of business. Although we do accept payments for the horses we raise and sell, the rest of our business is cash based in order to increase cash flow and limit the farm’s liabilities.

| Pro Forma Cash Flow | |||
| FY 2004 | FY 2005 | FY 2006 | |
| Cash Received | |||
| Cash from Operations | |||
| Cash Sales | $224,613 | $248,725 | $278,274 |
| Cash from Receivables | $41,176 | $42,669 | $47,608 |
| Subtotal Cash from Operations | $265,788 | $291,393 | $325,882 |
| Additional Cash Received | |||
| Sales Tax, VAT, HST/GST Received | $0 | $0 | $0 |
| New Current Borrowing | $0 | $0 | $0 |
| New Other Liabilities (interest-free) | $0 | $0 | $0 |
| New Long-term Liabilities | $0 | $0 | $0 |
| Sales of Other Current Assets | $0 | $0 | $0 |
| Sales of Long-term Assets | $0 | $0 | $0 |
| New Investment Received | $0 | $0 | $0 |
| Subtotal Cash Received | $265,788 | $291,393 | $325,882 |
| Expenditures | FY 2004 | FY 2005 | FY 2006 |
| Expenditures from Operations | |||
| Cash Spending | $40,030 | $76,872 | $97,800 |
| Bill Payments | $81,830 | $104,452 | $113,007 |
| Subtotal Spent on Operations | $121,860 | $181,324 | $210,807 |
| Additional Cash Spent | |||
| Sales Tax, VAT, HST/GST Paid Out | $0 | $0 | $0 |
| Principal Repayment of Current Borrowing | $0 | $0 | $0 |
| Other Liabilities Principal Repayment | $0 | $0 | $0 |
| Long-term Liabilities Principal Repayment | $0 | $0 | $0 |
| Purchase Other Current Assets | $0 | $0 | $0 |
| Purchase Long-term Assets | $0 | $0 | $0 |
| Dividends | $0 | $0 | $0 |
| Subtotal Cash Spent | $121,860 | $181,324 | $210,807 |
| Net Cash Flow | $143,928 | $110,069 | $115,075 |
| Cash Balance | $147,210 | $257,280 | $372,354 |
8.5 Projected Balance Sheet
The balance sheet in the following table shows sufficient growth of net worth, and a sufficiently healthy financial position. The monthly estimates are included in the appendix.
Please note that specific variable and fixed expense categories have intentionally been left blank as these expenses are already figured into our “cost-per-horse” expense.
| Pro Forma Balance Sheet | |||
| FY 2004 | FY 2005 | FY 2006 | |
| Assets | |||
| Current Assets | |||
| Cash | $147,210 | $257,280 | $372,354 |
| Accounts Receivable | $11,399 | $12,622 | $14,122 |
| Other Current Assets | $87,684 | $87,684 | $87,684 |
| Total Current Assets | $246,293 | $357,586 | $474,161 |
| Long-term Assets | |||
| Long-term Assets | $490,000 | $490,000 | $490,000 |
| Accumulated Depreciation | $5,200 | $7,600 | $10,000 |
| Total Long-term Assets | $484,800 | $482,400 | $480,000 |
| Total Assets | $731,093 | $839,986 | $954,161 |
| Liabilities and Capital | FY 2004 | FY 2005 | FY 2006 |
| Current Liabilities | |||
| Accounts Payable | $11,850 | $8,293 | $9,377 |
| Current Borrowing | $13,000 | $13,000 | $13,000 |
| Other Current Liabilities | $0 | $0 | $0 |
| Subtotal Current Liabilities | $24,850 | $21,293 | $22,377 |
| Long-term Liabilities | $193,000 | $193,000 | $193,000 |
| Total Liabilities | $217,850 | $214,293 | $215,377 |
| Paid-in Capital | $0 | $0 | $0 |
| Retained Earnings | $385,103 | $513,243 | $625,693 |
| Earnings | $128,140 | $112,450 | $113,090 |
| Total Capital | $513,243 | $625,693 | $738,783 |
| Total Liabilities and Capital | $731,093 | $839,986 | $954,161 |
| Net Worth | $513,243 | $625,693 | $738,783 |
8.6 Business Ratios
Business ratios for the years of this plan are shown below. Industry profile ratios based on the Standard Industrial Classification (SIC) code 0752.0102, [Breeding services, horses: racing and non-racing], are shown for comparison.
| Ratio Analysis | ||||
| FY 2004 | FY 2005 | FY 2006 | Industry Profile | |
| Sales Growth | 1265.84% | 10.73% | 11.88% | 10.13% |
| Percent of Total Assets | ||||
| Accounts Receivable | 1.56% | 1.50% | 1.48% | 11.58% |
| Other Current Assets | 11.99% | 10.44% | 9.19% | 31.09% |
| Total Current Assets | 33.69% | 42.57% | 49.69% | 51.94% |
| Long-term Assets | 66.31% | 57.43% | 50.31% | 48.06% |
| Total Assets | 100.00% | 100.00% | 100.00% | 100.00% |
| Current Liabilities | 3.40% | 2.53% | 2.35% | 23.95% |
| Long-term Liabilities | 26.40% | 22.98% | 20.23% | 24.54% |
| Total Liabilities | 29.80% | 25.51% | 22.57% | 48.49% |
| Net Worth | 70.20% | 74.49% | 77.43% | 51.51% |
| Percent of Sales | ||||
| Sales | 100.00% | 100.00% | 100.00% | 100.00% |
| Gross Margin | 86.75% | 85.82% | 84.65% | 38.83% |
| Selling, General & Administrative Expenses | 37.53% | 46.76% | 49.28% | 25.23% |
| Advertising Expenses | 0.00% | 0.00% | 0.00% | 0.43% |
| Profit Before Interest and Taxes | 68.43% | 54.79% | 49.56% | 1.11% |
| Main Ratios | ||||
| Current | 9.91 | 16.79 | 21.19 | 1.47 |
| Quick | 9.91 | 16.79 | 21.19 | 0.89 |
| Total Debt to Total Assets | 29.80% | 25.51% | 22.57% | 1.73% |
| Pre-tax Return on Net Worth | 32.45% | 23.34% | 20.03% | 64.10% |
| Pre-tax Return on Assets | 22.78% | 17.39% | 15.51% | 4.81% |
| Additional Ratios | FY 2004 | FY 2005 | FY 2006 | |
| Net Profit Margin | 48.49% | 38.43% | 34.54% | n.a |
| Return on Equity | 24.97% | 17.97% | 15.31% | n.a |
| Activity Ratios | ||||
| Accounts Receivable Turnover | 3.48 | 3.48 | 3.48 | n.a |
| Collection Days | 60 | 100 | 99 | n.a |
| Accounts Payable Turnover | 7.91 | 12.17 | 12.17 | n.a |
| Payment Days | 27 | 36 | 28 | n.a |
| Total Asset Turnover | 0.36 | 0.35 | 0.34 | n.a |
| Debt Ratios | ||||
| Debt to Net Worth | 0.42 | 0.34 | 0.29 | n.a |
| Current Liab. to Liab. | 0.11 | 0.10 | 0.10 | n.a |
| Liquidity Ratios | ||||
| Net Working Capital | $221,443 | $336,293 | $451,783 | n.a |
| Interest Coverage | 12.67 | 11.22 | 11.37 | n.a |
| Additional Ratios | ||||
| Assets to Sales | 2.77 | 2.87 | 2.91 | n.a |
| Current Debt/Total Assets | 3% | 3% | 2% | n.a |
| Acid Test | 9.45 | 16.20 | 20.56 | n.a |
| Sales/Net Worth | 0.51 | 0.47 | 0.44 | n.a |
| Dividend Payout | 0.00 | 0.00 | 0.00 | n.a |
Appendix
| Sales Forecast | |||||||||||||
| May | Jun | Jul | Aug | Sep | Oct | Nov | Dec | Jan | Feb | Mar | Apr | ||
| Sales | |||||||||||||
| Training | 0% | $0 | $0 | $0 | $0 | $7,200 | $12,000 | $18,000 | $24,000 | $24,000 | $24,000 | $24,000 | $24,000 |
| Broodmare w/foal | 0% | $0 | $660 | $660 | $1,320 | $2,880 | $5,760 | $7,200 | $8,640 | $8,640 | $8,640 | $8,640 | $8,640 |
| Boarding other | 0% | $1,070 | $650 | $1,050 | $1,050 | $1,050 | $1,050 | $1,050 | $600 | $1,800 | $6,000 | $6,000 | $6,000 |
| Home-grown sales | 0% | $2,000 | $0 | $0 | $0 | $6,000 | $0 | $0 | $10,000 | $0 | $0 | $0 | $0 |
| Total Sales | $3,070 | $1,310 | $1,710 | $2,370 | $17,130 | $18,810 | $26,250 | $43,240 | $34,440 | $38,640 | $38,640 | $38,640 | |
| Direct Cost of Sales | May | Jun | Jul | Aug | Sep | Oct | Nov | Dec | Jan | Feb | Mar | Apr | |
| Training | $0 | $0 | $0 | $0 | $600 | $1,000 | $1,500 | $2,000 | $2,000 | $2,000 | $2,000 | $2,000 | |
| Broodmare w/foal | $0 | $100 | $100 | $100 | $400 | $800 | $1,000 | $1,200 | $1,200 | $1,200 | $1,200 | $1,200 | |
| Boarding other | $300 | $200 | $300 | $300 | $300 | $300 | $300 | $100 | $300 | $1,000 | $1,000 | $1,000 | |
| Home-grown sales | $0 | $8,000 | $0 | $0 | $0 | $0 | $0 | $0 | $0 | $0 | $0 | $0 | |
| Subtotal Direct Cost of Sales | $300 | $8,300 | $400 | $400 | $1,300 | $2,100 | $2,800 | $3,300 | $3,500 | $4,200 | $4,200 | $4,200 | |
| Personnel Plan | |||||||||||||
| May | Jun | Jul | Aug | Sep | Oct | Nov | Dec | Jan | Feb | Mar | Apr | ||
| Owner | 0% | $0 | $0 | $0 | $0 | $0 | $2,000 | $2,000 | $2,000 | $2,000 | $2,000 | $2,000 | $2,000 |
| Head Trainer | 0% | $0 | $0 | $0 | $0 | $0 | $2,000 | $2,000 | $2,000 | $2,000 | $2,000 | $2,000 | $2,000 |
| Groom 1 | 0% | $0 | $0 | $0 | $0 | $0 | $0 | $1,203 | $1,203 | $1,203 | $1,203 | $1,203 | $1,203 |
| Groom 2 | 0% | $0 | $0 | $0 | $0 | $0 | $0 | $0 | $0 | $1,203 | $1,203 | $1,203 | $1,203 |
| Total People | 0 | 0 | 0 | 0 | 0 | 2 | 3 | 3 | 4 | 4 | 4 | 4 | |
| Total Payroll | $0 | $0 | $0 | $0 | $0 | $4,000 | $5,203 | $5,203 | $6,406 | $6,406 | $6,406 | $6,406 | |
| General Assumptions | |||||||||||||
| May | Jun | Jul | Aug | Sep | Oct | Nov | Dec | Jan | Feb | Mar | Apr | ||
| Plan Month | 1 | 2 | 3 | 4 | 5 | 6 | 7 | 8 | 9 | 10 | 11 | 12 | |
| Current Interest Rate | 5.50% | 5.50% | 5.50% | 6.00% | 6.00% | 6.00% | 6.00% | 6.00% | 6.00% | 6.00% | 6.00% | 6.00% | |
| Long-term Interest Rate | 7.00% | 7.00% | 7.00% | 7.00% | 7.00% | 7.00% | 7.00% | 7.00% | 7.00% | 7.00% | 7.00% | 7.00% | |
| Tax Rate | 30.00% | 23.00% | 23.00% | 23.00% | 23.00% | 23.00% | 23.00% | 23.00% | 23.00% | 23.00% | 23.00% | 23.00% | |
| Other | 0 | 0 | 0 | 0 | 0 | 0 | 0 | 0 | 0 | 0 | 0 | 0 | |
| Pro Forma Profit and Loss | |||||||||||||
| May | Jun | Jul | Aug | Sep | Oct | Nov | Dec | Jan | Feb | Mar | Apr | ||
| Sales | $3,070 | $1,310 | $1,710 | $2,370 | $17,130 | $18,810 | $26,250 | $43,240 | $34,440 | $38,640 | $38,640 | $38,640 | |
| Direct Cost of Sales | $300 | $8,300 | $400 | $400 | $1,300 | $2,100 | $2,800 | $3,300 | $3,500 | $4,200 | $4,200 | $4,200 | |
| Other Costs of Sales | $0 | $0 | $0 | $0 | $0 | $0 | $0 | $0 | $0 | $0 | $0 | $0 | |
| Total Cost of Sales | $300 | $8,300 | $400 | $400 | $1,300 | $2,100 | $2,800 | $3,300 | $3,500 | $4,200 | $4,200 | $4,200 | |
| Gross Margin | $2,770 | ($6,990) | $1,310 | $1,970 | $15,830 | $16,710 | $23,450 | $39,940 | $30,940 | $34,440 | $34,440 | $34,440 | |
| Gross Margin % | 90.23% | -533.59% | 76.61% | 83.12% | 92.41% | 88.84% | 89.33% | 92.37% | 89.84% | 89.13% | 89.13% | 89.13% | |
| Expenses | |||||||||||||
| Payroll | $0 | $0 | $0 | $0 | $0 | $4,000 | $5,203 | $5,203 | $6,406 | $6,406 | $6,406 | $6,406 | |
| Sales and Marketing and Other Expenses | $0 | $0 | $0 | $0 | $0 | $0 | $0 | $0 | $0 | $0 | $0 | $0 | |
| Depreciation | $200 | $200 | $200 | $200 | $200 | $200 | $200 | $200 | $200 | $200 | $200 | $200 | |
| Rent | $0 | $0 | $0 | $0 | $0 | $0 | $0 | $0 | $0 | $0 | $0 | $0 | |
| Payroll Taxes | 15% | $0 | $0 | $0 | $0 | $0 | $600 | $780 | $780 | $961 | $961 | $961 | $961 |
| Other | $0 | $0 | $0 | $0 | $0 | $0 | $0 | $0 | $0 | $0 | $0 | $0 | |
| Total Operating Expenses | $200 | $200 | $200 | $200 | $200 | $4,800 | $6,183 | $6,183 | $7,567 | $7,567 | $7,567 | $7,567 | |
| Profit Before Interest and Taxes | $2,570 | ($7,190) | $1,110 | $1,770 | $15,630 | $11,910 | $17,267 | $33,757 | $23,373 | $26,873 | $26,873 | $26,873 | |
| EBITDA | $2,770 | ($6,990) | $1,310 | $1,970 | $15,830 | $12,110 | $17,467 | $33,957 | $23,573 | $27,073 | $27,073 | $27,073 | |
| Interest Expense | $1,185 | $1,185 | $1,185 | $1,191 | $1,191 | $1,191 | $1,191 | $1,191 | $1,191 | $1,191 | $1,191 | $1,191 | |
| Taxes Incurred | $415 | ($1,926) | ($17) | $133 | $3,321 | $2,465 | $3,697 | $7,490 | $5,102 | $5,907 | $5,907 | $5,907 | |
| Net Profit | $969 | ($6,449) | ($58) | $446 | $11,118 | $8,254 | $12,378 | $25,076 | $17,080 | $19,775 | $19,775 | $19,775 | |
| Net Profit/Sales | 31.57% | -492.30% | -3.40% | 18.82% | 64.90% | 43.88% | 47.16% | 57.99% | 49.59% | 51.18% | 51.18% | 51.18% | |
| Pro Forma Cash Flow | |||||||||||||
| May | Jun | Jul | Aug | Sep | Oct | Nov | Dec | Jan | Feb | Mar | Apr | ||
| Cash Received | |||||||||||||
| Cash from Operations | |||||||||||||
| Cash Sales | $2,610 | $1,114 | $1,454 | $2,015 | $14,561 | $15,989 | $22,313 | $36,754 | $29,274 | $32,844 | $32,844 | $32,844 | |
| Cash from Receivables | $6,469 | $6,484 | $452 | $199 | $260 | $429 | $2,578 | $2,859 | $4,022 | $6,442 | $5,187 | $5,796 | |
| Subtotal Cash from Operations | $9,078 | $7,597 | $1,905 | $2,213 | $14,820 | $16,418 | $24,890 | $39,613 | $33,296 | $39,286 | $38,031 | $38,640 | |
| Additional Cash Received | |||||||||||||
| Sales Tax, VAT, HST/GST Received | 0.00% | $0 | $0 | $0 | $0 | $0 | $0 | $0 | $0 | $0 | $0 | $0 | $0 |
| New Current Borrowing | $0 | $0 | $0 | $0 | $0 | $0 | $0 | $0 | $0 | $0 | $0 | $0 | |
| New Other Liabilities (interest-free) | $0 | $0 | $0 | $0 | $0 | $0 | $0 | $0 | $0 | $0 | $0 | $0 | |
| New Long-term Liabilities | $0 | $0 | $0 | $0 | $0 | $0 | $0 | $0 | $0 | $0 | $0 | $0 | |
| Sales of Other Current Assets | $0 | $0 | $0 | $0 | $0 | $0 | $0 | $0 | $0 | $0 | $0 | $0 | |
| Sales of Long-term Assets | $0 | $0 | $0 | $0 | $0 | $0 | $0 | $0 | $0 | $0 | $0 | $0 | |
| New Investment Received | $0 | $0 | $0 | $0 | $0 | $0 | $0 | $0 | $0 | $0 | $0 | $0 | |
| Subtotal Cash Received | $9,078 | $7,597 | $1,905 | $2,213 | $14,820 | $16,418 | $24,890 | $39,613 | $33,296 | $39,286 | $38,031 | $38,640 | |
| Expenditures | May | Jun | Jul | Aug | Sep | Oct | Nov | Dec | Jan | Feb | Mar | Apr | |
| Expenditures from Operations | |||||||||||||
| Cash Spending | $0 | $0 | $0 | $0 | $0 | $4,000 | $5,203 | $5,203 | $6,406 | $6,406 | $6,406 | $6,406 | |
| Bill Payments | $63 | $2,089 | $7,359 | $1,573 | $1,860 | $5,830 | $6,427 | $8,612 | $12,694 | $10,804 | $12,259 | $12,259 | |
| Subtotal Spent on Operations | $63 | $2,089 | $7,359 | $1,573 | $1,860 | $9,830 | $11,630 | $13,815 | $19,100 | $17,210 | $18,665 | $18,665 | |
| Additional Cash Spent | |||||||||||||
| Sales Tax, VAT, HST/GST Paid Out | $0 | $0 | $0 | $0 | $0 | $0 | $0 | $0 | $0 | $0 | $0 | $0 | |
| Principal Repayment of Current Borrowing | $0 | $0 | $0 | $0 | $0 | $0 | $0 | $0 | $0 | $0 | $0 | $0 | |
| Other Liabilities Principal Repayment | $0 | $0 | $0 | $0 | $0 | $0 | $0 | $0 | $0 | $0 | $0 | $0 | |
| Long-term Liabilities Principal Repayment | $0 | $0 | $0 | $0 | $0 | $0 | $0 | $0 | $0 | $0 | $0 | $0 | |
| Purchase Other Current Assets | $0 | $0 | $0 | $0 | $0 | $0 | $0 | $0 | $0 | $0 | $0 | $0 | |
| Purchase Long-term Assets | $0 | $0 | $0 | $0 | $0 | $0 | $0 | $0 | $0 | $0 | $0 | $0 | |
| Dividends | $0 | $0 | $0 | $0 | $0 | $0 | $0 | $0 | $0 | $0 | $0 | $0 | |
| Subtotal Cash Spent | $63 | $2,089 | $7,359 | $1,573 | $1,860 | $9,830 | $11,630 | $13,815 | $19,100 | $17,210 | $18,665 | $18,665 | |
| Net Cash Flow | $9,015 | $5,508 | ($5,454) | $640 | $12,960 | $6,588 | $13,261 | $25,798 | $14,196 | $22,076 | $19,366 | $19,975 | |
| Cash Balance | $12,297 | $17,805 | $12,350 | $12,990 | $25,950 | $32,538 | $45,799 | $71,597 | $85,793 | $107,869 | $127,235 | $147,210 | |
| Pro Forma Balance Sheet | |||||||||||||
| May | Jun | Jul | Aug | Sep | Oct | Nov | Dec | Jan | Feb | Mar | Apr | ||
| Assets | Starting Balances | ||||||||||||
| Current Assets | |||||||||||||
| Cash | $3,282 | $12,297 | $17,805 | $12,350 | $12,990 | $25,950 | $32,538 | $45,799 | $71,597 | $85,793 | $107,869 | $127,235 | $147,210 |
| Accounts Receivable | $12,937 | $6,929 | $642 | $446 | $603 | $2,913 | $5,305 | $6,665 | $10,292 | $11,436 | $10,790 | $11,399 | $11,399 |
| Other Current Assets | $87,684 | $87,684 | $87,684 | $87,684 | $87,684 | $87,684 | $87,684 | $87,684 | $87,684 | $87,684 | $87,684 | $87,684 | $87,684 |
| Total Current Assets | $103,903 | $106,910 | $106,130 | $100,481 | $101,278 | $116,547 | $125,527 | $140,148 | $169,573 | $184,912 | $206,343 | $226,318 | $246,293 |
| Long-term Assets | |||||||||||||
| Long-term Assets | $490,000 | $490,000 | $490,000 | $490,000 | $490,000 | $490,000 | $490,000 | $490,000 | $490,000 | $490,000 | $490,000 | $490,000 | $490,000 |
| Accumulated Depreciation | $2,800 | $3,000 | $3,200 | $3,400 | $3,600 | $3,800 | $4,000 | $4,200 | $4,400 | $4,600 | $4,800 | $5,000 | $5,200 |
| Total Long-term Assets | $487,200 | $487,000 | $486,800 | $486,600 | $486,400 | $486,200 | $486,000 | $485,800 | $485,600 | $485,400 | $485,200 | $485,000 | $484,800 |
| Total Assets | $591,103 | $593,910 | $592,930 | $587,081 | $587,678 | $602,747 | $611,527 | $625,948 | $655,173 | $670,312 | $691,543 | $711,318 | $731,093 |
| Liabilities and Capital | May | Jun | Jul | Aug | Sep | Oct | Nov | Dec | Jan | Feb | Mar | Apr | |
| Current Liabilities | |||||||||||||
| Accounts Payable | $0 | $1,837 | $7,307 | $1,516 | $1,667 | $5,618 | $6,144 | $8,186 | $12,336 | $10,395 | $11,850 | $11,850 | $11,850 |
| Current Borrowing | $13,000 | $13,000 | $13,000 | $13,000 | $13,000 | $13,000 | $13,000 | $13,000 | $13,000 | $13,000 | $13,000 | $13,000 | $13,000 |
| Other Current Liabilities | $0 | $0 | $0 | $0 | $0 | $0 | $0 | $0 | $0 | $0 | $0 | $0 | $0 |
| Subtotal Current Liabilities | $13,000 | $14,837 | $20,307 | $14,516 | $14,667 | $18,618 | $19,144 | $21,186 | $25,336 | $23,395 | $24,850 | $24,850 | $24,850 |
| Long-term Liabilities | $193,000 | $193,000 | $193,000 | $193,000 | $193,000 | $193,000 | $193,000 | $193,000 | $193,000 | $193,000 | $193,000 | $193,000 | $193,000 |
| Total Liabilities | $206,000 | $207,837 | $213,307 | $207,516 | $207,667 | $211,618 | $212,144 | $214,186 | $218,336 | $216,395 | $217,850 | $217,850 | $217,850 |
| Paid-in Capital | $0 | $0 | $0 | $0 | $0 | $0 | $0 | $0 | $0 | $0 | $0 | $0 | $0 |
| Retained Earnings | $385,103 | $385,103 | $385,103 | $385,103 | $385,103 | $385,103 | $385,103 | $385,103 | $385,103 | $385,103 | $385,103 | $385,103 | $385,103 |
| Earnings | $0 | $969 | ($5,480) | ($5,538) | ($5,092) | $6,026 | $14,280 | $26,658 | $51,734 | $68,814 | $88,590 | $108,365 | $128,140 |
| Total Capital | $385,103 | $386,072 | $379,623 | $379,565 | $380,011 | $391,129 | $399,383 | $411,761 | $436,837 | $453,917 | $473,693 | $493,468 | $513,243 |
| Total Liabilities and Capital | $591,103 | $593,910 | $592,930 | $587,081 | $587,678 | $602,747 | $611,527 | $625,948 | $655,173 | $670,312 | $691,543 | $711,318 | $731,093 |
| Net Worth | $385,103 | $386,072 | $379,623 | $379,565 | $380,011 | $391,129 | $399,383 | $411,761 | $436,837 | $453,917 | $473,693 | $493,468 | $513,243 |


