
GFX: Gravestat Farm eXchange
Executive Summary
GFX: Gravestat Farm eXchange will be a business entity which applies 21st century technology and business practices to an ageless business environment.
Live business experimentation over the last 12 months has identified that this modern approach to a traditional business yields a substantial competitive edge and extraordinary customer appeal. The overall concept, once fully operational, will be highly successful, able to sustain a profitable company with the potential to expand exponentially.
This business plan is submitted in an effort to secure start-up funding in the amount of $110,000 to allow GFX: Gravestat Farm eXchange to graduate from experimentation into a fully operational business entity. The funding request incorporates a healthy ratio of additional investment and operating capital. These are intended to provide the final pieces necessary to implement the plan while providing a safe and realistic ramp-up period towards a profitable future.
GFX: Gravestat Farm eXchange is a home based business, located north of Chandler, in Lincoln County, Oklahoma, and is owned and operated by Edward A. Graves and family. A successful business career culminating in a final position as U.S. Sales & Operations Manager for an international software development company, in conjunction with over three years of experience in the area of this business proposal, provides a foundation of expertise and experience that further assures the success of this venture. The full implementation of this plan requires no further employees, nor business locations, thus providing for the lowest possible operating costs without sacrificing any revenue potential. Rather, it concentrates on providing a full range of traditional products (with a powerful and unique addition) through e-commerce, event attendance, and home based sales.
1.1 Business Overview
It is of critical importance at the outset of reviewing this business plan, that the reviewer be willing to break some general preconceptions over the general nature of GFX business.
GFX is not a farm. GFX is not a horse ranch.
GFX is a Web-centric, event vendor, and retail location resale company.
There are two traditional ways to help visualize GFX:
-
A pet store, selling pet quality animals (in this case horses) to the general public.
-
A full line tack and equine supply store.
In example #1 above, this option simply does not currently exist for the horse buyer (virtually every other type of pet, but not for horses). Hobby horse owners are forced to purchase horses through either: A) a “breed farm” offering a quality of horse well beyond the buyers needs and price range, or B) through a variety of “horse trader” outlets, none of which employ even a minimal level of acceptable business practice. This leaves the buyer with the choice of paying too much for something they do not need, or buying through unscrupulous sources that more often than not, lead to a bad (and dangerous) purchase.
In example #2 above, tack and equine supply companies are a traditional and solid business. However, not a single tack shop takes maximum advantage of the symbiotic requirements of the horse and the supply. Every horse buyer is a potential tack and supply customer. Every tack and supply buyer is a potential horse buyer. It is only logical, and an unfilled market niche, to combine the two, thereby offering the buyer a 1-stop shopping opportunity.
The geographic area between Oklahoma City, Tulsa, and Ponca City, Oklahoma is known in the industry as “The Triangle”… the most active horse market in the world. And yet, not a single company has applied these most fundamental business practices to this massive market.
GFX will operate a retail location at our location.
GFX will attend equine events in Tulsa, Oklahoma City, and Purcell (the three most active equestrian event venues in America) as a vendor.
GFX will maintain a strong Web presence with an online catalog and shopping capability.
GFX applies modern business practices and technology to one of the oldest and most reliable markets.
1.2 Personal Credit Worthiness
In the critical area of personal credit worthiness, we ask the reviewer to make particular note of this section and include it with all considerations for this loan request.
We have enjoyed an historically excellent personal credit history. Early on we began to identify the business opportunity that has since resulted in this business proposal and request for funding. We set our sites on this goal and began investing heavily, with every available personal resource, in the experimentation that has led to the current GFX formula. At times perhaps, we invested too heavily. During the course of last year and through the present date, we have had to carefully play the “cash flow game.” At times we have fallen behind, and at times we have pulled ahead. At present we are even. We make note of this to the reviewer since we expect some degree of negative reflection to appear on a standard credit report. We would ask that the reviewer consider the level of dedication and investment that we have put forth prior to seeking a formal funding package, along with our credit rating prior to this time period.
The key issue is that we have executed our personal finances responsibly in the past, and have only stretched our personal financial limits in pursuit of this opportunity. We hope you will consider these factors favorably.
1.3 Objectives
Successful first benchmark operation to achieve the following measurable results:
20 location customers, attendance at two horse events, and 500 “Web Hits” per month resulting in:
- $4,500/month in tack & product sales at an average of 30% net for $1,350/month revenue.
- $1,000/month in manufactured product sales at an average of 60% net for $600/month revenue.
- $20,000/month in horse sales at an average of 30% net for $6,000/month revenue.
For an initial achievement benchmark of $25,500 gross, $7,950 net, per month.
1.4 Mission
GFX: Gravestat Farm eXchange will consolidate and legitimize the representation and sale of a complete line of horse products, including the horse itself, in a safe and professional business environment. It is focused towards the needs of the pleasure horse owner, those most at risk from the traditional horse selling business. Our success will be built upon customer satisfaction brought about by complete business integrity. We will remain constantly in search of new product offerings which offer value to the customer and reasonable profit to GFX. We will utilize modern technology and methodology to insure GFX increases it’s visibility, customer base, and resulting success. GFX will establish itself as the company that set the new standard of business in the pleasure horse industry, and the one against which all others that follow will be compared.
Company Summary
GFX is a retail sales organization targeted at the needs of the middle to upper class pleasure horse owner/buyer. It serves this purpose in two primary ways. First, by providing a legitimate and professional horse buying experience, virtually unavailable anywhere else. Second, by providing a “1-Stop Shop” source for a complete line of products needed to support, care for, and enjoy their horse.
2.1 Company Ownership
GFX will be wholly owned and privately held by Edward and Leanna Graves, most likely as an LLC entity. The final business form however, will be decided after consultation with a business attorney to determine the most advantageous form given the specifics of our business. The expense for this legal consultation and execution has been included in the Start-Up Costs section of this business plan.

2.2 Start-up Summary
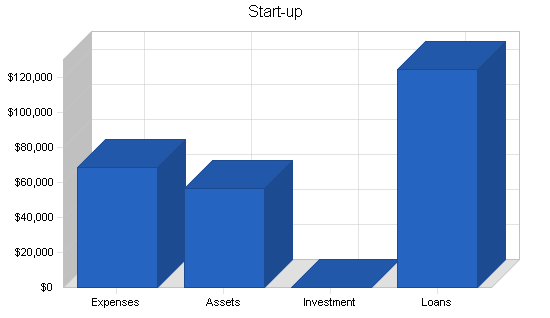
The following table shows the start-up funding requirements, and use thereof, for GFX to become operational. It contains $68,500 in start-up expenditures, $14,500 in inventory investment, and $42,000 in operating capital for the first six months of GFX operation.
To fund these requirements, we are seeking a ten-year loan of $110,000 for the business, to be backed by the equity in the owners’ home.
| Start-up | |
| Requirements | |
| Start-up Expenses | |
| Legal | $1,150 |
| Business Cards | $100 |
| Signage | $250 |
| Manufacturing Equipment | $2,500 |
| Consolidated Credit Card Debt | $15,000 |
| Laptop Computer System for Office | $1,000 |
| Tractor & Equipment | $5,000 |
| Building | $3,500 |
| Land Acquisition | $40,000 |
| Total Start-up Expenses | $68,500 |
| Start-up Assets | |
| Cash Required | $42,000 |
| Start-up Inventory | $14,500 |
| Other Current Assets | $0 |
| Long-term Assets | $0 |
| Total Assets | $56,500 |
| Total Requirements | $125,000 |
| Start-up Funding | |
| Start-up Expenses to Fund | $68,500 |
| Start-up Assets to Fund | $56,500 |
| Total Funding Required | $125,000 |
| Assets | |
| Non-cash Assets from Start-up | $14,500 |
| Cash Requirements from Start-up | $42,000 |
| Additional Cash Raised | $0 |
| Cash Balance on Starting Date | $42,000 |
| Total Assets | $56,500 |
| Liabilities and Capital | |
| Liabilities | |
| Current Borrowing | $0 |
| Long-term Liabilities | $125,000 |
| Accounts Payable (Outstanding Bills) | $0 |
| Other Current Liabilities (interest-free) | $0 |
| Total Liabilities | $125,000 |
| Capital | |
| Planned Investment | |
| Private Investor | $0 |
| Other | $0 |
| Additional Investment Requirement | $0 |
| Total Planned Investment | $0 |
| Loss at Start-up (Start-up Expenses) | ($68,500) |
| Total Capital | ($68,500) |
| Total Capital and Liabilities | $56,500 |
| Total Funding | $125,000 |
2.3 Company Locations and Facilities
GFX will be located and primarily operated at our residential address on State Highway 18, nine miles north of the Turner Turnpike (I-44) Chandler exit, in Central Oklahoma.
The property presently includes 15 sectioned and fenced acres, a 50′ x 100′ barn, 2800 sq.ft. brick home, mobile home, and small storage shed. This location is ideal for the sale of horses as it is directly on a state highway nearly equidistant (1 hour’s drive) from Oklahoma City and Tulsa, and less than 30 minutes from Stillwater, Chandler, Cushing, Stroud, and Shawnee, Oklahoma. It offers sufficient space to maintain, train, show, and sell the horses and product lines offered by GFX in a rural setting centrally located to the vast majority of Oklahoma.
As part of this business plan, GFX intends to add a small tack shop and business office at this location. We also intend to purchase 50 – 60 acres of additional nearby land for the keeping of additional horse inventory and the production of sufficient hay to feed the stock.
Business done at this location only accounts for one segment of the overall operation.
GFX will regularly attend horse events at the Oklahoma City Fairgrounds, Tulsa Expo Square Fairgrounds, and Purcell Expo Center, (three of the most active horse competition venue’s in America) as a product vendor on a regular basis.
GFX will execute a third, major segment of its business via e-commerce, utilizing an active website featuring an online catalog for tack and equipment sales executed over the World Wide Web. This site is currently in operation at www.gfarmx.com and the reviewer is encouraged to visit for a working demonstration of this segment of the GFX overall strategy.
Products
GFX provides a unique “1-Stop Shopping” experience for the pleasure horse owner/buyer by providing a complete line of horse related products, including the horse itself, at our location in Central Oklahoma, as a vendor at horse events, and with a website offering online catalog and purchase capabilities.
3.1 Product Description
GFX is involved in the marketing and sale of three primary categories:
- Riding horses.
- Full line of resale products.
- Limited line of GFX manufactured products.
1. Riding horses.
This is the single greatest area of opportunity for GFX, and the foundation for our business. It has been identified as an empty, but much needed, market niche. The number of people who wish to buy a horse, or horses, for family use in Oklahoma, given the rural nature of our state, is countless.
These people currently have four choices of places from which to buy:
- Private individuals who are selling a horse. This usually involves a poorly trained animal with bad (dangerous) habits in potentially poor condition.
- Horse auctions in which there are nearly no rules of business integrity and only the most experienced horse people have any hope of discerning a good animal from the majority of poor animals that are sold through auction.
- “Horse Traders” who are, I am sorry to say, some of the most unscrupulous salespeople I have ever encountered. To the last they employ a variety of tricks, drugs, and misrepresentations; in essence, doing whatever is necessary to make a sale.
- Horse Ranches which sell only registered and bloodline stock that, while typically well trained and conditioned, are priced for competitive use far beyond the reach or needs of the typical buyer.
We have discovered that by working with a few select sources, we are able to purchase exceptional riding horses at very reasonable prices. We can then apply Web marketing and professional business practices to offer these horses for sale at a comfortable profit margin. Customers, most of whom have been “burned” in previous purchase attempts through the sources listed above, are relieved when they encounter our business practice. They are more comfortable with the standard business ethics we apply, satisfied with the price, and anxious to tell others to make their future purchases through GFX. The sale of horses will take place almost entirely at our residence.
2. Full line of resale products.
This is probably the most traditional aspect of the GFX business plan. We have found a variety of horse related product distributors and manufacturers anxious to have us resell their products.
Specifically we have reached agreement with:
- Southern Wholesale Tack, full line of horse tack and care products.
- Cheval Publishing, HorseBiz and PedigreeBiz equine & farm management software.
- Pelikan Industries, distributor of 2.4 Ghz wireless CCTV systems, ideal for barn & mare monitoring.
These initial relationships have been established over the last three months, primarily to experiment with the willingness and terms of the providers. Having successfully completed this exercise, we plan to attend “Equitana,” the largest equine trade show in the world, this coming June, to establish additional relationships for resale products.
The resale of products will take place primarily as we attend horse competition events around the state of Oklahoma, secondarily via our online catalog on our website, and third, to local residents and customers who visit our facility for the purchase of horses.
3. Limited line of GFX manufactured products.
We have identified a variety of horse and farm products that can be easily manufactured at our location with minimal investment in metalwork equipment and material. Examples that we have already identified include portable corrals, portable stalls, hay feeders, saddle-racks, and modular barns. Most of these items, and many more to be experimented with in the future, can be manufactured and sold direct to the public at prices far below the mainstream products they will imitate while simultaneously providing an exceptional profit margin to GFX.
The resale of our GFX manufactured products will take place primarily as we attend horse competition events around the state of Oklahoma, secondarily to local residents and customers who visit our facility for the purchase of horses, and third, via our online catalog on our website.
We have selected these three primary revenue opportunities specifically for each one’s ability to support the other two while complimenting our three primary sales strategies of Web commerce, event selling, and home retail location.
3.2 Competitive Comparison
The most obvious and general competitive edge possessed by GFX is the concept of “1-Stop Shopping.” There is a wealth of sources from which to purchase any of the items that we will be offering. However, we are not aware of a single source that has brought together all of the various products necessary to own a horse. This is particularly attractive to the pleasure horse buyer as they typically have a very limited scope of knowledge and are grateful (and willing to pay) for consolidation.
Another major competitive edge possessed by GFX is the experience and expertise of its management in business practices. A long and successful career in professional sales, marketing, and operational management gives me a foundation upon which to build this business that is extremely foreign to nearly all of the competitors. As is true in many businesses, it is often the experienced business person who is successful at a given venture while a person with an extensive background in an area fails. I have the unique ability to provide a competitive edge in simple business and marketing practices that the customers will recognize, appreciate, and reward, but of which the competitors, quite frankly, do not have a clue.
Nowhere is this more true than in the cornerstone of GFX, the resale of horses. It can not be stressed enough how wide open this large and profitable market is for the successful institution of professional selling practices. “Horse Trading” is a no-rules business as most who have ever purchased a horse have found out, and those who sell horses know. The most common theme among people who have contacted us during our experimentation stage is how grateful and appreciative they are of this approach.
Finally, the computer and Web skills we possess, particularly in contrast to our competitors in this business, offer a substantial competitive edge. Our ability to generate marketing material, create and publish digital images, and create and edit our own website provide tools that are necessary by default in today’s business environment.
Horses, tack, and equipment can be purchased from many sources. However they can not be purchased through a single source and are not represented with business, marketing, and sales expertise. Not, that is, until GFX receives this funding package and opens for business!
3.3 Sales Literature
One of the hidden assets of the GFX management team lies in their ability to create and publish quality sales literature independently.
The best example of this capability, and the central point for all future marketing efforts, is the GFX website. We encourage the reviewer of this document to visit this site now for a full review of these capabilities at: www.gfarmx.com.
Every facet of this website, its design, creation, upkeep, and modifications are accomplished entirely by Edward and Leanna Graves without the use of any external resource.
Display literature for events will also be produced on our home business computer system. Our computer knowledge, digital photographic equipment and expertise, graphic skills, and marketing experience makes this not only a realistic goal, but insures that we are able to create and modify appropriate and effective sales literature as needed, without delay, to respond to any immediate marketing need.
Market Analysis Summary
Ideally located on a state highway in central Oklahoma, GFX has access to a major market. It is our opinion that every rural household member living on five or more acres of property is a potential GFX customer.
The 1996 Census Projections reflects a total Oklahoma population of 3,358,044 persons living in 1,286,607 households. Of these, 39.8% live at a rural address making for 512,070 households with a total of 1,336,501 potential customers.
In addition however, GFX has also had positive contact from people in Texas, Missouri, Colorado, and Arkansas. That said, we believe our total available market to extend well into all of the states surrounding Oklahoma.
Of course, the Web marketing segment of GFX is virtually unrestricted by location and therefore provides access to the multi-million dollar equestrian market.
Americans have had, and continue to have a love affair with “The Horse” since the beginning of our economy. GFX will apply maximum effort and all of our cumulative skills to leverage this love affair on a local, regional, and national level.
Strategy and Implementation Summary
The successful Strategy and Implementation of GFX relies on the culmination of a lifetime of education and experience. We will utilize these life assets to execute the content of this plan beyond the projections contained herein. Broken into its simplest terms, the GFX strategy and implementation is based on these simple executables:
1. Five primary marketing methods:
- Website.
- Print.
- Event.
- The Internet.
- Referral.
2. Four primary product lines:
- Riding horses.
- Major tack & equipment.
- Minor tack & supplies.
- GFX manufactured product.
3. Three primary outlets:
- At our home facility.
- At horse events.
- On our website.
4. Two primary assets:
- Professional business skills and experience of Edward Graves.
- Horse knowledge and expertise of Leanna Graves.
5. One primary need:
- Funding to allow this plan to become a reality.
Together, we (Edward & Leanna Graves) possess every bit of experience, knowledge, ability, and proven history, to execute each of the key issues identified above. The only thing lacking is the financial resources to bring the GFX plan to fruition. Provide that single missing piece and the reviewer of this document will be “throwing the switch” on a long term, successful business entity known as GFX: Gravestat Farm Exchange.
5.1 Sales Strategy
We will be utilizing experienced sales skills to close sales once we are in contact with a prospective customer.
- For retail horse sales this will be accomplished through experienced pre-qualification and matching of horse to rider, utilizing our riding expertise to show the best aspects of the horse, and practicing basic sales skills to close the sale.
- For event sales this will be accomplished through standard “retail counter sales” skills and technique, along with the all important location, location, location (at the event with a captured target audience).
- For Web sales this will be accomplished through the creation and maintenance of a pleasurable, convenient, and comfortable Web catalog and online purchase capability.
5.2 Value Proposition
GFX offers the prospective or limited horse owner the opportunity to purchase a quality riding horse, along with all of the extras and essentials that are both necessary and desirable, in a uniquely professional and ethical business environment.
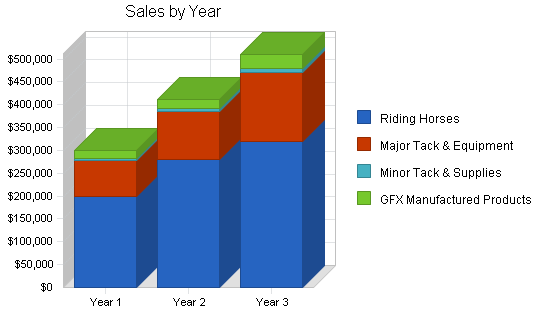
5.2.1 Sales Forecast
The following table and chart provides an extremely conservative forecast of GFX projected sales over the next three years. It shows a steady but realistic annual growth as GFX gains wider recognition in Oklahoma for riding horses, and nationally for tack and supply.
The following are anticipated positive influences over the attached forecast that have not been calculated in.
- Refinement of our overall product line presenting reduced Per Unit Cost.
- Increased discounts from our existing vendors resulting from quantity purchases.
- Increased discounts from new vendors seeking to gain our business.
- Potential exponentially increased sales with the successful implementation of a Web strategy.
- Potential exponentially increased sales with successful manufacturing and production of GFX Manufactured Products.
| Sales Forecast | |||
| Year 1 | Year 2 | Year 3 | |
| Unit Sales | |||
| Riding Horses | 124 | 175 | 200 |
| Major Tack & Equipment | 268 | 350 | 500 |
| Minor Tack & Supplies | 410 | 600 | 1,000 |
| GFX Manufactured Products | 162 | 200 | 300 |
| Total Unit Sales | 964 | 1,325 | 2,000 |
| Unit Prices | Year 1 | Year 2 | Year 3 |
| Riding Horses | $1,600.00 | $1,600.00 | $1,600.00 |
| Major Tack & Equipment | $300.00 | $300.00 | $300.00 |
| Minor Tack & Supplies | $10.00 | $10.00 | $10.00 |
| GFX Manufactured Products | $100.00 | $100.00 | $100.00 |
| Sales | |||
| Riding Horses | $198,400 | $280,000 | $320,000 |
| Major Tack & Equipment | $80,400 | $105,000 | $150,000 |
| Minor Tack & Supplies | $4,100 | $6,000 | $10,000 |
| GFX Manufactured Products | $16,200 | $20,000 | $30,000 |
| Total Sales | $299,100 | $411,000 | $510,000 |
| Direct Unit Costs | Year 1 | Year 2 | Year 3 |
| Riding Horses | $1,120.00 | $1,120.00 | $1,120.00 |
| Major Tack & Equipment | $210.00 | $210.00 | $210.00 |
| Minor Tack & Supplies | $7.00 | $7.00 | $7.00 |
| GFX Manufactured Products | $25.00 | $25.00 | $25.00 |
| Direct Cost of Sales | |||
| Riding Horses | $138,880 | $196,000 | $224,000 |
| Major Tack & Equipment | $56,280 | $73,500 | $105,000 |
| Minor Tack & Supplies | $2,870 | $4,200 | $7,000 |
| GFX Manufactured Products | $4,050 | $5,000 | $7,500 |
| Subtotal Direct Cost of Sales | $202,080 | $278,700 | $343,500 |
5.3 Marketing Strategy
The GFX Marketing Strategy relies on a variety of exposure methods, all targeted to yield maximum exposure from minimum expenditure. They include:
- Effective utilization of the Internet and our website will be a key factor in every marketing activity. It is our website that makes the most immediate differentiation between GFX and competing horse sellers.
- Cost effective print advertising in metropolitan newspapers, regional rural publications, regional horse publications, and association directories with the primary goal of driving traffic to our website.
- Attendance as a vendor at local horse competition events. With our proximity to three of the most active horse competition venues in America (Oklahoma City Fairgrounds, Tulsa Expo Square Fairgrounds, and Purcell Expo Center) we have the unique opportunity to attend major equestrian events without the expense of overnight travel. This will yield the opportunity to sell our tack and equipment products, while in the ideal situation to identify potential horse customers and invite them to visit our home facility.
- We will also utilize “e-blasts” by combining an internally kept database of contacts with an outgoing merged email message highlighting current offerings, specials, and informational tidbits.
- Finally, we will never underestimate, and intend to leverage to the fullest extent, simple positive word-of-mouth marketing. Every horse owner typically knows several other horse owners, and/or spikes the horse owning interest in others. GFX will leverage this highly effective marketing method by providing an exceptional customer buying experience and pleasurable business practice.
5.3.1 Positioning Statement
For the pleasure horse owner/buyer who wishes to own or add a horse but is not an expert in horses or horse care, GFX offers an ethical and professional “1-Stop Shop” to provide for all of their needs. Unlike the competitive forces in the market, GFX brings a complete line of products together with the horse itself while providing a safe and comfortable business environment.
5.3.2 Pricing Strategy
GFX will follow three primary pricing strategies in accordance with the three primary product lines:
- Riding Horses. Our prices for quality riding horses have already been experimented with, and well accepted by the target audience. We are able to price our horses substantially below the “registered bloodline” price asked by the standard horse ranch because our buyers have no need or desire for competition or breeding quality horses. However we have also found that we are able to price our horses above the prices asked by private individuals, horse traders, and auctions because the customer puts a substantial value on the level of comfort they gain by purchasing their horse from GFX, applying professional business practices. We have been able to regularly achieve a 30% markup on the resale of our horses.
- Resale Products. Our prices for resale products will be established just below the published list price put forth by our suppliers. This price comparison is made directly with our suppliers who typically sell online. In comparison with local retailers our prices are well below their own. In context of our resale discounts this typically equates (interestingly enough) to an average 30% markup over the discounted price we pay to our providers.
- GFX Manufactured Products. Products that we are able to manufacture ourselves result in the most attractive pricing proposition of all, to both us and the customer. Horse products, as with most special interest products, enjoy a ridiculous margin through standard outlets. Of the products we have investigated we find that we are able to produce like products for approximately 25% of the typical retail list price, mark them up an additional 60% above cost to produce, and still offer them for sale at approximately 15% less than the competing retail outlets. This provides a very nice profit margin and revenue stream from a limited product line.
The overall pricing strategy is “VALUE.” Value in the quality of products, value in the pricing of the products, and value for the business practices and methodology employed to sell the products.
5.4 Future Strategy
Not included within the tables, charts, and projections of this business plan is a future retail location from which GFX will continue and expand its’ operation.
- The retail location will be located off of I-44, at the Chandler exit, midway between Oklahoma City and Tulsa, Oklahoma (nine miles south of our current location).
- The retail location will increase retail tack sales without any negative impact on event or Web based sales. Retail tack buyers are accustomed, even prefer, to travel a slight distance to make saddle and tack purchases. The distance to, and rural location of, GFX will only serve to increase the perceived value of their purchase.
- The retail location, inclusive of a horse “show & sell lot” will further solidify the image of GFX as a truly unique and attractive entry in the horse sale business.
- The growing reputation of GFX coupled with the solidified image as a retail location will also increase retail horse sales.
- The retail location is targeted for opening during the third year of GFX operation, 2002, unless business factors indicate an accelerated schedule.
Given proper execution, there is no reason for the long term future of GFX not to include multiple locations. The same formula detailed within the context of this business proposal could certainly be carried to a number of other locations, initially in surrounding states, in which a major metropolitan area exists in a primarily rural geographic area; for example Louisiana, Arkansas, Missouri, Kansas, Colorado, & Texas would be prime targets for future expansion. It is not beyond reason to envision a chain of GFX locations offering a full line of tack and equine supply, along with the only legitimate riding horse sales companies in existance.
Should the reviewer of this plan feel that an accelerated schedule for the opening of the first GFX retail location is warranted, additional financial analysis will be provided detailing that scenario.
Management Summary
GFX will be co-managed by Edward A, and Leanna F, Graves; husband & wife, and co-owners of GFX. The combination of our talents and experience is one of the key assets to GFX.
Edward A. Graves. Successful 20 year career in sales, marketing, distribution management, operational management, and senior management culminating in current position as manager of U.S. fax sales and operations for Esker, S.A., an international software development company with projected 2000 sales of $47,000,000. In pursuit of this GFX business opportunity, tendered resignation with Esker, S.A. effective May 19, 2000 … much to the regret of Esker. GFX role: director of business affairs.
Leanna F. Graves. Partner in all home and business affairs. Has developed an extraordinary knowledge and experience base regarding all aspects of the horse. Exhibits exceptional expertise in: breeds, breeding, bloodline, medical care, conformation, desirability, marketability, training, and personality traits of the horse. GFX role: director of equine affairs.
GFX is in the horse business. Leanna is an expert in horses, Edward is an expert in business. The combination yields an extremely solid management team!
6.1 Management Team Gaps
The only significant weakness in the GFX management team lies in financial analysis and accounting principles. We intend to address these critical issues in the following ways:
- Continued business relationship with Ron Lamb, CPA, located in Cushing, Oklahoma, to provide accounting services and financial counseling. Ron has handled our financial affairs for over five years and has an in-depth knowledge and historical perspective on our financial needs and goals.
- Personal study in financial analysis and basic accounting principles.
- Identification of, and participation in, local seminars and/or classes in financial analysis and accounting principles.
Financial Plan
As has been stated throughout the content of this document, the financial analysis charts and tables contained herein have been built with two primary factors at the forefront of consideration:
- To provide an extremely conservative outlook for GFX based on minimum performance expectations rather than a “blue sky” outlook.
- To provide a healthy foundation for a long term business operation while supporting the financial needs of the home portion of a home based business. Corners have not been cut, expenses have not been hidden. Rather, this document and loan request has been specifically designed to secure the right amount of start-up funding to ensure a long and successful future for GFX.
We intend to seek, and welcome, continued education, counseling, and adjustments to this Financial Plan throughout the future of GFX.
7.1 Important Assumptions
The accompanying table lists our main assumptions for developing our financial projections.
The majority of the assumptions are based on raw average estimates suggested by the software program used to create this business plan. As GFX moves into full operation these figures will be monitored and adjusted according to actual business conditions.
Three Key Factors:
- Personnel Burden is listed, and will remain, at 0. GFX will be owned and operated solely by immediate family.
- Inventory turnover is listed at 12 to reflect one month of inventory in stock at all times. However, horses are typically “turned” within seven days, and all but a very limited inventory of tack and equipment will be ordered and shipped directly from the source upon customer order.
- GFX does not sell on credit terms. This is the norm (almost without exception) in the horse industry. GFX will only offer credit card purchases as an alternative to cash/check payment.
| General Assumptions | |||
| Year 1 | Year 2 | Year 3 | |
| Plan Month | 1 | 2 | 3 |
| Current Interest Rate | 10.00% | 10.00% | 10.00% |
| Long-term Interest Rate | 10.00% | 10.00% | 10.00% |
| Tax Rate | 25.42% | 25.00% | 25.42% |
| Other | 0 | 0 | 0 |
7.2 Break-even Analysis
The following table and chart show our break-even point.

| Break-even Analysis | |
| Monthly Units Break-even | 69 |
| Monthly Revenue Break-even | $21,312 |
| Assumptions: | |
| Average Per-Unit Revenue | $310.27 |
| Average Per-Unit Variable Cost | $209.63 |
| Estimated Monthly Fixed Cost | $6,913 |
7.3 Projected Profit and Loss
Two Critical Issues regarding the following GFX P&L Statement:
- The entire P&L statement, which stems from the Sales Forecast, is intended to reflect an extremely conservative projection. It does not indicate the full potential of GFX given the level of management and expertise that serves as the foundation of GFX. Rather, it has been created, by intent, to demonstrate the absolute minimum performance level expected during the period.
- It is of critical importance to note that, being a home based business and the sole source of income for our family, the expense portion of P&L contains virtually every expense, business and personal, conceivable. It does include such minute details as groceries, medicines, gas, daily cash, revolving credit, even “fast food,” etc.
A note to the reviewer: It is a simple matter to inflate sales projections, deflate cost of goods sold, and hide expenses for purposes of a business plan. Rather, since we are relying on this venture to provide the livelihood for our family, we have chosen to evaluate and present it far below the best case scenario. We hope that the reviewer of this document will take this into full consideration.


| Pro Forma Profit and Loss | |||
| Year 1 | Year 2 | Year 3 | |
| Sales | $299,100 | $411,000 | $510,000 |
| Direct Cost of Sales | $202,080 | $278,700 | $343,500 |
| Other | $0 | $0 | $0 |
| Total Cost of Sales | $202,080 | $278,700 | $343,500 |
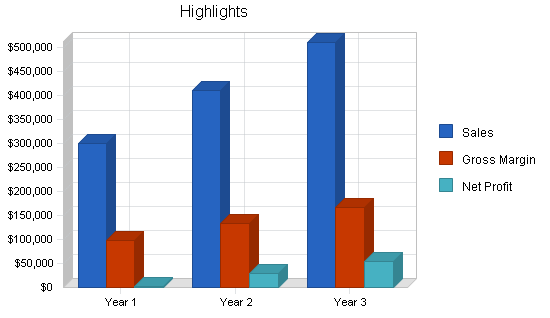
| Gross Margin | $97,020 | $132,300 | $166,500 |
| Gross Margin % | 32.44% | 32.19% | 32.65% |
| Expenses | |||
| Payroll | $0 | $0 | $0 |
| Sales and Marketing and Other Expenses | $70,416 | $70,416 | $70,416 |
| Depreciation | $0 | $0 | $0 |
| Depreciation | $0 | $0 | $0 |
| Leased Equipment | $1,020 | $1,020 | $1,020 |
| Utilities | $5,520 | $5,520 | $5,520 |
| Insurance | $6,000 | $6,000 | $6,000 |
| Rent | $0 | $0 | $0 |
| Payroll Taxes | $0 | $0 | $0 |
| Other | $0 | $0 | $0 |
| Total Operating Expenses | $82,956 | $82,956 | $82,956 |
| Profit Before Interest and Taxes | $14,064 | $49,344 | $83,544 |
| EBITDA | $14,064 | $49,344 | $83,544 |
| Interest Expense | $11,904 | $10,850 | $9,750 |
| Taxes Incurred | $248 | $9,623 | $18,756 |
| Net Profit | $1,911 | $28,870 | $55,038 |
| Net Profit/Sales | 0.64% | 7.02% | 10.79% |
7.4 Projected Cash Flow
The healthy state of the attached Cash Flow Table and Charts are, in themselves, the primary justification for this business loan request.
This loan request is intended to provide a solid foundation for the start-up and continued health of GFX. As a home based business, virtually every personal and business expense has been factored in. This has been done to ensure that personal expenses (food & shelter) do not prevent GFX from continuing operation. Rather, every calculation has taken these variables into account to ensure that the “home side” of our home business does not inhibit the “business side” of the business.
The all important Cash Balance figure remains at a healthy level, and shows growth, for the full period of this business plan to guarantee continued operation. However it also provides for sufficient cash flow to take advantage of positive business opportunities as they present themselves, and/or to absorb unexpected negative influences.

| Pro Forma Cash Flow | |||
| Year 1 | Year 2 | Year 3 | |
| Cash Received | |||
| Cash from Operations | |||
| Cash Sales | $299,100 | $411,000 | $510,000 |
| Subtotal Cash from Operations | $299,100 | $411,000 | $510,000 |
| Additional Cash Received | |||
| Sales Tax, VAT, HST/GST Received | $0 | $0 | $0 |
| New Current Borrowing | $0 | $0 | $0 |
| New Other Liabilities (interest-free) | $0 | $0 | $0 |
| New Long-term Liabilities | $0 | $0 | $0 |
| Sales of Other Current Assets | $0 | $0 | $0 |
| Sales of Long-term Assets | $0 | $0 | $0 |
| New Investment Received | $0 | $0 | $0 |
| Subtotal Cash Received | $299,100 | $411,000 | $510,000 |
| Expenditures | Year 1 | Year 2 | Year 3 |
| Expenditures from Operations | |||
| Cash Spending | $0 | $0 | $0 |
| Bill Payments | $269,122 | $408,135 | $459,562 |
| Subtotal Spent on Operations | $269,122 | $408,135 | $459,562 |
| Additional Cash Spent | |||
| Sales Tax, VAT, HST/GST Paid Out | $0 | $0 | $0 |
| Principal Repayment of Current Borrowing | $0 | $0 | $0 |
| Other Liabilities Principal Repayment | $0 | $0 | $0 |
| Long-term Liabilities Principal Repayment | $11,000 | $11,000 | $11,000 |
| Purchase Other Current Assets | $0 | $0 | $0 |
| Purchase Long-term Assets | $0 | $0 | $0 |
| Dividends | $0 | $0 | $0 |
| Subtotal Cash Spent | $280,122 | $419,135 | $470,562 |
| Net Cash Flow | $18,978 | ($8,135) | $39,438 |
| Cash Balance | $60,978 | $52,844 | $92,281 |
7.5 Projected Balance Sheet
The following Projected Balance Sheet was generated by the software program used to generate this business plan. As called out in the Management Gaps section, we are not well versed in its implications. We welcome consultation on this subject. As we fill the management gap in financial analysis, we will monitor and adjust this information accordingly.
| Pro Forma Balance Sheet | |||
| Year 1 | Year 2 | Year 3 | |
| Assets | |||
| Current Assets | |||
| Cash | $60,978 | $52,844 | $92,281 |
| Inventory | $32,527 | $44,860 | $55,290 |
| Other Current Assets | $0 | $0 | $0 |
| Total Current Assets | $93,505 | $97,704 | $147,571 |
| Long-term Assets | |||
| Long-term Assets | $0 | $0 | $0 |
| Accumulated Depreciation | $0 | $0 | $0 |
| Total Long-term Assets | $0 | $0 | $0 |
| Total Assets | $93,505 | $97,704 | $147,571 |
| Liabilities and Capital | Year 1 | Year 2 | Year 3 |
| Current Liabilities | |||
| Accounts Payable | $46,094 | $32,422 | $38,251 |
| Current Borrowing | $0 | $0 | $0 |
| Other Current Liabilities | $0 | $0 | $0 |
| Subtotal Current Liabilities | $46,094 | $32,422 | $38,251 |
| Long-term Liabilities | $114,000 | $103,000 | $92,000 |
| Total Liabilities | $160,094 | $135,422 | $130,251 |
| Paid-in Capital | $0 | $0 | $0 |
| Retained Earnings | ($68,500) | ($66,589) | ($37,718) |
| Earnings | $1,911 | $28,870 | $55,038 |
| Total Capital | ($66,589) | ($37,718) | $17,320 |
| Total Liabilities and Capital | $93,505 | $97,704 | $147,571 |
| Net Worth | ($66,589) | ($37,718) | $17,320 |
7.6 Business Ratios
The following Business Ratios Table was generated by the software program used to generate this business plan. As called out in the Management Gaps section, we are not well versed in its purpose nor implications. We welcome consultation on this subject. As we fill the management gap in financial analysis, we will monitor and adjust this information accordingly. The Industry Profile column contains statistics from the Standard Industry Code (SIC) #0752, Animal Specialty Services.
| Ratio Analysis | ||||
| Year 1 | Year 2 | Year 3 | Industry Profile | |
| Sales Growth | 0.00% | 37.41% | 24.09% | -2.90% |
| Percent of Total Assets | ||||
| Inventory | 34.79% | 45.91% | 37.47% | 8.20% |
| Other Current Assets | 0.00% | 0.00% | 0.00% | 31.90% |
| Total Current Assets | 100.00% | 100.00% | 100.00% | 55.90% |
| Long-term Assets | 0.00% | 0.00% | 0.00% | 44.10% |
| Total Assets | 100.00% | 100.00% | 100.00% | 100.00% |
| Current Liabilities | 49.30% | 33.18% | 25.92% | 32.70% |
| Long-term Liabilities | 121.92% | 105.42% | 62.34% | 19.90% |
| Total Liabilities | 171.21% | 138.60% | 88.26% | 52.60% |
| Net Worth | -71.21% | -38.60% | 11.74% | 47.40% |
| Percent of Sales | ||||
| Sales | 100.00% | 100.00% | 100.00% | 100.00% |
| Gross Margin | 32.44% | 32.19% | 32.65% | 42.50% |
| Selling, General & Administrative Expenses | 32.05% | 25.47% | 22.20% | 26.40% |
| Advertising Expenses | 2.01% | 1.46% | 1.18% | 0.50% |
| Profit Before Interest and Taxes | 4.70% | 12.01% | 16.38% | 2.40% |
| Main Ratios | ||||
| Current | 2.03 | 3.01 | 3.86 | 2.19 |
| Quick | 1.32 | 1.63 | 2.41 | 1.48 |
| Total Debt to Total Assets | 171.21% | 138.60% | 88.26% | 52.60% |
| Pre-tax Return on Net Worth | -3.24% | -102.06% | 426.06% | 4.50% |
| Pre-tax Return on Assets | 2.31% | 39.40% | 50.01% | 9.40% |
| Additional Ratios | Year 1 | Year 2 | Year 3 | |
| Net Profit Margin | 0.64% | 7.02% | 10.79% | n.a |
| Return on Equity | 0.00% | 0.00% | 317.77% | n.a |
| Activity Ratios | ||||
| Inventory Turnover | 10.71 | 7.20 | 6.86 | n.a |
| Accounts Payable Turnover | 6.84 | 12.17 | 12.17 | n.a |
| Payment Days | 27 | 36 | 28 | n.a |
| Total Asset Turnover | 3.20 | 4.21 | 3.46 | n.a |
| Debt Ratios | ||||
| Debt to Net Worth | 0.00 | 0.00 | 7.52 | n.a |
| Current Liab. to Liab. | 0.29 | 0.24 | 0.29 | n.a |
| Liquidity Ratios | ||||
| Net Working Capital | $47,412 | $65,282 | $109,320 | n.a |
| Interest Coverage | 1.18 | 4.55 | 8.57 | n.a |
| Additional Ratios | ||||
| Assets to Sales | 0.31 | 0.24 | 0.29 | n.a |
| Current Debt/Total Assets | 49% | 33% | 26% | n.a |
| Acid Test | 1.32 | 1.63 | 2.41 | n.a |
| Sales/Net Worth | 0.00 | 0.00 | 29.45 | n.a |
| Dividend Payout | 0.00 | 0.00 | 0.00 | n.a |
Appendix
| Sales Forecast | |||||||||||||
| Month 1 | Month 2 | Month 3 | Month 4 | Month 5 | Month 6 | Month 7 | Month 8 | Month 9 | Month 10 | Month 11 | Month 12 | ||
| Unit Sales | |||||||||||||
| Riding Horses | 0% | 4 | 6 | 12 | 12 | 12 | 12 | 10 | 12 | 8 | 8 | 12 | 16 |
| Major Tack & Equipment | 0% | 2 | 6 | 10 | 15 | 20 | 20 | 25 | 35 | 25 | 25 | 35 | 50 |
| Minor Tack & Supplies | 0% | 5 | 10 | 15 | 20 | 25 | 30 | 35 | 40 | 45 | 50 | 60 | 75 |
| GFX Manufactured Products | 0% | 0 | 2 | 5 | 10 | 15 | 20 | 15 | 20 | 15 | 15 | 20 | 25 |
| Total Unit Sales | 11 | 24 | 42 | 57 | 72 | 82 | 85 | 107 | 93 | 98 | 127 | 166 | |
| Unit Prices | Month 1 | Month 2 | Month 3 | Month 4 | Month 5 | Month 6 | Month 7 | Month 8 | Month 9 | Month 10 | Month 11 | Month 12 | |
| Riding Horses | $1,600.00 | $1,600.00 | $1,600.00 | $1,600.00 | $1,600.00 | $1,600.00 | $1,600.00 | $1,600.00 | $1,600.00 | $1,600.00 | $1,600.00 | $1,600.00 | |
| Major Tack & Equipment | $300.00 | $300.00 | $300.00 | $300.00 | $300.00 | $300.00 | $300.00 | $300.00 | $300.00 | $300.00 | $300.00 | $300.00 | |
| Minor Tack & Supplies | $10.00 | $10.00 | $10.00 | $10.00 | $10.00 | $10.00 | $10.00 | $10.00 | $10.00 | $10.00 | $10.00 | $10.00 | |
| GFX Manufactured Products | $100.00 | $100.00 | $100.00 | $100.00 | $100.00 | $100.00 | $100.00 | $100.00 | $100.00 | $100.00 | $100.00 | $100.00 | |
| Sales | |||||||||||||
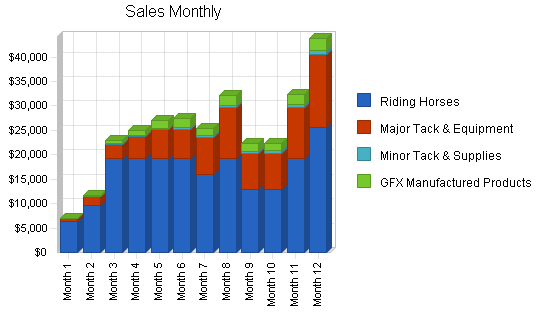
| Riding Horses | $6,400 | $9,600 | $19,200 | $19,200 | $19,200 | $19,200 | $16,000 | $19,200 | $12,800 | $12,800 | $19,200 | $25,600 | |
| Major Tack & Equipment | $600 | $1,800 | $3,000 | $4,500 | $6,000 | $6,000 | $7,500 | $10,500 | $7,500 | $7,500 | $10,500 | $15,000 | |
| Minor Tack & Supplies | $50 | $100 | $150 | $200 | $250 | $300 | $350 | $400 | $450 | $500 | $600 | $750 | |
| GFX Manufactured Products | $0 | $200 | $500 | $1,000 | $1,500 | $2,000 | $1,500 | $2,000 | $1,500 | $1,500 | $2,000 | $2,500 | |
| Total Sales | $7,050 | $11,700 | $22,850 | $24,900 | $26,950 | $27,500 | $25,350 | $32,100 | $22,250 | $22,300 | $32,300 | $43,850 | |
| Direct Unit Costs | Month 1 | Month 2 | Month 3 | Month 4 | Month 5 | Month 6 | Month 7 | Month 8 | Month 9 | Month 10 | Month 11 | Month 12 | |
| Riding Horses | 0.00% | $1,120.00 | $1,120.00 | $1,120.00 | $1,120.00 | $1,120.00 | $1,120.00 | $1,120.00 | $1,120.00 | $1,120.00 | $1,120.00 | $1,120.00 | $1,120.00 |
| Major Tack & Equipment | 0.00% | $210.00 | $210.00 | $210.00 | $210.00 | $210.00 | $210.00 | $210.00 | $210.00 | $210.00 | $210.00 | $210.00 | $210.00 |
| Minor Tack & Supplies | 0.00% | $7.00 | $7.00 | $7.00 | $7.00 | $7.00 | $7.00 | $7.00 | $7.00 | $7.00 | $7.00 | $7.00 | $7.00 |
| GFX Manufactured Products | 0.00% | $25.00 | $25.00 | $25.00 | $25.00 | $25.00 | $25.00 | $25.00 | $25.00 | $25.00 | $25.00 | $25.00 | $25.00 |
| Direct Cost of Sales | |||||||||||||
| Riding Horses | $4,480 | $6,720 | $13,440 | $13,440 | $13,440 | $13,440 | $11,200 | $13,440 | $8,960 | $8,960 | $13,440 | $17,920 | |
| Major Tack & Equipment | $420 | $1,260 | $2,100 | $3,150 | $4,200 | $4,200 | $5,250 | $7,350 | $5,250 | $5,250 | $7,350 | $10,500 | |
| Minor Tack & Supplies | $35 | $70 | $105 | $140 | $175 | $210 | $245 | $280 | $315 | $350 | $420 | $525 | |
| GFX Manufactured Products | $0 | $50 | $125 | $250 | $375 | $500 | $375 | $500 | $375 | $375 | $500 | $625 | |
| Subtotal Direct Cost of Sales | $4,935 | $8,100 | $15,770 | $16,980 | $18,190 | $18,350 | $17,070 | $21,570 | $14,900 | $14,935 | $21,710 | $29,570 | |
| General Assumptions | |||||||||||||
| Month 1 | Month 2 | Month 3 | Month 4 | Month 5 | Month 6 | Month 7 | Month 8 | Month 9 | Month 10 | Month 11 | Month 12 | ||
| Plan Month | 1 | 2 | 3 | 4 | 5 | 6 | 7 | 8 | 9 | 10 | 11 | 12 | |
| Current Interest Rate | 10.00% | 10.00% | 10.00% | 10.00% | 10.00% | 10.00% | 10.00% | 10.00% | 10.00% | 10.00% | 10.00% | 10.00% | |
| Long-term Interest Rate | 10.00% | 10.00% | 10.00% | 10.00% | 10.00% | 10.00% | 10.00% | 10.00% | 10.00% | 10.00% | 10.00% | 10.00% | |
| Tax Rate | 30.00% | 25.00% | 25.00% | 25.00% | 25.00% | 25.00% | 25.00% | 25.00% | 25.00% | 25.00% | 25.00% | 25.00% | |
| Other | 0 | 0 | 0 | 0 | 0 | 0 | 0 | 0 | 0 | 0 | 0 | 0 | |
| Pro Forma Profit and Loss | |||||||||||||
| Month 1 | Month 2 | Month 3 | Month 4 | Month 5 | Month 6 | Month 7 | Month 8 | Month 9 | Month 10 | Month 11 | Month 12 | ||
| Sales | $7,050 | $11,700 | $22,850 | $24,900 | $26,950 | $27,500 | $25,350 | $32,100 | $22,250 | $22,300 | $32,300 | $43,850 | |
| Direct Cost of Sales | $4,935 | $8,100 | $15,770 | $16,980 | $18,190 | $18,350 | $17,070 | $21,570 | $14,900 | $14,935 | $21,710 | $29,570 | |
| Other | $0 | $0 | $0 | $0 | $0 | $0 | $0 | $0 | $0 | $0 | $0 | $0 | |
| Total Cost of Sales | $4,935 | $8,100 | $15,770 | $16,980 | $18,190 | $18,350 | $17,070 | $21,570 | $14,900 | $14,935 | $21,710 | $29,570 | |
| Gross Margin | $2,115 | $3,600 | $7,080 | $7,920 | $8,760 | $9,150 | $8,280 | $10,530 | $7,350 | $7,365 | $10,590 | $14,280 | |
| Gross Margin % | 30.00% | 30.77% | 30.98% | 31.81% | 32.50% | 33.27% | 32.66% | 32.80% | 33.03% | 33.03% | 32.79% | 32.57% | |
| Expenses | |||||||||||||
| Payroll | $0 | $0 | $0 | $0 | $0 | $0 | $0 | $0 | $0 | $0 | $0 | $0 | |
| Sales and Marketing and Other Expenses | $5,868 | $5,868 | $5,868 | $5,868 | $5,868 | $5,868 | $5,868 | $5,868 | $5,868 | $5,868 | $5,868 | $5,868 | |
| Depreciation | $0 | $0 | $0 | $0 | $0 | $0 | $0 | $0 | $0 | $0 | $0 | $0 | |
| Depreciation | $0 | $0 | $0 | $0 | $0 | $0 | $0 | $0 | $0 | $0 | $0 | $0 | |
| Leased Equipment | $85 | $85 | $85 | $85 | $85 | $85 | $85 | $85 | $85 | $85 | $85 | $85 | |
| Utilities | $460 | $460 | $460 | $460 | $460 | $460 | $460 | $460 | $460 | $460 | $460 | $460 | |
| Insurance | $500 | $500 | $500 | $500 | $500 | $500 | $500 | $500 | $500 | $500 | $500 | $500 | |
| Rent | $0 | $0 | $0 | $0 | $0 | $0 | $0 | $0 | $0 | $0 | $0 | $0 | |
| Payroll Taxes | 15% | $0 | $0 | $0 | $0 | $0 | $0 | $0 | $0 | $0 | $0 | $0 | $0 |
| Other | $0 | $0 | $0 | $0 | $0 | $0 | $0 | $0 | $0 | $0 | $0 | $0 | |
| Total Operating Expenses | $6,913 | $6,913 | $6,913 | $6,913 | $6,913 | $6,913 | $6,913 | $6,913 | $6,913 | $6,913 | $6,913 | $6,913 | |
| Profit Before Interest and Taxes | ($4,798) | ($3,313) | $167 | $1,007 | $1,847 | $2,237 | $1,367 | $3,617 | $437 | $452 | $3,677 | $7,367 | |
| EBITDA | ($4,798) | ($3,313) | $167 | $1,007 | $1,847 | $2,237 | $1,367 | $3,617 | $437 | $452 | $3,677 | $7,367 | |
| Interest Expense | $1,034 | $1,026 | $1,019 | $1,011 | $1,003 | $996 | $988 | $981 | $973 | $965 | $958 | $950 | |
| Taxes Incurred | ($1,750) | ($1,085) | ($213) | ($1) | $211 | $310 | $95 | $659 | ($134) | ($128) | $680 | $1,604 | |
| Net Profit | ($4,082) | ($3,255) | ($639) | ($3) | $633 | $931 | $284 | $1,977 | ($402) | ($385) | $2,040 | $4,813 | |
| Net Profit/Sales | -57.91% | -27.82% | -2.80% | -0.01% | 2.35% | 3.38% | 1.12% | 6.16% | -1.81% | -1.73% | 6.31% | 10.98% | |
| Pro Forma Cash Flow | |||||||||||||
| Month 1 | Month 2 | Month 3 | Month 4 | Month 5 | Month 6 | Month 7 | Month 8 | Month 9 | Month 10 | Month 11 | Month 12 | ||
| Cash Received | |||||||||||||
| Cash from Operations | |||||||||||||
| Cash Sales | $7,050 | $11,700 | $22,850 | $24,900 | $26,950 | $27,500 | $25,350 | $32,100 | $22,250 | $22,300 | $32,300 | $43,850 | |
| Subtotal Cash from Operations | $7,050 | $11,700 | $22,850 | $24,900 | $26,950 | $27,500 | $25,350 | $32,100 | $22,250 | $22,300 | $32,300 | $43,850 | |
| Additional Cash Received | |||||||||||||
| Sales Tax, VAT, HST/GST Received | 0.00% | $0 | $0 | $0 | $0 | $0 | $0 | $0 | $0 | $0 | $0 | $0 | $0 |
| New Current Borrowing | $0 | $0 | $0 | $0 | $0 | $0 | $0 | $0 | $0 | $0 | $0 | $0 | |
| New Other Liabilities (interest-free) | $0 | $0 | $0 | $0 | $0 | $0 | $0 | $0 | $0 | $0 | $0 | $0 | |
| New Long-term Liabilities | $0 | $0 | $0 | $0 | $0 | $0 | $0 | $0 | $0 | $0 | $0 | $0 | |
| Sales of Other Current Assets | $0 | $0 | $0 | $0 | $0 | $0 | $0 | $0 | $0 | $0 | $0 | $0 | |
| Sales of Long-term Assets | $0 | $0 | $0 | $0 | $0 | $0 | $0 | $0 | $0 | $0 | $0 | $0 | |
| New Investment Received | $0 | $0 | $0 | $0 | $0 | $0 | $0 | $0 | $0 | $0 | $0 | $0 | |
| Subtotal Cash Received | $7,050 | $11,700 | $22,850 | $24,900 | $26,950 | $27,500 | $25,350 | $32,100 | $22,250 | $22,300 | $32,300 | $43,850 | |
| Expenditures | Month 1 | Month 2 | Month 3 | Month 4 | Month 5 | Month 6 | Month 7 | Month 8 | Month 9 | Month 10 | Month 11 | Month 12 | |
| Expenditures from Operations | |||||||||||||
| Cash Spending | $0 | $0 | $0 | $0 | $0 | $0 | $0 | $0 | $0 | $0 | $0 | $0 | |
| Bill Payments | $207 | $6,467 | $14,887 | $31,736 | $26,281 | $27,618 | $26,642 | $24,038 | $34,414 | $15,562 | $23,223 | $38,045 | |
| Subtotal Spent on Operations | $207 | $6,467 | $14,887 | $31,736 | $26,281 | $27,618 | $26,642 | $24,038 | $34,414 | $15,562 | $23,223 | $38,045 | |
| Additional Cash Spent | |||||||||||||
| Sales Tax, VAT, HST/GST Paid Out | $0 | $0 | $0 | $0 | $0 | $0 | $0 | $0 | $0 | $0 | $0 | $0 | |
| Principal Repayment of Current Borrowing | $0 | $0 | $0 | $0 | $0 | $0 | $0 | $0 | $0 | $0 | $0 | $0 | |
| Other Liabilities Principal Repayment | $0 | $0 | $0 | $0 | $0 | $0 | $0 | $0 | $0 | $0 | $0 | $0 | |
| Long-term Liabilities Principal Repayment | $917 | $917 | $917 | $917 | $917 | $917 | $917 | $917 | $917 | $917 | $917 | $917 | |
| Purchase Other Current Assets | $0 | $0 | $0 | $0 | $0 | $0 | $0 | $0 | $0 | $0 | $0 | $0 | |
| Purchase Long-term Assets | $0 | $0 | $0 | $0 | $0 | $0 | $0 | $0 | $0 | $0 | $0 | $0 | |
| Dividends | $0 | $0 | $0 | $0 | $0 | $0 | $0 | $0 | $0 | $0 | $0 | $0 | |
| Subtotal Cash Spent | $1,123 | $7,384 | $15,804 | $32,653 | $27,198 | $28,535 | $27,559 | $24,955 | $35,331 | $16,479 | $24,140 | $38,962 | |
| Net Cash Flow | $5,927 | $4,316 | $7,046 | ($7,753) | ($248) | ($1,035) | ($2,209) | $7,145 | ($13,081) | $5,821 | $8,160 | $4,888 | |
| Cash Balance | $47,927 | $52,243 | $59,289 | $51,536 | $51,288 | $50,253 | $48,044 | $55,189 | $42,109 | $47,930 | $56,090 | $60,978 | |
| Pro Forma Balance Sheet | |||||||||||||
| Month 1 | Month 2 | Month 3 | Month 4 | Month 5 | Month 6 | Month 7 | Month 8 | Month 9 | Month 10 | Month 11 | Month 12 | ||
| Assets | Starting Balances | ||||||||||||
| Current Assets | |||||||||||||
| Cash | $42,000 | $47,927 | $52,243 | $59,289 | $51,536 | $51,288 | $50,253 | $48,044 | $55,189 | $42,109 | $47,930 | $56,090 | $60,978 |
| Inventory | $14,500 | $9,565 | $8,910 | $17,347 | $18,678 | $20,009 | $20,185 | $18,777 | $23,727 | $16,390 | $16,429 | $23,881 | $32,527 |
| Other Current Assets | $0 | $0 | $0 | $0 | $0 | $0 | $0 | $0 | $0 | $0 | $0 | $0 | $0 |
| Total Current Assets | $56,500 | $57,492 | $61,153 | $76,636 | $70,214 | $71,297 | $70,438 | $66,821 | $78,916 | $58,499 | $64,359 | $79,971 | $93,505 |
| Long-term Assets | |||||||||||||
| Long-term Assets | $0 | $0 | $0 | $0 | $0 | $0 | $0 | $0 | $0 | $0 | $0 | $0 | $0 |
| Accumulated Depreciation | $0 | $0 | $0 | $0 | $0 | $0 | $0 | $0 | $0 | $0 | $0 | $0 | $0 |
| Total Long-term Assets | $0 | $0 | $0 | $0 | $0 | $0 | $0 | $0 | $0 | $0 | $0 | $0 | $0 |
| Total Assets | $56,500 | $57,492 | $61,153 | $76,636 | $70,214 | $71,297 | $70,438 | $66,821 | $78,916 | $58,499 | $64,359 | $79,971 | $93,505 |
| Liabilities and Capital | Month 1 | Month 2 | Month 3 | Month 4 | Month 5 | Month 6 | Month 7 | Month 8 | Month 9 | Month 10 | Month 11 | Month 12 | |
| Current Liabilities | |||||||||||||
| Accounts Payable | $0 | $5,991 | $13,823 | $30,862 | $25,360 | $26,727 | $25,854 | $22,869 | $33,904 | $14,804 | $21,966 | $36,456 | $46,094 |
| Current Borrowing | $0 | $0 | $0 | $0 | $0 | $0 | $0 | $0 | $0 | $0 | $0 | $0 | $0 |
| Other Current Liabilities | $0 | $0 | $0 | $0 | $0 | $0 | $0 | $0 | $0 | $0 | $0 | $0 | $0 |
| Subtotal Current Liabilities | $0 | $5,991 | $13,823 | $30,862 | $25,360 | $26,727 | $25,854 | $22,869 | $33,904 | $14,804 | $21,966 | $36,456 | $46,094 |
| Long-term Liabilities | $125,000 | $124,083 | $123,167 | $122,250 | $121,333 | $120,417 | $119,500 | $118,583 | $117,667 | $116,750 | $115,833 | $114,917 | $114,000 |
| Total Liabilities | $125,000 | $130,074 | $136,990 | $153,112 | $146,693 | $147,143 | $145,354 | $141,453 | $151,570 | $131,554 | $137,799 | $151,373 | $160,094 |
| Paid-in Capital | $0 | $0 | $0 | $0 | $0 | $0 | $0 | $0 | $0 | $0 | $0 | $0 | $0 |
| Retained Earnings | ($68,500) | ($68,500) | ($68,500) | ($68,500) | ($68,500) | ($68,500) | ($68,500) | ($68,500) | ($68,500) | ($68,500) | ($68,500) | ($68,500) | ($68,500) |
| Earnings | $0 | ($4,082) | ($7,337) | ($7,976) | ($7,979) | ($7,346) | ($6,415) | ($6,131) | ($4,154) | ($4,556) | ($4,941) | ($2,901) | $1,911 |
| Total Capital | ($68,500) | ($72,582) | ($75,837) | ($76,476) | ($76,479) | ($75,846) | ($74,915) | ($74,631) | ($72,654) | ($73,056) | ($73,441) | ($71,401) | ($66,589) |
| Total Liabilities and Capital | $56,500 | $57,492 | $61,153 | $76,636 | $70,214 | $71,297 | $70,438 | $66,821 | $78,916 | $58,499 | $64,359 | $79,971 | $93,505 |
| Net Worth | ($68,500) | ($72,582) | ($75,837) | ($76,476) | ($76,479) | ($75,846) | ($74,915) | ($74,631) | ($72,654) | ($73,056) | ($73,441) | ($71,401) | ($66,589) |


