
Equine Acres
Executive Summary
EquineAcres is a recreational real estate development project. It is not a horse business. That said, …
Who in business today does not know and love the story of a poor migrant gentleman by the name of Levi Strauss? But just in case, and since it holds such a striking resemblance to the future story of EquineAcres, a short recap of that story is presented here.
Levi Strauss arrived in California during the great gold rush. He, along with tens-of-thousands of others, had their sights set on bringing in the “big strike” and living wealthy for the remainder of their lives. But Levi was an observant man. While the pull to the gold fields was powerful, he could not help but notice the 1,000 who came back penniless for every 1 who came back with gold. He also noticed that there was a shortage of supplies and that, to the last, those who were supplying those headed for the gold fields made their “big strike” without ever leaving the comfort of the city. One of the commodities in particularly short supply was canvas. Levi wired his “grub stake” back to relatives in the East with instructions to purchase all the canvas they could and have it shipped to him in San Francisco. His canvas arrived and he sold it at an incredible margin in mere days. He ordered more, sold more, and ordered more still. Soon he was supplying all sorts of supplies to those headed for the “gold.” Levi never did seek his fortune in the gold fields. Rather, he found his fortune supplying those who were going. The rest, as they say, is history with the Levi Strauss Company now a member of the global Fortune 1000 with more than 100 years of profitable and successful business.
EquineAcres will follow this same simple business concept. The equine industry is a multi-billion dollar American industry with Oklahoma ranked 4th in activity. The writer of this business plan has already “gone to the gold fields,” and come up wanting, i.e., already participated in the typical form of equine business and found it (as so many have) without financial reward. But as we all know, blessings can often be mixed, and thus is the case with this business proposal. The EquineAcres business plan presented here is the direct result of experience in the equine business which has identified the real, “big strike.” EquineAcres is not directly involved with the horse business. EquineAcres meets the needs and desires of those who are. Thank you, Mr. Strauss.
In short, and to be validated throughout the content of this business plan, EquineAcres will utilize the business knowledge and experience of a 20-year successful professional career, while leveraging existing business contacts, target market knowledge, and relationships, to penetrate a grossly under-served market in an extremely lucrative industry, with an attractive set of products and services in a format virtually unavailable heretofore, thereby creating an extremely profitable and expandable business entity ideally suited for exponential expansion.
The reviewer of this business plan is hereby invited and encouraged to review it’s content in the greatest of detail. Upon recognizing the potential, to then contact the originator for further discussions in route to establishing a mutually profitable and rewarding business relationship.
1.1 Mission
EquineAcres is a clean, attractive, well run resort community dedicated to horses and their owners. Primary focus for horses is placed upon exceptional care and 24-hour monitoring, health, safety, and security. For the owners, primary focus is placed upon providing a community atmosphere, professional and reliable business operations, competitive pricing of a complete range of equine products and services, and a full service facility ideally suited to meet all of their equestrian needs. Above all, customer service, professional staff and business operations, and the good of the community, will supersede all other issues at all times.
1.2 Keys to Success
The primary keys to the success of EquineAcres are as follows:
-
Maintaining a 100% lease rate.
- Maintaining a minimum 75% of product & services sales goals.
- Providing a unique, fulfilling, enjoyable retreat community atmosphere for the lessors.
- Providing a complete range of equestrian products and services to capture the maximum revenue from lessors.
- Providing a return on investment substantial enough to fund the opening of two additional EquineAcres facilities, one each serving the Tulsa and Oklahoma City markets.
1.3 Objectives
There will be five primary objectives by which the success of EquineAcres will be tracked:
-
Percentage of leased lots, 10 available leases: 80% = minimum, 90% = acceptable medium, 100% = primary goal.
- Percentage of maximum occupancy, 30 available equine residencies: 80% = minimum, 90% = acceptable medium, 100% = primary goal.
- Percentage of residency feed purchase from EquineAcres: 75% = minimum, 90% = acceptable medium, 100% = primary goal.
- Percentage of monthly product sales goal of $2,500: 75% ($1,875) = minimum, 90% ($2,250) = acceptable medium, 100% ($2,750) = primary goal.
- Percentage of monthly services sales goal of $1,450: 75% ($1,075) = minimum, 90% ($1,300) = acceptable medium, 110% ($1,600) = primary goal.
Company Summary
EquineAcres is a unique community environment catering to the unfulfilled needs of the equine owner. It is not a new concept, it is only new to the equine market which is massive, particular in Oklahoma. Golf communities, tennis resorts, and weekend retreats are all commonplace, but this well established theme as not been applied to the equine owner even though this special interest group is every bit as affluent and passionate as any golf or tennis player.
Until now, the equine owner has been forced to go to a variety of sources to accomplish what EquineAcres will put into a single, well run, facility. EquineAcres will provide a single source for the boarding, care, representation, serious practice, and playful enjoyment of the owner and their horse. In addition however, it will provide a community atmosphere designed to meet the emotional and social needs of the owners.
2.1 Start-up Summary
Important notes about the Start-up Table:
An overview of Start-up Requirements follows:
-
The total investment needed to open EquineAcres = $150,000.
-
Includes all land, equipment, inventory, and improvements to open.
-
Includes six months operating capital: owner salary + loan payments + monthly expenses.
-
-
EquineAcres hopes to secure funding for the full amount = $150,000.

| Start-up | |
| Requirements | |
| Start-up Expenses | |
| Buildings: Central Barn + BarnRooms | $17,000 |
| Improvements: Survey,Fence,Utilities,etc | $25,000 |
| Operating Equipment | $7,500 |
| Insurance | $400 |
| Marketing: Printed & Internet | $2,000 |
| Financial & Legal Counsel | $1,000 |
| Misc. Expense | $5,100 |
| Total Start-up Expenses | $58,000 |
| Start-up Assets | |
| Cash Required | $27,000 |
| Start-up Inventory | $5,000 |
| Other Current Assets | $0 |
| Long-term Assets | $60,000 |
| Total Assets | $92,000 |
| Total Requirements | $150,000 |
| Start-up Funding | |
| Start-up Expenses to Fund | $58,000 |
| Start-up Assets to Fund | $92,000 |
| Total Funding Required | $150,000 |
| Assets | |
| Non-cash Assets from Start-up | $65,000 |
| Cash Requirements from Start-up | $27,000 |
| Additional Cash Raised | $0 |
| Cash Balance on Starting Date | $27,000 |
| Total Assets | $92,000 |
| Liabilities and Capital | |
| Liabilities | |
| Current Borrowing | $0 |
| Long-term Liabilities | $150,000 |
| Accounts Payable (Outstanding Bills) | $0 |
| Other Current Liabilities (interest-free) | $0 |
| Total Liabilities | $150,000 |
| Capital | |
| Planned Investment | |
| Investor 1 | $0 |
| Other | $0 |
| Additional Investment Requirement | $0 |
| Total Planned Investment | $0 |
| Loss at Start-up (Start-up Expenses) | ($58,000) |
| Total Capital | ($58,000) |
| Total Capital and Liabilities | $92,000 |
| Total Funding | $150,000 |
2.2 Company Ownership
The final legal business entity format of EquineAcres is yet to be determined. Lender/investor preferences, along with legal/financial counsel, will make this final determination prior to, and as a condition of, funding.
2.3 Company Locations and Facilities
EquineAcres will be situated on a 160 acre, unimproved, “section” of land within one mile of a State Highway, in Central Oklahoma. This location will be within a 30 minute drive from the following cities: Stillwater, Guthrie, Chandler, Cushing, and Perkins, Oklahoma. It will be within 30 minutes drive from Oklahoma State University and Langston University. This area has been chosen because of its strategic location to several affluent markets and potential customers, ample land availability, and relatively low cost/acre of land. The intent is to secure an immediate purchase of 80 acres, with a two year lease option (including usage rights) on the additional 80 acres.

The 160 acre tract will then be developed to incorporate:
- 10: 5-acre tracts, each with perimeter fencing, private barn room, 110v electrical service, and water in.
- Central barn with close care stalls, tack shop, office, and public restrooms.
- Lighted arena for exclusive use of members and guests.
- Round-pens (2) for exclusive use of members and guests.
- Temporary holding pens (5) for new, sick, or problem horses.
- 80 acres (leased) for pleasure riding, trail practice, picnicking, etc. of members and guests.
- Gravel road from entry gate throughout facility.
The entire facility will be landscaped and coordinated to express the community retreat theme.
Products and Services
EquineAcres is designed to provide, first and foremost, a single source for the equine owner. It will provide everything from a place of equine boarding, practice, and enjoyment, through a full range of products and services necessary to support the horse, to a community atmosphere designed to meet the emotional and social needs of the members.
3.1 Product and Service Description
The following is a detailed listing of the initial products and services available to EquineAcres members and guests.
Membership Lease
- One 5-acre retreat w/private barn room, water, and electricity.
- Full board including twice a day feeding and visual inspection.
- Weekly computerized reports detailing all horse activity.
- Computer horse history report assembled from owner records.
- Locked-gate security.
- Access to 24-hour “vet on call.”
- Access to on-site farrier.
- Access to EquineAcres products and services.
Feed and Hay
EquineAcres (EA) will offer feed and hay for purchase by members. Current business contacts and volume purchase capability will provide the ability for EA to purchase well below market cost. Since the feed and hay will be available at EA, this will also allow for the resale of these products to EA members slightly above average retail cost.
Tack and Supply
EA will also offer tack and horse supply in the same scenario as cited above. However, EA will also continue the resale of tack related items via the Internet. The Internet resale of these products has been well established in past and present business operations.
Web Service
EA will offer website design and hosting to its members. This will be available at a low cost as an additional “page” on the EA home page, and at a higher cost as a completely independent website. EA possesses the business contacts and necessary technical expertise to conduct this business.
Contract Services
EA will contract with local horse services. This may include “vet on call,” farrier, trainers, and more to-be-decided services. EA will contract to receive a percentage of revenue from contractors in exchange for marketing their services to EA members.
Close Care
EA will offer four stalls in the central barn for close care of member horses for an additional per night fee. Uses might include sick horses, foaling mares, and horses being prepared for show/sale.
Horse Sales
EA will offer a service by which a horse may be featured on the EA home page for sale. EA will also be available to field calls about the horse, show the horse to prospective buyers, and provide a “show room” for horses being offered to sale. A separate resale service contract will be executed with a commission paid to EA upon sale of the horse.
Food Vendor
EA will contract with a local mobile food vendor (event style) for weekends and special events. A percentage will be paid to EA.
Special Events
EA will host special events on a regular basis (one per month). These may include clinics, play-days, and barn-dances. Each of these will provide an opportunity for additional incremental revenue from guests and hosts alike.
Barn Rooms
EA has contracted with a local builder to design and build these unique Barn Rooms for resale as an external product. EA cost to purchase these pre-fabricated kits is $1,000 each and the market will easily bear resale at $2,000 each.
To-Be-Decided
Additional Products and Services will be added to the EquineAcres menu as sources and demand are identified.
3.2 Sales Literature
Sales Literature for EquineAcres will exist in three forms, each pointing to the primary website:
- A 4-page, full color, fold out brochure: available by mail, request via the website, and point of purchase displays at related retail outlets.
- A postcard size teaser: will be used for display on bulletin boards, and as a direct-mail piece as needed.
- Extremely active and professional website: the core of the EquineAcres sales literature (website will be designed and maintained by Edward Graves).
3.3 Fulfillment
The ownership of EquineAcres has established substantial business contacts over the last five years while conducting a small, related “side business.” These relationships are now prime to be leveraged into larger, more formal relationships. In addition, the unique and varied set of skills possessed by the EquineAcres ownership allows for almost no externally hired expertise or contract service.
Due to these existing relationships and previous business dealings, and with an established history, the average profit margin on all products can be reliably placed at 100%. Please refer to the Product and Service Description section, for a fuller description of the sourcing for each EquineAcre product and service.
3.4 Technology
Yet another way in which EquineAcres will differentiate itself from other related businesses lies in technology expertise. The experience and background of the EquineAcres ownership allows for the introduction of full computerization (primarily recognizable in reports to members and member Web pages) to an otherwise typically non-computerized market. The affluent target market for EquineAcres will instantly find comfort (and appreciate) in this level of technology which is generally unavailable from most any of their other equine related vendors. It is important to stress here again, that the ownership of EquineAcres possesses the knowledge and ability to implement and execute these technologies without external assistance (or expense).
3.5 Future Products and Services
The equine marketplace offers an almost endless array of products and services. EquineAcres will remain in constant contact with suppliers, seeking new products and services to offer through EquineAcres. In specific, the largest equine trade show in North America, “Equitana USA” will be held this June 14th – 17th. EquineAcres plans to attend this event to gather additional product and service ideas and contacts.
Of greater impact however, is the EquineAcres product itself. Future plans call for expansion of EquineAcres in two capacities:
- First, with the conversion of the “Back 80” acres over to additional five acre retreats, substantial additional revenue can be generated from the primary income source: Memberships. And, as a result of membership expansion, substantially increased sales of products and services to the increased membership base will result.
- Second, and of the greatest potential, is for the expansion of EquineAcres as a whole to additional markets. Tulsa and Oklahoma City are located equidistant (less than 60 miles) from the initially planned EquineAcres. EquineAcres*2 and EquineAcres*3 (etc.) are planned within easy access to each of these much larger markets upon successful implementation and refinement of EquineAcres*1.
3.6 Competitive Comparison
EquineAcres is a completely unique entity, in the equine marketplace. As such, it has no direct competitors. Rather, there are multiple competitors to each of the individual components that comprise EquineAcres. However, the EquineAcres concept coupled with its ownership’s previous business dealings and contacts will enable EquineAcres to offer each of these products and services at extremely competitive prices. The combined concept, convenience, and price competitiveness of the entire EquineAcres “menu” has not been approached by any other existing business to the owner’s knowledge.
Market Analysis Summary
Everybody knows, and it should come as no surprise, that the Oklahoma market is extremely “equine-centric.” However, the statistical facts supporting it’s level of equine activity are surprisingly impressive none the less. Oklahoma, while ranked 27th in state population, is ranked 4th in total total equine inventory (165,000 equine inventory) and 4th in total equine inventory sold ($30,000,000 in value of sales) according to the U.S. Census and U.S. Agricultural Census.
In addition, and of great significance, is an unpublished but well known observation of the target market. “The Triangle” is an area known by all Oklahoma equine industry participants as the center of activity for the Oklahoma equine market. This area is loosely identified by an area outlined by Oklahoma City to Bristow to Stillwater. EquineAcres will be situated near the heart of “The Triangle”… the most active geographic equine market, in the 4th most active equine market, in the United States.
4.1 Target Market Segment Strategy
Within this target market, EquineAcres will target three primary customer groups:
- Existing “pleasure” equine owners desiring to board and enjoy their horses, in a safe and upscale environment, with little or no specific care responsibilities on their part.
- Existing “business” equine owners who will leverage the business, marketing, and care aspects of EquineAcres to enhance their current business operation.
- Non-equine owners who have long desired to become an equine owner but have not done so due to the time, care, risk, expense, and/or knowledge requirements associated with equine ownership. EquineAcres is the only entity (known) in existance that is specifically positioned to address these needs, and therefore able to tap this previously untapped marketplace.
4.1.1 Market Growth
Market growth, as related to EquineAcres, is an interesting subject. While Oklahoma population growth is among the top 1/2 of U.S. state’s growth (at 9.7% per annum), and an increase in populate will yield a statistically relative growth in equine ownership, EquineAcres market growth will not primarily come from this source. Neither will it come from industry growth, the equine markets is perhaps one of the longest and most stable industries in America. Rather, the growth of EquineAcres will stem directly from the offering of a unique, attractive, and profitable solution to an existing unmet market need. Market penetration, rather than market growth, will form the foundation for EquineAcres growth.
4.1.2 Market Needs
The American equine love affair runs throughout our history, has never faded, and never will. There are few people who have not, at least once in their lifetime, dreamed of equine ownership and enjoyment. Especially in Oklahoma (and other similar “western”) states, the population is constantly bombarded by pleasurable equine exposure spanning everything from television commercials to the sights encountered while driving any distance greater than 30 miles. However, from personal experience, the true ownership and care requirements are daunting. EquineAcres solves those most basic challenges opening up the possibility of equine ownership to those who have previously desired, but have been unable or unwilling, to do so.
However, simply providing the place and service is not enough. EquineAcres will utilize a lifetime of business experience and acquired skills to operate in a clean, safe, upscale business manner. This in itself is extremely unique among most every other equine related business in operation. “Cowboys” don’t know or care much about good business operations.
Building upon the previous statement, the existing Oklahoma equine market ($30,000,000 in annual sales) is served, to a large extent, by “the Cowboy.” While they typically do not (or will not) implement solid business practices on their own, they readily recognize the potential benefit of doing so. EquineAcres will offer the existing equine business owner (aka, “horse-trader”) with the powerful business and marketing power they have always dreamed of being able to execute on their own. To these businesses, EquineAcres will be akin to a neighborhood used car dealer having the sales and marketing power of a major car dealership at their disposal.
4.2 Service Business Analysis
As mentioned throughout this business plan, EquineAcres is an extremely unique business and therefore there are no direct, “apples to apples” competitors. EquineAcres assembles a complete line of products and services, all needed and desired by the target market, but not available to them from a single source anywhere, until now. A brief overview of these product and service sets follows:
1. Equine Boarding
EquineAcres offers a never before available equine boarding facility. This unique approach surpasses every currently available boarding option in every possible way…a safer and healthier living environment, greater individual space, total care and monitoring, all at a price point substantially below that available from any other source.
2. Equine Products
EquineAcres will offer a complete line of products available for resale both to members, guests, visitors, and over a fully functional website with online shopping capability. These will initially include: all feed and equine care products, support equipment, complete line of saddles, and tack. Additional products will be added as the market dictates.
3. Equine Services
EquineAcres will assemble a complete list of service providers, available to members on an individual contract basis, at a reduced rate than that available individually. In addition, these service providers will provide their services on-site, under the direction of EquineAcres, thereby eliminating the need for the equine owner to be present. These services will initially include: 24-hour veterinarian on call, farrier, groomer, trainers in a complete range of disciplines, and equine photography. Additional services will be added as the market dictates.
4. Equine Facilities
EquineAcres will offer an amazing mixture of facilities designed to meet the pleasure and training needs of the owner. These facilities will initially include: lighted arena suitable for event training, round-pens for training purposes, interior close care stalls for intensive equine care, 80-acres of open pleasure riding terrain, isolation pens for individual care, and standard equine support equipment. Additional facilities will be added as the market dictates.
5. Business Services
EquineAcres will also offer a complete range of business services designed to augment the equine owner’s business needs. These services will initially include: creation of an equine history report (detailing past pedigree, training, show, and medical history), upkeep of a running equine report (detailing all breeding, training, medical, feed, and show history while residing at EquineAcres), personal Web page or website including private email address, EquineAcres mailing address, and “tell, show, and sell” services for equine sellers. Additional business services will be added as the market dictates.
6. Retreat Community
Perhaps the most unique of all the EquineAcres offerings, a “retreat community” atmosphere will be the epicenter. Members will find a community atmosphere in which they can share their experiences and passions with other members with which they hold these things in common. While a member may choose to only come and go as needed, the individual retreats and the EquineAcres facility as a whole are set up to encourage members to spend entire weekends. The barn rooms, while ideal for storage of their tack and support equipment, will also be set up to be entirely suitable as a “weekend cabin.” This, in addition to community events, newsletters, public address announcements, and overall camaraderie of the community will provide an extremely attractive and unavailable elsewhere emotional draw to EquineAcres.
Offerings #2, #3, #4, and #5 above are each individually available elsewhere. Offerings #1 and #6, in their EquineAcres format, are virtually unavailable but much desired by the equine owner market. Nowhere however, are all six of these super sets, with their full range of subsets, available in a single location. While common to other special interest groups (boating, golfing, fishing, etc.), this concept does not exist anywhere for the equine enthusiast. Yet, the equine enthusiast is every bit as passionate about their interest, affluent, and desirous to spend as an equine owner as are any member of any other special interest group.
4.2.1 Distributing a Service
Equine owners are accustomed to maintaining a long list of individual suppliers for their equine related needs. Some are local, some distant, some businesslike, some “shady,” some cash, some credit, some on-site, some they must visit, over the Internet, at retail outlets, mail order, auction, and remote locations. This presents a daunting and expensive proposition to the new or casual equine owner until they find the best source or outlet for each of their needs. To the experienced equine owner, this presents a time consuming and difficult to manage set of relationships requiring each product or service to be purchased individually.
While EquineAcres members will be welcome to purchase all of their support needs individually, it is certain that the vast majority will choose to purchase the EquineAcres offerings. This will be due to the convenience factor of a single source and reinforced because of the competitive pricing available through EquineAcres volume purchasing ability and strategic business relationships. More convenient and less expensive; most will choose EquineAcres products and services.
4.2.2 Competition and Buying Patterns
Equine owners make purchases based on three priorities: *Price, *Convenience, *Quality. The individual importance of these three priorities depends on the owners position as an owner.
- Pleasure owners may prioritize as 1) Quality, 2) Price, 3) Convenience.
- Casual owners my prioritize as 1) Convenience, 2) Quality, 3) Price.
- Business owners may prioritize as 1) Price, 2) Convenience, 3) Quality.
EquineAcres however, has the unique ability to meet all of these buying patterns:
Price
Strategic business relationships, volume purchase capability, and sales and marketing ability will allow EquineAcres to provide all products and services competitive with any other source while maintaining an extremely attractive profit margin.
Convenience
This advantage can not be over stated. A single source for the purchase of products and execution of services, coupled with the total care approach thereby releasing the equine owner from daily responsibilities, provides for maximum convenience.
Quality
Existing business relationships have identified sources for a quality of products and services unsurpassed by any other source or vendor. As newer, higher quality, products and/or services are identified they will be added to the EquineAcres list of offerings.
4.2.3 Business Participants
Equine Boarding
Current boarding facilities in the area offer two forms of boarding as follows:
- Partial Board: requires the owner to be present at least once per day, every day, to care for their equine. Average: $75/month/equine.
- Full Board: offers full care of the equine similar to EquineAcres (see exceptions below). Average: $350/month/equine.
- In all cases, these facilities require keeping the equine in a stall/run environment with extremely limited space. This is an undesirable living environment for a large, active animal.
- While there are currently several “Partial Board” slots available in competing boarding facilities, these are undesirable due to the daily commitment required by the equine owner.
- “Full Board” slots are currently completely booked, with a two year waiting period.
Equine Products, Services, Facilities, and Business Services
These products and services are available from a variety of industry participants, in a variety of formats, however nowhere are all of these products and services available through a single source.
Retreat Community
With absolute certainty, no entity of this sort exists anywhere in the local region. In addition, none have been identified, anywhere else, nationally.
Strategy and Implementation Summary
The strategy behind the sales, marketing, and implementation of EquineAcres is elegantly simple and ready for execution:
Utilize the business knowledge and experience of a 20-year successful professional career, while leveraging existing business contacts, target market knowledge, and relationships, to penetrate a grossly under-served market, with an attractive product and service set virtually unavailable heretofore, thereby creating an extremely profitable and expandable business entity ideally suited for exponential expansion.
5.1 Value Proposition
Our value proposition is simple, clear, and most importantly, achievable:
EquineAcres provides a convenient single source to meet all of the product, service, and emotional needs of current and prospective equine owners at a competitive price in a unique community environment backed by solid and innovative business operations.
This may seem to be a very common “dream-goal” to most every business, however one of the key aspects of the EquineAcres Business Plan is to demonstrate that, in this case, it is a realistic goal. That said, upon realizing this goal in an underserved and vital market, EquineAcres will also achieve and surpass its financial goals.
5.2 Competitive Edge
Several of EquineAcres competitive edges have been identified, validated, and extolled throughout the content of the business plan:
- A unique, attractive, and needed format.
- Convenience.
- Quality.
- Price.
However, one other major competitive advantage, perhaps the most important, has not been previously identified, the owner, Edward A. Graves. Edward Graves brings a unique and valuable set of skills, experience, and contacts to the forefront of EquineAcres overall competitive advantage:
- A proven sales and marketing professional with a successful track record for selling to insure product, service, and retreat sales.
- Proven professional operational skills to insure efficient, effective, and professional business operations.
- Outstanding computer skills capable of maximizing computer efficiency to aid in business operations.
- Web design skills to design, implement, and maintain an effective website without the need for external resources.
- Substantial written and graphic design skills to self-produce marketing and promotional material.
- Extensive equine experience and knowledge to understand what gets or gives the “maximum for the minimum.”
- Endless equine business contacts primed for strategic partnership.
- In-depth understanding of the equine owner and marketplace to know what is needed and desired by the average owner.
5.3 Marketing Strategy
The EquineAcres market provides a very convenient target for several reasons:
- Co-located in a small geographic region, approximately 60 miles in diameter.
- Frequent the same, limited number of, local vendors almost all of which will cooperate (and potentially partner) with EquineAcres.
- “Religiously” refer to local newspaper classified advertisements for equine related items.
- Are computer-literate, relying on the Internet as a primary source of information.
The overall marketing strategy of EquineAcres will leverage these four critical patterns to capture the attention of the market at a bare minimum of expense. Once captured, the customer will encounter sales expertise to garner their business, presenting a unique and desirable product and service set, which will retain and expand their business through exceptional business practices and customer support.
These factors will in turn lead to pent-up demand for EquineAcres beyond its capacity which, in turn, will lead to future expansion of EquineAcres*2, etc.
5.3.1 Positioning Statement
As alluded to throughout this business plan, EquineAcres provides a convenient single source to meet all of the product, service, business, and emotional needs of current and prospective equine owners, as well as equine business owners, at competitive prices in a unique community environment backed by solid and innovative business operations.
5.3.2 Pricing Strategy
The foundation of EquineAcres is the sale of retreat leases to 100% of capacity. Pricing will be as follows:
- Retreat lease at $300/month, includes one equine.
- Additional equine co-located on the same retreat (to a maximum of three/retreat) at $50/equine/month, or three equine at Full Board at EquineAcres = $400/month.
- Compare to “Full Board” competitors at $350/equine/month, or three equine at Full Board at competitors = $1,050/month.
The secondary foundation of EquineAcres is the sale of products and services to members direct, and non-members primarily via Internet shopping.
- Pricing on all products and services will be at, or slightly above, average public pricing.
- Margin on all products and services will be at or above 100% for most products.
- Margin on all contract services is “total” since contractors pay a percentage of revenue generated to EquineAcres in exchange.
5.3.3 Promotion Strategy
Because our entire customer base will come from a local geographic area, our promotional strategy is simple and cost effective:
- Central to all promotional (and ongoing business) activity will be an extremely active and effective website. All promotional activity will point to the website. Site will be designed and maintained by EquineAcres ownership, without external resources
- A full color, 4-page, folder style brochure will be the key printed promotional material. This brochure will be distributed through counter displays at a variety of local equine related businesses, and by request via the website.
- Three additional home-published pieces will be available for inclusion with the full brochure as needed and appropriate. They are:
- For those who don’t own a horse, yet…
- For those who are looking for a better way to keep and enjoy their horse, now…
- For those involved in the horse business, today…
- Three additional home-published pieces will be available for inclusion with the full brochure as needed and appropriate. They are:
- A small “bulletin-board” teaser piece will be displayed at multiple locations throughout the targeted geographic region.
- Extensive (existing) equine business relationships will provide for substantial referral opportunities.
- Local newspaper classified ad’s will be regularly placed in the “Livestock” sections (regularly studied by everyone with an equine interest) with a sufficient “teaser” directing inquiries to the website.
5.3.4 Distribution Strategy
EquineAcres will rely on direct selling for the sale of retreat leases and follow-on products and services. Additional sales activity will take place through an effective and active Internet shopping website. Existing business relationships will also be leveraged to gain maximum exposure to the target market and yield maximum margin from resale products and services.
5.3.5 Marketing Programs
The EquineAcres website will be at the center of all marketing (and much ongoing business) activity. External direction to the website will be provided through our chosen ISP with monthly submission to all major search engines. Internal (target geographic market) direction to the website will be provided through our brochure, teaser cards, newspaper classified advertising, and strategic partnership referrals.
A (confirmed) budget of $1,200 is all that is necessary for implementation of the website. This website will be operational within 14 days after securing the funding sought for this project. Brochures and teaser cards will be self-produced and distributed within 30 days after securing funding. Leverage of strategic partnership referrals and newspaper classified advertising will commence 60 days prior to the planned opening date of EquineAcres.
5.4 Sales Strategy
The sales strategy behind EquineAcres is simple:
-
Sell “Retreat Leases” to 100% of capacity.
- Provide products and services with a sufficient value proposition as to insure the purchase of these products and services by the membership through EquineAcres.
5.4.1 Sales Forecast
Important points about the Forecast:
- This forecast is based on experience.
- Five years experience in the equine business understanding seasonal sales cycles, customer requirements, and realistic growth.
- Four years experience having developed, implemented, and controlled a $7,000,000 forecasting model for an international software company.
- “Capacity growth” assumes the addition of five retreats in FY2003, and five retreats in FY2004. However, it does not address the exponential growth associated with the potential opening of EquineAcres*2, EquineAcres*3, etc.
- Forecast does not address additional products and services to be identified during the course of operations. Interesting note about resale items–virtually every product or service utilized by EquineAcres automatically becomes a candidate as a resale product or service from EquineAcres. This allows the initial purchase at a discounted “resale” rate and eventual revenue stemming from that purchase.
The following table is provided to accompany the sales forecast offering descriptions and assumptions about the sales forecast.
| Sales Forecast Item | Description | Item Price Assumptions | Item Cost Assumptions | Growth Assumptions |
| Retreat Leases | Basic Membership | Set at $300 per Retreat | Cost is calculated into loan repayment | 100% Capacity expected at outset. Additional capacity to be added Years 2 and 3. |
| Add.Equine Residents | Additional equine on existing Retreats | Set at $50 per equine | No direct cost is associated | 100% Capacity expected at outset, with growth directly proportionate to Retreat sales. |
| Equine Consumables | Feed, hay, and support consumables | Gross average price of $10 per unit | 100% markup on all items | Growth proportionate to capacity. |
| Tack – Low End | Halters, headstalls, bits, spurs, etc. | Gross average price of $25 per unit | 100% markup on all items | Growth based on increased website sales activity. |
| Tack – High End | Saddles, support equipment, etc. | Gross average price of $200 per unit | 100% markup on all items | Growth based on increased website sales activity. |
| % of Services | Percentage paid to EquineAcres by Service Providers | Gross average Price of $100 x 10% commission = $10 per service | No associated direct cost | Growth proportionate to capacity. |
| Web Pages | Member pages added to EquineAcres site | Set at $10 per page | No associated direct cost | Growth proportionate to capacity. |
| Websites | Member sites purchased through EquineAcres | Difficult to average price. Initial setup fee + monthly hosting fee gross averaged at $50 per site | Minimal fee to ISP, remaining “setup” by EA w/no associated cost | Growth based on external sales. |
| Added Services | CloseCare, Photo, Grooming, Event Income, etc. | Gross average price of $10 per service | No associated direct cost | Growth proportionate to capacity. |
| Major Equipment Sales | External sales of BarnRooms, Trailers, etc. | Average price of $2500 per unit | Average cost $1000 | Growth based on external sales. |
| Sale Commissions | Commission paid by seller to EquineAcres for “Show and Sell” service | 20% commission paid on average of $1500 equine sale | No associated direct cost | Growth based on increased use/success of the service. |
| Sales Forecast | |||
| Year 1 | Year 2 | Year 3 | |
| Unit Sales | |||
| Retreat Leases | 120 | 180 | 240 |
| Additional Equine Residents | 240 | 360 | 480 |
| Feed & Equine Consumables | 1,520 | 2,250 | 3,000 |
| Resale Tack – Low End | 365 | 500 | 1,000 |
| Resale Tack – High End | 51 | 100 | 250 |
| Services – % of Provider Revenue | 290 | 500 | 750 |
| Web Pages | 63 | 72 | 72 |
| Websites | 256 | 500 | 750 |
| EquineAcres Added Services | 110 | 175 | 250 |
| Major Equipment Sales | 21 | 40 | 80 |
| Show & Sell Commissions | 39 | 60 | 80 |
| Total Unit Sales | 3,075 | 4,737 | 6,952 |
| Unit Prices | Year 1 | Year 2 | Year 3 |
| Retreat Leases | $300.00 | $300.00 | $300.00 |
| Additional Equine Residents | $50.00 | $50.00 | $50.00 |
| Feed & Equine Consumables | $10.00 | $10.00 | $10.00 |
| Resale Tack – Low End | $25.00 | $25.00 | $25.00 |
| Resale Tack – High End | $200.00 | $200.00 | $200.00 |
| Services – % of Provider Revenue | $10.00 | $10.00 | $10.00 |
| Web Pages | $10.00 | $10.00 | $10.00 |
| Websites | $50.00 | $50.00 | $50.00 |
| EquineAcres Added Services | $10.00 | $10.00 | $10.00 |
| Major Equipment Sales | $2,500.00 | $2,500.00 | $2,500.00 |
| Show & Sell Commissions | $300.00 | $300.00 | $300.00 |
| Sales | |||
| Retreat Leases | $36,000 | $54,000 | $72,000 |
| Additional Equine Residents | $12,000 | $18,000 | $24,000 |
| Feed & Equine Consumables | $15,200 | $22,500 | $30,000 |
| Resale Tack – Low End | $9,125 | $12,500 | $25,000 |
| Resale Tack – High End | $10,200 | $20,000 | $50,000 |
| Services – % of Provider Revenue | $2,900 | $5,000 | $7,500 |
| Web Pages | $630 | $720 | $720 |
| Websites | $12,800 | $25,000 | $37,500 |
| EquineAcres Added Services | $1,100 | $1,750 | $2,500 |
| Major Equipment Sales | $52,500 | $100,000 | $200,000 |
| Show & Sell Commissions | $11,700 | $18,000 | $24,000 |
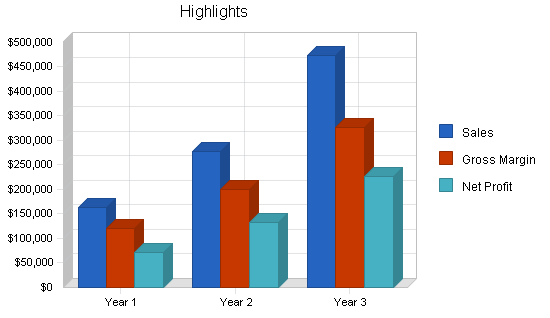
| Total Sales | $164,155 | $277,470 | $473,220 |
| Direct Unit Costs | Year 1 | Year 2 | Year 3 |
| Retreat Leases | $0.00 | $0.00 | $0.00 |
| Additional Equine Residents | $0.00 | $0.00 | $0.00 |
| Feed & Equine Consumables | $5.00 | $5.00 | $5.00 |
| Resale Tack – Low End | $12.50 | $12.50 | $12.50 |
| Resale Tack – High End | $100.00 | $100.00 | $100.00 |
| Services – % of Provider Revenue | $0.00 | $0.00 | $0.00 |
| Web Pages | $0.00 | $0.00 | $0.00 |
| Websites | $20.00 | $20.00 | $20.00 |
| EquineAcres Added Services | $0.00 | $0.00 | $0.00 |
| Major Equipment Sales | $1,000.00 | $1,000.00 | $1,000.00 |
| Show & Sell Commissions | $0.00 | $0.00 | $0.00 |
| Direct Cost of Sales | |||
| Retreat Leases | $0 | $0 | $0 |
| Additional Equine Residents | $0 | $0 | $0 |
| Feed & Equine Consumables | $7,600 | $11,250 | $15,000 |
| Resale Tack – Low End | $4,563 | $6,250 | $12,500 |
| Resale Tack – High End | $5,100 | $10,000 | $25,000 |
| Services – % of Provider Revenue | $0 | $0 | $0 |
| Web Pages | $0 | $0 | $0 |
| Websites | $5,120 | $10,000 | $15,000 |
| EquineAcres Added Services | $0 | $0 | $0 |
| Major Equipment Sales | $21,000 | $40,000 | $80,000 |
| Show & Sell Commissions | $0 | $0 | $0 |
| Subtotal Direct Cost of Sales | $43,383 | $77,500 | $147,500 |
Management Summary
Initially, EquineAcres will be wholly owned and operated by Edward A. Graves. However, it is important to note that while the tasks are daunting, this is a level of effort and production that the owner has maintained for several years. The only difference between this level of effort and previous years’ efforts is that with EquineAcres all of the owner’s efforts will be focussed on a single project, rather than between employment and home business. Current associates will testify as to the owner’s extraordinary organizational and prioritization skills that have, and will continue to, provide for this level of task assumption.
Following a sufficient period of successful operation, with enough time “at the helm” to allow the business entity to settle-in, the owner will hire a “manager trainee” to begin learning the EquineAcres operation with the potential of taking over as on-site manager. This on-site management concept will be utilized in the future expansions of EquineAcres*2, *3, etc.
Extensive business and personal contacts will also be utilized as needed, on a contract basis, to assist with labor as needed. As the Internet shopping aspect of EquineAcres increases, additional part-time staff will be added to handle various shipping and handling tasks.
6.1 Organizational Structure
The legal form of the company will be determined in conjunction with, and consideration for, the desires of the funding source. The concept is to have a single business entity, with two sub-entities operating under the umbrella company.
The Graves Company–Parent Company
- EquineAcres–All business taking place “on-premise.”
- Graves Farm eXchange–Equine business conducted “off-premise.”
This structure has been chosen because of its ability to meet with potential business opportunities as they are identified.
6.2 Management Team
The key Management Team member will be Edward A. Graves, owner/operator of EquineAcres and author of this business plan. Resume overview:
- A 20+ year successful business career primarily in sales, marketing, sales management, and operations management.
- 5+ successful years involved in every aspect of the equine industry.
- 5+ years operating a small, equine related, home side-business.
- Extremely versatile range of “hands-on” technical and trade abilities.
- Extremely strong computer skills.
- Substantial creative abilities.
- Extensive reputation for organizational skills and time management.
- Outstanding contacts both in general business and equine activity.
In addition, EquineAcres management will be backed by a strong “family team” in complete support of this endeavor. The owner’s wife is well versed in computer and Internet use and possesses an extremely strong equine knowledge. She is my partner and is equally hopeful for the implementation of this business plan.
6.3 Management Team Gaps
Identified gaps, and their resolution, include:
- Legal and financial expertise not currently possessed.
- Retaining of legal and accounting services (individuals already identified).
- Personal study and dedicated effort to increase personal knowledge in these areas.
- Extreme reliance on a single individual, the owner.
- Full participation of immediate family members to understand and assist with all business operations.
- Eventual hire and training of on-site manager.
- Sufficient disability and death insurance to protect lenders and family.
6.4 Personnel Plan
The personnel plan for EquineAcres, Years 1, 2, and 3 is simple.
Year 1: Salary to owner/manager of $3,000/month to cover all personal living expenses.
Year 2: Salary to owner/manager of $3,000/month + hire of assistant staff (on-site manager in training) at $16,000/year.
Year 3: On-site manager salary of $36,000/year + assistant staff (on-site managers in training) at $16,000/year.
| Personnel Plan | |||
| Year 1 | Year 2 | Year 3 | |
| Name or title | $0 | $0 | $0 |
| Other | $0 | $0 | $0 |
| Total People | 0 | 0 | 0 |
| Total Payroll | $0 | $0 | $0 |
Financial Plan
A note of critical importance to any potential lender or investor reviewing this business plan:
- Upon securing funding for this project, EquineAcres will utilize almost 100% of the funding to purchase undeveloped land, and then develop that land. The development of the land will be done in such a way as to vastly improve the value of the land to a point at which the entire loan/investment amount is entirely recoverable, perhaps even profitable, through resale of the improved land, buildings, and equipment (worse case scenario). This funding request should therefore be considered as “secured.”
The financial plan for EquineAcres is presented herein for your review. From a high level it reflects several key factors:
- Profitability.
- Solid cash flow.
- Sufficient profit and cash flow to cushion against unforseen challenges.
- Solid growth expectations based on conservative estimates:
- NOTE 1: Contrary to common business plan creation, this business plan has been created with conservative growth and sales expectations. Given the professional sales expertise and industry knowledge of the owner, sales and profitability are expected to surpass that which has been presented herein.
- NOTE 2: The EquineAcres concept has every potential to quickly expand into multiple facilities serving multiple markets, however these opportunities are not reflected in this business plan. Once the initial EquineAcres (*1) is open, operating, and confirmed, additional facilities will be considered in direct cooperation with the initial lender/investor. Creation of these additional facilities (EqineAcres*2, EquineAcres*3, etc.) create the opportunity for exponential growth, profitability, and investor return. It is even within the realm of reason to envision a “franchise” approach spanning the United States.
The financial plan for EquineAcres has been assembled from a variety of sources which include:
- Extensive professional business experience in sales, sales management, marketing, forecasting, and operational management.
- Extensive experience in, knowledge of, and business contacts within, the equine marketplace.
- Reliance upon the software program used to create this business plan for general assumption calculations.
-
See section on Management Gaps. The writer of this business plan, and future owner of EquineAcres, has identified a knowledge gap in basic accounting principles (to be resolved through external consultants and self education). Any apparent errors in the following tables and charts should be attributed to this knowledge gap. Professional assistance in reformatting this table to accurately reflect actual calculations is welcomed.
-
7.1 Important Assumptions
Important notes about the General Assumptions table: All calculations contained in the attached table are those recommended by the software program (Business Plan Pro) used to create this business plan. Future reformatting of this table based on actual values will be welcome and completed with the assistance of potential lenders/investors.
| General Assumptions | |||
| Year 1 | Year 2 | Year 3 | |
| Plan Month | 1 | 2 | 3 |
| Current Interest Rate | 10.00% | 10.00% | 10.00% |
| Long-term Interest Rate | 10.00% | 10.00% | 10.00% |
| Tax Rate | 25.42% | 25.00% | 25.42% |
| Other | 0 | 0 | 0 |
7.2 Key Financial Indicators
Important notes about Benchmarks:
- The attached Benchmarks chart is assembled from data contained throughout this business plan. Refer to all other sections for detailed information validating the Benchmark result.
- This is a self-calculating chart; future modifications in cooperation with lender/investors will automatically update this chart to reflect changes made elsewhere in this business plan.

7.3 Break-even Analysis
Break-even Analysis explanations:
- Average Per Unit Revenue–Taken as gross average from Detailed Forecast.
- Average Per Unit Variable Cost–Taken as gross average from Detailed Forecast.
- Estimated Monthly Fixed Cost–Calculated by Owner Salary + Loan Payment + Average Utilities.

| Break-even Analysis | |
| Monthly Units Break-even | 22 |
| Monthly Revenue Break-even | $1,155 |
| Assumptions: | |
| Average Per-Unit Revenue | $53.38 |
| Average Per-Unit Variable Cost | $14.11 |
| Estimated Monthly Fixed Cost | $850 |
7.4 Projected Profit and Loss
Important notes about Profit and Loss:
- The attached Profit and Loss Statement is assembled from data contained throughout this business plan. Refer to all other sections for detailed information validating the Profit and Loss result.
- This is primarily a self-calculating table; future modifications in cooperation with lender/investors will automatically update this table to reflect changes made elsewhere in this business plan.


| Pro Forma Profit and Loss | |||
| Year 1 | Year 2 | Year 3 | |
| Sales | $164,155 | $277,470 | $473,220 |
| Direct Cost of Sales | $43,383 | $77,500 | $147,500 |
| Other | $0 | $0 | $0 |
| Total Cost of Sales | $43,383 | $77,500 | $147,500 |
| Gross Margin | $120,773 | $199,970 | $325,720 |
| Gross Margin % | 73.57% | 72.07% | 68.83% |
| Expenses | |||
| Payroll | $0 | $0 | $0 |
| Sales and Marketing and Other Expenses | $2,400 | $3,600 | $4,800 |
| Depreciation | $0 | $0 | $0 |
| Leased Equipment | $0 | $0 | $0 |
| Utilities | $3,000 | $3,000 | $3,000 |
| Insurance | $4,800 | $4,800 | $4,800 |
| Rent | $0 | $0 | $0 |
| Payroll Taxes | $0 | $0 | $0 |
| Other | $0 | $0 | $0 |
| Total Operating Expenses | $10,200 | $11,400 | $12,600 |
| Profit Before Interest and Taxes | $110,573 | $188,570 | $313,120 |
| EBITDA | $110,573 | $188,570 | $313,120 |
| Interest Expense | $14,025 | $12,300 | $10,500 |
| Taxes Incurred | $24,318 | $44,068 | $76,916 |
| Net Profit | $72,229 | $132,203 | $225,704 |
| Net Profit/Sales | 44.00% | 47.65% | 47.70% |
7.5 Projected Cash Flow
Important notes about Cash Flow:
- See line item: Long Term Borrowing Repayment in the Pro-forma Cash Flow Table:
- This figure is a gross estimate based on conventional repayment of a long-term business loan. Should funding come from a private investor, this line item will be dramatically altered.
- The attached Cash Flow table is assembled from data contained throughout this business plan. Refer to all other sections for detailed information validating the cash flow results.
- These are self-calculating tables and charts; future modifications in cooperation with lender/investors will automatically update this data to reflect changes made elsewhere in this business plan.

| Pro Forma Cash Flow | |||
| Year 1 | Year 2 | Year 3 | |
| Cash Received | |||
| Cash from Operations | |||
| Cash Sales | $164,155 | $277,470 | $473,220 |
| Subtotal Cash from Operations | $164,155 | $277,470 | $473,220 |
| Additional Cash Received | |||
| Sales Tax, VAT, HST/GST Received | $0 | $0 | $0 |
| New Current Borrowing | $0 | $0 | $0 |
| New Other Liabilities (interest-free) | $0 | $0 | $0 |
| New Long-term Liabilities | $0 | $0 | $0 |
| Sales of Other Current Assets | $0 | $0 | $0 |
| Sales of Long-term Assets | $0 | $0 | $0 |
| New Investment Received | $0 | $0 | $0 |
| Subtotal Cash Received | $164,155 | $277,470 | $473,220 |
| Expenditures | Year 1 | Year 2 | Year 3 |
| Expenditures from Operations | |||
| Cash Spending | $0 | $0 | $0 |
| Bill Payments | $84,937 | $140,885 | $244,110 |
| Subtotal Spent on Operations | $84,937 | $140,885 | $244,110 |
| Additional Cash Spent | |||
| Sales Tax, VAT, HST/GST Paid Out | $0 | $0 | $0 |
| Principal Repayment of Current Borrowing | $0 | $0 | $0 |
| Other Liabilities Principal Repayment | $0 | $0 | $0 |
| Long-term Liabilities Principal Repayment | $18,000 | $18,000 | $18,000 |
| Purchase Other Current Assets | $0 | $0 | $0 |
| Purchase Long-term Assets | $0 | $0 | $0 |
| Dividends | $0 | $0 | $0 |
| Subtotal Cash Spent | $102,937 | $158,885 | $262,110 |
| Net Cash Flow | $61,218 | $118,585 | $211,110 |
| Cash Balance | $88,218 | $206,803 | $417,913 |
7.6 Projected Balance Sheet
Important notes about the Balance Sheet:
- The attached Balance Sheet is assembled from data contained throughout this business plan. Refer to all other sections for detailed information validating the Balance Sheet result.
- This is a self-calculating table; future modifications in cooperation with lender/investors will automatically update this chart to reflect changes made elsewhere in this business plan.
| Pro Forma Balance Sheet | |||
| Year 1 | Year 2 | Year 3 | |
| Assets | |||
| Current Assets | |||
| Cash | $88,218 | $206,803 | $417,913 |
| Inventory | $3,234 | $5,777 | $10,996 |
| Other Current Assets | $0 | $0 | $0 |
| Total Current Assets | $91,452 | $212,581 | $428,909 |
| Long-term Assets | |||
| Long-term Assets | $60,000 | $60,000 | $60,000 |
| Accumulated Depreciation | $0 | $0 | $0 |
| Total Long-term Assets | $60,000 | $60,000 | $60,000 |
| Total Assets | $151,452 | $272,581 | $488,909 |
| Liabilities and Capital | Year 1 | Year 2 | Year 3 |
| Current Liabilities | |||
| Accounts Payable | $5,223 | $12,149 | $20,773 |
| Current Borrowing | $0 | $0 | $0 |
| Other Current Liabilities | $0 | $0 | $0 |
| Subtotal Current Liabilities | $5,223 | $12,149 | $20,773 |
| Long-term Liabilities | $132,000 | $114,000 | $96,000 |
| Total Liabilities | $137,223 | $126,149 | $116,773 |
| Paid-in Capital | $0 | $0 | $0 |
| Retained Earnings | ($58,000) | $14,229 | $146,432 |
| Earnings | $72,229 | $132,203 | $225,704 |
| Total Capital | $14,229 | $146,432 | $372,136 |
| Total Liabilities and Capital | $151,452 | $272,581 | $488,909 |
| Net Worth | $14,229 | $146,432 | $372,136 |
7.7 Business Ratios
Important notes about the Business Ratios:
- The attached Business Ratios table is assembled from data contained throughout this business plan. Refer to all other sections for detailed information validating the Business Ratios result.
- This is a self-calculating table; future modifications in cooperation with lender/investors will automatically update this chart to reflect changes made elsewhere in this business plan.
- Standard ratios from Industry Profile SIC code 7032, Sporting and Recreational Camps is provided in the table.
| Ratio Analysis | ||||
| Year 1 | Year 2 | Year 3 | Industry Profile | |
| Sales Growth | 0.00% | 69.03% | 70.55% | 7.50% |
| Percent of Total Assets | ||||
| Inventory | 2.14% | 2.12% | 2.25% | 1.10% |
| Other Current Assets | 0.00% | 0.00% | 0.00% | 26.90% |
| Total Current Assets | 60.38% | 77.99% | 87.73% | 33.40% |
| Long-term Assets | 39.62% | 22.01% | 12.27% | 66.60% |
| Total Assets | 100.00% | 100.00% | 100.00% | 100.00% |
| Current Liabilities | 3.45% | 4.46% | 4.25% | 16.30% |
| Long-term Liabilities | 87.16% | 41.82% | 19.64% | 38.40% |
| Total Liabilities | 90.60% | 46.28% | 23.88% | 54.70% |
| Net Worth | 9.40% | 53.72% | 76.12% | 45.30% |
| Percent of Sales | ||||
| Sales | 100.00% | 100.00% | 100.00% | 100.00% |
| Gross Margin | 73.57% | 72.07% | 68.83% | 0.00% |
| Selling, General & Administrative Expenses | 45.91% | 38.48% | 29.11% | 70.30% |
| Advertising Expenses | 0.73% | 0.86% | 0.76% | 5.10% |
| Profit Before Interest and Taxes | 67.36% | 67.96% | 66.17% | 4.20% |
| Main Ratios | ||||
| Current | 17.51 | 17.50 | 20.65 | 1.75 |
| Quick | 16.89 | 17.02 | 20.12 | 1.24 |
| Total Debt to Total Assets | 90.60% | 46.28% | 23.88% | 54.70% |
| Pre-tax Return on Net Worth | 678.51% | 120.38% | 81.32% | 2.70% |
| Pre-tax Return on Assets | 63.75% | 64.67% | 61.90% | 5.90% |
| Additional Ratios | Year 1 | Year 2 | Year 3 | |
| Net Profit Margin | 44.00% | 47.65% | 47.70% | n.a |
| Return on Equity | 507.61% | 90.28% | 60.65% | n.a |
| Activity Ratios | ||||
| Inventory Turnover | 9.99 | 17.20 | 17.59 | n.a |
| Accounts Payable Turnover | 17.26 | 12.17 | 12.17 | n.a |
| Payment Days | 27 | 21 | 24 | n.a |
| Total Asset Turnover | 1.08 | 1.02 | 0.97 | n.a |
| Debt Ratios | ||||
| Debt to Net Worth | 9.64 | 0.86 | 0.31 | n.a |
| Current Liab. to Liab. | 0.04 | 0.10 | 0.18 | n.a |
| Liquidity Ratios | ||||
| Net Working Capital | $86,229 | $200,432 | $408,136 | n.a |
| Interest Coverage | 7.88 | 15.33 | 29.82 | n.a |
| Additional Ratios | ||||
| Assets to Sales | 0.92 | 0.98 | 1.03 | n.a |
| Current Debt/Total Assets | 3% | 4% | 4% | n.a |
| Acid Test | 16.89 | 17.02 | 20.12 | n.a |
| Sales/Net Worth | 11.54 | 1.89 | 1.27 | n.a |
| Dividend Payout | 0.00 | 0.00 | 0.00 | n.a |
Appendix
| Sales Forecast | |||||||||||||
| Month 1 | Month 2 | Month 3 | Month 4 | Month 5 | Month 6 | Month 7 | Month 8 | Month 9 | Month 10 | Month 11 | Month 12 | ||
| Unit Sales | |||||||||||||
| Retreat Leases | 0% | 10 | 10 | 10 | 10 | 10 | 10 | 10 | 10 | 10 | 10 | 10 | 10 |
| Additional Equine Residents | 0% | 20 | 20 | 20 | 20 | 20 | 20 | 20 | 20 | 20 | 20 | 20 | 20 |
| Feed & Equine Consumables | 0% | 100 | 110 | 120 | 140 | 160 | 140 | 120 | 130 | 140 | 130 | 120 | 110 |
| Resale Tack – Low End | 0% | 10 | 15 | 20 | 50 | 20 | 30 | 40 | 50 | 50 | 30 | 30 | 20 |
| Resale Tack – High End | 0% | 2 | 3 | 5 | 10 | 1 | 2 | 5 | 5 | 7 | 5 | 3 | 3 |
| Services – % of Provider Revenue | 0% | 10 | 20 | 20 | 40 | 20 | 10 | 20 | 30 | 40 | 30 | 30 | 20 |
| Web Pages | 0% | 5 | 5 | 5 | 5 | 5 | 5 | 5 | 5 | 5 | 6 | 6 | 6 |
| Websites | 0% | 4 | 6 | 10 | 12 | 14 | 18 | 22 | 26 | 30 | 34 | 38 | 42 |
| EquineAcres Added Services | 0% | 2 | 4 | 8 | 8 | 6 | 4 | 10 | 12 | 20 | 16 | 10 | 10 |
| Major Equipment Sales | 0% | 0 | 1 | 4 | 0 | 1 | 3 | 3 | 2 | 2 | 2 | 2 | 1 |
| Show & Sell Commissions | 0% | 2 | 4 | 3 | 4 | 0 | 1 | 3 | 5 | 7 | 5 | 3 | 2 |
| Total Unit Sales | 165 | 198 | 225 | 299 | 257 | 243 | 258 | 295 | 331 | 288 | 272 | 244 | |
| Unit Prices | Month 1 | Month 2 | Month 3 | Month 4 | Month 5 | Month 6 | Month 7 | Month 8 | Month 9 | Month 10 | Month 11 | Month 12 | |
| Retreat Leases | $300.00 | $300.00 | $300.00 | $300.00 | $300.00 | $300.00 | $300.00 | $300.00 | $300.00 | $300.00 | $300.00 | $300.00 | |
| Additional Equine Residents | $50.00 | $50.00 | $50.00 | $50.00 | $50.00 | $50.00 | $50.00 | $50.00 | $50.00 | $50.00 | $50.00 | $50.00 | |
| Feed & Equine Consumables | $10.00 | $10.00 | $10.00 | $10.00 | $10.00 | $10.00 | $10.00 | $10.00 | $10.00 | $10.00 | $10.00 | $10.00 | |
| Resale Tack – Low End | $25.00 | $25.00 | $25.00 | $25.00 | $25.00 | $25.00 | $25.00 | $25.00 | $25.00 | $25.00 | $25.00 | $25.00 | |
| Resale Tack – High End | $200.00 | $200.00 | $200.00 | $200.00 | $200.00 | $200.00 | $200.00 | $200.00 | $200.00 | $200.00 | $200.00 | $200.00 | |
| Services – % of Provider Revenue | $10.00 | $10.00 | $10.00 | $10.00 | $10.00 | $10.00 | $10.00 | $10.00 | $10.00 | $10.00 | $10.00 | $10.00 | |
| Web Pages | $10.00 | $10.00 | $10.00 | $10.00 | $10.00 | $10.00 | $10.00 | $10.00 | $10.00 | $10.00 | $10.00 | $10.00 | |
| Websites | $50.00 | $50.00 | $50.00 | $50.00 | $50.00 | $50.00 | $50.00 | $50.00 | $50.00 | $50.00 | $50.00 | $50.00 | |
| EquineAcres Added Services | $10.00 | $10.00 | $10.00 | $10.00 | $10.00 | $10.00 | $10.00 | $10.00 | $10.00 | $10.00 | $10.00 | $10.00 | |
| Major Equipment Sales | $2,500.00 | $2,500.00 | $2,500.00 | $2,500.00 | $2,500.00 | $2,500.00 | $2,500.00 | $2,500.00 | $2,500.00 | $2,500.00 | $2,500.00 | $2,500.00 | |
| Show & Sell Commissions | $300.00 | $300.00 | $300.00 | $300.00 | $300.00 | $300.00 | $300.00 | $300.00 | $300.00 | $300.00 | $300.00 | $300.00 | |
| Sales | |||||||||||||
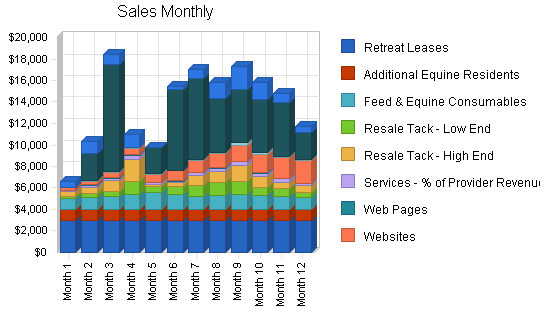
| Retreat Leases | $3,000 | $3,000 | $3,000 | $3,000 | $3,000 | $3,000 | $3,000 | $3,000 | $3,000 | $3,000 | $3,000 | $3,000 | |
| Additional Equine Residents | $1,000 | $1,000 | $1,000 | $1,000 | $1,000 | $1,000 | $1,000 | $1,000 | $1,000 | $1,000 | $1,000 | $1,000 | |
| Feed & Equine Consumables | $1,000 | $1,100 | $1,200 | $1,400 | $1,600 | $1,400 | $1,200 | $1,300 | $1,400 | $1,300 | $1,200 | $1,100 | |
| Resale Tack – Low End | $250 | $375 | $500 | $1,250 | $500 | $750 | $1,000 | $1,250 | $1,250 | $750 | $750 | $500 | |
| Resale Tack – High End | $400 | $600 | $1,000 | $2,000 | $200 | $400 | $1,000 | $1,000 | $1,400 | $1,000 | $600 | $600 | |
| Services – % of Provider Revenue | $100 | $200 | $200 | $400 | $200 | $100 | $200 | $300 | $400 | $300 | $300 | $200 | |
| Web Pages | $50 | $50 | $50 | $50 | $50 | $50 | $50 | $50 | $50 | $60 | $60 | $60 | |
| Websites | $200 | $300 | $500 | $600 | $700 | $900 | $1,100 | $1,300 | $1,500 | $1,700 | $1,900 | $2,100 | |
| EquineAcres Added Services | $20 | $40 | $80 | $80 | $60 | $40 | $100 | $120 | $200 | $160 | $100 | $100 | |
| Major Equipment Sales | $0 | $2,500 | $10,000 | $0 | $2,500 | $7,500 | $7,500 | $5,000 | $5,000 | $5,000 | $5,000 | $2,500 | |
| Show & Sell Commissions | $600 | $1,200 | $900 | $1,200 | $0 | $300 | $900 | $1,500 | $2,100 | $1,500 | $900 | $600 | |
| Total Sales | $6,620 | $10,365 | $18,430 | $10,980 | $9,810 | $15,440 | $17,050 | $15,820 | $17,300 | $15,770 | $14,810 | $11,760 | |
| Direct Unit Costs | Month 1 | Month 2 | Month 3 | Month 4 | Month 5 | Month 6 | Month 7 | Month 8 | Month 9 | Month 10 | Month 11 | Month 12 | |
| Retreat Leases | 0.00% | $0.00 | $0.00 | $0.00 | $0.00 | $0.00 | $0.00 | $0.00 | $0.00 | $0.00 | $0.00 | $0.00 | $0.00 |
| Additional Equine Residents | 0.00% | $0.00 | $0.00 | $0.00 | $0.00 | $0.00 | $0.00 | $0.00 | $0.00 | $0.00 | $0.00 | $0.00 | $0.00 |
| Feed & Equine Consumables | 0.00% | $5.00 | $5.00 | $5.00 | $5.00 | $5.00 | $5.00 | $5.00 | $5.00 | $5.00 | $5.00 | $5.00 | $5.00 |
| Resale Tack – Low End | 0.00% | $12.50 | $12.50 | $12.50 | $12.50 | $12.50 | $12.50 | $12.50 | $12.50 | $12.50 | $12.50 | $12.50 | $12.50 |
| Resale Tack – High End | 0.00% | $100.00 | $100.00 | $100.00 | $100.00 | $100.00 | $100.00 | $100.00 | $100.00 | $100.00 | $100.00 | $100.00 | $100.00 |
| Services – % of Provider Revenue | 0.00% | $0.00 | $0.00 | $0.00 | $0.00 | $0.00 | $0.00 | $0.00 | $0.00 | $0.00 | $0.00 | $0.00 | $0.00 |
| Web Pages | 0.00% | $0.00 | $0.00 | $0.00 | $0.00 | $0.00 | $0.00 | $0.00 | $0.00 | $0.00 | $0.00 | $0.00 | $0.00 |
| Websites | 0.00% | $20.00 | $20.00 | $20.00 | $20.00 | $20.00 | $20.00 | $20.00 | $20.00 | $20.00 | $20.00 | $20.00 | $20.00 |
| EquineAcres Added Services | 0.00% | $0.00 | $0.00 | $0.00 | $0.00 | $0.00 | $0.00 | $0.00 | $0.00 | $0.00 | $0.00 | $0.00 | $0.00 |
| Major Equipment Sales | 0.00% | $1,000.00 | $1,000.00 | $1,000.00 | $1,000.00 | $1,000.00 | $1,000.00 | $1,000.00 | $1,000.00 | $1,000.00 | $1,000.00 | $1,000.00 | $1,000.00 |
| Show & Sell Commissions | 0.00% | $0.00 | $0.00 | $0.00 | $0.00 | $0.00 | $0.00 | $0.00 | $0.00 | $0.00 | $0.00 | $0.00 | $0.00 |
| Direct Cost of Sales | |||||||||||||
| Retreat Leases | $0 | $0 | $0 | $0 | $0 | $0 | $0 | $0 | $0 | $0 | $0 | $0 | |
| Additional Equine Residents | $0 | $0 | $0 | $0 | $0 | $0 | $0 | $0 | $0 | $0 | $0 | $0 | |
| Feed & Equine Consumables | $500 | $550 | $600 | $700 | $800 | $700 | $600 | $650 | $700 | $650 | $600 | $550 | |
| Resale Tack – Low End | $125 | $188 | $250 | $625 | $250 | $375 | $500 | $625 | $625 | $375 | $375 | $250 | |
| Resale Tack – High End | $200 | $300 | $500 | $1,000 | $100 | $200 | $500 | $500 | $700 | $500 | $300 | $300 | |
| Services – % of Provider Revenue | $0 | $0 | $0 | $0 | $0 | $0 | $0 | $0 | $0 | $0 | $0 | $0 | |
| Web Pages | $0 | $0 | $0 | $0 | $0 | $0 | $0 | $0 | $0 | $0 | $0 | $0 | |
| Websites | $80 | $120 | $200 | $240 | $280 | $360 | $440 | $520 | $600 | $680 | $760 | $840 | |
| EquineAcres Added Services | $0 | $0 | $0 | $0 | $0 | $0 | $0 | $0 | $0 | $0 | $0 | $0 | |
| Major Equipment Sales | $0 | $1,000 | $4,000 | $0 | $1,000 | $3,000 | $3,000 | $2,000 | $2,000 | $2,000 | $2,000 | $1,000 | |
| Show & Sell Commissions | $0 | $0 | $0 | $0 | $0 | $0 | $0 | $0 | $0 | $0 | $0 | $0 | |
| Subtotal Direct Cost of Sales | $905 | $2,158 | $5,550 | $2,565 | $2,430 | $4,635 | $5,040 | $4,295 | $4,625 | $4,205 | $4,035 | $2,940 | |
| Personnel Plan | |||||||||||||
| Month 1 | Month 2 | Month 3 | Month 4 | Month 5 | Month 6 | Month 7 | Month 8 | Month 9 | Month 10 | Month 11 | Month 12 | ||
| Name or title | 0% | $0 | $0 | $0 | $0 | $0 | $0 | $0 | $0 | $0 | $0 | $0 | $0 |
| Other | 0% | $0 | $0 | $0 | $0 | $0 | $0 | $0 | $0 | $0 | $0 | $0 | $0 |
| Total People | 0 | 0 | 0 | 0 | 0 | 0 | 0 | 0 | 0 | 0 | 0 | 0 | |
| Total Payroll | $0 | $0 | $0 | $0 | $0 | $0 | $0 | $0 | $0 | $0 | $0 | $0 | |
| General Assumptions | |||||||||||||
| Month 1 | Month 2 | Month 3 | Month 4 | Month 5 | Month 6 | Month 7 | Month 8 | Month 9 | Month 10 | Month 11 | Month 12 | ||
| Plan Month | 1 | 2 | 3 | 4 | 5 | 6 | 7 | 8 | 9 | 10 | 11 | 12 | |
| Current Interest Rate | 10.00% | 10.00% | 10.00% | 10.00% | 10.00% | 10.00% | 10.00% | 10.00% | 10.00% | 10.00% | 10.00% | 10.00% | |
| Long-term Interest Rate | 10.00% | 10.00% | 10.00% | 10.00% | 10.00% | 10.00% | 10.00% | 10.00% | 10.00% | 10.00% | 10.00% | 10.00% | |
| Tax Rate | 30.00% | 25.00% | 25.00% | 25.00% | 25.00% | 25.00% | 25.00% | 25.00% | 25.00% | 25.00% | 25.00% | 25.00% | |
| Other | 0 | 0 | 0 | 0 | 0 | 0 | 0 | 0 | 0 | 0 | 0 | 0 | |
| Pro Forma Profit and Loss | |||||||||||||
| Month 1 | Month 2 | Month 3 | Month 4 | Month 5 | Month 6 | Month 7 | Month 8 | Month 9 | Month 10 | Month 11 | Month 12 | ||
| Sales | $6,620 | $10,365 | $18,430 | $10,980 | $9,810 | $15,440 | $17,050 | $15,820 | $17,300 | $15,770 | $14,810 | $11,760 | |
| Direct Cost of Sales | $905 | $2,158 | $5,550 | $2,565 | $2,430 | $4,635 | $5,040 | $4,295 | $4,625 | $4,205 | $4,035 | $2,940 | |
| Other | $0 | $0 | $0 | $0 | $0 | $0 | $0 | $0 | $0 | $0 | $0 | $0 | |
| Total Cost of Sales | $905 | $2,158 | $5,550 | $2,565 | $2,430 | $4,635 | $5,040 | $4,295 | $4,625 | $4,205 | $4,035 | $2,940 | |
| Gross Margin | $5,715 | $8,208 | $12,880 | $8,415 | $7,380 | $10,805 | $12,010 | $11,525 | $12,675 | $11,565 | $10,775 | $8,820 | |
| Gross Margin % | 86.33% | 79.18% | 69.89% | 76.64% | 75.23% | 69.98% | 70.44% | 72.85% | 73.27% | 73.34% | 72.75% | 75.00% | |
| Expenses | |||||||||||||
| Payroll | $0 | $0 | $0 | $0 | $0 | $0 | $0 | $0 | $0 | $0 | $0 | $0 | |
| Sales and Marketing and Other Expenses | $200 | $200 | $200 | $200 | $200 | $200 | $200 | $200 | $200 | $200 | $200 | $200 | |
| Depreciation | $0 | $0 | $0 | $0 | $0 | $0 | $0 | $0 | $0 | $0 | $0 | $0 | |
| Leased Equipment | $0 | $0 | $0 | $0 | $0 | $0 | $0 | $0 | $0 | $0 | $0 | $0 | |
| Utilities | $250 | $250 | $250 | $250 | $250 | $250 | $250 | $250 | $250 | $250 | $250 | $250 | |
| Insurance | $400 | $400 | $400 | $400 | $400 | $400 | $400 | $400 | $400 | $400 | $400 | $400 | |
| Rent | $0 | $0 | $0 | $0 | $0 | $0 | $0 | $0 | $0 | $0 | $0 | $0 | |
| Payroll Taxes | 0% | $0 | $0 | $0 | $0 | $0 | $0 | $0 | $0 | $0 | $0 | $0 | $0 |
| Other | $0 | $0 | $0 | $0 | $0 | $0 | $0 | $0 | $0 | $0 | $0 | $0 | |
| Total Operating Expenses | $850 | $850 | $850 | $850 | $850 | $850 | $850 | $850 | $850 | $850 | $850 | $850 | |
| Profit Before Interest and Taxes | $4,865 | $7,358 | $12,030 | $7,565 | $6,530 | $9,955 | $11,160 | $10,675 | $11,825 | $10,715 | $9,925 | $7,970 | |
| EBITDA | $4,865 | $7,358 | $12,030 | $7,565 | $6,530 | $9,955 | $11,160 | $10,675 | $11,825 | $10,715 | $9,925 | $7,970 | |
| Interest Expense | $1,238 | $1,225 | $1,213 | $1,200 | $1,188 | $1,175 | $1,163 | $1,150 | $1,138 | $1,125 | $1,113 | $1,100 | |
| Taxes Incurred | $1,088 | $1,533 | $2,704 | $1,591 | $1,336 | $2,195 | $2,499 | $2,381 | $2,672 | $2,398 | $2,203 | $1,718 | |
| Net Profit | $2,539 | $4,599 | $8,113 | $4,774 | $4,007 | $6,585 | $7,498 | $7,144 | $8,016 | $7,193 | $6,609 | $5,153 | |
| Net Profit/Sales | 38.36% | 44.37% | 44.02% | 43.48% | 40.84% | 42.65% | 43.98% | 45.16% | 46.33% | 45.61% | 44.63% | 43.81% | |
| Pro Forma Cash Flow | |||||||||||||
| Month 1 | Month 2 | Month 3 | Month 4 | Month 5 | Month 6 | Month 7 | Month 8 | Month 9 | Month 10 | Month 11 | Month 12 | ||
| Cash Received | |||||||||||||
| Cash from Operations | |||||||||||||
| Cash Sales | $6,620 | $10,365 | $18,430 | $10,980 | $9,810 | $15,440 | $17,050 | $15,820 | $17,300 | $15,770 | $14,810 | $11,760 | |
| Subtotal Cash from Operations | $6,620 | $10,365 | $18,430 | $10,980 | $9,810 | $15,440 | $17,050 | $15,820 | $17,300 | $15,770 | $14,810 | $11,760 | |
| Additional Cash Received | |||||||||||||
| Sales Tax, VAT, HST/GST Received | 0.00% | $0 | $0 | $0 | $0 | $0 | $0 | $0 | $0 | $0 | $0 | $0 | $0 |
| New Current Borrowing | $0 | $0 | $0 | $0 | $0 | $0 | $0 | $0 | $0 | $0 | $0 | $0 | |
| New Other Liabilities (interest-free) | $0 | $0 | $0 | $0 | $0 | $0 | $0 | $0 | $0 | $0 | $0 | $0 | |
| New Long-term Liabilities | $0 | $0 | $0 | $0 | $0 | $0 | $0 | $0 | $0 | $0 | $0 | $0 | |
| Sales of Other Current Assets | $0 | $0 | $0 | $0 | $0 | $0 | $0 | $0 | $0 | $0 | $0 | $0 | |
| Sales of Long-term Assets | $0 | $0 | $0 | $0 | $0 | $0 | $0 | $0 | $0 | $0 | $0 | $0 | |
| New Investment Received | $0 | $0 | $0 | $0 | $0 | $0 | $0 | $0 | $0 | $0 | $0 | $0 | |
| Subtotal Cash Received | $6,620 | $10,365 | $18,430 | $10,980 | $9,810 | $15,440 | $17,050 | $15,820 | $17,300 | $15,770 | $14,810 | $11,760 | |
| Expenditures | Month 1 | Month 2 | Month 3 | Month 4 | Month 5 | Month 6 | Month 7 | Month 8 | Month 9 | Month 10 | Month 11 | Month 12 | |
| Expenditures from Operations | |||||||||||||
| Cash Spending | $0 | $0 | $0 | $0 | $0 | $0 | $0 | $0 | $0 | $0 | $0 | $0 | |
| Bill Payments | $106 | $3,223 | $4,904 | $13,156 | $3,684 | $5,148 | $11,238 | $9,926 | $7,916 | $9,596 | $8,112 | $7,927 | |
| Subtotal Spent on Operations | $106 | $3,223 | $4,904 | $13,156 | $3,684 | $5,148 | $11,238 | $9,926 | $7,916 | $9,596 | $8,112 | $7,927 | |
| Additional Cash Spent | |||||||||||||
| Sales Tax, VAT, HST/GST Paid Out | $0 | $0 | $0 | $0 | $0 | $0 | $0 | $0 | $0 | $0 | $0 | $0 | |
| Principal Repayment of Current Borrowing | $0 | $0 | $0 | $0 | $0 | $0 | $0 | $0 | $0 | $0 | $0 | $0 | |
| Other Liabilities Principal Repayment | $0 | $0 | $0 | $0 | $0 | $0 | $0 | $0 | $0 | $0 | $0 | $0 | |
| Long-term Liabilities Principal Repayment | $1,500 | $1,500 | $1,500 | $1,500 | $1,500 | $1,500 | $1,500 | $1,500 | $1,500 | $1,500 | $1,500 | $1,500 | |
| Purchase Other Current Assets | $0 | $0 | $0 | $0 | $0 | $0 | $0 | $0 | $0 | $0 | $0 | $0 | |
| Purchase Long-term Assets | $0 | $0 | $0 | $0 | $0 | $0 | $0 | $0 | $0 | $0 | $0 | $0 | |
| Dividends | $0 | $0 | $0 | $0 | $0 | $0 | $0 | $0 | $0 | $0 | $0 | $0 | |
| Subtotal Cash Spent | $1,606 | $4,723 | $6,404 | $14,656 | $5,184 | $6,648 | $12,738 | $11,426 | $9,416 | $11,096 | $9,612 | $9,427 | |
| Net Cash Flow | $5,014 | $5,642 | $12,026 | ($3,676) | $4,626 | $8,792 | $4,312 | $4,394 | $7,884 | $4,674 | $5,198 | $2,333 | |
| Cash Balance | $32,014 | $37,656 | $49,682 | $46,005 | $50,631 | $59,423 | $63,736 | $68,130 | $76,013 | $80,687 | $85,885 | $88,218 | |
| Pro Forma Balance Sheet | |||||||||||||
| Month 1 | Month 2 | Month 3 | Month 4 | Month 5 | Month 6 | Month 7 | Month 8 | Month 9 | Month 10 | Month 11 | Month 12 | ||
| Assets | Starting Balances | ||||||||||||
| Current Assets | |||||||||||||
| Cash | $27,000 | $32,014 | $37,656 | $49,682 | $46,005 | $50,631 | $59,423 | $63,736 | $68,130 | $76,013 | $80,687 | $85,885 | $88,218 |
| Inventory | $5,000 | $4,095 | $2,938 | $6,105 | $3,540 | $2,673 | $5,099 | $5,544 | $4,725 | $5,088 | $4,626 | $4,439 | $3,234 |
| Other Current Assets | $0 | $0 | $0 | $0 | $0 | $0 | $0 | $0 | $0 | $0 | $0 | $0 | $0 |
| Total Current Assets | $32,000 | $36,109 | $40,593 | $55,787 | $49,545 | $53,304 | $64,522 | $69,280 | $72,854 | $81,101 | $85,312 | $90,323 | $91,452 |
| Long-term Assets | |||||||||||||
| Long-term Assets | $60,000 | $60,000 | $60,000 | $60,000 | $60,000 | $60,000 | $60,000 | $60,000 | $60,000 | $60,000 | $60,000 | $60,000 | $60,000 |
| Accumulated Depreciation | $0 | $0 | $0 | $0 | $0 | $0 | $0 | $0 | $0 | $0 | $0 | $0 | $0 |
| Total Long-term Assets | $60,000 | $60,000 | $60,000 | $60,000 | $60,000 | $60,000 | $60,000 | $60,000 | $60,000 | $60,000 | $60,000 | $60,000 | $60,000 |
| Total Assets | $92,000 | $96,109 | $100,593 | $115,787 | $109,545 | $113,304 | $124,522 | $129,280 | $132,854 | $141,101 | $145,312 | $150,323 | $151,452 |
| Liabilities and Capital | Month 1 | Month 2 | Month 3 | Month 4 | Month 5 | Month 6 | Month 7 | Month 8 | Month 9 | Month 10 | Month 11 | Month 12 | |
| Current Liabilities | |||||||||||||
| Accounts Payable | $0 | $3,070 | $4,455 | $13,035 | $3,520 | $4,772 | $10,904 | $9,664 | $7,595 | $9,326 | $7,845 | $7,747 | $5,223 |
| Current Borrowing | $0 | $0 | $0 | $0 | $0 | $0 | $0 | $0 | $0 | $0 | $0 | $0 | $0 |
| Other Current Liabilities | $0 | $0 | $0 | $0 | $0 | $0 | $0 | $0 | $0 | $0 | $0 | $0 | $0 |
| Subtotal Current Liabilities | $0 | $3,070 | $4,455 | $13,035 | $3,520 | $4,772 | $10,904 | $9,664 | $7,595 | $9,326 | $7,845 | $7,747 | $5,223 |
| Long-term Liabilities | $150,000 | $148,500 | $147,000 | $145,500 | $144,000 | $142,500 | $141,000 | $139,500 | $138,000 | $136,500 | $135,000 | $133,500 | $132,000 |
| Total Liabilities | $150,000 | $151,570 | $151,455 | $158,535 | $147,520 | $147,272 | $151,904 | $149,164 | $145,595 | $145,826 | $142,845 | $141,247 | $137,223 |
| Paid-in Capital | $0 | $0 | $0 | $0 | $0 | $0 | $0 | $0 | $0 | $0 | $0 | $0 | $0 |
| Retained Earnings | ($58,000) | ($58,000) | ($58,000) | ($58,000) | ($58,000) | ($58,000) | ($58,000) | ($58,000) | ($58,000) | ($58,000) | ($58,000) | ($58,000) | ($58,000) |
| Earnings | $0 | $2,539 | $7,139 | $15,252 | $20,026 | $24,032 | $30,617 | $38,116 | $45,259 | $53,275 | $60,467 | $67,077 | $72,229 |
| Total Capital | ($58,000) | ($55,461) | ($50,861) | ($42,748) | ($37,975) | ($33,968) | ($27,383) | ($19,885) | ($12,741) | ($4,725) | $2,467 | $9,077 | $14,229 |
| Total Liabilities and Capital | $92,000 | $96,109 | $100,593 | $115,787 | $109,545 | $113,304 | $124,522 | $129,280 | $132,854 | $141,101 | $145,312 | $150,323 | $151,452 |
| Net Worth | ($58,000) | ($55,461) | ($50,861) | ($42,748) | ($37,975) | ($33,968) | ($27,383) | ($19,884) | ($12,741) | ($4,725) | $2,467 | $9,077 | $14,229 |

