
Arz al-Lubnan Hookah Bar
Executive Summary
Arz al-Lubnan Hookah Bar (Cedars of Lebanon) is a new hookah bar concept which will focus on a combination of Middle Eastern customers and customers over 22 years in age to offer a more adult alternative to hookah bars frequented by college-age customers. The first bar will be established in Trendytown, and managed by the business founders, Sayed and Yasmine Batroun. The business will generate revenues through the sale of flavored tobaccos, non-alcoholic drinks, and appetizers. The business seeks angel investor funding to launch its first bar.
The business projects to become profitable in its first year with good profit from strong sales in the first year. Sales will triple by the third year of operation. Net profit of sales will be respectable due to the high margin on the products sold. Exit for investors is possible from sale of the franchise to a chain of bars looking to expand their market.

Objectives
Arz al-Lubnan Hookah Bar seeks to achieve the following objectives with the launch of its first hookah lounge:
- To establish a community of hookah smokers who contribute programming, events, and culture ideas to Arz al-Lubnan Hookah Bar resulting in 50 events or programs held in its third year of operation.
- To maintain a Facebook Fan page of 5,000 individuals by the end of its third year as a sign of its community.
- To become profitable in its second year through the sale of tobacco, food and drinks.
- To establish a franchisable model for hookah bars and initiate fundraising and planning for franchising by its fifth year of operation.
Mission
The mission of Arz al-Lubnan Hookah Bar is to provide a comfortable environment, sometimes relaxing and sometimes energetic and stimulating, around which those who love hookah smoking, as well as new converts, can come together. The environment will draw on elements of Middle Eastern culture as well as the culture of the local environment.
Keys to Success
The keys to success for Arz al-Lubnan Hookah Bar are:
- Create a comfortable environment
- Provide high quality tobacco, food, drinks, and hookah equipment
- Establish a loyal core following
- Expand the market of hookah smokers in the Trendytown area
- Energize the customer base to generate their own culture and events at Arz al-Lubnan Hookah Bar
Company Summary
Arz al-Lubnan Hookah Bar is a new concept for a hookah lounge which centers around the community aspect of smoking hookah pipes. The business will launch its first hookah lounge in Trendytown within six months and endeavor to create a scalable model which can be franchised in additional urban locations. The business will earn revenues through the sale of tobacco (multiple flavors), drinks (coffee, tea, and juices) and food (Middle Eastern and American snacks and appetizers requiring light preparation). The customers are expected to be those of Middle Eastern descent and their friends, those interested in Middle Eastern and hookah culture, and young (22-35 year old) urbanites interested in a community-oriented experience that is an alternative to bars serving alcohol and coffee shops.
Company Ownership
Arz al-Lubnan Hookah Bar is owned and established by the husband and wife team of Sayed and Yasmine Batroun, Lebanese-American residents of Trendytown who have developed the concept for the store after working in hookah lounges while overseas. The business is established as an S Corporation to allow for additional investors to join. Sayed currently owns 51% of stock and Yasmine owns 49%. 40% of shares will be provided to investors in the initial round of funding, diluting the founders’ shares to 60% between the two of them.
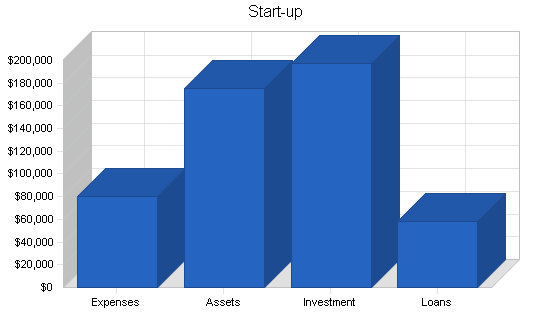
Start-up Summary
The start-up expenses for Arz al-Lubnan Hookah Bar include legal consultation and permit fees as a retail and food service establishment, as well as a special permit for the lounge to allow smoking within. Stationery includes business cards, letterhead, and business brochures.
Insurance includes initial general and product liability premiums as well as renter’s and key-employee insurance. Rent covers one month’s security and two month’s rent for the initial location to allow for build out of the space before opening. Start-up marketing covers the marketing campaign before launch, as described in the marketing plan. The website is a significant expense. It offers basic information on the business as well as a scalable social networking component to allow for the organizing of hookah groups and the planning of events.
The cash required will see the business through until cash flow break even is achieved. Current assets includes lounge furniture ($10,000), tables ($10,000), kitchen supplies and tools ($10,000), silverware, plates, glassware, and hookahs ($10,000). Long-term assets include basic improvements to the space ($30,000 for additional plumbing, electrical work, taking down and putting up walls where needed, painting, refinishing floors), lighting fixtures ($10,000), sound system ($10,000), POS sales system and wireless devices ($20,000), kitchen equipment ($20,000 for stoves, refrigerator, and warming units), office equipment ($5,000 for computer, printer, fax, telephones).
| Start-up | |
| Requirements | |
| Start-up Expenses | |
| Legal Help and Permits | $5,000 |
| Stationery etc. | $2,000 |
| Insurance | $2,000 |
| Rent | $6,000 |
| Start-up Marketing | $15,000 |
| Website | $50,000 |
| Total Start-up Expenses | $80,000 |
| Start-up Assets | |
| Cash Required | $40,000 |
| Other Current Assets | $40,000 |
| Long-term Assets | $95,000 |
| Total Assets | $175,000 |
| Total Requirements | $255,000 |
Products and Services
Arz al-Lubnan Hookah Bar will specialize in non-alcoholic, organic drinks, and healthy appetizers and snacks of both Middle Eastern and American origin. The initial menu includes:
- Assortment of organic teas
- Assortment of organic coffees
- Fruit juices and juice blends
- “Mocktails” featuring fruit juices and fresh fruit
- Salads
- Crudite and dips
- Pita or pita chips and hummus/other dips
- Falafel
- Spinach fatayer
- Onion rings
- Fried fava beans
Prices for drinks will range from $3 for simple teas or small coffees to $12 for certain mocktails. Prices for appetizers will range from $5 to $8 for single servings and $12 to $25 for group dishes (serving 4-6 people).
Flavored tobacco for hookah pipes will be sold as well for $15 for the first round and $12 for subsequent rounds. flavors include:
- Cherry
- Strawberry
- Blackberry
- Mixed Fruit
- Apple
- Licorice
- Candy
- Jasmine
- Banana
- Rose
- Grape
- Lebanese Blend
- Pistachio
- Lemon
- Cola
- Mint
- Orange
- Peach
- Vanilla
- Mango
The facility will include a stage area where performances, talks, and films can be presented. These will be organized by customer groups who will book the space free of charge for events that are acceptable to Arz al-Lubnan Hookah Bar management.
Market Analysis Summary
The market for hookah bars in the United States has grown significantly in the past decade. Hookah-bars.com reports that, as of October 2008, there were at least 470 hookah bars in the U.S. and an average of five new hookah bars were opening every month. From these numbers, it can be estimated that between 2-5 million current hookah smokers live in the United States. Of these hookah smokers, approximately 10% are of Middle Eastern origin and the remaining groups are of American origin but have grown to embrace hookah culture.
In Trendytown, Arz al-Lubnan Hookah Bar will focus on locals in the greater Trendytown area of Middle Eastern origin and young professionals.
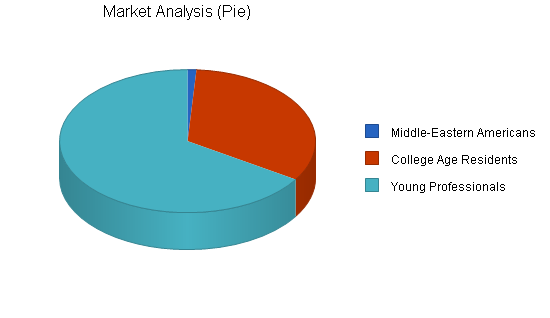
Market Segmentation
Arz al-Lubnan Hookah Bar has determined the following market segmentation for potential customers:
Middle Eastern Americans: Area residents who have either immigrated from the Middle East or have family origins in the Middle East. They value the connection that hookah bars provide with their culture and traditional elements. As many Muslims do not drink alcohol, they do not feel alienated in hookah bars, which they sometimes do in bars which focus on liquor. They appreciate being able to meet other Middle Eastern Americans at hookah bars, both for friendship and for dating. While this is a small market segment in Trendytown, they use hookah bars more frequently than other groups.

College Age Residents: College students who seek an alternative to bars and parties on their campuses seek out different experiences. Hookah bars provide such an experience because of their exotic ambiance, colorful atmosphere, focus on group dynamics, and the element of danger/risk provided by smoking. Furthermore, those between the ages of 18 and 21 can frequent hookah bars while they cannot go to many bars that serve alcohol.
Young Professionals: 22-35 year-old professionals who are tired with bar culture sometimes react against it by looking for other activities. They seek locations where they can congregate with friends, talk, and share a new experience. However, they are turned off by hookah bars with a high percentage of college age customers.
| Market Analysis | |||||||
| Year 1 | Year 2 | Year 3 | Year 4 | Year 5 | |||
| Potential Customers | Growth | CAGR | |||||
| Middle-Eastern Americans | 3% | 500 | 515 | 530 | 546 | 562 | 2.97% |
| College Age Residents | 3% | 15,000 | 15,450 | 15,914 | 16,391 | 16,883 | 3.00% |
| Young Professionals | 3% | 30,000 | 30,900 | 31,827 | 32,782 | 33,765 | 3.00% |
| Total | 3.00% | 45,500 | 46,865 | 48,271 | 49,719 | 51,210 | 3.00% |
Target Market Segment Strategy
Arz al-Lubnan Hookah Bar will target Middle Eastern Americans and young professionals, and not college age residents. By seeking the target market segments described here, Arz al-Lubnan Hookah Bar intends to establish a base of Middle Eastern devotees who will serve to give the bar credibility and authenticity. These devotees will feel comfortable bringing their non-Middle Eastern friends to Arz al-Lubnan Hookah Bar. These additional customers must be sought to prove Arz al-Lubnan Hookah Bar as a franchisable model for American consumers. Therefore, Arz al-Lubnan Hookah Bar will be positioned for young professionals as an alternative to bars where community can be developed, as well as a non-threatening fusion of American and Middle Eastern cultural aspects, rather than a total immersion in Middle Eastern culture.
These markets exist throughout the United States and the Trendytown location will serve as a proving ground for the Arz al-Lubnan Hookah Bar model.
Service Business Analysis
Over 470 hookah bars are in existence in the United States, spread throughout the country with some concentration in cities. From 2000 to 2004, at least 200-300 new hookah bars opened for business, according to the journal Smokeshop. Generally, as long as 80% of sales are derived from tobacco, smoking within hookah establishments can be permitted by law.
The hookah bar industry is highly fragmented, with most bars being independent establishments. A small percentage open a second or third location. There are currently no national hookah bar franchises.
Indirect competitors to hookah bars are coffee shops, bars that serve liquor, and cigar stores/tobacconists.
Typically, hookah tobacco is sold and pipes are provided to customers in hookah bars. Tobacco is sold in rounds which serves a group of four to six for about an hour. Food and drinks are sold via waiter or bar service while customers sit in groups and smoke. While some attend hookah bars alone, customers typically attend with groups and sit at round tables with their group.
Competition and Buying Patterns
Hookah bar customers in the United States judge between establishments based on location (they will not be willing to travel too far out of their way for a hookah bar) the variety of flavors served, the atmosphere, and the additional food and drink options served.
Specific competitors for Arz al-Lubnan Hookah Bar include Ali Baba Hookah Bar, Babylon Hookah Lounge, Desert Cafe, and Zee’s Smoking Corner.
Ali Baba Hookah Bar: With DJs and dance parties on weekends, Ali Baba’s serves a younger crowd who enjoy meeting others.
Babylon Hookah Lounge: Also has DJs and tends toward a young consumer base. Older customers complain that the lounge is loud, much like a rave concert.
Desert Cafe: Loved by regulars for its owner and its atmosphere, Desert Cafe has plasma TVs, outdoor seating in summer and atmospheric lighting. The location is faulted for its low quality tobacco and lack of upkeep on their hookahs.
Zee’s Smoking Corner: With an extensive list of flavors, Zee’s also focuses on college age residents and drives away others with its loud music and party atmosphere.
Web Plan Summary
The website for Arz al-Lubnan Hookah Bar will offer a standard “brochure-style” presentation with details on the products, services, location, and concept of the bar, as well as an extended social community component, tied in to Facebook. The website will serve casual customers interested in the bar as well as fans who become involved in creating cultural events and groups at Arz al-Lubnan Hookah Bar through the social portal, which will include a basic calendar visible to all users and extended features reserved for members who log-in.
Website Marketing Strategy
The website for Arz al-Lubnan Hookah Bar will be promoted through PR, direct advertising, search engine optimization, and the growing community of customers.
- PR efforts will include promotion to blog writers for the Trendytown area and hookah bars/Middle Eastern culture and guest posts by the owners to these blogs. PR will also focus on the notable social media component of the website as it ties in to developing programming for Arz al-Lubnan Hookah Bar
- Direct advertising will include Google ads, Facebook ads, and targeted ads on a few area websites. $1,000 a month will be devoted to this type of advertising in the first year
- Search engine optimization will begin during the development of the website through its initial design and will continue with an outsourced firm retained to continue SEO work for $1,000 a month
- The community of customers will generate word-of-mouth and online referrals by inviting friends to the Arz al-Lubnan Hookah Bar website through Facebook or Arz al-Lubnan Hookah Bar’s social network component
Development Requirements
Development of the website requires an experienced Web development firm with past success in developing social networking components for businesses. The website will include the following in its basic, front end:
- About Us – background on the business and its concept and mission
- FAQs about hookah smoking and Arz al-Lubnan Hookah Bar
- Menu of food, drinks, and tobacco
- Photo gallery
- Contact page
- Location and Directions page with connection to maps from Google Maps or MapQuest
The social portal of the site will include:
- Membership sign-up and log-in pages
- Social calendar for Arz al-Lubnan Hookah Bar
- Step-by-step instructions for creating an event, discussion group, or throwing a party at Arz al-Lubnan Hookah Bar
- Individual pages for user-created events
- Account page for each user showing events they are signed up for or have created
- Sharing buttons to make it easy for users to send event information via Facebook, MySpace, Twitter
- Automated tie-ins between the site and the Facebook Fan Page to minimize changes that must be made in two places
Furthermore, the developer will create a Facebook Fan Page, and a back end for the site including:
- Form to allow management to make changes to menu offerings and prices without the need to use HTML
- Approval area for management to approve, reject, or request additional information on events
- Ability for management to add or remove photos from photo gallery and to organize them into albums
Development of the website will occur over a three month period. The first two months will produce a beta version which will be tested by management, with revisions given to developers, for one month after that. It is expected that additional changes will extend over the first few months of operation and $500/month of the marketing budget is devoted to ongoing maintenance and development in the first year.
Strategy and Implementation Summary
The focus for implementation will be on establishing the quality of the offering, its suitability for the 22+ target market, and the infrastructure to allow for community-driven culture. The fostering of the Arz al-Lubnan Hookah Bar community will be important to the growth of the business and its proof as a franchisable model.
Competitive Edge
Arz al-Lubnan Hookah Bar’s competitive edge will be established through its community organizing ability via its website. This website will present an interface for users to:
- Connect with each other and Arz al-Lubnan Hookah Bar after they have left the establishment
- Organize groups to attend Arz al-Lubnan Hookah Bar together
- Plan events to propose for the Arz al-Lubnan Hookah Bar calendar
- Send out invites for these events
The party-like atmosphere at other hookah bars does not allow for easy conversation and for performances and events of the type expected at Arz al-Lubnan Hookah Bar.
Marketing Strategy
The marketing strategy of Arz al-Lubnan Hookah Bar will be to establish a base of Middle Eastern American customers first, and using these customers to bring in other young professional as friends. To that end, the following tactics will be employed:
- Seeking mention in blogs for the local area
- Pitching the story of its concept and opening to Middle Eastern cultural and language publications specifically, and area newspapers and magazines in general
- Advertising with posters and flyers in the downtown Trendytown area
The bar’s grand opening will be marked by an event featuring live music, free food and drink offers, and door prizes.
After the launch, promotional incentives for customers will be advertised in newspaper advertisements, on the website, and in the store for:
- Group discounts
- Free prizes for winners of business card drawing (to encourage target market of young professionals)
- Incentives to organize the first events via the website (such as free rounds of tobacco for the organizers at a later date)
These expenses are included in the Profit and Loss statement for Arz al-Lubnan Hookah Bar as marketing expense.
Sales Strategy
Arz al-Lubnan Hookah Bar will sell its products through attentive wait staff and bar counter staff. They will be compensated through base hourly wages and tips and will work to provide the best customer service possible. Wait staff will use wireless tablets to place orders which are sent over the bar’s wireless network to kitchen staff and bar staff to prepare dishes and drinks.
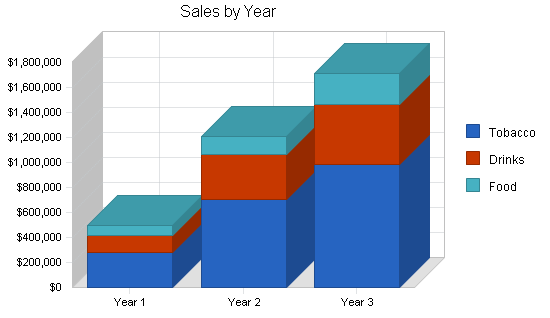
Sales Forecast
Sales will be predominantly through tobacco revenues, which also has a relatively low cost of sales. Secondary revenue streams are food and drinks which will be sold to some, but not all, customers who order tobacco. Sharp growth is expected over the first three years of operation as the community aspect of Arz al-Lubnan Hookah Bar is developed and customer-directed programming begins to take place.
It is expected that a customer will return to Arz al-Lubnan Hookah Bar on average 15 times a year, taking part in 20 rounds of tobacco in that time. Therefore, this projection represents 1,000 customer groups in the first year, 2,500 customer groups in the second year and 3,500 customer groups in the third year.

| Sales Forecast | |||
| Year 1 | Year 2 | Year 3 | |
| Unit Sales | |||
| Tobacco | 19,791 | 50,000 | 70,000 |
| Drinks | 23,749 | 60,000 | 80,000 |
| Food | 15,831 | 30,000 | 50,000 |
| Total Unit Sales | 59,371 | 140,000 | 200,000 |
| Unit Prices | Year 1 | Year 2 | Year 3 |
| Tobacco | $14.00 | $14.00 | $14.00 |
| Drinks | $6.00 | $6.00 | $6.00 |
| Food | $5.00 | $5.00 | $5.00 |
| Sales | |||
| Tobacco | $277,074 | $700,000 | $980,000 |
| Drinks | $142,494 | $360,000 | $480,000 |
| Food | $79,155 | $150,000 | $250,000 |
| Total Sales | $498,723 | $1,210,000 | $1,710,000 |
| Direct Unit Costs | Year 1 | Year 2 | Year 3 |
| Tobacco | $4.20 | $4.20 | $4.20 |
| Drinks | $1.20 | $1.20 | $1.20 |
| Food | $1.50 | $1.50 | $1.50 |
| Direct Cost of Sales | |||
| Tobacco | $83,122 | $210,000 | $294,000 |
| Drinks | $28,499 | $72,000 | $96,000 |
| Food | $23,747 | $45,000 | $75,000 |
| Subtotal Direct Cost of Sales | $135,368 | $327,000 | $465,000 |
Milestones
The $15,000 in start-up marketing will be spent on the downtown ad campaign (design and production of posters and flyers, as well as purchasing ad space), PR campaign (creation and mailing of press kit), and the grand opening event (live music, door prizes, decorations, free food and drink offers).
After the launch, the business will hold a series of promotions – first the business card drawing and then event incentives – to initiate programming at Arz al-Lubnan Hookah Bar.

| Milestones | |||||
| Milestone | Start Date | End Date | Budget | Manager | Department |
| PR Campaign | 1/1/2010 | 2/28/2010 | $1,000 | YB | Marketing |
| Downtown Ad Campaign | 2/1/2010 | 2/28/2010 | $5,000 | YB | Marketing |
| Bar Grand Opening | 3/1/2010 | 3/1/2010 | $9,000 | SB | Operations |
| Business Card Drawing | 5/1/2010 | 5/30/2010 | $5,000 | YB | Marketing |
| Event Incentives | 6/1/2010 | 8/1/2010 | $5,000 | WG | Marketing |
| Totals | $25,000 | ||||
Management Summary
Arz al-Lubnan Hookah Bar is managed by the husband and wife team of Sayed and Yasmine Batroun, Lebanese-American residents of Trendytown who have developed the concept for the store after working in hookah lounges while overseas.
Sayed Batroun will manage store operations and train wait and kitchen staff. He has culinary experience with ten years as a cook. He will handle procurement and inventory management. He will also work as head cook during initial operations.
Yasmine Batroun will manage marketing, business development, and finance. She has an MBA and corporate experience as a marketing associate for a Fortune 500 business. She will oversee accounting and bookkeeping. She will provide general management in the restaurant as needed, including management of events.
In the second year of operation a general manager will be hired to take over staff supervision, staff training, procurement and inventory management. Sayed Batroun will continue to serve as head cook but will work on a more strategic level in other areas.
Additional staff will include kitchen staff and wait staff.
Personnel Plan
Staff will include two bartenders, two wait staff, and one kitchen staff initially. This will grow to four bartenders, six wait staff and three kitchen staff. Wages for bartenders and wait staff are lower as they are significantly augmented by tips. These personnel assumptions are based on the bar being open 80 hours per week.
| Personnel Plan | |||
| Year 1 | Year 2 | Year 3 | |
| Sayed Batroun | $36,000 | $36,000 | $36,000 |
| Yamine Batroun | $36,000 | $36,000 | $36,000 |
| Bar Staff | $48,000 | $75,000 | $110,000 |
| Wait Staff | $33,600 | $70,000 | $120,000 |
| Kitchen Staff | $30,000 | $70,000 | $120,000 |
| General Manager | $0 | $50,000 | $60,000 |
| Total People | 7 | 11 | 15 |
| Total Payroll | $183,600 | $337,000 | $482,000 |
Financial Plan
The business is expected to grow significantly in its first three years as it meets the market need for an alternative to local youth-oriented hookah bars. Growth to a second location will occur in the fourth year, financed by the cash reserves of the business.
Start-up Funding
While the owners will invest substantially in the company, the bulk of the start-up funding will be provided primarily by outside investors, with an additional long-term loan against the assets of the bar. Credit card debt will make up the remainder.
Investors will be provided with 40% of shares for their investment, as the current partners are contributing considerable sweat and financial equity of their own, as well as their specific expertise and credibility as Lebanese-Americans.
| Start-up Funding | |
| Start-up Expenses to Fund | $80,000 |
| Start-up Assets to Fund | $175,000 |
| Total Funding Required | $255,000 |
| Assets | |
| Non-cash Assets from Start-up | $135,000 |
| Cash Requirements from Start-up | $40,000 |
| Additional Cash Raised | $0 |
| Cash Balance on Starting Date | $40,000 |
| Total Assets | $175,000 |
| Liabilities and Capital | |
| Liabilities | |
| Current Borrowing | $8,000 |
| Long-term Liabilities | $50,000 |
| Accounts Payable (Outstanding Bills) | $0 |
| Other Current Liabilities (interest-free) | $0 |
| Total Liabilities | $58,000 |
| Capital | |
| Planned Investment | |
| Sivrihisar Geobekli | $35,000 |
| Willusa Geobekli | $35,000 |
| Other Investors | $127,000 |
| Additional Investment Requirement | $0 |
| Total Planned Investment | $197,000 |
| Loss at Start-up (Start-up Expenses) | ($80,000) |
| Total Capital | $117,000 |
| Total Capital and Liabilities | $175,000 |
| Total Funding | $255,000 |
Important Assumptions
We assume that the growth in hookah bar popularity will continue and that the country is ready for a national chain. We assume that anti-smoking lobbyists and anti-Middle Eastern sentiment in the Unites States will not damage the reputation and image of hookah bars.
Break-even Analysis
A projected monthly fixed operating cost is shown in the table below. With this level of fixed cost, break even is expected in the sixth month of operation.

| Break-even Analysis | |
| Monthly Units Break-even | 4,200 |
| Monthly Revenue Break-even | $35,279 |
| Assumptions: | |
| Average Per-Unit Revenue | $8.40 |
| Average Per-Unit Variable Cost | $2.28 |
| Estimated Monthly Fixed Cost | $25,703 |
Projected Profit and Loss
Key expenses will include the cost of sales attributed to supplies and raw materials, payroll for the growing staff, marketing to promote the bar in the community, and the bar’s rent and depreciation. The bar will show a profit in the first year which will continue to grow. This is expected due to the high gross margins of selling tobacco through hookahs and the type of food and drinks sold.


| Pro Forma Profit and Loss | |||
| Year 1 | Year 2 | Year 3 | |
| Sales | $498,723 | $1,210,000 | $1,710,000 |
| Direct Cost of Sales | $135,368 | $327,000 | $465,000 |
| Other Costs of Sales | $15,914 | $48,400 | $51,300 |
| Total Cost of Sales | $151,282 | $375,400 | $516,300 |
| Gross Margin | $347,442 | $834,600 | $1,193,700 |
| Gross Margin % | 69.67% | 68.98% | 69.81% |
| Expenses | |||
| Payroll | $183,600 | $337,000 | $482,000 |
| Marketing/Promotion | $44,000 | $55,000 | $75,000 |
| Depreciation | $16,800 | $20,000 | $24,000 |
| Rent | $24,000 | $2,500 | $26,500 |
| Utilities | $3,600 | $4,000 | $4,500 |
| Insurance | $2,400 | $2,700 | $3,000 |
| Payroll Taxes | $27,540 | $50,550 | $72,300 |
| Permit Renewals | $500 | $2,000 | $800 |
| Supplies | $6,000 | $15,000 | $25,000 |
| Total Operating Expenses | $308,440 | $488,750 | $713,100 |
| Profit Before Interest and Taxes | $39,002 | $345,850 | $480,600 |
| EBITDA | $55,802 | $365,850 | $504,600 |
| Interest Expense | $5,341 | $3,200 | $1,400 |
| Taxes Incurred | $10,098 | $102,795 | $143,760 |
| Net Profit | $23,562 | $239,855 | $335,440 |
| Net Profit/Sales | 4.72% | 19.82% | 19.62% |
Projected Cash Flow
The cash flow table and chart show the business becoming cash flow positive within six months of operation. Cash will be retained in the business and invested in short-term holdings in preparation for expansion of the franchise after the third year of operation.
Long-term debt will be paid over the first three years of operation with a grace period for the first six months. Short-term borrowings will be paid over the first year of operations.
Some current assets must be replenished each year, and long-term assets must be replaced beginning in the second year as some equipment ages.

| Pro Forma Cash Flow | |||
| Year 1 | Year 2 | Year 3 | |
| Cash Received | |||
| Cash from Operations | |||
| Cash Sales | $498,723 | $1,210,000 | $1,710,000 |
| Subtotal Cash from Operations | $498,723 | $1,210,000 | $1,710,000 |
| Additional Cash Received | |||
| Sales Tax, VAT, HST/GST Received | $44,885 | $108,900 | $153,900 |
| New Current Borrowing | $0 | $0 | $0 |
| New Other Liabilities (interest-free) | $0 | $0 | $0 |
| New Long-term Liabilities | $0 | $0 | $0 |
| Sales of Other Current Assets | $0 | $0 | $0 |
| Sales of Long-term Assets | $0 | $0 | $0 |
| New Investment Received | $0 | $0 | $0 |
| Subtotal Cash Received | $543,608 | $1,318,900 | $1,863,900 |
| Expenditures | Year 1 | Year 2 | Year 3 |
| Expenditures from Operations | |||
| Cash Spending | $183,600 | $337,000 | $482,000 |
| Bill Payments | $228,259 | $609,251 | $847,567 |
| Subtotal Spent on Operations | $411,859 | $946,251 | $1,329,567 |
| Additional Cash Spent | |||
| Sales Tax, VAT, HST/GST Paid Out | $44,885 | $108,900 | $153,900 |
| Principal Repayment of Current Borrowing | $8,000 | $0 | $0 |
| Other Liabilities Principal Repayment | $0 | $0 | $0 |
| Long-term Liabilities Principal Repayment | $9,000 | $18,000 | $18,000 |
| Purchase Other Current Assets | $2,400 | $3,000 | $3,500 |
| Purchase Long-term Assets | $0 | $10,000 | $10,000 |
| Dividends | $0 | $0 | $0 |
| Subtotal Cash Spent | $476,144 | $1,086,151 | $1,514,967 |
| Net Cash Flow | $67,464 | $232,749 | $348,933 |
| Cash Balance | $107,464 | $340,213 | $689,146 |
Projected Balance Sheet
The net worth of Arz al-Lubnan Hookah Bar will grow significantly due to relatively low liabilities and high cash reserves as the business prepares for future self-financed expansion.
| Pro Forma Balance Sheet | |||
| Year 1 | Year 2 | Year 3 | |
| Assets | |||
| Current Assets | |||
| Cash | $107,464 | $340,213 | $689,146 |
| Other Current Assets | $42,400 | $45,400 | $48,900 |
| Total Current Assets | $149,864 | $385,613 | $738,046 |
| Long-term Assets | |||
| Long-term Assets | $95,000 | $105,000 | $115,000 |
| Accumulated Depreciation | $16,800 | $36,800 | $60,800 |
| Total Long-term Assets | $78,200 | $68,200 | $54,200 |
| Total Assets | $228,064 | $453,813 | $792,246 |
| Liabilities and Capital | Year 1 | Year 2 | Year 3 |
| Current Liabilities | |||
| Accounts Payable | $46,502 | $50,395 | $71,388 |
| Current Borrowing | $0 | $0 | $0 |
| Other Current Liabilities | $0 | $0 | $0 |
| Subtotal Current Liabilities | $46,502 | $50,395 | $71,388 |
| Long-term Liabilities | $41,000 | $23,000 | $5,000 |
| Total Liabilities | $87,502 | $73,395 | $76,388 |
| Paid-in Capital | $197,000 | $197,000 | $197,000 |
| Retained Earnings | ($80,000) | ($56,438) | $183,417 |
| Earnings | $23,562 | $239,855 | $335,440 |
| Total Capital | $140,562 | $380,417 | $715,857 |
| Total Liabilities and Capital | $228,064 | $453,813 | $792,246 |
| Net Worth | $140,562 | $380,417 | $715,857 |
Business Ratios
The business is compared here against Snack and Nonalcoholic Beverage Bars, industry SIC code 5812, NAICS code 722213, with over $1 million in annual revenue. Gross margin is expected to be higher than average due to the premium that can be earned from tobacco sales.
| Ratio Analysis | ||||
| Year 1 | Year 2 | Year 3 | Industry Profile | |
| Sales Growth | n.a. | 142.62% | 41.32% | -3.07% |
| Percent of Total Assets | ||||
| Other Current Assets | 18.59% | 10.00% | 6.17% | 42.36% |
| Total Current Assets | 65.71% | 84.97% | 93.16% | 50.54% |
| Long-term Assets | 34.29% | 15.03% | 6.84% | 49.46% |
| Total Assets | 100.00% | 100.00% | 100.00% | 100.00% |
| Current Liabilities | 20.39% | 11.10% | 9.01% | 24.20% |
| Long-term Liabilities | 17.98% | 5.07% | 0.63% | 52.11% |
| Total Liabilities | 38.37% | 16.17% | 9.64% | 76.31% |
| Net Worth | 61.63% | 83.83% | 90.36% | 23.69% |
| Percent of Sales | ||||
| Sales | 100.00% | 100.00% | 100.00% | 100.00% |
| Gross Margin | 69.67% | 68.98% | 69.81% | 59.90% |
| Selling, General & Administrative Expenses | 64.94% | 49.15% | 50.19% | 24.02% |
| Advertising Expenses | 8.82% | 4.55% | 4.39% | 3.24% |
| Profit Before Interest and Taxes | 7.82% | 28.58% | 28.11% | 7.73% |
| Main Ratios | ||||
| Current | 3.22 | 7.65 | 10.34 | 1.10 |
| Quick | 3.22 | 7.65 | 10.34 | 0.98 |
| Total Debt to Total Assets | 38.37% | 16.17% | 9.64% | 76.31% |
| Pre-tax Return on Net Worth | 23.95% | 90.07% | 66.94% | 76.30% |
| Pre-tax Return on Assets | 14.76% | 75.50% | 60.49% | 18.08% |
| Additional Ratios | Year 1 | Year 2 | Year 3 | |
| Net Profit Margin | 4.72% | 19.82% | 19.62% | n.a |
| Return on Equity | 16.76% | 63.05% | 46.86% | n.a |
| Activity Ratios | ||||
| Accounts Payable Turnover | 5.91 | 12.17 | 12.17 | n.a |
| Payment Days | 27 | 29 | 26 | n.a |
| Total Asset Turnover | 2.19 | 2.67 | 2.16 | n.a |
| Debt Ratios | ||||
| Debt to Net Worth | 0.62 | 0.19 | 0.11 | n.a |
| Current Liab. to Liab. | 0.53 | 0.69 | 0.93 | n.a |
| Liquidity Ratios | ||||
| Net Working Capital | $103,362 | $335,217 | $666,657 | n.a |
| Interest Coverage | 7.30 | 108.08 | 343.29 | n.a |
| Additional Ratios | ||||
| Assets to Sales | 0.46 | 0.38 | 0.46 | n.a |
| Current Debt/Total Assets | 20% | 11% | 9% | n.a |
| Acid Test | 3.22 | 7.65 | 10.34 | n.a |
| Sales/Net Worth | 3.55 | 3.18 | 2.39 | n.a |
| Dividend Payout | 0.00 | 0.00 | 0.00 | n.a |
Valuation
40% of equity will be awarded to investors for their cash contribution, 22% to founders for their cash contribution, and the remaining 38% to owners for their sweat equity. This values the company at $317,500 initially.
Assuming valuations at either a multiple of earnings (10 is reasonable for this industry), or a multiple of sales (2 is reasonable for this industry), the valuation at the end of year 3 of the entire company is around $3.385 million (an average of the two methods of valuation). This yields a significant, 121% internal rate of return for investors. An exit event will be possible when the company raises money for franchising or sells to an existing franchisor at the point of expansion.
| Investment Analysis | ||||
| Start | Year 1 | Year 2 | Year 3 | |
| Initial Investment | ||||
| Investment | $197,000 | $0 | $0 | $0 |
| Dividends | $0 | $0 | $0 | $0 |
| Ending Valuation | $0 | $0 | $0 | $2,120,400 |
| Combination as Income Stream | ($197,000) | $0 | $0 | $2,120,400 |
| Percent Equity Acquired | 62% | |||
| Net Present Value (NPV) | $1,269,171 | |||
| Internal Rate of Return (IRR) | 121% | |||
| Assumptions | ||||
| Discount Rate | 10.00% | |||
| Valuation Earnings Multiple | 10 | 10 | 10 | |
| Valuation Sales Multiple | 2 | 2 | 2 | |
| Investment (calculated) | $197,000 | $0 | $0 | $0 |
| Dividends | $0 | $0 | $0 | |
| Calculated Earnings-based Valuation | $240,000 | $2,400,000 | $3,350,000 | |
| Calculated Sales-based Valuation | $1,000,000 | $2,420,000 | $3,420,000 | |
| Calculated Average Valuation | $620,000 | $2,410,000 | $3,385,000 | |
Appendix
| Sales Forecast | |||||||||||||
| Month 1 | Month 2 | Month 3 | Month 4 | Month 5 | Month 6 | Month 7 | Month 8 | Month 9 | Month 10 | Month 11 | Month 12 | ||
| Unit Sales | |||||||||||||
| Tobacco | 500 | 600 | 720 | 864 | 1,037 | 1,244 | 1,493 | 1,792 | 2,150 | 2,580 | 3,096 | 3,715 | |
| Drinks | 600 | 720 | 864 | 1,037 | 1,244 | 1,493 | 1,792 | 2,150 | 2,580 | 3,096 | 3,715 | 4,458 | |
| Food | 400 | 480 | 576 | 691 | 829 | 995 | 1,194 | 1,433 | 1,720 | 2,064 | 2,477 | 2,972 | |
| Total Unit Sales | 1,500 | 1,800 | 2,160 | 2,592 | 3,110 | 3,732 | 4,479 | 5,375 | 6,450 | 7,740 | 9,288 | 11,145 | |
| Unit Prices | Month 1 | Month 2 | Month 3 | Month 4 | Month 5 | Month 6 | Month 7 | Month 8 | Month 9 | Month 10 | Month 11 | Month 12 | |
| Tobacco | $14.00 | $14.00 | $14.00 | $14.00 | $14.00 | $14.00 | $14.00 | $14.00 | $14.00 | $14.00 | $14.00 | $14.00 | |
| Drinks | $6.00 | $6.00 | $6.00 | $6.00 | $6.00 | $6.00 | $6.00 | $6.00 | $6.00 | $6.00 | $6.00 | $6.00 | |
| Food | $5.00 | $5.00 | $5.00 | $5.00 | $5.00 | $5.00 | $5.00 | $5.00 | $5.00 | $5.00 | $5.00 | $5.00 | |
| Sales | |||||||||||||
| Tobacco | $7,000 | $8,400 | $10,080 | $12,096 | $14,518 | $17,416 | $20,902 | $25,088 | $30,100 | $36,120 | $43,344 | $52,010 | |
| Drinks | $3,600 | $4,320 | $5,184 | $6,222 | $7,464 | $8,958 | $10,752 | $12,900 | $15,480 | $18,576 | $22,290 | $26,748 | |
| Food | $2,000 | $2,400 | $2,880 | $3,455 | $4,145 | $4,975 | $5,970 | $7,165 | $8,600 | $10,320 | $12,385 | $14,860 | |
| Total Sales | $12,600 | $15,120 | $18,144 | $21,773 | $26,127 | $31,349 | $37,624 | $45,153 | $54,180 | $65,016 | $78,019 | $93,618 | |
| Direct Unit Costs | Month 1 | Month 2 | Month 3 | Month 4 | Month 5 | Month 6 | Month 7 | Month 8 | Month 9 | Month 10 | Month 11 | Month 12 | |
| Tobacco | 30.00% | $4.20 | $4.20 | $4.20 | $4.20 | $4.20 | $4.20 | $4.20 | $4.20 | $4.20 | $4.20 | $4.20 | $4.20 |
| Drinks | 20.00% | $1.20 | $1.20 | $1.20 | $1.20 | $1.20 | $1.20 | $1.20 | $1.20 | $1.20 | $1.20 | $1.20 | $1.20 |
| Food | 30.00% | $1.50 | $1.50 | $1.50 | $1.50 | $1.50 | $1.50 | $1.50 | $1.50 | $1.50 | $1.50 | $1.50 | $1.50 |
| Direct Cost of Sales | |||||||||||||
| Tobacco | $2,100 | $2,520 | $3,024 | $3,629 | $4,355 | $5,225 | $6,271 | $7,526 | $9,030 | $10,836 | $13,003 | $15,603 | |
| Drinks | $720 | $864 | $1,037 | $1,244 | $1,493 | $1,792 | $2,150 | $2,580 | $3,096 | $3,715 | $4,458 | $5,350 | |
| Food | $600 | $720 | $864 | $1,037 | $1,244 | $1,493 | $1,791 | $2,150 | $2,580 | $3,096 | $3,716 | $4,458 | |
| Subtotal Direct Cost of Sales | $3,420 | $4,104 | $4,925 | $5,910 | $7,092 | $8,509 | $10,212 | $12,256 | $14,706 | $17,647 | $21,177 | $25,411 | |
| Personnel Plan | |||||||||||||
| Month 1 | Month 2 | Month 3 | Month 4 | Month 5 | Month 6 | Month 7 | Month 8 | Month 9 | Month 10 | Month 11 | Month 12 | ||
| Sayed Batroun | $3,000 | $3,000 | $3,000 | $3,000 | $3,000 | $3,000 | $3,000 | $3,000 | $3,000 | $3,000 | $3,000 | $3,000 | |
| Yamine Batroun | $3,000 | $3,000 | $3,000 | $3,000 | $3,000 | $3,000 | $3,000 | $3,000 | $3,000 | $3,000 | $3,000 | $3,000 | |
| Bar Staff | $4,000 | $4,000 | $4,000 | $4,000 | $4,000 | $4,000 | $4,000 | $4,000 | $4,000 | $4,000 | $4,000 | $4,000 | |
| Wait Staff | $2,800 | $2,800 | $2,800 | $2,800 | $2,800 | $2,800 | $2,800 | $2,800 | $2,800 | $2,800 | $2,800 | $2,800 | |
| Kitchen Staff | $2,500 | $2,500 | $2,500 | $2,500 | $2,500 | $2,500 | $2,500 | $2,500 | $2,500 | $2,500 | $2,500 | $2,500 | |
| General Manager | $0 | $0 | $0 | $0 | $0 | $0 | $0 | $0 | $0 | $0 | $0 | $0 | |
| Total People | 7 | 7 | 7 | 7 | 7 | 7 | 7 | 7 | 7 | 7 | 7 | 7 | |
| Total Payroll | $15,300 | $15,300 | $15,300 | $15,300 | $15,300 | $15,300 | $15,300 | $15,300 | $15,300 | $15,300 | $15,300 | $15,300 | |
| Pro Forma Profit and Loss | |||||||||||||
| Month 1 | Month 2 | Month 3 | Month 4 | Month 5 | Month 6 | Month 7 | Month 8 | Month 9 | Month 10 | Month 11 | Month 12 | ||
| Sales | $12,600 | $15,120 | $18,144 | $21,773 | $26,127 | $31,349 | $37,624 | $45,153 | $54,180 | $65,016 | $78,019 | $93,618 | |
| Direct Cost of Sales | $3,420 | $4,104 | $4,925 | $5,910 | $7,092 | $8,509 | $10,212 | $12,256 | $14,706 | $17,647 | $21,177 | $25,411 | |
| Other Costs of Sales | $1,000 | $1,050 | $1,102 | $1,157 | $1,215 | $1,276 | $1,340 | $1,407 | $1,477 | $1,551 | $1,629 | $1,710 | |
| Total Cost of Sales | $4,420 | $5,154 | $6,027 | $7,067 | $8,307 | $9,785 | $11,552 | $13,663 | $16,183 | $19,198 | $22,806 | $27,121 | |
| Gross Margin | $8,180 | $9,966 | $12,117 | $14,706 | $17,820 | $21,564 | $26,072 | $31,490 | $37,997 | $45,818 | $55,213 | $66,497 | |
| Gross Margin % | 64.92% | 65.91% | 66.78% | 67.54% | 68.21% | 68.79% | 69.30% | 69.74% | 70.13% | 70.47% | 70.77% | 71.03% | |
| Expenses | |||||||||||||
| Payroll | $15,300 | $15,300 | $15,300 | $15,300 | $15,300 | $15,300 | $15,300 | $15,300 | $15,300 | $15,300 | $15,300 | $15,300 | |
| Marketing/Promotion | $5,000 | $5,000 | $5,000 | $5,000 | $3,000 | $3,000 | $3,000 | $3,000 | $3,000 | $3,000 | $3,000 | $3,000 | |
| Depreciation | $1,400 | $1,400 | $1,400 | $1,400 | $1,400 | $1,400 | $1,400 | $1,400 | $1,400 | $1,400 | $1,400 | $1,400 | |
| Rent | $2,000 | $2,000 | $2,000 | $2,000 | $2,000 | $2,000 | $2,000 | $2,000 | $2,000 | $2,000 | $2,000 | $2,000 | |
| Utilities | $300 | $300 | $300 | $300 | $300 | $300 | $300 | $300 | $300 | $300 | $300 | $300 | |
| Insurance | $200 | $200 | $200 | $200 | $200 | $200 | $200 | $200 | $200 | $200 | $200 | $200 | |
| Payroll Taxes | 15% | $2,295 | $2,295 | $2,295 | $2,295 | $2,295 | $2,295 | $2,295 | $2,295 | $2,295 | $2,295 | $2,295 | $2,295 |
| Permit Renewals | 15% | $0 | $0 | $0 | $0 | $0 | $0 | $0 | $0 | $0 | $500 | $0 | $0 |
| Supplies | $500 | $500 | $500 | $500 | $500 | $500 | $500 | $500 | $500 | $500 | $500 | $500 | |
| Total Operating Expenses | $26,995 | $26,995 | $26,995 | $26,995 | $24,995 | $24,995 | $24,995 | $24,995 | $24,995 | $25,495 | $24,995 | $24,995 | |
| Profit Before Interest and Taxes | ($18,815) | ($17,029) | ($14,878) | ($12,289) | ($7,175) | ($3,431) | $1,077 | $6,495 | $13,002 | $20,323 | $30,218 | $41,502 | |
| EBITDA | ($17,415) | ($15,629) | ($13,478) | ($10,889) | ($5,775) | ($2,031) | $2,477 | $7,895 | $14,402 | $21,723 | $31,618 | $42,902 | |
| Interest Expense | $513 | $509 | $505 | $495 | $485 | $475 | $453 | $428 | $403 | $378 | $354 | $342 | |
| Taxes Incurred | ($5,798) | ($5,261) | ($4,615) | ($3,835) | ($2,298) | ($1,172) | $187 | $1,820 | $3,780 | $5,983 | $8,959 | $12,348 | |
| Net Profit | ($13,530) | ($12,277) | ($10,768) | ($8,949) | ($5,362) | ($2,734) | $437 | $4,247 | $8,819 | $13,961 | $20,905 | $28,813 | |
| Net Profit/Sales | -107.38% | -81.20% | -59.35% | -41.10% | -20.52% | -8.72% | 1.16% | 9.41% | 16.28% | 21.47% | 26.79% | 30.78% | |
| Pro Forma Cash Flow | |||||||||||||
| Month 1 | Month 2 | Month 3 | Month 4 | Month 5 | Month 6 | Month 7 | Month 8 | Month 9 | Month 10 | Month 11 | Month 12 | ||
| Cash Received | |||||||||||||
| Cash from Operations | |||||||||||||
| Cash Sales | $12,600 | $15,120 | $18,144 | $21,773 | $26,127 | $31,349 | $37,624 | $45,153 | $54,180 | $65,016 | $78,019 | $93,618 | |
| Subtotal Cash from Operations | $12,600 | $15,120 | $18,144 | $21,773 | $26,127 | $31,349 | $37,624 | $45,153 | $54,180 | $65,016 | $78,019 | $93,618 | |
| Additional Cash Received | |||||||||||||
| Sales Tax, VAT, HST/GST Received | 9.00% | $1,134 | $1,361 | $1,633 | $1,960 | $2,351 | $2,821 | $3,386 | $4,064 | $4,876 | $5,851 | $7,022 | $8,426 |
| New Current Borrowing | $0 | $0 | $0 | $0 | $0 | $0 | $0 | $0 | $0 | $0 | $0 | $0 | |
| New Other Liabilities (interest-free) | $0 | $0 | $0 | $0 | $0 | $0 | $0 | $0 | $0 | $0 | $0 | $0 | |
| New Long-term Liabilities | $0 | $0 | $0 | $0 | $0 | $0 | $0 | $0 | $0 | $0 | $0 | $0 | |
| Sales of Other Current Assets | $0 | $0 | $0 | $0 | $0 | $0 | $0 | $0 | $0 | $0 | $0 | $0 | |
| Sales of Long-term Assets | $0 | $0 | $0 | $0 | $0 | $0 | $0 | $0 | $0 | $0 | $0 | $0 | |
| New Investment Received | $0 | $0 | $0 | $0 | $0 | $0 | $0 | $0 | $0 | $0 | $0 | $0 | |
| Subtotal Cash Received | $13,734 | $16,481 | $19,777 | $23,733 | $28,478 | $34,170 | $41,010 | $49,217 | $59,056 | $70,867 | $85,041 | $102,044 | |
| Expenditures | Month 1 | Month 2 | Month 3 | Month 4 | Month 5 | Month 6 | Month 7 | Month 8 | Month 9 | Month 10 | Month 11 | Month 12 | |
| Expenditures from Operations | |||||||||||||
| Cash Spending | $15,300 | $15,300 | $15,300 | $15,300 | $15,300 | $15,300 | $15,300 | $15,300 | $15,300 | $15,300 | $15,300 | $15,300 | |
| Bill Payments | $314 | $9,472 | $10,747 | $12,273 | $14,047 | $14,876 | $17,487 | $20,611 | $24,354 | $28,850 | $34,557 | $40,670 | |
| Subtotal Spent on Operations | $15,614 | $24,772 | $26,047 | $27,573 | $29,347 | $30,176 | $32,787 | $35,911 | $39,654 | $44,150 | $49,857 | $55,970 | |
| Additional Cash Spent | |||||||||||||
| Sales Tax, VAT, HST/GST Paid Out | $1,134 | $1,361 | $1,633 | $1,960 | $2,351 | $2,821 | $3,386 | $4,064 | $4,876 | $5,851 | $7,022 | $8,426 | |
| Principal Repayment of Current Borrowing | $300 | $300 | $300 | $800 | $800 | $800 | $800 | $1,000 | $1,000 | $1,000 | $900 | $0 | |
| Other Liabilities Principal Repayment | $0 | $0 | $0 | $0 | $0 | $0 | $0 | $0 | $0 | $0 | $0 | $0 | |
| Long-term Liabilities Principal Repayment | $0 | $0 | $0 | $0 | $0 | $0 | $1,500 | $1,500 | $1,500 | $1,500 | $1,500 | $1,500 | |
| Purchase Other Current Assets | $200 | $200 | $200 | $200 | $200 | $200 | $200 | $200 | $200 | $200 | $200 | $200 | |
| Purchase Long-term Assets | $0 | $0 | $0 | $0 | $0 | $0 | $0 | $0 | $0 | $0 | $0 | $0 | |
| Dividends | $0 | $0 | $0 | $0 | $0 | $0 | $0 | $0 | $0 | $0 | $0 | $0 | |
| Subtotal Cash Spent | $17,248 | $26,633 | $28,180 | $30,532 | $32,699 | $33,997 | $38,673 | $42,675 | $47,231 | $52,702 | $59,478 | $66,096 | |
| Net Cash Flow | ($3,514) | ($10,152) | ($8,403) | ($6,800) | ($4,220) | $173 | $2,337 | $6,542 | $11,826 | $18,166 | $25,562 | $35,948 | |
| Cash Balance | $36,486 | $26,334 | $17,931 | $11,131 | $6,911 | $7,084 | $9,421 | $15,963 | $27,789 | $45,954 | $71,517 | $107,464 | |
| Pro Forma Balance Sheet | |||||||||||||
| Month 1 | Month 2 | Month 3 | Month 4 | Month 5 | Month 6 | Month 7 | Month 8 | Month 9 | Month 10 | Month 11 | Month 12 | ||
| Assets | Starting Balances | ||||||||||||
| Current Assets | |||||||||||||
| Cash | $40,000 | $36,486 | $26,334 | $17,931 | $11,131 | $6,911 | $7,084 | $9,421 | $15,963 | $27,789 | $45,954 | $71,517 | $107,464 |
| Other Current Assets | $40,000 | $40,200 | $40,400 | $40,600 | $40,800 | $41,000 | $41,200 | $41,400 | $41,600 | $41,800 | $42,000 | $42,200 | $42,400 |
| Total Current Assets | $80,000 | $76,686 | $66,734 | $58,531 | $51,931 | $47,911 | $48,284 | $50,821 | $57,563 | $69,589 | $87,954 | $113,717 | $149,864 |
| Long-term Assets | |||||||||||||
| Long-term Assets | $95,000 | $95,000 | $95,000 | $95,000 | $95,000 | $95,000 | $95,000 | $95,000 | $95,000 | $95,000 | $95,000 | $95,000 | $95,000 |
| Accumulated Depreciation | $0 | $1,400 | $2,800 | $4,200 | $5,600 | $7,000 | $8,400 | $9,800 | $11,200 | $12,600 | $14,000 | $15,400 | $16,800 |
| Total Long-term Assets | $95,000 | $93,600 | $92,200 | $90,800 | $89,400 | $88,000 | $86,600 | $85,200 | $83,800 | $82,400 | $81,000 | $79,600 | $78,200 |
| Total Assets | $175,000 | $170,286 | $158,934 | $149,331 | $141,331 | $135,911 | $134,884 | $136,021 | $141,363 | $151,989 | $168,954 | $193,317 | $228,064 |
| Liabilities and Capital | Month 1 | Month 2 | Month 3 | Month 4 | Month 5 | Month 6 | Month 7 | Month 8 | Month 9 | Month 10 | Month 11 | Month 12 | |
| Current Liabilities | |||||||||||||
| Accounts Payable | $0 | $9,115 | $10,340 | $11,805 | $13,554 | $14,296 | $16,804 | $19,804 | $23,399 | $27,705 | $33,209 | $39,067 | $46,502 |
| Current Borrowing | $8,000 | $7,700 | $7,400 | $7,100 | $6,300 | $5,500 | $4,700 | $3,900 | $2,900 | $1,900 | $900 | $0 | $0 |
| Other Current Liabilities | $0 | $0 | $0 | $0 | $0 | $0 | $0 | $0 | $0 | $0 | $0 | $0 | $0 |
| Subtotal Current Liabilities | $8,000 | $16,815 | $17,740 | $18,905 | $19,854 | $19,796 | $21,504 | $23,704 | $26,299 | $29,605 | $34,109 | $39,067 | $46,502 |
| Long-term Liabilities | $50,000 | $50,000 | $50,000 | $50,000 | $50,000 | $50,000 | $50,000 | $48,500 | $47,000 | $45,500 | $44,000 | $42,500 | $41,000 |
| Total Liabilities | $58,000 | $66,815 | $67,740 | $68,905 | $69,854 | $69,796 | $71,504 | $72,204 | $73,299 | $75,105 | $78,109 | $81,567 | $87,502 |
| Paid-in Capital | $197,000 | $197,000 | $197,000 | $197,000 | $197,000 | $197,000 | $197,000 | $197,000 | $197,000 | $197,000 | $197,000 | $197,000 | $197,000 |
| Retained Earnings | ($80,000) | ($80,000) | ($80,000) | ($80,000) | ($80,000) | ($80,000) | ($80,000) | ($80,000) | ($80,000) | ($80,000) | ($80,000) | ($80,000) | ($80,000) |
| Earnings | $0 | ($13,530) | ($25,806) | ($36,575) | ($45,523) | ($50,885) | ($53,620) | ($53,183) | ($48,936) | ($40,117) | ($26,155) | ($5,250) | $23,562 |
| Total Capital | $117,000 | $103,470 | $91,194 | $80,425 | $71,477 | $66,115 | $63,380 | $63,817 | $68,064 | $76,883 | $90,845 | $111,750 | $140,562 |
| Total Liabilities and Capital | $175,000 | $170,286 | $158,934 | $149,331 | $141,331 | $135,911 | $134,884 | $136,021 | $141,363 | $151,989 | $168,954 | $193,317 | $228,064 |
| Net Worth | $117,000 | $103,470 | $91,194 | $80,425 | $71,477 | $66,115 | $63,380 | $63,817 | $68,064 | $76,883 | $90,845 | $111,750 | $140,562 |


