
Hamlin and Park Design
Executive Summary
The city of Claremont has been growing by 6% annually for the past five years. Currently, the city’s population is 700,000. Most importantly, the greatest population increase is in southwest Claremont which is the city’s most affluent area. The population of southwest Claremont has grown by 20% the past two years. The 80,000 residents of the area have an average income of $200,000 and the average home is valued at $350,000. The new construction in southwest section of the city is valued at 600 million dollars in home sales next year alone. Growth in the area has also generated increase remodeling of existing homes. Last year, remodeling projects were up 20% over the previous year and accounted for $20 million paid for remodeling services in the area.
The building and remodeling in southwest Claremont has increased the demand for interior design services. Last year, residential interior design companies generated $4 million in sales in the greater Claremont area. Forecasts for next year predict that there will be an increase of 11% in sales.
Hamlin and Park Design will offers a wide range of interior design services to meet any client’s needs in southwest Claremont:
- On-site consultations;
- Project survey & analysis;
- Space planning & furniture arrangement;
- Design concepts;
- Finishes & furnishings;
- Custom designs;
- Purchasing, delivery, & installation;
- Project coordination & management.
Courtney Hamlin and Katherine Park have ten years of experience with the city’s top interior designs firms. Both have been successful is creating a base of former clients that will refer new business to the designers.
1.1 Objectives
Hamlin and Park Design offers a wide range of interior design services to meet any client’s needs in southwest Claremont.
The primary objectives of our firm are to:
- Exceed customers’ expectations for service and product.
- Increase the number of clients served by 15% per year through superior performance.
- Develop a sustainable start-up business that is profitable.
1.2 Mission
Hamlin and Park Design’s mission is to assure superior customer service by doing the following:
- Open communication with clients. The explanation of the “pros and cons” of different selections and design options are discussed in detail.
- Include the client in every stage of the design process.
- Exceed the customer’s expectations for the project.
- Maintain continuing education of the latest development and innovations in the interior design field.
Company Summary
Courtney Hamlin and Katherine Park will start Hamlin and Parks Design to offer a wide range of interior design services to clients in southwest Claremont. The company has a high level of expertise in interior design and will provide superior personal services to all clients. Courtney and Katherine take pride in knowing that 50% of their business comes from repeat clients and their referrals.
Our responsibility as interior design professionals is to take the client’s design goals and utilize our skills and resources to exceed the client’s expectations for service, value, functionality, and beauty.
2.1 Company Ownership
The owners and designers of Hamlin and Park Design are Courtney Hamlin and Katherine Park.
2.2 Start-up Summary
Courtney Hamlin and Katherine Park will invest $60,000 in Hamlin and Park Design. They will also secure a $50,000 loan.
The following table and chart show projected initial start-up costs for Hamlin and Park Design.

| Start-up Funding | |
| Start-up Expenses to Fund | $20,550 |
| Start-up Assets to Fund | $79,450 |
| Total Funding Required | $100,000 |
| Assets | |
| Non-cash Assets from Start-up | $20,000 |
| Cash Requirements from Start-up | $59,450 |
| Additional Cash Raised | $0 |
| Cash Balance on Starting Date | $59,450 |
| Total Assets | $79,450 |
| Liabilities and Capital | |
| Liabilities | |
| Current Borrowing | $0 |
| Long-term Liabilities | $30,000 |
| Accounts Payable (Outstanding Bills) | $10,000 |
| Other Current Liabilities (interest-free) | $0 |
| Total Liabilities | $40,000 |
| Capital | |
| Planned Investment | |
| Investor 1 | $30,000 |
| Investor 2 | $30,000 |
| Additional Investment Requirement | $0 |
| Total Planned Investment | $60,000 |
| Loss at Start-up (Start-up Expenses) | ($20,550) |
| Total Capital | $39,450 |
| Total Capital and Liabilities | $79,450 |
| Total Funding | $100,000 |
| Start-up | |
| Requirements | |
| Start-up Expenses | |
| Legal | $900 |
| Stationery etc. | $2,000 |
| Brochures | $4,000 |
| Insurance | $200 |
| Rent | $3,000 |
| Answering Service | $200 |
| Utilities Start Up | $250 |
| Office Furnishings | $4,000 |
| Expensed Equipment | $3,000 |
| Business Software | $2,000 |
| Office Supplies | $1,000 |
| Total Start-up Expenses | $20,550 |
| Start-up Assets | |
| Cash Required | $59,450 |
| Other Current Assets | $20,000 |
| Long-term Assets | $0 |
| Total Assets | $79,450 |
| Total Requirements | $100,000 |
Services
Hamlin and Park Design will offers a wide range of interior design services to meet any client’s needs in southwest Claremont:
- On-site Consultations: Convenient consultations for busy homeowners and professionals are offered at the home or office. The consultation will include all necessary product samples for clients for review, thus eliminating the hassle of having to visit numerous stores for different products.
- Project Survey and Analysis: Each site is inspected for its layout and function. In-depth client interviews are conducted to determine all necessary requirements for the project. This information is then analyzed for design concepts and space planning.
- Design Concepts: The design concept can begin with a treasured piece of fabric or furniture, or simply a blank page. The goal is to attain the “look” and “feel” a client wants, from “light and airy” to “rich and elegant” to “comfortable and cozy.” Each project develops its own flavor from the unique selection of fabrics, furniture, and finishes.
- Finishes and Furnishings: There are many factors to consider when selecting furniture and finishes. Hamlin and Park Design’s expertise and guidance helps clients make the best selections for their needs. Creativity is also applied in the selection process to create the desired look.
- Custom Designs: Custom furniture, built-ins, and window treatments are also available through the talents of Hamlin and Park Design. Detailed drawings are prepared to help clients visualize the finished piece.
- Purchasing, Delivery, & Installation: Once final selections are made, Hamlin and Park Design assumes all responsibility for coordinating the purchasing, delivery and installation of the entire project.
- Project Coordination & Management: Some projects require a certain sequence of installation for maximizing results. Hamlin and Park Design coordinates all aspects of these projects to ensure smooth transitions from each phase until project completion.
Market Analysis Summary
Due to the strengthening of the area’s economy, more southwest Claremont homeowners are exploring interior design to improve their homes’ beauty and charm. Last year, residential interior design companies generated $4 million in sales in the greater Claremont area. Approximately, 75% of the sales were located in southwest Claremont. Forecasts for next year predict that there will be an increase of 11% in sales. This demand for interior design services is a tremendous opportunity. Hamlin and Park Design is poised to take advantage of these changes, and expects to become a recognized name and profitable entity in the city’s interior design market.
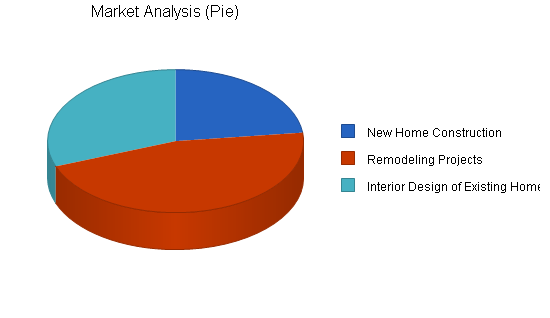
4.1 Market Segmentation
The customers that Hamlin and Park Design will be serving can be divided into three groups:
- New Home Construction: Hamlin and Park Design will compete for the interior design projects associated with new homes. Contracted consulting responsibilities with the builders can include one or more of the companies services, i.e. strategic planning, master planning, and lighting, floor or carpet design.
- Remodeling Projects: These projects have some of the same characteristics as new home construction (i.e. working as a consultant with builders) but can also include greater control over all aspect of the project.
- Interior Design of Existing Home: Hamlin and Park Design will control all aspects of these projects.
| Market Analysis | |||||||
| Year 1 | Year 2 | Year 3 | Year 4 | Year 5 | |||
| Potential Customers | Growth | CAGR | |||||
| New Home Construction | 6% | 1,500 | 1,590 | 1,685 | 1,786 | 1,893 | 5.99% |
| Remodeling Projects | 10% | 3,000 | 3,300 | 3,630 | 3,993 | 4,392 | 10.00% |
| Interior Design of Existing Home | 8% | 2,000 | 2,160 | 2,333 | 2,520 | 2,722 | 8.01% |
| Total | 8.50% | 6,500 | 7,050 | 7,648 | 8,299 | 9,007 | 8.50% |

4.2 Competitive Edge
Hamlin and Park Design’s competitive edge is that both Courtney Hamlin and Katherine Park are highly successful interior designers with a loyal customer base. Courtney has been a Project Manager with Sullivan and Associates for five years. During that time she has established strong relationships with builders and vendors which will prove beneficial in the coming years. For the past six years, Katherine has worked as a Design Consultant for Jonathan Miller, the most successful interior designer in Claremont. Together, Courtney and Katherine have the skills, resources and experience to be build on the base of 1,000 satisfied customers.
Strategy and Implementation Summary
Hamlin and Park will focus on the interior design needs in the southwest section of the city. Our target customers will be the affluent residents of southwest Claremont.
5.1 Sales Strategy
The following is the sales strategy Hamlin and Park Design will employ on the three target customer groups:
- New Home Construction/Remodeling Projects: Courtney Hamlin already has a strong professional relationship with the dominant builders/remodelers in southwest Claremont. She will meet with them directly and pitch the consulting services of Hamlin and Park Design.
- Interior Design of Existing Home: Visibility with the customer base is the most important marketing activity Hamlin and Park Design will follow. Southwest Claremont has five homeowner associations that meet regularly. In the past both Courtney and Katherine have made presentations on interior design issues. They will continue this service to the community to raise the visibility of Hamlin and Park Design.
5.1.1 Sales Forecast
The following table and chart will forecast sales for the next three years.


| Sales Forecast | |||
| Year 1 | Year 2 | Year 3 | |
| Sales | |||
| Remodeling Projects | $87,672 | $96,685 | $108,200 |
| New Home Construction | $41,000 | $45,280 | $47,300 |
| Interior Design of Existing Home | $90,739 | $97,800 | $105,000 |
| Total Sales | $219,411 | $239,765 | $260,500 |
| Direct Cost of Sales | Year 1 | Year 2 | Year 3 |
| Remodeling Projects | $8,634 | $9,500 | $10,000 |
| New Home Construction | $5,500 | $6,300 | $7,000 |
| Interior Design of Existing Home | $9,091 | $10,000 | $10,000 |
| Subtotal Direct Cost of Sales | $23,225 | $25,800 | $27,000 |
Management Summary
Hamlin and Park is a two member interior design firm. Both designers are equal partners in the firm.
- Courtney Hamlin began her passion for the arts at a young age. Upon graduating from State University, Courtney secured an office management position at a local commercial and residential interior design firm. This position afforded her the learning experience of overseeing all aspects of design projects; from preparing proposals, to scheduling and coordinating all phases of a project. After five years of managing the design firm, Courtney returned to school for an Associates Degree in Interior Design. After completing her Interior Design degree, Courtney became a designer and project manager for Sullivan and Associates.
- Katherine Park received a B.A. in Art from State University. She continued her education at the Art Institute of Monroe and obtained a degree in Interior Design. She has worked as a Design Consultant for Jonathan Miller, the most successful interior designer in Claremont.
6.1 Personnel Plan
The staff of Hamlin and Park Design will be its co-owners Courtney Hamlin and Katherine Park.
| Personnel Plan | |||
| Year 1 | Year 2 | Year 3 | |
| Courtney Hamlin | $48,000 | $54,000 | $60,000 |
| Katherine Park | $48,000 | $54,000 | $60,000 |
| Total People | 2 | 2 | 2 |
| Total Payroll | $96,000 | $108,000 | $120,000 |
Financial Plan
The following is the financial plan for Hamlin and Park Design.
7.1 Important Assumptions
The financial plan depends on important assumptions, most of which are shown in the following table as annual assumptions. The monthly assumptions are included in the appendix. From the beginning, we recognize that collection days are critical, but not a factor we can influence easily. At least we are planning on the problem, and dealing with it. Interest rates, tax rates, and personnel burden are based on conservative assumptions. Some of the more important underlying assumptions are:
- We assume a strong economy, without major recession.
- We assume, of course, that there are no unforeseen changes in the economy that would change our estimations.
| General Assumptions | |||
| Year 1 | Year 2 | Year 3 | |
| Plan Month | 1 | 2 | 3 |
| Current Interest Rate | 10.00% | 10.00% | 10.00% |
| Long-term Interest Rate | 10.00% | 10.00% | 10.00% |
| Tax Rate | 30.00% | 30.00% | 30.00% |
| Other | 0 | 0 | 0 |
7.2 Break-even Analysis
The following table and chart will summarize our break-even analysis. The monthly break-even point is approximately $14,800.

| Break-even Analysis | |
| Monthly Revenue Break-even | $14,874 |
| Assumptions: | |
| Average Percent Variable Cost | 11% |
| Estimated Monthly Fixed Cost | $13,300 |
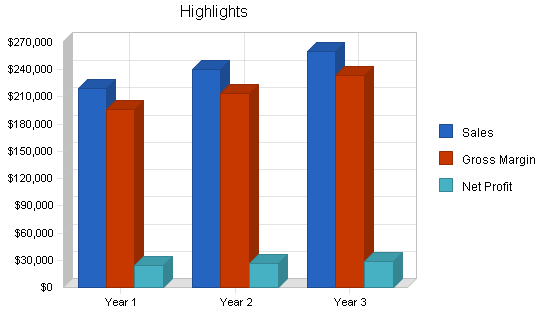
7.3 Projected Profit and Loss
Our projected profit and loss is shown on the following table and charts.


| Pro Forma Profit and Loss | |||
| Year 1 | Year 2 | Year 3 | |
| Sales | $219,411 | $239,765 | $260,500 |
| Direct Cost of Sales | $23,225 | $25,800 | $27,000 |
| Other Production Expenses | $0 | $0 | $0 |
| Total Cost of Sales | $23,225 | $25,800 | $27,000 |
| Gross Margin | $196,186 | $213,965 | $233,500 |
| Gross Margin % | 89.41% | 89.24% | 89.64% |
| Expenses | |||
| Payroll | $96,000 | $108,000 | $120,000 |
| Sales and Marketing and Other Expenses | $6,000 | $7,000 | $10,000 |
| Depreciation | $0 | $0 | $0 |
| Leased Equipment | $2,400 | $2,400 | $2,400 |
| Utilities | $2,400 | $2,400 | $2,400 |
| Insurance | $2,400 | $2,400 | $2,400 |
| Rent | $36,000 | $36,000 | $36,000 |
| Payroll Taxes | $14,400 | $16,200 | $18,000 |
| Other | $0 | $0 | $0 |
| Total Operating Expenses | $159,600 | $174,400 | $191,200 |
| Profit Before Interest and Taxes | $36,586 | $39,565 | $42,300 |
| EBITDA | $36,586 | $39,565 | $42,300 |
| Interest Expense | $2,643 | $2,010 | $1,350 |
| Taxes Incurred | $10,183 | $11,267 | $12,285 |
| Net Profit | $23,760 | $26,289 | $28,665 |
| Net Profit/Sales | 10.83% | 10.96% | 11.00% |
7.4 Projected Cash Flow
Cash flow projections are critical to our success. The monthly cash flow is shown in the illustration, with one bar representing the cash flow per month, and the other the monthly balance. The annual cash flow figures are included here and the more important detailed monthly numbers are included in the appendix.

| Pro Forma Cash Flow | |||
| Year 1 | Year 2 | Year 3 | |
| Cash Received | |||
| Cash from Operations | |||
| Cash Sales | $109,706 | $119,883 | $130,250 |
| Cash from Receivables | $101,608 | $119,131 | $129,485 |
| Subtotal Cash from Operations | $211,313 | $239,014 | $259,735 |
| Additional Cash Received | |||
| Sales Tax, VAT, HST/GST Received | $0 | $0 | $0 |
| New Current Borrowing | $0 | $0 | $0 |
| New Other Liabilities (interest-free) | $0 | $0 | $0 |
| New Long-term Liabilities | $0 | $0 | $0 |
| Sales of Other Current Assets | $0 | $0 | $0 |
| Sales of Long-term Assets | $0 | $0 | $0 |
| New Investment Received | $0 | $0 | $0 |
| Subtotal Cash Received | $211,313 | $239,014 | $259,735 |
| Expenditures | Year 1 | Year 2 | Year 3 |
| Expenditures from Operations | |||
| Cash Spending | $96,000 | $108,000 | $120,000 |
| Bill Payments | $105,544 | $100,914 | $111,312 |
| Subtotal Spent on Operations | $201,544 | $208,914 | $231,312 |
| Additional Cash Spent | |||
| Sales Tax, VAT, HST/GST Paid Out | $0 | $0 | $0 |
| Principal Repayment of Current Borrowing | $0 | $0 | $0 |
| Other Liabilities Principal Repayment | $0 | $0 | $0 |
| Long-term Liabilities Principal Repayment | $6,600 | $6,600 | $6,600 |
| Purchase Other Current Assets | $0 | $0 | $0 |
| Purchase Long-term Assets | $0 | $0 | $0 |
| Dividends | $0 | $0 | $0 |
| Subtotal Cash Spent | $208,144 | $215,514 | $237,912 |
| Net Cash Flow | $3,170 | $23,500 | $21,822 |
| Cash Balance | $62,620 | $86,119 | $107,942 |
7.5 Projected Balance Sheet
The balance sheet in the following table shows managed but sufficient growth of net worth, and a sufficiently healthy financial position. The monthly estimates are included in the appendix.
| Pro Forma Balance Sheet | |||
| Year 1 | Year 2 | Year 3 | |
| Assets | |||
| Current Assets | |||
| Cash | $62,620 | $86,119 | $107,942 |
| Accounts Receivable | $8,098 | $8,849 | $9,614 |
| Other Current Assets | $20,000 | $20,000 | $20,000 |
| Total Current Assets | $90,717 | $114,968 | $137,556 |
| Long-term Assets | |||
| Long-term Assets | $0 | $0 | $0 |
| Accumulated Depreciation | $0 | $0 | $0 |
| Total Long-term Assets | $0 | $0 | $0 |
| Total Assets | $90,717 | $114,968 | $137,556 |
| Liabilities and Capital | Year 1 | Year 2 | Year 3 |
| Current Liabilities | |||
| Accounts Payable | $4,107 | $8,669 | $9,192 |
| Current Borrowing | $0 | $0 | $0 |
| Other Current Liabilities | $0 | $0 | $0 |
| Subtotal Current Liabilities | $4,107 | $8,669 | $9,192 |
| Long-term Liabilities | $23,400 | $16,800 | $10,200 |
| Total Liabilities | $27,507 | $25,469 | $19,392 |
| Paid-in Capital | $60,000 | $60,000 | $60,000 |
| Retained Earnings | ($20,550) | $3,210 | $29,499 |
| Earnings | $23,760 | $26,289 | $28,665 |
| Total Capital | $63,210 | $89,499 | $118,164 |
| Total Liabilities and Capital | $90,717 | $114,968 | $137,556 |
| Net Worth | $63,210 | $89,499 | $118,164 |
7.6 Business Ratios
The following table provides important ratios for the real estate industry, as determined by the Standard Industry Classification (SIC) Index, 8999, Services.
| Ratio Analysis | ||||
| Year 1 | Year 2 | Year 3 | Industry Profile | |
| Sales Growth | 0.00% | 9.28% | 8.65% | 8.50% |
| Percent of Total Assets | ||||
| Accounts Receivable | 8.93% | 7.70% | 6.99% | 20.90% |
| Other Current Assets | 22.05% | 17.40% | 14.54% | 55.70% |
| Total Current Assets | 100.00% | 100.00% | 100.00% | 81.60% |
| Long-term Assets | 0.00% | 0.00% | 0.00% | 18.40% |
| Total Assets | 100.00% | 100.00% | 100.00% | 100.00% |
| Current Liabilities | 4.53% | 7.54% | 6.68% | 48.20% |
| Long-term Liabilities | 25.79% | 14.61% | 7.42% | 15.50% |
| Total Liabilities | 30.32% | 22.15% | 14.10% | 63.70% |
| Net Worth | 69.68% | 77.85% | 85.90% | 36.30% |
| Percent of Sales | ||||
| Sales | 100.00% | 100.00% | 100.00% | 100.00% |
| Gross Margin | 89.41% | 89.24% | 89.64% | 0.00% |
| Selling, General & Administrative Expenses | 78.59% | 78.28% | 78.63% | 82.60% |
| Advertising Expenses | 2.73% | 2.92% | 3.84% | 0.60% |
| Profit Before Interest and Taxes | 16.67% | 16.50% | 16.24% | 1.50% |
| Main Ratios | ||||
| Current | 22.09 | 13.26 | 14.96 | 1.57 |
| Quick | 22.09 | 13.26 | 14.96 | 1.13 |
| Total Debt to Total Assets | 30.32% | 22.15% | 14.10% | 63.70% |
| Pre-tax Return on Net Worth | 53.70% | 41.96% | 34.66% | 1.90% |
| Pre-tax Return on Assets | 37.42% | 32.67% | 29.77% | 5.20% |
| Additional Ratios | Year 1 | Year 2 | Year 3 | |
| Net Profit Margin | 10.83% | 10.96% | 11.00% | n.a |
| Return on Equity | 37.59% | 29.37% | 24.26% | n.a |
| Activity Ratios | ||||
| Accounts Receivable Turnover | 13.55 | 13.55 | 13.55 | n.a |
| Collection Days | 59 | 26 | 26 | n.a |
| Accounts Payable Turnover | 24.26 | 12.17 | 12.17 | n.a |
| Payment Days | 30 | 22 | 29 | n.a |
| Total Asset Turnover | 2.42 | 2.09 | 1.89 | n.a |
| Debt Ratios | ||||
| Debt to Net Worth | 0.44 | 0.28 | 0.16 | n.a |
| Current Liab. to Liab. | 0.15 | 0.34 | 0.47 | n.a |
| Liquidity Ratios | ||||
| Net Working Capital | $86,610 | $106,299 | $128,364 | n.a |
| Interest Coverage | 13.85 | 19.68 | 31.33 | n.a |
| Additional Ratios | ||||
| Assets to Sales | 0.41 | 0.48 | 0.53 | n.a |
| Current Debt/Total Assets | 5% | 8% | 7% | n.a |
| Acid Test | 20.12 | 12.24 | 13.92 | n.a |
| Sales/Net Worth | 3.47 | 2.68 | 2.20 | n.a |
| Dividend Payout | 0.00 | 0.00 | 0.00 | n.a |
Appendix
| Sales Forecast | |||||||||||||
| Month 1 | Month 2 | Month 3 | Month 4 | Month 5 | Month 6 | Month 7 | Month 8 | Month 9 | Month 10 | Month 11 | Month 12 | ||
| Sales | |||||||||||||
| Remodeling Projects | 0% | $2,100 | $2,200 | $3,020 | $6,000 | $8,500 | $12,000 | $14,000 | $18,000 | $10,022 | $5,210 | $3,820 | $2,800 |
| New Home Construction | 0% | $0 | $0 | $2,000 | $3,000 | $4,000 | $5,000 | $7,000 | $8,000 | $5,000 | $3,000 | $2,000 | $2,000 |
| Interior Design of Existing Home | 0% | $3,000 | $3,000 | $4,240 | $6,300 | $9,000 | $11,000 | $14,000 | $17,000 | $13,000 | $4,322 | $3,222 | $2,655 |
| Total Sales | $5,100 | $5,200 | $9,260 | $15,300 | $21,500 | $28,000 | $35,000 | $43,000 | $28,022 | $12,532 | $9,042 | $7,455 | |
| Direct Cost of Sales | Month 1 | Month 2 | Month 3 | Month 4 | Month 5 | Month 6 | Month 7 | Month 8 | Month 9 | Month 10 | Month 11 | Month 12 | |
| Remodeling Projects | $0 | $230 | $433 | $630 | $950 | $1,201 | $1,550 | $1,700 | $850 | $530 | $300 | $260 | |
| New Home Construction | $0 | $0 | $300 | $400 | $500 | $600 | $700 | $900 | $800 | $600 | $400 | $300 | |
| Interior Design of Existing Home | $0 | $320 | $590 | $800 | $1,002 | $1,202 | $1,409 | $1,650 | $1,200 | $390 | $280 | $248 | |
| Subtotal Direct Cost of Sales | $0 | $550 | $1,323 | $1,830 | $2,452 | $3,003 | $3,659 | $4,250 | $2,850 | $1,520 | $980 | $808 | |
| Personnel Plan | |||||||||||||
| Month 1 | Month 2 | Month 3 | Month 4 | Month 5 | Month 6 | Month 7 | Month 8 | Month 9 | Month 10 | Month 11 | Month 12 | ||
| Courtney Hamlin | 0% | $4,000 | $4,000 | $4,000 | $4,000 | $4,000 | $4,000 | $4,000 | $4,000 | $4,000 | $4,000 | $4,000 | $4,000 |
| Katherine Park | 0% | $4,000 | $4,000 | $4,000 | $4,000 | $4,000 | $4,000 | $4,000 | $4,000 | $4,000 | $4,000 | $4,000 | $4,000 |
| Total People | 2 | 2 | 2 | 2 | 2 | 2 | 2 | 2 | 2 | 2 | 2 | 2 | |
| Total Payroll | $8,000 | $8,000 | $8,000 | $8,000 | $8,000 | $8,000 | $8,000 | $8,000 | $8,000 | $8,000 | $8,000 | $8,000 | |
| General Assumptions | |||||||||||||
| Month 1 | Month 2 | Month 3 | Month 4 | Month 5 | Month 6 | Month 7 | Month 8 | Month 9 | Month 10 | Month 11 | Month 12 | ||
| Plan Month | 1 | 2 | 3 | 4 | 5 | 6 | 7 | 8 | 9 | 10 | 11 | 12 | |
| Current Interest Rate | 10.00% | 10.00% | 10.00% | 10.00% | 10.00% | 10.00% | 10.00% | 10.00% | 10.00% | 10.00% | 10.00% | 10.00% | |
| Long-term Interest Rate | 10.00% | 10.00% | 10.00% | 10.00% | 10.00% | 10.00% | 10.00% | 10.00% | 10.00% | 10.00% | 10.00% | 10.00% | |
| Tax Rate | 30.00% | 30.00% | 30.00% | 30.00% | 30.00% | 30.00% | 30.00% | 30.00% | 30.00% | 30.00% | 30.00% | 30.00% | |
| Other | 0 | 0 | 0 | 0 | 0 | 0 | 0 | 0 | 0 | 0 | 0 | 0 | |
| Pro Forma Profit and Loss | |||||||||||||
| Month 1 | Month 2 | Month 3 | Month 4 | Month 5 | Month 6 | Month 7 | Month 8 | Month 9 | Month 10 | Month 11 | Month 12 | ||
| Sales | $5,100 | $5,200 | $9,260 | $15,300 | $21,500 | $28,000 | $35,000 | $43,000 | $28,022 | $12,532 | $9,042 | $7,455 | |
| Direct Cost of Sales | $0 | $550 | $1,323 | $1,830 | $2,452 | $3,003 | $3,659 | $4,250 | $2,850 | $1,520 | $980 | $808 | |
| Other Production Expenses | $0 | $0 | $0 | $0 | $0 | $0 | $0 | $0 | $0 | $0 | $0 | $0 | |
| Total Cost of Sales | $0 | $550 | $1,323 | $1,830 | $2,452 | $3,003 | $3,659 | $4,250 | $2,850 | $1,520 | $980 | $808 | |
| Gross Margin | $5,100 | $4,650 | $7,937 | $13,470 | $19,048 | $24,997 | $31,341 | $38,750 | $25,172 | $11,012 | $8,062 | $6,647 | |
| Gross Margin % | 100.00% | 89.42% | 85.71% | 88.04% | 88.60% | 89.28% | 89.55% | 90.12% | 89.83% | 87.87% | 89.16% | 89.16% | |
| Expenses | |||||||||||||
| Payroll | $8,000 | $8,000 | $8,000 | $8,000 | $8,000 | $8,000 | $8,000 | $8,000 | $8,000 | $8,000 | $8,000 | $8,000 | |
| Sales and Marketing and Other Expenses | $500 | $500 | $500 | $500 | $500 | $500 | $500 | $500 | $500 | $500 | $500 | $500 | |
| Depreciation | $0 | $0 | $0 | $0 | $0 | $0 | $0 | $0 | $0 | $0 | $0 | $0 | |
| Leased Equipment | $200 | $200 | $200 | $200 | $200 | $200 | $200 | $200 | $200 | $200 | $200 | $200 | |
| Utilities | $200 | $200 | $200 | $200 | $200 | $200 | $200 | $200 | $200 | $200 | $200 | $200 | |
| Insurance | $200 | $200 | $200 | $200 | $200 | $200 | $200 | $200 | $200 | $200 | $200 | $200 | |
| Rent | $3,000 | $3,000 | $3,000 | $3,000 | $3,000 | $3,000 | $3,000 | $3,000 | $3,000 | $3,000 | $3,000 | $3,000 | |
| Payroll Taxes | 15% | $1,200 | $1,200 | $1,200 | $1,200 | $1,200 | $1,200 | $1,200 | $1,200 | $1,200 | $1,200 | $1,200 | $1,200 |
| Other | $0 | $0 | $0 | $0 | $0 | $0 | $0 | $0 | $0 | $0 | $0 | $0 | |
| Total Operating Expenses | $13,300 | $13,300 | $13,300 | $13,300 | $13,300 | $13,300 | $13,300 | $13,300 | $13,300 | $13,300 | $13,300 | $13,300 | |
| Profit Before Interest and Taxes | ($8,200) | ($8,650) | ($5,363) | $170 | $5,748 | $11,697 | $18,041 | $25,450 | $11,872 | ($2,288) | ($5,238) | ($6,653) | |
| EBITDA | ($8,200) | ($8,650) | ($5,363) | $170 | $5,748 | $11,697 | $18,041 | $25,450 | $11,872 | ($2,288) | ($5,238) | ($6,653) | |
| Interest Expense | $245 | $241 | $236 | $232 | $227 | $223 | $218 | $213 | $209 | $204 | $200 | $195 | |
| Taxes Incurred | ($2,534) | ($2,667) | ($1,680) | ($18) | $1,656 | $3,442 | $5,347 | $7,571 | $3,499 | ($748) | ($1,631) | ($2,054) | |
| Net Profit | ($5,912) | ($6,224) | ($3,919) | ($43) | $3,865 | $8,032 | $12,476 | $17,666 | $8,164 | ($1,745) | ($3,806) | ($4,794) | |
| Net Profit/Sales | -115.92% | -119.68% | -42.33% | -0.28% | 17.98% | 28.69% | 35.65% | 41.08% | 29.14% | -13.92% | -42.10% | -64.30% | |
| Pro Forma Cash Flow | |||||||||||||
| Month 1 | Month 2 | Month 3 | Month 4 | Month 5 | Month 6 | Month 7 | Month 8 | Month 9 | Month 10 | Month 11 | Month 12 | ||
| Cash Received | |||||||||||||
| Cash from Operations | |||||||||||||
| Cash Sales | $2,550 | $2,600 | $4,630 | $7,650 | $10,750 | $14,000 | $17,500 | $21,500 | $14,011 | $6,266 | $4,521 | $3,728 | |
| Cash from Receivables | $0 | $85 | $2,552 | $2,668 | $4,731 | $7,753 | $10,858 | $14,117 | $17,633 | $21,250 | $13,753 | $6,208 | |
| Subtotal Cash from Operations | $2,550 | $2,685 | $7,182 | $10,318 | $15,481 | $21,753 | $28,358 | $35,617 | $31,644 | $27,516 | $18,274 | $9,935 | |
| Additional Cash Received | |||||||||||||
| Sales Tax, VAT, HST/GST Received | 0.00% | $0 | $0 | $0 | $0 | $0 | $0 | $0 | $0 | $0 | $0 | $0 | $0 |
| New Current Borrowing | $0 | $0 | $0 | $0 | $0 | $0 | $0 | $0 | $0 | $0 | $0 | $0 | |
| New Other Liabilities (interest-free) | $0 | $0 | $0 | $0 | $0 | $0 | $0 | $0 | $0 | $0 | $0 | $0 | |
| New Long-term Liabilities | $0 | $0 | $0 | $0 | $0 | $0 | $0 | $0 | $0 | $0 | $0 | $0 | |
| Sales of Other Current Assets | $0 | $0 | $0 | $0 | $0 | $0 | $0 | $0 | $0 | $0 | $0 | $0 | |
| Sales of Long-term Assets | $0 | $0 | $0 | $0 | $0 | $0 | $0 | $0 | $0 | $0 | $0 | $0 | |
| New Investment Received | $0 | $0 | $0 | $0 | $0 | $0 | $0 | $0 | $0 | $0 | $0 | $0 | |
| Subtotal Cash Received | $2,550 | $2,685 | $7,182 | $10,318 | $15,481 | $21,753 | $28,358 | $35,617 | $31,644 | $27,516 | $18,274 | $9,935 | |
| Expenditures | Month 1 | Month 2 | Month 3 | Month 4 | Month 5 | Month 6 | Month 7 | Month 8 | Month 9 | Month 10 | Month 11 | Month 12 | |
| Expenditures from Operations | |||||||||||||
| Cash Spending | $8,000 | $8,000 | $8,000 | $8,000 | $8,000 | $8,000 | $8,000 | $8,000 | $8,000 | $8,000 | $8,000 | $8,000 | |
| Bill Payments | $10,100 | $3,026 | $3,482 | $5,252 | $7,420 | $9,713 | $12,053 | $14,618 | $17,152 | $11,672 | $6,229 | $4,828 | |
| Subtotal Spent on Operations | $18,100 | $11,026 | $11,482 | $13,252 | $15,420 | $17,713 | $20,053 | $22,618 | $25,152 | $19,672 | $14,229 | $12,828 | |
| Additional Cash Spent | |||||||||||||
| Sales Tax, VAT, HST/GST Paid Out | $0 | $0 | $0 | $0 | $0 | $0 | $0 | $0 | $0 | $0 | $0 | $0 | |
| Principal Repayment of Current Borrowing | $0 | $0 | $0 | $0 | $0 | $0 | $0 | $0 | $0 | $0 | $0 | $0 | |
| Other Liabilities Principal Repayment | $0 | $0 | $0 | $0 | $0 | $0 | $0 | $0 | $0 | $0 | $0 | $0 | |
| Long-term Liabilities Principal Repayment | $550 | $550 | $550 | $550 | $550 | $550 | $550 | $550 | $550 | $550 | $550 | $550 | |
| Purchase Other Current Assets | $0 | $0 | $0 | $0 | $0 | $0 | $0 | $0 | $0 | $0 | $0 | $0 | |
| Purchase Long-term Assets | $0 | $0 | $0 | $0 | $0 | $0 | $0 | $0 | $0 | $0 | $0 | $0 | |
| Dividends | $0 | $0 | $0 | $0 | $0 | $0 | $0 | $0 | $0 | $0 | $0 | $0 | |
| Subtotal Cash Spent | $18,650 | $11,576 | $12,032 | $13,802 | $15,970 | $18,263 | $20,603 | $23,168 | $25,702 | $20,222 | $14,779 | $13,378 | |
| Net Cash Flow | ($16,100) | ($8,891) | ($4,850) | ($3,484) | ($489) | $3,490 | $7,755 | $12,449 | $5,943 | $7,295 | $3,495 | ($3,443) | |
| Cash Balance | $43,350 | $34,459 | $29,609 | $26,125 | $25,636 | $29,126 | $36,881 | $49,330 | $55,273 | $62,568 | $66,063 | $62,620 | |
| Pro Forma Balance Sheet | |||||||||||||
| Month 1 | Month 2 | Month 3 | Month 4 | Month 5 | Month 6 | Month 7 | Month 8 | Month 9 | Month 10 | Month 11 | Month 12 | ||
| Assets | Starting Balances | ||||||||||||
| Current Assets | |||||||||||||
| Cash | $59,450 | $43,350 | $34,459 | $29,609 | $26,125 | $25,636 | $29,126 | $36,881 | $49,330 | $55,273 | $62,568 | $66,063 | $62,620 |
| Accounts Receivable | $0 | $2,550 | $5,065 | $7,143 | $12,126 | $18,145 | $24,392 | $31,033 | $38,417 | $34,794 | $19,810 | $10,578 | $8,098 |
| Other Current Assets | $20,000 | $20,000 | $20,000 | $20,000 | $20,000 | $20,000 | $20,000 | $20,000 | $20,000 | $20,000 | $20,000 | $20,000 | $20,000 |
| Total Current Assets | $79,450 | $65,900 | $59,524 | $56,752 | $58,250 | $63,781 | $73,518 | $87,915 | $107,747 | $110,067 | $102,378 | $96,641 | $90,717 |
| Long-term Assets | |||||||||||||
| Long-term Assets | $0 | $0 | $0 | $0 | $0 | $0 | $0 | $0 | $0 | $0 | $0 | $0 | $0 |
| Accumulated Depreciation | $0 | $0 | $0 | $0 | $0 | $0 | $0 | $0 | $0 | $0 | $0 | $0 | $0 |
| Total Long-term Assets | $0 | $0 | $0 | $0 | $0 | $0 | $0 | $0 | $0 | $0 | $0 | $0 | $0 |
| Total Assets | $79,450 | $65,900 | $59,524 | $56,752 | $58,250 | $63,781 | $73,518 | $87,915 | $107,747 | $110,067 | $102,378 | $96,641 | $90,717 |
| Liabilities and Capital | Month 1 | Month 2 | Month 3 | Month 4 | Month 5 | Month 6 | Month 7 | Month 8 | Month 9 | Month 10 | Month 11 | Month 12 | |
| Current Liabilities | |||||||||||||
| Accounts Payable | $10,000 | $2,911 | $3,309 | $5,007 | $7,098 | $9,314 | $11,569 | $14,040 | $16,757 | $11,462 | $6,067 | $4,687 | $4,107 |
| Current Borrowing | $0 | $0 | $0 | $0 | $0 | $0 | $0 | $0 | $0 | $0 | $0 | $0 | $0 |
| Other Current Liabilities | $0 | $0 | $0 | $0 | $0 | $0 | $0 | $0 | $0 | $0 | $0 | $0 | $0 |
| Subtotal Current Liabilities | $10,000 | $2,911 | $3,309 | $5,007 | $7,098 | $9,314 | $11,569 | $14,040 | $16,757 | $11,462 | $6,067 | $4,687 | $4,107 |
| Long-term Liabilities | $30,000 | $29,450 | $28,900 | $28,350 | $27,800 | $27,250 | $26,700 | $26,150 | $25,600 | $25,050 | $24,500 | $23,950 | $23,400 |
| Total Liabilities | $40,000 | $32,361 | $32,209 | $33,357 | $34,898 | $36,564 | $38,269 | $40,190 | $42,357 | $36,512 | $30,567 | $28,637 | $27,507 |
| Paid-in Capital | $60,000 | $60,000 | $60,000 | $60,000 | $60,000 | $60,000 | $60,000 | $60,000 | $60,000 | $60,000 | $60,000 | $60,000 | $60,000 |
| Retained Earnings | ($20,550) | ($20,550) | ($20,550) | ($20,550) | ($20,550) | ($20,550) | ($20,550) | ($20,550) | ($20,550) | ($20,550) | ($20,550) | ($20,550) | ($20,550) |
| Earnings | $0 | ($5,912) | ($12,135) | ($16,055) | ($16,098) | ($12,233) | ($4,201) | $8,275 | $25,941 | $34,105 | $32,360 | $28,554 | $23,760 |
| Total Capital | $39,450 | $33,538 | $27,315 | $23,395 | $23,352 | $27,217 | $35,249 | $47,725 | $65,391 | $73,555 | $71,810 | $68,004 | $63,210 |
| Total Liabilities and Capital | $79,450 | $65,900 | $59,524 | $56,752 | $58,250 | $63,781 | $73,518 | $87,915 | $107,747 | $110,067 | $102,378 | $96,641 | $90,717 |
| Net Worth | $39,450 | $33,538 | $27,315 | $23,395 | $23,352 | $27,217 | $35,249 | $47,725 | $65,391 | $73,555 | $71,810 | $68,004 | $63,210 |

