
Interior Views LLC
Executive Summary
Interior Views is a retail store offering home decorator fabrics and complementary home accessories and resources. It is now approaching its fifth year in business. This destination store offers the advantages of providing fabrics specifically designed for home decorator use in fabric widths of 54 inches and greater. Over 900 fabrics are available on the floor at any time with more than 10,000 sample fabrics for custom “cut” orders. Customers see, touch, feel, and take the fabric to their home as they work through with their purchasing decision.
Interior Views has learned much from the past years of operation, the market has changed, and will be making key decisions, including the upcoming 5-year lease. Now is the time to step back, look at the past, and attempt to set a strategic direction for the future. This is the primary purpose of this business plan. It will address location, finance, product, and service issues that will be key to the future success of the business.
Interior Views currently has a local informational content website but has not given it the attention or focus needed to assess its marketing potential. The site offers information content, but it does little to produce revenue or enhance the image of the business.
Market research indicates a specific and growing need in and beyond the local area for the products and services Interior Views offers in the local retail market it serves and there are indications that Web sales will play an increasing role in connecting customers with sellers. The most significant challenge is that the core target customer, women between the ages of 35 and 50, are some of the least likely of groups to shop on the Web. Shopping for decorator fabric presents an additional challenge.
The online marketing objective is to actively support continued growth and profitability of Interior Views through effective implementation of the strategy. The online marketing and sales strategy will be based on a cost effective approach to reach additional customers over the Web through the use of an eBay website to generate attention and revenue for the business. The Web target groups will include the more Web-savvy younger customer base that the store currently serves (women between the ages of 25 and 35) and out-of-area potential customers that are already shopping on the Web for the products Interior Views offers. The eBay website will focus on its selection, competitive pricing, and customer service to differentiate itself among other Internet options.
1.1 Objectives
- Maintain a healthy gross margin each month.
- Generate sales each business day each month.
- Realize a modest annual growth rate this year.
- Increase revenues through eBay-based sales to $5,700 per month by the end of the first year, with a 5% growth rate thereafter.
- Enhancing “information channels” with the established customer base to provide additional options to receive information from the store.
- Meet the needs of customers outside the immediate serving area through eBay/Web accessibility.
1.2 Mission
Interior Views LLC is a store for discerning, quality-conscious buyers of decorator fabrics and complementary home accessories and furniture. The store celebrates the home through the color and texture of fabric. The experience informs, inspires, and shows people how to transform their home into a unique and personalized expression of themselves. Interior Views seeks to encourage people to imagine what can be, and help make this vision a reality.
1.3 Keys to Success
The primary keys to success for the company will be based on the following factors:
- Sell products of the highest quality with excellent customer support
- Communicate with our customer base through continued use of the newsletter, postcards, and our website.
- Maintain gross margins in excess of 45%
- Retain customers to generate repeat purchases and make referrals.
- Generate additional sales to cover all expenses in support of the website as an individual profit center.
Company Summary
Interior Views offers quality products for home decorating featuring first quality decorator fabrics, related drapery hardware, pillow forms and other sewing notions, as well as home accessories and select antiques to complement the home’s interior. The store is also a resource for the “do-it-yourselfers” through hosting associated classes that focus on the use of fabric, as well as for the “make-it-yourself” customer who is able to take advantage of the craftspeople who will use their fabrication and upholstery services based on the fabric purchase of the customer. The intent of the store and its website is to be considered the premier choice for these products and services within our market and beyond.
2.1 Company Ownership
Interior Views is a Limited Liability Company. It is owned by two couples, the Williams at a combined 70% ownership and the Swansons at 30% ownership. Judy Williams is president, Doug Williams assists her in select areas of marketing and store layout. The Swansons take a “silent partner” role in the venture.
2.2 Company History
The business has had a surprising journey since is opening on December 16, 1996. Certainly, none of the shareholders would have guessed its course.
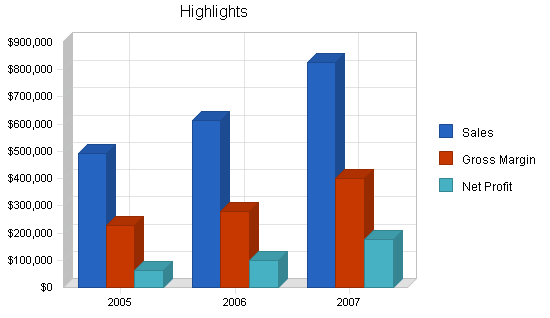
The past revenue performance table summarizes the annual performance for the past three years. After a slow but steady increase in revenues, year five showed a disappointing reduction in total revenues. This was particularly evident for in-stock fabric revenues while special order fabric, particularly higher end purchases, held its own. This reduction in revenue has caused the store to limit purchases and minimize expansion in new product areas that offer potential, but require cash for this product line expansion. The “Oval Office Iron” line is one example of this.
On a more tactical basis, the following categorizes our marketing activities as “Do It Again” and “Did Not Work.” This was determined on the return on investment (ROI) based on trackable sales that resulted from these marketing efforts.
Do It Again
Marketing
- Quarterly Newsletter containing three elements:
- Sales Event – Ten-day sales running from Wednesday, through week, and ending on the following Saturday.
- Fabric Oriented Classes – Predominately sponsored without an associated fee to get people into the store.
- Events – open house, demonstrations, and/or charity fund raiser.
- Newspaper ad with “call to action” sale events in the Pleasantville Herald for sales activities with the Wednesday “Entree” section announcing the sale.
- Television advertising-30 second commercials:
- Co-sponsorship of the local broadcast of “Martha Stewart” on a consistent, ongoing basis throughout the year.
- Select sponsorship of the local broadcast of “Interior Motives” on the local cable channel.
Product Development
- Explore the use of local craftsmen, including our success with Mike and the “Oval Office Iron” product line we created, versus using unreliable manufacturers.
- The Antique Bureau has been a perfect fit in terms of bringing a steady quantity of qualified customers and Teresa herself has been a tremendous addition.
Did Not Work
Marketing
- Advertising and sponsorship of local ballet and opera performance programs.
- Advertising in Pleasantville Junior League Newsletter.
- Advertising in the Downtown Athletic Club Newsletter.
- Local television advertising on talk show formats, news shows, and general audience programs.
- Hilton Hotel “In-room” book advertisements.
Product Development
- The slip covered furniture line–too costly and people did not see the value.
- Architectural storage and shelving pieces–value was a major question here as well.
Hiring

- Don’t bring people on board who don’t understand the essence of the store. Assess if they would be customers themselves.
- Screen sub-lease candidates as closely as you would an employee.

| Past Performance | |||
| 2002 | 2003 | 2004 | |
| Sales | $312,302 | $291,313 | $290,000 |
| Gross Margin | $143,658 | $130,220 | $129,520 |
| Gross Margin % | 46.00% | 44.70% | 44.66% |
| Operating Expenses | $220,050 | $222,660 | $226,520 |
| Inventory Turnover | 1.50 | 1.80 | 2.00 |
| Balance Sheet | |||
| 2002 | 2003 | 2004 | |
| Current Assets | |||
| Cash | $955 | $1,225 | $1,200 |
| Inventory | $152,500 | $150,100 | $150,000 |
| Other Current Assets | $2,250 | $2,350 | $2,300 |
| Total Current Assets | $155,705 | $153,675 | $153,500 |
| Long-term Assets | |||
| Long-term Assets | $3,850 | $4,140 | $4,200 |
| Accumulated Depreciation | $1,850 | $1,990 | $2,050 |
| Total Long-term Assets | $2,000 | $2,150 | $2,150 |
| Total Assets | $157,705 | $155,825 | $155,650 |
| Current Liabilities | |||
| Accounts Payable | $102,257 | $91,115 | $8,000 |
| Current Borrowing | $7,200 | $21,525 | $22,000 |
| Other Current Liabilities (interest free) | $5,000 | $940 | $1,150 |
| Total Current Liabilities | $114,457 | $113,580 | $31,150 |
| Long-term Liabilities | $0 | $0 | $0 |
| Total Liabilities | $114,457 | $113,580 | $31,150 |
| Paid-in Capital | $0 | $0 | $0 |
| Retained Earnings | ($5,172) | $89,745 | $112,500 |
| Earnings | $48,420 | ($47,500) | $12,000 |
| Total Capital | $43,248 | $42,245 | $124,500 |
| Total Capital and Liabilities | $157,705 | $155,825 | $155,650 |
| Other Inputs | |||
| Payment Days | 30 | 40 | 40 |
2.3 Company Locations and Facilities
Interior Views is located in Pleasantville, Ourstate. It is not situated in a typical retail location. This older, warehouse-type section of downtown continues to emerge as a retail area and does hold promise. REI is across the street, a dance and theater retail store has just recently moved next door, and a fitness center remains active around the clock. The location was selected due to the “destination” aspects of the target market–they will seek out these types of stores regardless of location as long as there is parking and it is safe. The look and feel of the street environment continues to improve with recent parking and landscape enhancements. The attractive aspect is the cost of the space and it’s “warehouse” charm. The challenging aspect is the lack of foot traffic and drive-by exposure.
The 5-year lease is up in December and potential relocation or reductions in the lease are both a possibility with one of the highest vacancy rates of commercial and retail space in the market the past decade.
Products
Interior Views focuses on selling decorator fabric for use in the home. It is available through the purchase of in-stock fabric and through a special order arrangement. Other fabric-related complementary products include trims, pillows, ribbon, and thread.
Additional products now available in the store include:
- Hunter Douglas products including a variety of hard window coverings.
- Interior shutters made of wood and a plastic/resin product called “polywood.”
- An in-house line of drapery hardware (replacing “Antique Drapery Rod” products) locally manufactured products that we design and market under the product name of “Oval Office Iron” offering wrought iron drapery hardware (We have plans to expand this to also include other metal home decor products and potentially outdoor garden products.).
- Home accessories through a “percentage” relationship with “The Window Seat” and Sarah Melvin.
- Antiques through a consignment arrangement with Joyce McMillian.
- Antiques through a sub-lease revenue arrangement with Teresa Mitchell and “The Antique Bureau.”
Initially, our eBay store will focus on fabrics and home decorating products and accessories. The size, weight, and custom dimension shipping constraints on our “Oval Office Iron” wrought iron drapery hardware will initially preclude our offering this product line on the eBay store.
3.1 Product Description
Our primary points of differentiation offer these qualities:
- The most extensive access to in-stock, first quality decorator fabrics, at affordable prices, within 100 miles of our primary geographic market.
- The largest selection of special-order fabrics, with arrangements to have most of those products shipped to the store within 10 days of placing the order.
- Personal assistance from a design-oriented staff that is qualified and capable of meeting the needs of discerning customers with high expectations.
- Complementary product offerings, including hard-covering window treatment, hardware, home accessories, made-to-order upholstered furniture, and antiques that are designed, selected, and displayed in a way to emphasize the use of fabric in home design.
Interior Views will qualify for the most attractive retail discount through these suppliers, offering greater profit margins and more competitive pricing for bolt purchases in quantities of 50 to 60 yards, or in half of that yardage with a “cutting fee” that often increases cost per yard by $.50 to $1.00 depending on the source. The primary product lines will include fabrics from the following textile sources:
- Robert Allen Fabrics
- Fabricut
- Waverly Fabrics
- Spectrum
- Art Mark
- Covington
- P/Kaufmann
Complementary accessories, including fabric trims, drapery hardware, and hard-covering window treatments, are supplied from the following sources:
- Hunter Douglas: Hard-window coverings
- Kirsh: Rods with selected window hardware and accessories
- Conso: Trims and Fabric Accessories
- Petersen-Arne: Trims and Accessories
- Graber: Selected window hardware
- Grumman: Threads
Again, we have also created a line of metal drapery hardware called “Oval Office Iron” that has replace the Antique Drapery Rod line. A local craftsman, Mike Overman, produces these products based on our specifications and requirements.
3.2 Competitive Comparison
Our competition has changed. When we opened the store, we considered the classic fabric stores within the state to offer the greatest amount of competition. The competitors have increased primarily due to expansion of nationally recognized businesses.
- Bed, Bath and Beyond moved into the market recently, within one mile at an excellent location.
- Discount stores including Target, Wal-Mart, and Home Depot have expanded their fabric, bedding, pillow, and ready-made drapery selections often representing lines including Waverly and in some cases, with the same fabric.
- Norwalk continues to make purchasing “blank” furniture and making a fabric selection an attractive option to recovering furniture.
- Catalog sales continue to be a strong force with a list including Pottery Barn, Calico Corners, Ballard Design, and Eddie Bauer expanding purchasing selection.
- The list of competitors for home accessory competition includes Pier 1 and local competitors including Reed & Cross, The Shamrock and a list of other furniture, accessory and gift stores.
- Web sales of fabric has expanded dramatically and is easily available.
3.3 Sales Literature
Our most significant piece of literature continues to be the newsletter. This “federal-style” newsletter goes out three times each year and features:
- Sale events
- Class schedules
- Trends
- Fabric design suggestions
- “Dear Decora” with useful, but meant to be humorous, decorating advice
The newsletter is sent bulk mail and we also send postcards to promote a special sale and/or event.
Our informational website will now display our newsletter online, and have an archives of previous issues. We will use our eBay customer database to send email newsletters to those who opt-in to the service.
All of our new literature and reprints of current material will include listings or active links to our home site and our eBay store site.
3.4 Sourcing
Fabric
A majority of the fabric is purchased through 12 major fabricators. Reps visit regularly, they are available by phone, and are present at the four major trade shows that occur throughout the country.
Trims and Notions
There are three major sources of trim and notion providers.
Drapery and Window Treatment Goods
Hunter Douglas is the primary source of hard window coverings including duettes, vignettes, verticals, shutters, and other products. The “Oval Office Iron” line is created by local craftsman.
Our eBay store sales will be fulfilled from Interior Views’ main inventory.
3.5 Technology
Technology has changed the industry and the business through the Internet. Information about product availability and pricing is easily available. The low cost and easy process of shipping fabric has made this more interesting.
With the establishment of its eBay store and through better utilization of its existing website Interior Views will leverage this new retail channel to its advantage.
3.6 Future Products
Future products may include:
- Expansion of the “Oval Office Iron” line to include metal home accessories and garden-like accessories, lamp fixtures, and other metal fabricated products.
- Other furniture lines that complement fabric sold in the store.
- Patterns that enable the “do it yourselfers” to complete their project, such as the resin chair pattern.
Market Analysis Summary
The store has been well received since its opening on December 16, 1996. Marketing, combined with an optimal product offering, is critical to its continued success and future profitability. The store offers the most extensive selection of in-stock decorator fabrics, but the volume sales of special order fabric is the fastest growing area of the store. The basic market need is to offer a good selection of decorator fabrics at reasonable prices, for the “do-it-yourself” and the “buy-it-yourself” customers, through a personalized retail store that offers excellent service, design assistance, and inspiration for people to redecorate their homes.
We possess valuable information about our market and know a great deal about the common attributes of our most prized and loyal customers. We will leverage this information to better understand who we serve, their specific needs, and how we can better communicate with them.
4.1 Market Segmentation
The general profile of the Interior Views customer consists of the following geographic, demographic, psychographic, and behavioral factors, with additional comments regarding the Web attributes of this customer base. It is important to understand the attributes of the current retail customer, as we develop the Web customer base. We believe that the overall characteristics of our established local clientele can be extrapolated to a national level, and can be reached via the Internet and our eBay store.
Geographics
- Our immediate geographic market is the Pleasantville area, with a population of 175,500.
- A 100-mile geographic area is in need of our products and services.
- The total targeted area population is estimated at 573,300.
Demographics
- Female
- Married
- Have children, but not necessarily at home
- Have attended college
- A combined annual income in excess of $75,000
- Age range of 35 to 55 years, with a median age of 42
- Own their homes, townhouses and/or condominiums valued at over $225,000.
- If they work out of the home, it’s by choice in a professional/business setting.
- Belong to one or more business, social and/or athletic organizations, which may include:
- Downtown Athletic Club.
- Pleasantville Country Club.
- Junior League of Pleasantville.
- American Business Women’s Association.
We know the following regarding the profile of the typical resident of Pleasantville:
- 67% have lived in Pleasantville for 7 years or more.
- 23% are between the ages of 35 and 44.
- 40% have completed some college.
- 24% are managers, professionals and/or owners of a business.
- 53% are married.
- 65% have no children living at home.
- 56% own their residence.
Psychographics:
- The appearance of her home is a priority.
- Entertaining and showing her home is important.
- She perceives herself as creative, tasteful and able, but seeks validation and support regarding her decorating ideas and choices.
- She reads one or more of the following magazines:
- Martha Stewart Living
- Country Living
- Home
- House Beautiful
- Country Home
- Metropolitan Home
- Traditional Homes
- Victoria
- Elle Decor
- If she does seek out television as an informational source for home decorating that is most likely to be “Martha Stewart” and, on a lesser basis, “Interior Motives.”
Behaviors
- She takes pride in having an active role in decorating their home.
- Her home is a form of communicating “who she is” to others.
- Comparison positioning and stature within social groups are made on an ongoing basis, but rarely discussed.
Web Attributes
We used to be concerned that this particular segment was not know to Web-savvy. Unfortunately, the age group of thise women was one of the smallest groups that looks to the Internet for information and spends time there for research. This is not good for website sales in our niche industry.
However, as time has passed and the cost of computers and Internet access has plummeted, and the ease of Internet use in general, and consumer e-commerce has increased, our earlier fears have been assuaged.
We will pursue an eBay store website positioned to take advantage of the current and future potential of Internet retail. This group has become increasingly comfortable with the Web, and the “Professional Youngsters” are already using this as a resource.

| Market Analysis | |||||||
| 2005 | 2006 | 2007 | 2008 | 2009 | |||
| Potential Customers | Growth | CAGR | |||||
| Country Club Women | 11% | 73,500 | 81,585 | 90,559 | 100,520 | 111,577 | 11.00% |
| Boomers in Transition | 9% | 28,500 | 31,065 | 33,861 | 36,908 | 40,230 | 9.00% |
| Professional Youngsters – Internet Savvy | 6% | 107,450 | 113,897 | 120,731 | 127,975 | 135,654 | 6.00% |
| Home Builders | 4% | 18,000 | 18,720 | 19,469 | 20,248 | 21,058 | 4.00% |
| Online Fabric Shoppers | 8% | 204,750 | 221,130 | 238,820 | 257,926 | 278,560 | 8.00% |
| Internet Learners | 3% | 180,000 | 185,400 | 190,962 | 196,691 | 202,592 | 3.00% |
| Other | 2% | 1,200 | 1,224 | 1,248 | 1,273 | 1,298 | 1.98% |
| Total | 6.56% | 613,400 | 653,021 | 695,650 | 741,541 | 790,969 | 6.56% |
4.2 Target Market Segment Strategy
Our marketing strategy is based on becoming the resource of choice for people looking for decorator fabrics. The “do-it-yourselfers” and “buy-it-yourselfers” need a resource to create a look in their home. Our marketing strategy is based on superior performance in the following areas:
- Product selection.
- Product quality.
- Customer service.
The target markets are separated into four segments; “Country Club Women,” “Boomers in Transition,” “Professional Youngsters” and “Home Builders.” The primary marketing opportunity is selling to these well defined and accessible target market segments that focuses on investing discretionary income in these areas:
Country Club Women — The most dominant segment of the four is comprised of women in the age range of 35 to 50. They are married, have a combined income of greater than $80,000, own at least one home or condominium, and are socially active. They are members of the Pleasantville Country Club, the Downtown Athletic Club, the Junior League of Pleasantville, AAUW, and/or the Doctor Wives Auxiliary. They have discretionary income, and their home is a priority. The appearance of where they live communicates who they are and what is important to them. This group represents the largest collection of “Martha Stewart Wanna Be’s,” with their profile echoing readers of Martha Stewart Living magazine, based on the current demographics described in the Martha Stewart Living Media Kit.
Boomers in Transition — This group, typically ranging in age from 50 to 65, is going through a positive and planned life transition. They are changing homes (either building or moving) or remodeling due to empty nest syndrome, retirement plans, general downsizing desires, or to just get closer to the golf course. Their surprisingly high level of discretionary income is first spent on travel, with decorating their home a close second. The woman of the couple is the decision maker, and often does not always include the husband in the selection or purchase process.
Professional Youngsters — Couples between the ages of 25 and 35 establishing their first “adult” household fall into this group. They both work, earn in excess of $50,000 annually, and now want to invest in their home. They seek to enjoy their home and communicate a “successful” image and message to their contemporaries. They buy big when they have received a promotion, a bonus, or an inheritance.
Home Builders — People in the building process, typically ranging in age from 40 to 55, are prime candidates.
4.2.1 Market Needs
Interior Views is providing its customers the opportunity to create a home environment to express who they are. They have the choice to select their fabric and go whatever direction they choose–to fabric it themselves or have it done for them. They have the opportunity to actively participate in the design, look, and feel of their home. They desire their home to be personal, unique, and tasteful as well as communicate a message about what is important to them. We seek to fulfill the following benefits that we know are important to our customers.
- Selection – A wide choice of current and tasteful decorator fabrics.
- Accessibility – Buyers can walk out of the store with the fabric they need to begin their project.
- Customer Design Services – Employees have a design background to make them a resource for the customer. This enables customers to benefit from suggestions regarding the selection of their fabric and related products in a manner to complement their design choice.
- Competitive Pricing – All products will be competitively priced in comparison to stores in the Portland, Oregon market (best price comparison) and other channels of distribution, such as catalog sales.
4.2.2 Market Trends
The home textile market, including sheets, towels, draperies, carpets, blankets, and upholstery, accounts for 37% of all textile output. The trade publication “Home Textiles Today” estimates the size of the U.S. home textiles market at the wholesale level, excluding carpets, to be between $6.5 billion and $7 billion annually. The industry is expected to realize a steady increase over the next few years.
The industry is driven by the number of “household formations,” which is expected to continue through the first years of the new millennium. This is primarily due to the solid growth in the number of single-parent and non-family households. This growth also comes from baby boomers needing bigger houses to accommodate growing and extended families and, as people get older, they are buying homes rather than renting to realize tax and equity building benefits. Favorable mortgage rates will also enable others to invest in their existing home.
The “do-it-yourself” (DIY) market continues to grow and closely parallels the professional home-improvement market. DIY market growth is attributed to an increased presence of products, the personal satisfaction experienced, and the cost savings customers realize. A portion of the do-it-yourself market is the “buy-it-yourself” (BIY) market. Consumers are buying the product and arranging for someone else to do the fabrication and/or installation. This is more expensive then the do-it-yourself approach, but less costly than buying finished products from other sources. It also provides similar feelings of creativity, pride, and individuality associated with direct creative involvement. This sense of “participation” in home decorating is an important factor for many of these committed customers.
Regardless of this data, the following trends and issues impact the success and challenges of Interior Views.
- National economic health — The store does better when the country experiences “good times” regardless of its direct impact on the local economy. Sales decrease when the stock market falls and when NATO takes military action. An upbeat State of the Union address by the President correlates with an increase in sales.
- New home construction activity — More closely related to what is taking place in our local economy, new home construction has a significant impact on sales across all product lines.
- Shifts in design trends — Major changes in design trends increase sales. The Pleasantville market lags behind metropolitan design trends by 6 to 12 months. This offers a buying advantage for the store, offering a preview of what is coming and how we should adjust our in-stock inventory.
4.2.3 Market Growth
American Demographics projects that the number of U.S. households will grow by 16% to 115 million by the year 2010. Almost half of the households comprised of people from 35 to 44 years old are married couples with children under the age of 18. Based on this research, households in the 45 to 65 age range will grow to 45 million in 2010 as baby boomers add to this peak-earning and spending age group. These families will either build new homes or move into existing dwellings. With approximately 46.2% of the nation’s 93.3 million dwellings built before 1960, many of these homeowners are also expected to update.
One important factor is that married couples in the 35 to 65 age range represent a growth segment and enjoy larger incomes than other family structures. They enjoy the choice of spending their disposable income on life’s amenities. They may demonstrate “cocooning” by making their home a more comfortable and attractive haven. They choose to spend resources here rather than on vacations and other discretionary options. This group represents a larger subsegment of the target market.
These factors contribute to an increased need for home decorator fabrics, such as window treatments, upholstery, pillows, bedding, and other fabric accessory needs. This demand is expected to be complemented by the growth in the Pleasantville market. The majority of homeowners spend a large percentage of their disposable income on home goods within two years of buying a new house. Therefore, positive trends in new housing activity represents growth and opportunity for home textiles.
Recent slow downs in the local economy have resulted in falling sales projections and these factors will affect market growth. Adding revenues through the website will likely benefit the revenue stream.
4.3 Industry Analysis
The industry continues to be competitive with a “commodity” concern from both manufacturers/fabricators and retail players–the fabric is looking more alike all the time. Based on Porter’s Five Forces Model, the industry has these attributes:
- Potential Competitors – There are many, both on the Web and through other channels including retail and catalog sales. Loyalty on the Web does not exist and the barriers to entry are very low. Percent of business failures are high–estimated to be over 70% in the first three years of operation.
- Power of Suppliers – Moderately high in that there are recognized leaders in the industry, including Waverly, Fabricut, P/Kaufmann, Robert Allen, and Covington.
- Power of Buyers – Very low as buyers work with the financial terms and product availability offered through the suppliers that specify the terms and conditions.
- Substitute Products – High in the area of window treatment as hardcovering solutions have become available and increasingly affordable. This includes blinds, shutters, and other “manufactured” treatments. Substitute products are not as prevalent for other uses, such as bedding and upholstery.
- Rivalry – Moderately low with the “territorial” structure that the industry experiences and moderately low exit barriers. People get out when it is not working.
With the slow, but steady, growth of the past few years, the industry is now experiencing a “cautious optimism” regarding the future. Growth and expansion activities for most areas of the home and textiles industry appear to be carefully considered as marketing continues to decide what to do as the economy experiences a slowdown and increased uncertainty from the more economically confident 90’s.
Our eBay store will initially focus on these Categories:
- Collectibles – Linens, Fabrics, Textiles
- Crafts – Fabric, Upholstery Fabric
- Home and Garden – Home Decor, Door Accessories, Floral Decor, Screens and Room Dividers, Slipcovers, Wall Decor
- Window Treaments
4.3.1 Industry Participants
Industry participants in the area of decorator fabric come from five general categories: traditional fabric retail stores, catalog and Web-based sales, click and mortar discounters, interior designers, and the individually owned and operated stores. Most of these players have some type of an online presence. The following provides an overview of the type of participants that are most active and most successful in this arena.
Traditional Fabric Retail Stores
The traditional retail stores are corporate stores (not franchises) that have multiple locations in select metropolitan markets. Example of these stores include:
- JoAnn’s www.joanns.com – Nationwide chain with strong buying power. They have a broad fabric selection for clothing with a limited number of in-store decorator fabrics available. Their primary target markets are the clothing seamstress, with an increasing emphasis on craft items. JoAnn’s purchased the House of Fabric chain and has a link set up from the previous URL www.houseoffabrics.com.
- Calico Corners www.calicocorners.com – This national chain was a franchise through the 1980s (no longer selling licenses) and has been purchasing those stores throughout the country. Calico Corners stores number approximately 90 and are in most larger cities, with a concentration in the Northeast.
Catalog and Web-based Competitors
Virtually every catalog and major retail store in the industry now has a website. The most aggressive and direct catalog competitor is Calico Corners (www.calicocorners.com) which complements their 80+ retail store network. An increasing level of competition is anticipated from these catalog and Web-based sales. Recent trends, such as those demonstrated in the well established, but still evolving, catalog Pottery Barn (www.potterybarn.com) and Ballard Design (www.ballarddesigns.com) indicates increased interest in offering decorator fabric for window design and upholstery through this increasingly popular channel of distribution. Catalog sources do not offer customers the option to see, touch, and have the fabric in their homes. Price is the most significant competitive factor this product source presents. In general, fabric sales over the Web have increased substantially in the past two years and present a source of competition for the future.
Click and Mortar Discounters
Channels of distribution continue to shift in favor of discounters, who account for a significant portion of the growth in the industry and who have been extremely active on the Web. As consumers experience lower levels of disposable income, discounters leverage frequent store promotions to entice frugal, value-oriented consumers. One of the biggest criticism of discounters is their failure to offer a quality service experience and their failure to present inviting displays to promote sales. These discounters, along with specialty store chains, present one of the most severe competitive threats for individually-owned specialty stores. This is partially due to extensive promotional efforts, price advantages, and established relationships with their vendors.
One example of these discounters is the “home improvement” chains, such as Home Base (www.homebase.com). This aggressive retailer has adopted a strategy to include complete decorator departments in their metropolitan stores. Currently existing in the Los Angeles market, this strategy is anticipated to be introduced into the Seattle area and other select metropolitan markets within the year. Although the Pleasantville Home Base store sells basic curtain rod hardware and other hard cover window treatment, there are no known plans at this time for the Pleasantville Home Base store to implement this in the foreseeable future. Bed, Bath & Beyond (www.bedbathandbeyond.com) has an even larger assortment of hardware with a selection of pre-made solutions for window treatments, bedding and pillows. Both of these retailers have stores in our market and with selection activity on the Web, this will be important to monitor for competitive purposes.
Interior Designers
This large group makes up a substantial quantity of higher end fabric purchases. For example, there are 37 interior designers listed in the Pleasantville Yellow Pages (Year 2001-2002 issue) that offer fabric as a part of their services. Interior designers make profit off mark-up of fabric in addition to their hourly services charges. Their costs per yard are typically higher since they do not benefit from retail or volume discounts. Therefore, their cost to the customer is often two to four times higher than the price per yard from Interior Views. It is unusual to find an independent Interior Designer with a website.
Individually Owned Stores
Some form of locally owned stores exist in virtually every market with a population of over 50,000. Typically, the low end begins with those that carry a limited selection of decorator fabric, often with a focus on clothing fabric and crafts. At a slightly more sophisticated level, stores may offer low-cost products with a wide selection of discontinued fabrics and only a limited number of “current” fabrics; this may be a warehouse concept offering a wide variety of products, including car and boat fabrics and materials. “Full service” individually owned stores, like Interior Views, are less prevalent. An increasing number of these stores at all level do have websites, including this local competitors’ example, Econo Sales (www.econosales.com).
4.3.2 Distribution Patterns
Our primary method of distribution continues to be the traditional retail store. The greatest opportunity for growth lies in the proposed website strategy. The concept behind this is to reach these key groups listed in order of importance based on their expected use and purchases from the site.
- Professional Youngsters – Expected to be the most likely of the targeted segments to use this resource because of their relatively high Internet use compared to the other segments. This group should offer the greatest online revenue opportunity.
- Outsiders – Comprised of people outside the area with Internet access that have come in contact with the physical store or learned of it though a referral or promotion. This group, most commonly located in rural areas of the Western U.S. and Hawaii, are expected to be a small but faithful sector of buyers.
- Online Fabric Shoppers – Most often find the site through search engines and these online decorator fabric shoppers are browsing multiple sites for a best buy or access to discontinued and hard-to-find fabric. They hold potential, but are typically the most work for the lowest return.
- Internet Learners – Represents all of the targeted segments that are just beginning to become familiar with the site and will increase their use of the Internet over time. Revenue expectations from this group are low at this point and it is viewed as an investment in the future.
4.3.3 Competition and Buying Patterns
Competition in the area of decorator fabric comes from three general categories, traditional fabric retail stores, catalog sales, and discounters. Customers make decisions on the basis of quality, price, and uniqueness. Durability and wear apply to upholstered fabric. Additional detail on all competitors will be provided.
Internet Presence
Competitors in our industry have discovered the Internet, but appear to be seeking to discover what works and what doesn’t. Interior Views’ content site and eBay store will seek to complement the store’s presence and expand that reach to other potential customers outside the area. It will have direct click-through links to our eBay store. Our eBay store will also have links taking viewers back to our content site.
Interior Views features a selection of the most popular fabrics from these fabricators on the store site:
- Robert Allen Fabrics
- Fabricut
- Waverly Fabrics
- Spectrum
- Art Mark
- Covington
- P/Kaufmann
Complementary product offerings will include smaller fabric mounting hardware, decorative accent pieces, and other non-fabric items from our main store merchandise.
Because of size, weight, shipping and custom measurement constraints we will not initially offer our “Oval Office Iron Works” drapery hardware. It will only be available in our Pleasantville store. It might be added to the eBay store later.
4.3.4 Main Competitors
Retail Stores
Current local competition includes the following:
- House of Fabrics — Nationwide recognition and buying power of numerous types of dated fabric with strong product availability. This store has experienced financial difficulty in recent years and has closed several locations throughout the country.
- Warehouse Fabrics — Locally owned, offering low-cost products with a wide selection of discontinued fabrics and only a limited number of “current” fabrics. This warehouse concept offers marginal customer service with what many “upper end” customers consider to be an “undesirable” shopping environment.
- JoAnn’s — Nationwide chain with strong buying power. They have a broad fabric selection for clothing with a limited number of in-store decorator fabrics available. Their primary target markets are the clothing seamstress, with an increasing emphasis on craft items.
- Interior Designers — There are 37 interior designers listed in the Pleasantville Yellow Pages (Year 2000-2001 issue) that offer fabric as a part of their services. Interior designers make a profit off the mark up of fabric in addition to their hourly service charges. Their costs per yard are typically higher since they do not benefit from retail or volume discounts. Therefore, their costs to their customer is often two to four times higher than the price per yard from Interior Views.
- Website Providers — Fabric sales over the Web are limited at this time, and this will be a source of competition for the future. Currently, there is no measurable impact on our market through competitive websites.
Catalog Competitors
An increasing level of competition is anticipated from catalog sales. Recent trends, such as those demonstrated in the well established but evolving catalog Pottery Barn, indicates increased interest in offering decorator fabric, window designs, and other home decorating products through this increasingly popular channel of distribution. Catalog sources do not offer customers the option to see, touch, and have the fabric in their homes. Price is the most significant competitive factor this product source presents. The most aggressive catalog competitor is Calico Corners followed by Pottery Barn and other home-accessory-based providers.
Discounters
Channels of distribution continue to shift in favor of discounters, who account for a significant portion of the growth in the industry. As consumers experience lower levels of disposable income, discounters leverage frequent store promotions to entice frugal, value-oriented consumers. One of the biggest criticism of discounters is their failure to offer a quality service experience and their failure to present inviting displays to promote sales. These discounters, along with specialty store chains, present one of the most severe competitive threats for individually-owned specialty stores. This is partially due to extensive promotional efforts, price advantages, and established relationships with their vendors. One example of these discounters is the “home improvement” chains, such as Home Base. This aggressive retailer has adopted a strategy to include complete decorator departments in their metropolitan stores. Currently existing in the Los Angeles market, this strategy is anticipated to be introduced into the Seattle area and other select metropolitan markets within the year. Although the Pleasantville Home Base store sells basic curtain rod hardware and other hard cover window treatment, there are no known plans at this time for the Pleasantville Home Base store to implement this in the foreseeable future. This will be an important issue to monitor for competitive purposes.
Strategy and Implementation Summary
The primary sales and marketing strategy includes these factors:
- A premier retail store experience that provides impressive product display and over-the-top customer service.
- The sale of other complementary products through consignment and/or sub-lease arrangements that adds to the selling atmosphere and creates reasons to visit the store on a frequent basis.
- The retail store provides a stable financial foundation and a source of inventory for the eBay store.
- A website that complements the store’s fabric sales and provides access to customers that will never set foot in the physical retail store itself.
- A renovation of the existing website that provides content and a catalog of available fabrics and decorating accessories with direct links between the displayed items and the same item on our eBay store.
- Good Web and hardcopy marketing to drive customers to the store, either directly from search engines or from links on our home website.
- Excellent inventory management and prompt fulfillment of orders. Additional computer hardware and software will be purchased for this purpose. If volume warrants, additional staff will be hired.
5.1 SWOT Analysis
The following SWOT analysis captures the key strengths and weaknesses within the company, and describes the opportunities and threats facing Interior Views.
5.1.1 Strengths
- Strong relationships with suppliers that offer credit arrangements, flexibility, and response to special product requirements.
- Excellent and stable staff, offering personalized customer service.
- Great retail space that offers flexibility with a positive and attractive, inviting atmosphere.
- Strong merchandising and product presentation.
- Good referral relationships with complementary vendors, local realtors, and some designers.
- In-store complementary products through “The Window Seat” and “Antique Bureau” add interest, stability and revenue.
- High customer loyalty among repeat and high-dollar purchase customers.
- The existence of Interior Views’ main store will provide a solid foundation for the establishment of the eBay store retail channel.
5.1.2 Weaknesses
- Access to additional operating capital.
- Cash flow continues to be unpredictable, and a periodic problem.
- Owners are still climbing the “retail experience curve.”
- Location is not in a heavily traveled, traditional retail area.
- Challenges of the seasonality of the business.
- The operation and maintenance of an online presence and eBay store may cause a negative cash flow.
5.1.3 Opportunities
- Growing market with a significant percentage of our target market still not knowing we exist.
- Strategic alliances offering sources for referrals and joint marketing activities to extend our reach.
- Promising activity from high levels of new home construction.
- Changes in design trends can initiate home updating, and therefore, generate sales.
- Increasing sales opportunities beyond our “100-mile” target area including several smaller communities that have produced a faithful following of customers.
- Internet potential for selling products to other markets.
5.1.4 Threats
- The downturn in the ecomony has impacted store sales–stock market predictors correlate with store sales. It has not been good in recent years.
- Expansion of national discount stores into the local market: including Target, Wal-Mart and Home Depot into our decorator fabric space.
- Competition from a national store; or a store with greater financing or product resources could enter the market.
- Catalog resources, including Calico Corners and Pottery Barn, with aggressively priced trend-setting fabric products including drapery, bedding, and slipcovers.
- Continued price pressure due to competition or the weakening market reducing contribution margins.
- Dramatic changes in design, including fabric colors and styles, creates obsolete or less profitable inventory.
- Expansion of major fabric retailers into the online environment with massive Web marketing and search engine techniques may capture Internet customers before they ever enter the eBay marketplace.
5.2 Strategy Pyramid
The following three strategies summarize our implementation process for the upcoming year. Then address in-store retail revenue, expansion to non-fabric revenue sources, and Web-based sales activities.
STRATEGY #1 – Generate revenue through the sale of solid margin decorator fabric in the retail store.
Tactic #1A – Provide in-stock fabric through the on-floor stock of 750 fabrics that the customer can touch, feel, and buy on the spot.
Program #1A-1 – Floor displays that enable customers to better imagine the fabric in their home.
Tactic #1B – Offer special order fabric that will provide something unique for each customer.
Program #1B-1 – Classes to provide the skills for people to fabricate their own products, including duvettes, pillows, slipcovers, draperies and other “fabric demanding” projects.
Program #1B-2 – Offer sales and other promotional events that will encourage customers to buy on a spontaneous basis and/or motivate them to begin that overdue project.
STRATEGY #2 – Generate sales revenues through related non-fabric sales.
Tactic #2A – Promotion of “Oval Office Iron” product line
Program #2A-1 – Newsletter sales, class, and demonstration promotions
Program #2A-2 – Cross selling activates with drapery fabric purchases
Tactic #2B – Promotion of “The Window Seat” products that complement fabric sales
Program #2B-1 – Displays that complement in-stock fabric to promote the higher dollar sales transactions of both.
Program #2B-2 – Newsletter sales, class, and demonstration promotions.
Tactic #2C – Promotion of consignment-based sales
Program #2C-1 – Leverage these items to better display fabric and home accessories
Program #2C-2 – Use the newsletter and website to promote sales, class, and demonstration promotions.
STRATEGY #3 – Generate revenue through our home website and eBay store from customers outside the reach of the retail store.
Tactic #3A – Better facilitate and communicate the fabric and other inventory the store has to offer on the Web.
Program #3A-1 – Redesign website www.fabric-online.com.
Program #3A-2 – Establish our eBay store.
Program #3A-3 – Tighter integration of Web-based activities into the daily routine of store personnel.
Tactic #3B – Monthly assessment of performance of email inquiries and revenue generation
Program #3B-1 – Establish goals of the program.
Program #3B-2 – Evaluate the total dollar sales as well as sales by product category.
5.3 Value Proposition
Interior Views offers the highest quality decorator fabric for the home conveniently available for immediate purchase or on a special order basis. The store also offers a selection of antiques, home accessories, and complementary products. Interior Views is unique in that it offers customers the chance to be creative and customize the interior of their home, or they have the option of working with experienced professionals who will guide them through the process. Either way they get everything they need to create their perfect home.
5.4 Competitive Edge
Interior View’s website will be recognized due to it’s quality products and excellent support. This competitive edge leverages the same proven factors that have resulted in the success of the storefront experience. These same characteristics will be evident on the website. E-commerce sales will be routed by direct links from our home website to our eBay store.
5.5 Marketing Strategy
Our marketing strategy is based on becoming the resource for people looking for decorator fabrics and home accessories. The “do-it-yourself” and the “buy-it-yourself” customers will find resources to decorate their homes at a place that is inspiring, inviting, and motivating. Our marketing strategy is based on superior performance in the following areas:
- Product selection
- Product quality
- Customer service
Our marketing strategy will create awareness, interest, and appeal from our target market for what we offer our customers. This will be executed in a manner that will entice them to come back for repeat purchases and encourage them to refer additional customers to the store and to our website and eBay store.
5.5.1 Promotion Strategy
The most successful advertising and promotional activities have been the following:
- Newspaper Advertisements – Pleasantville Herald.
- Television Advertisements – “Martha Stewart” and “Interior Motives” television shows on a local promotional basis.
- Quarterly Newsletter and Postcard – A direct mail, 4-page newsletter distributed to the customer mailing list generated from people completing the sign up in the store. The mailing list now totals more than 4,300 people. Newsletter will now also be delivered by email and be available on our website.
- In Store Classes – “How to” classes, most of which are free, have been successful because of the traffic and sales they generate after the class. They are typically 90 minutes in length and held on Saturday, the most popular classes are:
- “Pillow Talk” – Pillow fabrication.
- “Speaking of Slip Covers” – Slip cover presentation and discussion.
- “Shades of the Season” – Window treatment options with fabric.
- Website – Traffic interest from www.fabric-online.com, to and from our eBay store.
5.5.2 Distribution Strategy
The primary source of distribution is through traditional retail channel. On a secondary basis, we will be building revenue generation through our home website and linked eBay store .
5.5.3 Marketing Programs
The single objective is to position Interior Views as the premier source for home decorator fabrics in the Greater Pleasantville area, commanding a majority of the market share within three years. The marketing strategy will seek to first create customer awareness regarding the products and services offered, develop that customer base, establish connections with targeted markets, and work toward building customer loyalty and referrals.
The four main marketing strategies for Interior Views are:
- Increased awareness and image.
- Leveraging existing customer base.
- Cross selling.
- New home construction promotion.
The strategies will be implemented through the following marketing tactics and programs.
Strategy #1
INCREASED AWARENESS and IMAGE – Informing those not yet aware of what Interior Views offers.
- Advertising
- Martha Stewart
- Interior Motives
- Website and eBay search engine optimization
- Referral Generation
- Realtor “open house” promotions
- Complementary vendor referrals
- Imperial Floors.
- Upholstery resources.
- “Design Time” Interior Design.
- 27th Street Fabrics.
- “Tell a friend” email link on website
- Organization Relationships
- Co-sponsorships of fund raising activities
- Hosting events
- Luncheons.
- Teas.
- Evening events.
Strategy #2
LEVERAGING EXISTING CUSTOMER BASE – Our best sales in the future will come from our current customer base.
- Newsletter and E-newsletter
- Sales promotions
- Classes
- Events
- Customer Service and Relationships
- Exceptional customer service in the store
- Follow up contact
- Personal shopper support
- Expeditious fulfillment of eBay store orders.
- Additional Experiences
- Classes
- Demonstrations
- Downloadable online information and patterns
Strategy #3
CROSS SELLING – Increasing the average dollar amount per transaction.
- Internal
- Additional sales of trims, notions, and accessories
- Promoting sales of furniture; Chameleon and Scottie Mac lines
- Sub-Lease Sales
- Antiques through “Antique Bureau”
- Accessories through “The Window Seat”
- Online Sales
- “People who bought this fabric also bought this …” suggestions with online sales
Strategy #4
NEW HOME CONSTRUCTION PROMOTION – Connecting with people involved in the building process.
- Connecting with “Suppliers”
- Realtors gift certificate program
- Builders design support services
- Loan Officers gift certificate program
- Connecting with “Customers”
- Subscription and use of “newcomers” report
- Chamber of Commerce new members update
5.5.4 Positioning Statement
For the person who seeks to create a personalized and unique impression of his home, Interior Views is the source for selection and price for decorator fabric, customer-oriented design services, and a variety of other home accessories and furniture products. Customers will be impressed with, and return for, the great in-stock selection, special order options, value-oriented pricing, and excellent customer service.
Interior Views is a pleasant and tasteful resource for people in the process of remodeling the home. Instead of employing an interior decorator, Interior Views allows the customer to participate in individual design choices, and realize greater value for the dollars invested.
5.5.5 Pricing Strategy
Product pricing is based on offering high value to our customers compared with most price points in the market. Value is based on the best quality available, convenience, and timeliness in acquiring the product. We will consistently be below price points offered through interior designers and consistently above prices offered through the warehouse/seconds retail stores. Interior Views will also provide better quality and selection than the latter.
5.6 Sales Strategy
Our wide array of products enable customers to gather ideas and options, and accomplish their decorating goals. The assistance of the staff in person, on the phone, and through email will complement all aspects of this experience. The customer will have all of the resources, support and guidance they need to create a look that is truly unique to their home. They will not be able to do this in the same way through any other resource.
Online Sales Strategy
The online strategy support the objective to position Interior Views and its eBay store as a preferred source for home decorator fabrics on the Internet as we maintain the position of being considered the premier source in the geographic area of the store. The online sales strategy seeks to first, inform visitors about the Interior Views homesite, and create a positive awareness regarding the product offered; second, provide successful purchasing experiences through the direct click-through to our eBay store, and establish connections with targeted markets; and third, work toward building customer loyalty and referrals.
The online sales approach will accomplish these four objectives:
- Increased overall awareness and image
- Meet the online interests and needs of the existing customer base.
- Expand the total out-of-area customer population.
- Exploit upsell and cross-sell opportunities.
Strategy #1 – Increasing Awareness and Image – Informing those not yet aware of what Interior Views offers.
- Search engine presence.
- Leveraging the newsletter, e-newsletter and mailing programs.
Strategy #2 – Leveraging Existing Internet-Savvy Customers – Our best sales in the future will come from our current customer base.
- Newsletter information.
- Web-only promotions.
Strategy #3 – Upselling and Cross-selling Activities – Increasing the average dollar amount per transaction.
- Additional and complementary fabric.
- Additional sales of trims, notions, and accessories,
- Promoting sales of decor items.
5.6.1 Sales Programs
In brief, our marketing mix is comprised of these approaches to pricing, distribution, advertising and promotion, and customer service.
Pricing — A keystone pricing formula plus $3.00 will be applied for most fabrics. The goal is to have price points within 5% of the list price of Calico Corners’ retail prices. This insures competitive pricing and strong margins.
Distribution — All products are distributed through the retail store. The store does receive phone orders from established customers and we will be developing a website.
Advertising and Promotion — The most successful advertising has been through the Pleasantville Herald and through ads on “Martha Stewart” and “Interior Motives” television shows. The quarterly newsletter has also proven to be an excellent method to connect with the existing customer base, now with a mailing list of 4,300 people.
Customer Service — Excellent, personalized, one-of-a-kind customer service is essential. This is perhaps the only attribute that cannot be duplicated by any competitor.
The first goal is to recognize everyone as they come into the store. If they are a repeat customer, they are referred to by name. If they are a new customer, they are asked, “How did you hear about us?” Help is always available and never invasive. The store is staffed to be able to dedicate time and energy to customers who want assistance when they need it. The store is designed so a customer can sit as long as they want to look at books, fabric samples, and review the resources in the store. Their children are also welcome, with a television, VCR, and toys available in the childrens’ area in clear view of the resource center. We provide service in a way that no other competitive retail store can touch. It is one of our greatest assets and points of differentiation. Insight, ideas, inspiration, and fun is the goal. Repeat, high dollar purchases from loyal customers is the desired end product.
5.6.2 Sales Forecast
The Sales Forecast is broken down into four main revenue streams: direct sales, Web sales, consignment sales, and sub-lease revenues. The Sales Forecast for the upcoming year is based on a modest growth rate for direct sales. This is a slower growth rate than what was experienced in previous years, but above the non-existent growth of last year. In spite of the economic unpredictability we are experiencing, these projections appear attainable and take the increasing base into consideration.
Online Sales Forecast
The online sales forecast is conservatively projecting a slow and steady increase in eBay store sales. This approach is intended to realistically project sales to:
- An existing retail target market that has been slow to consider the Internet a viable method for shopping for fabric for their home.
- Become know to the Internet and eBay savvy e-purchasers as a source for quality home decorating fabrics.
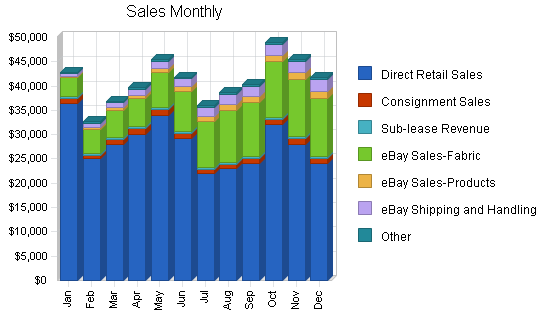

| Sales Forecast | |||
| 2005 | 2006 | 2007 | |
| Sales | |||
| Direct Retail Sales | $335,600 | $386,400 | $463,700 |
| Consignment Sales | $12,500 | $18,750 | $28,125 |
| Sub-lease Revenue | $5,340 | $5,600 | $6,165 |
| eBay Sales-Fabric | $101,725 | $153,370 | $246,488 |
| eBay Sales-Products | $11,050 | $18,564 | $32,487 |
| eBay Shipping and Handling | $20,070 | $30,908 | $50,576 |
| Other | $4,140 | $0 | $0 |
| Total Sales | $490,425 | $613,592 | $827,541 |
| Direct Cost of Sales | 2005 | 2006 | 2007 |
| Direct Retail Sales | $151,020 | $168,500 | $170,250 |
| Consignment Sales | $375 | $480 | $520 |
| Sub-lease Revenue | $0 | $0 | $0 |
| eBay Sales-Fabric | $50,866 | $76,685 | $123,244 |
| eBay Sales-Products | $5,548 | $9,282 | $16,244 |
| Shipping and Handling | $15,055 | $23,181 | $37,932 |
| Other | $2,070 | $4,000 | $4,250 |
| Subtotal Direct Cost of Sales | $224,934 | $282,128 | $352,440 |
5.7 Strategic Alliances
Interior Views does have some dynamic alliances. A retail store called “27th Street Fabric” focuses on “dress fabric” and refers customers on a regular basis. There is also a beneficial relationship with “Interior Fabricators” in Lake Oswego, Oregon and this establishment shares inventory purchases to reduce costs for both stores and/or to split minimum order bolts to make the larger quantity purchases more affordable for each.
Strategic Internet Alliances
Our use of the eBay marketplace is a major plus for us. It gives Interior Views access to the online retail channel without having the high start-up expenses of site design, store administration, financial setup, and security programs for a self-run and hosted retail site.
We can optimize moderate expenses in renovating our existing website, and through the use of direct click-through links do all our selling through the established and secure eBay marketplace and PayPal billing systems, while incurring accpetable fees.
Other strategic online alliances do not exist at this time. Opportunities do exist with other retailers, including expanding the established relationship with “Interior Fabricators” to include online activities. This will be an area of concentrated development for the future.
5.8 Milestones
The milestone chart below is accompanied by table which outlines key activities that will be critical to our success in the coming year.

| Milestones | |||||
| Milestone | Start Date | End Date | Budget | Manager | Department |
| Year Buying Program | 2-Jan | 30-Jan | $560 | Judy | Management |
| Initial Website Layout | 1-Feb | 15-Feb | $1,850 | Doug | Owner |
| Establish eBay/PayPal Accounts | 1-Feb | 15-Feb | $300 | Judy | Consultant |
| Spring Store Set Up | 2-Feb | 15-Feb | $225 | Julie | Management |
| Initial eBay Site Design | 15-Feb | 28-Feb | $1,000 | Doug | Owner |
| Class Schedule | 1-Mar | 1-Apr | $45 | Cherly/Kandi | Customer Sup. |
| Fabric Selection for eBay Store | 1-Mar | 30-Mar | $0 | Judy | Management |
| Product Selection for eBay Store | 15-Mar | 30-Mar | $0 | Julie | Sales |
| Marketing Schedule | 15-Mar | 30-Apr | $0 | Doug | Marketing |
| Search Engine Work | 15-Apr | 30-Apr | $550 | James | Consultant |
| Test Home and eBay Sites | 1-Mar | 30-Apr | $0 | Staff | All |
| Summer Store Set Up | 1-May | 15-May | $225 | Julie | Management |
| Launch Sites | 1-May | 2-May | $1,200 | James | Consultant |
| Follow-up and Feedback | 2-May | 30-May | $0 | Doug/Staff | All |
| Class Schedule | 1-Jun | 15-Jun | $45 | Cherly/Kandi | Customer Sup. |
| Fall Store Set Up | 15-Aug | 30-Aug | $250 | Julie | Customer Sup. |
| Class Schedule | 1-Sep | 15-Sep | $50 | Cherly/Kandi | Customer Sup. |
| Winter Store Set Up | 1-Oct | 15-Oct | $250 | Julie | Management |
| Class Schedule | 1-Nov | 15-Nov | $50 | Cherly/Kandi | Customer Sup. |
| Year End Evaluation | 20-Dec | 31-Dec | $0 | Judy | Management |
| Totals | $6,600 | ||||
Web Plan Summary
Interior Views plans to increase overall sales revenues by entering the Internet retail channel through a store presence on eBay.com. The following topics discuss the e-tail market trends, our strategies for this channel, and the development requirements and planning for our home site and eBay store.
6.1 Website Marketing Strategy
Our website strategy will be to reach these key groups listed in order of importance based on their expected use and purchases from the site.
- Professional Youngsters – Expected to be the most likely of the targeted segments to use this resource because of their relatively high Internet use compared to the other segments. This group should offer the greatest online revenue opportunity.
- Outsiders – Comprised of people outside the area with Internet access that have come in contact with the physical store or learned of it though a referral or promotion. This group, most commonly located in rural areas of the Western U.S. and Hawaii, are expected to be a small but faithful sector of buyers.
- Online Fabric Shoppers – Most often find the site through search engines and these online decorator fabric shoppers are browsing multiple sites for a best buy or access to discontinued and hard-to-find fabric. They hold potential, but are typically the most work for the lowest return.
- Internet Learners – Represents all of the targeted segments that are just beginning to become familiar with the site and will increase their use of the Internet over time. Revenue expectations from this group are low at this point and it is viewed as an investment in the future.
6.1.1 Website Demographic Strategy
The target group of the site is divided up into four primary groups listed in order of importance and expected use of the site.
- The “Professional Youngsters” are expected to be the most likely of the targeted segments to use this resource because of their relatively high Internet use compared to the other segments. This group should offer the greatest online revenue opportunity.
- The “Outsiders” are comprised of people outside the area with Internet access that have come in contact with the physical store or learned of it though a referral or promotion. This group, most commonly located in rural areas of the Western U.S. and Hawaii, are expected to be a small but faithful sector of buyers.
- The “Online Fabric Shoppers” most often find the site through search engines, and these online decorator fabric shoppers are browsing multiple sites for a best buy or access to discontinued or hard-to-find fabric. They hold potential, but are typically the most work for the lowest return.
- The “Internet Learners” represents all of the targeted segments that are just beginning to become familiar with the site and will increase their use of the Internet over time. Revenue expectations from this group are low at this point and it is viewed as an investment in the future.
Each of these groups possess these demographic, psychographic, and behavior characteristics.
Website Demographics
- Female.
- Married.
- Have children, but not necessarily at home.
- Have attended college.
- A combined annual income in excess of $50,000.
- Age range of 35 to 55 years, with a median age of 42.
- Owns their home, townhouse and/or condominium valued at over $125,000.
- If they work out of the home, it’s by choice in a professional/business setting.
- Belong to one or more business, social and/or athletic organizations.
Website Psychographics
- The appearance of her home is a priority and entertaining and showing her home is important.
- She perceives herself as creative, tasteful and able, but seeks validation and support regarding her decorating ideas and choices.
- In addition to using the Internet to gather design, decorating and pricing information, she also reads the same publications as the retail shopper.
Website Behaviors
- She takes pride in having an active role in decorating her home.
- Her home is a form of communicating “who she is” to others.
- Comparisons within social groups are made on an ongoing basis, but rarely discussed.
- Considers the Web to be a more convenient information gathering resource and potential shopping alternative.
6.1.2 Web Market Needs
Like all customers, the people that will visit the site are looking for the opportunity to create a home environment to express who they are. They have the choice to select their fabric and go whatever direction they choose–to fabricate it themselves or have it done for them. They have the opportunity to actively participate in the design, look, and feel of their home. They desire their home to be personal, unique, and tasteful as well as communicate a message about what is important to them. Interior Views’ website seeks to fulfill the following benefits that we know are important to our customers.
- Selection – A wide choice of current and tasteful decorator fabrics with the convenience of online shopping.
- Accessibility – The buyer can visit the site and view the most popular fabrics from a vast array of suppliers. They can also communicate with the store through email or phone, to have access to additional assistance after reviewing the information on the site.
- Competitive Pricing – All products will be competitively priced in comparison to retail stores and other channels of distribution including catalog and Web sales.
6.1.3 Web Market Trends
The following trends and issues impact the success of Interior Views.
- National Economic Health – The store does better when the country experiences “good times” regardless of its direct impact on the local economy. The volatility in the stock market correlates with changes in sales.
- New Home Construction Activity – More closely related to what is taking place in our local economy, new home construction has a significant impact on sales across all product lines.
- Shifts in Design Trends – Major changes in design trends increase sales. The Pleasantville market lags behind metropolitan design trends by 6 to 12 months. This offers a buying advantage for the store.
The home textile market, considered to include sheets, towels, draperies, carpets, blankets, and upholstery, accounts for 37% of all textile output. The trade publication “Home Textiles Today” estimates the size of the U.S. home textiles market at the wholesale level, excluding carpets, to be between $6.5 billion to $7 billion annually. The industry is expected to realize a steady increase over the next few years.
The industry is driven by the number of “household formations” which is expected to continue through the first years of the new millennium. This is primarily due to the solid growth in the number of single-parent and non-family households. This growth also comes from baby boomers needing bigger houses to accommodate growing and extended families and, as people get older, they are buying homes rather than renting to realize tax and equity building benefits. Favorable mortgage rates will also enable others to invest in their existing home through refinancing.
The “do-it-yourself” (DIY) market continues to grow and closely parallels the professional home-improvement market. DIY market growth is attributed to an increased presence of products, the personal satisfaction experienced, and the cost savings customers realize. A portion of the do-it-yourself market is the “buy-it-yourself” (BIY) market. Consumers are buying the product and arranging for someone else to do the fabrication and/or installation. This is more expensive then the do-it-yourself approach, but less costly than buying finished products from other sources. It also provides similar feelings of creativity, pride, and individuality associated with direct creative involvement. This sense of “participation” in home decorating is an important factor for many of these committed customers.
Interior Views’ website will seek to benefit from meeting the needs that these trends create.
6.1.4 Web Market Growth
American Demographics projects the number of U.S. households will grow by 16% to 115 million by the year 2010. Almost half of the households comprised of people from 35 to 44 years old are married couples with children under the age of 18. Based on this research, households in the 45 to 65 age range will grow to 45 million in 2010 as baby boomers add to this peak-earning and spending age group. This families will either build new homes or move into existing dwellings. With approximately 46.2% of the nation’s 93.3 million dwellings built before 1960, many of these homeowners are also expected to update.
One important factor is that married couples in the 35 to 65 age range represent a growth segment and enjoy larger incomes than other family structures. They enjoy the choice to spend their disposable income on life’s amenities. They may demonstrate “cocooning” by making their home a more comfortable and attractive haven. They choose to spend resources here rather than on vacations and other discretionary options. This group represents a larger subsegment of the target market.
These factors contribute to an increased need for home decorator fabrics for window treatment, upholstery, pillows, bedding, and other fabric accessory needs. This demand is expected to be complemented by the growth in the Boise market. The majority of homeowners spend a large percentage of their disposable income on home goods within two years after buying a new house. Therefore, positive trends in new housing activity represents growth and opportunity for home textiles.
Recent slow downs in the local economy have resulted in falling below sales projections and these factors will affect market growth. Adding additional revenues through the website will hopefully add a more stable factor in to the revenue stream.
6.2 Development Requirements
We have determined the general look and navigation of the existing site revamp. We still have to accomplish the following tasks:
- Choose fabric and other product selections for site;
- Establish eBay and PayPal accounts;
- Purchase and install new hardware and software to facilitate sales fulfillment, shipping;
- Establish database of online customers, complete with Sarbanes-Oxley security protocol compliance;
- Prepare eBay store product pages and establish direct click through links between our home page catalog and the eBay products pages.
6.2.1 Front End
We currently have the basic elements of the site in place at www.interiorviews_fabrics.com. It possesses some of the functional components that we want to keep including:
- A URL that is not ideal, but tolerable.
- Identifiable home page.
- The ability to select and view the most popular fabrics.
- Newsletter access.
- Contact information.
A site redesign is desperately needed to attract additional traffic, support easier and quicker navigation, and hopefully result in increased sales. We are not satisfied with these components of the site:
- Graphic design characteristics – the look and feel of the site is dated and “amateurish.”
- Speed – the site is slow in areas where we can speed the process.
- Basic navigation through the site – a consistent method to move throughout the site.
- The addition of other products and select home accessories.
- General information about our eBay store.
- Direct click-through links to individual products on the eBay store sites
6.2.2 Back End
Our back-end features should include the following:
- Web hosting with 98% uptime through the local provider.
- Web Analytic statistics to determine page views, unique users, banner impressions, sponsorship impressions and clickthroughs.
- The ability to enable visitors to gain easy access to product information, visuals, newsletter information, and a robust email system.
- The full establishment of the eBay store.
- Compliance with Sarbanes-Oxley security protocols to protect customer database information.
6.2.3 Resource Requirements
The site has been, and will continue to be, supported through a local Internet provider and the consultant that we have been working with. We have found that experience to be relatively economical and he has been highly responsive to our need. Employees do not have the expertise to do much more than respond to emails and check the status of the site, so this has been a good complement to what time and resource limitations impose.
The monthly budget, including Internet access, is $65.00 in addition to hourly consulting rates for redesign work and fabric scanning.
Additional hardware and software will be purchased to handle fulfillment, shipping, inventory, and the customer database.
Start-up expenses for site revamp, eBay store, equipment and software have been budgeted at $10,000.
6.2.4 Future Development
The objectives of the site redesign will include:
- Increased speed.
- Enhanced navigation.
- Additional products added to the decorator fabric selections including “Oval Office Iron” hardware and select home accessories.
This is Interior Views’ first foray into e-commerce. The eBay marketplace offers us an excellent venue to test waters so-to-speak, with relatively little investment. If, after a couple years experience we can project a reasonable return, we will invest in another site renovation and bring our entire online store operation in-house.
6.3 Business Model
Our website and eBay store will generate revenue through initiating product sales to the targeted audience that we would not have realized through the retail store. It will be measured on the basis of revenue generated each month compared to our stated objective. On a secondary basis, we will also measure and track traffic to the site and document what activities that traffic contributes to the other objectives of the site, including sales leads and information dissemination.
6.4 Site Positioning
Our website and eBay store will generate revenue through initiating product sales to the targeted audience that we would not have realized through the retail store. It will be measured on the basis of revenue generated each month compared to our stated objective. On a secondary basis, we will also measure and track traffic to the site and document what activities that traffic contributes to the other objectives of the site, including sales leads and information dissemination.
Management Summary
Judy Williams oversees all store operations. This includes buying, financial dealings, merchandising, and interfacing with the bookkeeper and the CPA. She delegates marketing and in-store construction projects to Doug Williams. Julie is taking on more of a management role and the goal is to increase her responsibilities. Solid job descriptions and direction applies to the other positions, all of which are part-time, approximately 20 hours each week.
7.1 Organizational Structure
The organizational structure is simple. Judy manages all employees and professional contacts, as well as interfacing with more than 12 account executives/vendors. She determines staffing requirements, assigns and delegates responsibilities, and reviews employee performance on an annual basis.
7.2 Management Team
Judy Williams, the owner, is responsible for all managerial functions within the organization. She also oversees all buying activities. Judy delegates responsibilities to Julie Hanson to assist with television advertising. Julie and the other staff members are also responsible for at least one special event throughout the year. Doug takes on all marketing efforts including creation of the newsletter, placing television ads, store signage, and coordinating public relations activities.
7.3 Management Team Gaps
The team is working well at this point. It has reached a balance between covering the necessary bases within the limitations that the payroll budget imposes. The long term goal is to have Julie take on increasing responsibilities and enable more freedom for Judy.
7.4 Personnel Plan
The personnel plan consists of Judy’s schedule complemented by four part-time positions. Julie (24 hours per week), Kandi (20 hours per week), Cheryl (18 hours per week) and Pharis (32 hours per week) fill the six-day work week. The goal is to continue to control payroll expenses through efficient use of the staff and provide a quality customer-oriented focus in the store.
The revamp of the website and addition of the eBay store will present a new layer of challenges to the existing staff. The people involved will need to go through training to become familiar with their roles, and the existing consultant, Jim Franns, will play a key role in establishing the new website, and providing ongoing support as needed.
The following outlines the general roles and activities the consultant and staff will support:
- Jim – Site design, configuration.
- Doug – Implementation of online marketing strategy.
- Robin – Bookkeeping and monitoring sales activities.
- Pharis – Sales fulfillment.
All these folks, aside from Jim, divide their time between the retail store and the eBay store. If sales increase at the rate hoped, we will look at hiring an eBay fulfillment employee.
Jim Franns is a consultant, and his expenses appear in the P&L table.
| Personnel Plan | |||
| 2005 | 2006 | 2007 | |
| Production Personnel | |||
| Pharis – Sales Fulfillment | $3,360 | $3,500 | $3,700 |
| eBay Shipper – Sales Fulfillment | $9,321 | $11,186 | $13,423 |
| Name or Title | $0 | $0 | $0 |
| Other | $0 | $0 | $0 |
| Subtotal | $12,681 | $14,686 | $17,123 |
| Sales and Marketing Personnel | |||
| Kandi – Design Consultant | $7,560 | $8,164 | $8,820 |
| Cheryl – Design Consultant | $7,200 | $7,775 | $8,400 |
| Pharis – Design Consultant | $3,120 | $3,370 | $3,640 |
| Doug – Online Marketing Implementation | $2,650 | $3,360 | $4,032 |
| Other | $0 | $0 | $0 |
| Subtotal | $20,530 | $22,669 | $24,892 |
| General and Administrative Personnel | |||
| Judy – Owner (Draw against LLC) | $24,000 | $24,000 | $24,000 |
| Julie – Manager | $10,400 | $11,330 | $12,200 |
| Robin – Bookkeeper | $1,440 | $1,550 | $1,680 |
| Other | $0 | $0 | $0 |
| Subtotal | $35,840 | $36,880 | $37,880 |
| Other Personnel | |||
| Name or title | $0 | $0 | $0 |
| Name or title | $0 | $0 | $0 |
| Name or title | $0 | $0 | $0 |
| Other | $0 | $0 | $0 |
| Subtotal | $0 | $0 | $0 |
| Total People | 8 | 8 | 8 |
| Total Payroll | $69,051 | $74,235 | $79,895 |
Financial Plan
This section offers a financial overview of Interior Views eBay store, our website and online marketing activities. We will address break-even information, sales forecasts, expense forecasts, and how those link to our marketing strategy. We do not have enough data to make seasonal adjustment in sales revenues at this point and we expect that the growth in sales will mitigate seasonal trends. eBay has become a mainstream retail channel, and because of its 24/365 availability, product lines which were once seasonal have become viable 12 month sellers. As our eBay store becomes established and know we expect to see our online sales grow consistently, without severe high or low spikes. This is an area that we will watch as we gather additional data, customer feedback, and experience.
The financial plan contains these essential factors:
- A modest growth rate in sales for Year 1, and a commensurate increase in total revenues.
- Positive sales for all 365 business days per year.
- Reduce the existing credit line substantially.
<p Difficulties and Risks
- Slow sales resulting in less-than-projected cash flow.
- Unexpected cost increases compared with the forecasted sales.
- Overly aggressive and debilitating actions by competitors.
- A parallel entry by a new competitor.
Worst case risks might include:
- Determining the business cannot support itself on an ongoing basis.
- Having to liquidate the inventory to pay back the bank loan.
- Locating a tenant to occupy the leased space for the duration of the five year lease (January of 2006).
- Losing the assets of the investors used for collateral.
- Dealing with the financial, business, and personal devastation of the store’s failure.
8.1 Important Assumptions
The following critical assumptions will determine the potential for future success.
- A healthy economy that supports a moderate level of growth in our market.
- The ability to support a healthy gross margin percentage.
- Keeping operating costs low, particularly in the areas of personnel and ongoing monthly expenses.
- Making wise purchases that keeps inventory at an attractive level with a high turn rate.
| General Assumptions | |||
| 2005 | 2006 | 2007 | |
| Plan Month | 1 | 2 | 3 |
| Current Interest Rate | 9.50% | 9.50% | 9.50% |
| Long-term Interest Rate | 8.50% | 8.50% | 8.50% |
| Tax Rate | 28.17% | 28.00% | 28.17% |
| Other | 0 | 0 | 0 |
8.2 Key Financial Indicators
Marketing expenses are to be budgeted at approximately 5% of total sales. Expenses are tracked in the major marketing categories of television advertisements, newspaper advertisements, the newsletter and postcard mailings, Web marketing support, printed promotional materials, public relations, and other.

8.3 Break-even Analysis
The Break-even Analysis below illustrates the amount of sales that we must realize to break even. This is based on the average sale and costs per transaction.

| Break-even Analysis | |
| Monthly Revenue Break-even | $21,130 |
| Assumptions: | |
| Average Percent Variable Cost | 46% |
| Estimated Monthly Fixed Cost | $11,439 |
8.4 Projected Profit and Loss
The following represents the Projected Profit and Loss for Interior Views based on sales and expense projections for Year 1 and beyond. We are anticipating that we will need to add investment into the business in January to address cash flow concerns.
The P&L table lists the expenses we anticipate in establishing our eBay presence and store. Legal expenses will cover our initial fees with eBay, PayPal, and our business bank, and any other legal requirements, such as establishing compliance with Sarbanes-Oxley legislation.
Website development costs cover both our eBay site design as well as a freshening of our existing informational website.
In anticipation of significant sales activity we have decided to purchase additional computer hardware which will be dedicated to eBay sales fulfillment, customer database, shipping, etc.
A portion of Doug’s time will be spent doing the ramp-up marketing for the eBay store, and subsequent online marketing efforts. We want to track this carefully so we are adding those expenses in here, and ongoing expenses in the P & L table.
Fulfillment of all products sold will come from the overall Interior Views inventory. For accounting purposes, value for products sold on line will be transferred from the the main store. For planning purposes, start-up inventory value will equal two times anticipated Month 1 sales.


| Pro Forma Profit and Loss | |||
| 2005 | 2006 | 2007 | |
| Sales | $490,425 | $613,592 | $827,541 |
| Direct Cost of Sales | $224,934 | $282,128 | $352,440 |
| Production Payroll | $12,681 | $14,686 | $17,123 |
| Final Value Fees | $10,626 | $16,227 | $26,364 |
| Item Fees | $5,313 | $8,114 | $13,182 |
| PayPal Fees | $3,851 | $5,882 | $9,557 |
| Other | $6,000 | $6,600 | $7,200 |
| Total Cost of Sales | $263,405 | $333,637 | $425,866 |
| Gross Margin | $227,020 | $279,955 | $401,675 |
| Gross Margin % | 46.29% | 45.63% | 48.54% |
| Operating Expenses | |||
| Sales and Marketing Expenses | |||
| Sales and Marketing Payroll | $20,530 | $22,669 | $24,892 |
| Advertising/Promotion | $12,300 | $15,500 | $22,000 |
| Travel | $3,050 | $3,500 | $4,000 |
| Online Ramp-up Marketing | $2,000 | $0 | $0 |
| eBay Promotion | $1,700 | $2,000 | $2,000 |
| Miscellaneous | $3,120 | $3,300 | $3,550 |
| Total Sales and Marketing Expenses | $42,700 | $46,969 | $56,442 |
| Sales and Marketing % | 8.71% | 7.65% | 6.82% |
| General and Administrative Expenses | |||
| General and Administrative Payroll | $35,840 | $36,880 | $37,880 |
| Sales and Marketing and Other Expenses | $0 | $0 | $0 |
| Depreciation | $2,150 | $3,000 | $3,000 |
| eBay Store Fees | $600 | $700 | $800 |
| Internet Access/Wesite Hosting | $780 | $900 | $1,200 |
| Leased Equipment | $0 | $0 | $0 |
| Utilities | $2,705 | $3,000 | $3,175 |
| Insurance | $2,544 | $2,750 | $3,000 |
| Rent | $34,176 | $35,400 | $37,680 |
| Payroll Taxes | $8,058 | $8,428 | $8,811 |
| Legal Fees for eBay Store Start-up | $1,500 | $0 | $0 |
| Other General and Administrative Expenses | $0 | $0 | $0 |
| Total General and Administrative Expenses | $88,353 | $91,058 | $95,546 |
| General and Administrative % | 18.02% | 14.84% | 11.55% |
| Other Expenses: | |||
| Other Payroll | $0 | $0 | $0 |
| Consultants – Website Design | $5,000 | $3,000 | $3,000 |
| Contract/Consultants | $1,212 | $1,380 | $1,500 |
| Total Other Expenses | $6,212 | $4,380 | $4,500 |
| Other % | 1.27% | 0.71% | 0.54% |
| Total Operating Expenses | $137,265 | $142,407 | $156,488 |
| Profit Before Interest and Taxes | $89,755 | $137,548 | $245,187 |
| EBITDA | $91,905 | $140,548 | $248,187 |
| Interest Expense | $2,407 | $2,201 | $1,251 |
| Taxes Incurred | $24,636 | $37,897 | $68,709 |
| Net Profit | $62,711 | $97,450 | $175,227 |
| Net Profit/Sales | 12.79% | 15.88% | 21.17% |
8.5 Projected Cash Flow
The cash flow projections are outlined below. Again, these projects are based on our basic assumptions with revenue generation factors carrying the most significant weight regarding the outcome. We are anticipating that we will need to add investment into the business in January to address cash flow concerns.
As planned, our eBay store should bring in adequate revenue to cover its own expenses and bring a net increase of revenue into Interior Views. Cash flow and cash balance appear to be comfortably adequate. We have planned conservatively. However, other companies have seen tremendous growth in sales through the eBay store retail channel, and other Internet direct sales channels.
If our sales do indeed skyrocket, Interior Views will certainly need to increase inventory purchases, site maintenance, personnel, and perhaps facilities space and computer hardware.
All of this impacts expenses and cash flow/cash balance. Interior Views would then have to borrow against its bank line of credit or take out business loans to until the revenue from cash receivables/PayPal begin to flow into the company. Such borrowing would be included in the eBay store business plan and accounting records. It may be that if the growth is fast, but smoothly incremental, we will be able to accomplish the growth with the projected cash flow.
We are purchasing $7,500 of new computer hardware and upgrades to support the renovation of our website and establishment of our eBay store.

| Pro Forma Cash Flow | |||
| 2005 | 2006 | 2007 | |
| Cash Received | |||
| Cash from Operations | |||
| Cash Sales | $490,425 | $613,592 | $827,541 |
| Subtotal Cash from Operations | $490,425 | $613,592 | $827,541 |
| Additional Cash Received | |||
| Sales Tax, VAT, HST/GST Received | $0 | $0 | $0 |
| New Current Borrowing | $14,568 | $0 | $0 |
| New Other Liabilities (interest-free) | $1,224 | $0 | $0 |
| New Long-term Liabilities | $0 | $0 | $0 |
| Sales of Other Current Assets | $0 | $0 | $0 |
| Sales of Long-term Assets | $0 | $0 | $0 |
| New Investment Received | $59,000 | $0 | $0 |
| Subtotal Cash Received | $565,217 | $613,592 | $827,541 |
| Expenditures | 2005 | 2006 | 2007 |
| Expenditures from Operations | |||
| Cash Spending | $69,051 | $74,235 | $79,895 |
| Bill Payments | $206,171 | $435,263 | $564,703 |
| Subtotal Spent on Operations | $275,222 | $509,498 | $644,598 |
| Additional Cash Spent | |||
| Sales Tax, VAT, HST/GST Paid Out | $0 | $0 | $0 |
| Principal Repayment of Current Borrowing | $8,400 | $10,000 | $10,000 |
| Other Liabilities Principal Repayment | $0 | $0 | $0 |
| Long-term Liabilities Principal Repayment | $0 | $0 | $0 |
| Purchase Other Current Assets | $0 | $0 | $0 |
| Purchase Long-term Assets | $7,500 | $3,000 | $3,000 |
| Dividends | $0 | $0 | $0 |
| Subtotal Cash Spent | $291,122 | $522,498 | $657,598 |
| Net Cash Flow | $274,095 | $91,094 | $169,943 |
| Cash Balance | $275,295 | $366,388 | $536,331 |
8.6 Projected Balance Sheet
Interior View’s balance sheet is outlined below.
This initial eBay store plan projects a modest return on the company’s internal investment, with full return in the third year. The cash balance is comfortable, revenue input into the company justifies the entry into this channel.
| Pro Forma Balance Sheet | |||
| 2005 | 2006 | 2007 | |
| Assets | |||
| Current Assets | |||
| Cash | $275,295 | $366,388 | $536,331 |
| Inventory | $19,531 | $24,497 | $30,602 |
| Other Current Assets | $2,300 | $2,300 | $2,300 |
| Total Current Assets | $297,126 | $393,186 | $569,234 |
| Long-term Assets | |||
| Long-term Assets | $11,700 | $14,700 | $17,700 |
| Accumulated Depreciation | $4,200 | $7,200 | $10,200 |
| Total Long-term Assets | $7,500 | $7,500 | $7,500 |
| Total Assets | $304,626 | $400,686 | $576,734 |
| Liabilities and Capital | 2005 | 2006 | 2007 |
| Current Liabilities | |||
| Accounts Payable | $27,872 | $36,483 | $47,303 |
| Current Borrowing | $28,168 | $18,168 | $8,168 |
| Other Current Liabilities | $2,374 | $2,374 | $2,374 |
| Subtotal Current Liabilities | $58,414 | $57,025 | $57,845 |
| Long-term Liabilities | $0 | $0 | $0 |
| Total Liabilities | $58,414 | $57,025 | $57,845 |
| Paid-in Capital | $59,000 | $59,000 | $59,000 |
| Retained Earnings | $124,500 | $187,211 | $284,661 |
| Earnings | $62,711 | $97,450 | $175,227 |
| Total Capital | $246,211 | $343,661 | $518,888 |
| Total Liabilities and Capital | $304,626 | $400,686 | $576,734 |
| Net Worth | $246,211 | $343,661 | $518,888 |
8.7 Business Ratios
Business Ratios for the years of this plan are shown below. Industry profile ratios based on the Standard Industrial Classification (SIC) code 5949, Sewing, Needlework, and Piece Goods, are shown for comparison.
The following will enable us to keep on track. If we fail in any of these areas, we will need to re-evaluate our business model:
- Gross margins at or above 42%.
- Month-to-month annual comparisons indicate an increase of 12% or greater.
- Do not depend on the credit line to meet cash requirements.
- Continue to pay down the credit line at a minimum of $24,000 per year.
| Ratio Analysis | ||||
| 2005 | 2006 | 2007 | Industry Profile | |
| Sales Growth | 69.11% | 25.11% | 34.87% | 5.27% |
| Percent of Total Assets | ||||
| Inventory | 6.41% | 6.11% | 5.31% | 38.70% |
| Other Current Assets | 0.76% | 0.57% | 0.40% | 28.89% |
| Total Current Assets | 97.54% | 98.13% | 98.70% | 90.95% |
| Long-term Assets | 2.46% | 1.87% | 1.30% | 9.05% |
| Total Assets | 100.00% | 100.00% | 100.00% | 100.00% |
| Current Liabilities | 19.18% | 14.23% | 10.03% | 27.10% |
| Long-term Liabilities | 0.00% | 0.00% | 0.00% | 4.25% |
| Total Liabilities | 19.18% | 14.23% | 10.03% | 31.35% |
| Net Worth | 80.82% | 85.77% | 89.97% | 68.65% |
| Percent of Sales | ||||
| Sales | 100.00% | 100.00% | 100.00% | 100.00% |
| Gross Margin | 46.29% | 45.63% | 48.54% | 20.33% |
| Selling, General & Administrative Expenses | 40.69% | 39.47% | 39.16% | 8.95% |
| Advertising Expenses | 3.40% | 3.76% | 4.40% | 1.10% |
| Profit Before Interest and Taxes | 18.30% | 22.42% | 29.63% | 2.03% |
| Main Ratios | ||||
| Current | 5.09 | 6.89 | 9.84 | 2.90 |
| Quick | 4.75 | 6.47 | 9.31 | 1.20 |
| Total Debt to Total Assets | 19.18% | 14.23% | 10.03% | 37.41% |
| Pre-tax Return on Net Worth | 35.48% | 39.38% | 47.01% | 7.94% |
| Pre-tax Return on Assets | 28.67% | 33.78% | 42.30% | 12.69% |
| Additional Ratios | 2005 | 2006 | 2007 | |
| Net Profit Margin | 12.79% | 15.88% | 21.17% | n.a |
| Return on Equity | 25.47% | 28.36% | 33.77% | n.a |
| Activity Ratios | ||||
| Inventory Turnover | 3.96 | 12.82 | 12.79 | n.a |
| Accounts Payable Turnover | 8.11 | 12.17 | 12.17 | n.a |
| Payment Days | 28 | 26 | 27 | n.a |
| Total Asset Turnover | 1.61 | 1.53 | 1.43 | n.a |
| Debt Ratios | ||||
| Debt to Net Worth | 0.24 | 0.17 | 0.11 | n.a |
| Current Liab. to Liab. | 1.00 | 1.00 | 1.00 | n.a |
| Liquidity Ratios | ||||
| Net Working Capital | $238,711 | $336,161 | $511,388 | n.a |
| Interest Coverage | 37.28 | 62.49 | 196.00 | n.a |
| Additional Ratios | ||||
| Assets to Sales | 0.62 | 0.65 | 0.70 | n.a |
| Current Debt/Total Assets | 19% | 14% | 10% | n.a |
| Acid Test | 4.75 | 6.47 | 9.31 | n.a |
| Sales/Net Worth | 1.99 | 1.79 | 1.59 | n.a |
| Dividend Payout | 0.00 | 0.00 | 0.00 | n.a |
8.8 Financial Risks and Contingencies
Difficulties and Risks
- Slow sales resulting in less-than-projected cash flow.
- Unexpected and excessive cost increases compared to the forecasted sales.
- Overly aggressive and debilitating actions by competitors.
- A parallel entry by a new competitor.
- Expansion into e-commerce via eBay store does not realize projected sales.
Worst case risks might include:
- Determining the business cannot support itself on an ongoing basis.
- Having to liquidate the inventory to pay back the bank loan.
- Locating a tenant to occupy the leased space for the duration of the five year lease.
- Losing the assets of the investors used for collateral.
- Dealing with the financial, business, and personal devastation of the store’s failure.
Appendix
| Sales Forecast | |||||||||||||
| Jan | Feb | Mar | Apr | May | Jun | Jul | Aug | Sep | Oct | Nov | Dec | ||
| Sales | |||||||||||||
| Direct Retail Sales | 0% | $36,400 | $25,000 | $28,000 | $30,000 | $34,000 | $29,200 | $22,000 | $23,000 | $24,000 | $32,000 | $28,000 | $24,000 |
| Consignment Sales | 0% | $1,000 | $800 | $1,000 | $1,200 | $1,200 | $1,000 | $900 | $900 | $1,000 | $1,200 | $1,300 | $1,000 |
| Sub-lease Revenue | 0% | $405 | $405 | $525 | $405 | $405 | $525 | $405 | $405 | $525 | $405 | $405 | $525 |
| eBay Sales-Fabric | 0% | $3,900 | $4,875 | $5,525 | $5,850 | $7,150 | $8,125 | $9,425 | $10,725 | $11,050 | $11,375 | $11,700 | $12,025 |
| eBay Sales-Products | 0% | $250 | $375 | $500 | $700 | $875 | $1,000 | $1,075 | $1,125 | $1,200 | $1,250 | $1,325 | $1,375 |
| eBay Shipping and Handling | 0% | $700 | $900 | $1,050 | $1,180 | $1,450 | $1,650 | $1,880 | $2,100 | $2,180 | $2,250 | $2,330 | $2,400 |
| Other | 0% | $240 | $260 | $280 | $300 | $320 | $340 | $360 | $380 | $400 | $420 | $440 | $400 |
| Total Sales | $42,895 | $32,615 | $36,880 | $39,635 | $45,400 | $41,840 | $36,045 | $38,635 | $40,355 | $48,900 | $45,500 | $41,725 | |
| Direct Cost of Sales | Jan | Feb | Mar | Apr | May | Jun | Jul | Aug | Sep | Oct | Nov | Dec | |
| Direct Retail Sales | $16,380 | $11,250 | $12,600 | $13,500 | $15,300 | $13,140 | $9,900 | $10,350 | $10,800 | $14,400 | $12,600 | $10,800 | |
| Consignment Sales | $30 | $24 | $30 | $36 | $36 | $30 | $27 | $27 | $30 | $36 | $39 | $30 | |
| Sub-lease Revenue | $0 | $0 | $0 | $0 | $0 | $0 | $0 | $0 | $0 | $0 | $0 | $0 | |
| eBay Sales-Fabric | $1,950 | $2,438 | $2,763 | $2,925 | $3,575 | $4,063 | $4,713 | $5,363 | $5,525 | $5,688 | $5,850 | $6,013 | |
| eBay Sales-Products | $125 | $188 | $250 | $350 | $438 | $500 | $538 | $563 | $600 | $625 | $683 | $688 | |
| Shipping and Handling | $525 | $675 | $788 | $885 | $1,088 | $1,238 | $1,410 | $1,575 | $1,635 | $1,688 | $1,748 | $1,800 | |
| Other | $120 | $130 | $140 | $150 | $160 | $170 | $180 | $190 | $200 | $210 | $220 | $200 | |
| Subtotal Direct Cost of Sales | $19,130 | $14,705 | $16,571 | $17,846 | $20,597 | $19,141 | $16,768 | $18,068 | $18,790 | $22,647 | $21,140 | $19,531 | |
| General Assumptions | |||||||||||||
| Jan | Feb | Mar | Apr | May | Jun | Jul | Aug | Sep | Oct | Nov | Dec | ||
| Plan Month | 1 | 2 | 3 | 4 | 5 | 6 | 7 | 8 | 9 | 10 | 11 | 12 | |
| Current Interest Rate | 9.50% | 9.50% | 9.50% | 9.50% | 9.50% | 9.50% | 9.50% | 9.50% | 9.50% | 9.50% | 9.50% | 9.50% | |
| Long-term Interest Rate | 8.50% | 8.50% | 8.50% | 8.50% | 8.50% | 8.50% | 8.50% | 8.50% | 8.50% | 8.50% | 8.50% | 8.50% | |
| Tax Rate | 30.00% | 28.00% | 28.00% | 28.00% | 28.00% | 28.00% | 28.00% | 28.00% | 28.00% | 28.00% | 28.00% | 28.00% | |
| Other | 0 | 0 | 0 | 0 | 0 | 0 | 0 | 0 | 0 | 0 | 0 | 0 | |
| Pro Forma Profit and Loss | |||||||||||||
| Jan | Feb | Mar | Apr | May | Jun | Jul | Aug | Sep | Oct | Nov | Dec | ||
| Sales | $42,895 | $32,615 | $36,880 | $39,635 | $45,400 | $41,840 | $36,045 | $38,635 | $40,355 | $48,900 | $45,500 | $41,725 | |
| Direct Cost of Sales | $19,130 | $14,705 | $16,571 | $17,846 | $20,597 | $19,141 | $16,768 | $18,068 | $18,790 | $22,647 | $21,140 | $19,531 | |
| Production Payroll | $260 | $260 | $760 | $1,060 | $1,100 | $1,142 | $1,226 | $1,272 | $1,321 | $1,372 | $1,426 | $1,482 | |
| Final Value Fees | 8.00% | $388 | $492 | $566 | $618 | $758 | $862 | $990 | $1,116 | $1,154 | $1,190 | $1,228 | $1,264 |
| Item Fees | $0.04 | $194 | $246 | $283 | $309 | $379 | $431 | $495 | $558 | $577 | $595 | $614 | $632 |
| PayPal Fees | 2.90% | $141 | $178 | $205 | $224 | $275 | $312 | $359 | $405 | $418 | $431 | $445 | $458 |
| Other | $500 | $500 | $500 | $500 | $500 | $500 | $500 | $500 | $500 | $500 | $500 | $500 | |
| Total Cost of Sales | $20,613 | $16,381 | $18,885 | $20,557 | $23,609 | $22,388 | $20,338 | $21,919 | $22,760 | $26,735 | $25,353 | $23,867 | |
| Gross Margin | $22,282 | $16,234 | $17,995 | $19,078 | $21,791 | $19,452 | $15,707 | $16,716 | $17,595 | $22,165 | $20,147 | $17,858 | |
| Gross Margin % | 51.95% | 49.77% | 48.79% | 48.13% | 48.00% | 46.49% | 43.58% | 43.27% | 43.60% | 45.33% | 44.28% | 42.80% | |
| Operating Expenses | |||||||||||||
| Sales and Marketing Expenses | |||||||||||||
| Sales and Marketing Payroll | $1,690 | $1,690 | $1,790 | $1,840 | $1,690 | $1,690 | $1,690 | $1,690 | $1,690 | $1,690 | $1,690 | $1,690 | |
| Advertising/Promotion | $250 | $2,150 | $750 | $750 | $1,950 | $750 | $750 | $750 | $1,950 | $750 | $750 | $750 | |
| Travel | $0 | $0 | $1,250 | $0 | $0 | $0 | $0 | $0 | $0 | $900 | $800 | $100 | |
| Online Ramp-up Marketing | $1,000 | $1,000 | $0 | $0 | $0 | $0 | $0 | $0 | $0 | $0 | $0 | $0 | |
| eBay Promotion | $100 | $100 | $150 | $200 | $100 | $100 | $100 | $150 | $150 | $200 | $200 | $150 | |
| Miscellaneous | $340 | $220 | $220 | $340 | $220 | $220 | $340 | $220 | $220 | $340 | $220 | $220 | |
| Total Sales and Marketing Expenses | $3,380 | $5,160 | $4,160 | $3,130 | $3,960 | $2,760 | $2,880 | $2,810 | $4,010 | $3,880 | $3,660 | $2,910 | |
| Sales and Marketing % | 7.88% | 15.82% | 11.28% | 7.90% | 8.72% | 6.60% | 7.99% | 7.27% | 9.94% | 7.93% | 8.04% | 6.97% | |
| General and Administrative Expenses | |||||||||||||
| General and Administrative Payroll | $2,960 | $2,920 | $2,980 | $2,980 | $2,980 | $3,020 | $3,020 | $3,020 | $3,000 | $3,000 | $3,000 | $2,960 | |
| Sales and Marketing and Other Expenses | $0 | $0 | $0 | $0 | $0 | $0 | $0 | $0 | $0 | $0 | $0 | $0 | |
| Depreciation | $195 | $195 | $195 | $195 | $195 | $195 | $195 | $195 | $195 | $195 | $195 | $5 | |
| eBay Store Fees | $50 | $50 | $50 | $50 | $50 | $50 | $50 | $50 | $50 | $50 | $50 | $50 | |
| Internet Access/Wesite Hosting | $65 | $65 | $65 | $65 | $65 | $65 | $65 | $65 | $65 | $65 | $65 | $65 | |
| Leased Equipment | $0 | $0 | $0 | $0 | $0 | $0 | $0 | $0 | $0 | $0 | $0 | $0 | |
| Utilities | $240 | $235 | $230 | $225 | $220 | $215 | $215 | $215 | $220 | $225 | $230 | $235 | |
| Insurance | $212 | $212 | $212 | $212 | $212 | $212 | $212 | $212 | $212 | $212 | $212 | $212 | |
| Rent | $2,848 | $2,848 | $2,848 | $2,848 | $2,848 | $2,848 | $2,848 | $2,848 | $2,848 | $2,848 | $2,848 | $2,848 | |
| Payroll Taxes | 15% | $668 | $662 | $671 | $671 | $671 | $677 | $677 | $677 | $674 | $674 | $674 | $668 |
| Legal Fees for eBay Store Start-up | $1,500 | $0 | $0 | $0 | $0 | $0 | $0 | $0 | $0 | $0 | $0 | $0 | |
| Other General and Administrative Expenses | $0 | $0 | $0 | $0 | $0 | $0 | $0 | $0 | $0 | $0 | $0 | $0 | |
| Total General and Administrative Expenses | $8,738 | $7,187 | $7,251 | $7,246 | $7,241 | $7,282 | $7,282 | $7,282 | $7,264 | $7,269 | $7,274 | $7,043 | |
| General and Administrative % | 20.37% | 22.03% | 19.66% | 18.28% | 15.95% | 17.40% | 20.20% | 18.85% | 18.00% | 14.86% | 15.99% | 16.88% | |
| Other Expenses: | |||||||||||||
| Other Payroll | $0 | $0 | $0 | $0 | $0 | $0 | $0 | $0 | $0 | $0 | $0 | $0 | |
| Consultants – Website Design | $1,000 | $1,000 | $500 | $0 | $0 | $1,000 | $0 | $0 | $1,000 | $0 | $0 | $500 | |
| Contract/Consultants | $36 | $36 | $36 | $816 | $36 | $36 | $36 | $36 | $36 | $36 | $36 | $36 | |
| Total Other Expenses | $1,036 | $1,036 | $536 | $816 | $36 | $1,036 | $36 | $36 | $1,036 | $36 | $36 | $536 | |
| Other % | 2.42% | 3.18% | 1.45% | 2.06% | 0.08% | 2.48% | 0.10% | 0.09% | 2.57% | 0.07% | 0.08% | 1.28% | |
| Total Operating Expenses | $13,154 | $13,383 | $11,947 | $11,192 | $11,237 | $11,078 | $10,198 | $10,128 | $12,310 | $11,185 | $10,970 | $10,489 | |
| Profit Before Interest and Taxes | $9,129 | $2,852 | $6,049 | $7,887 | $10,555 | $8,375 | $5,510 | $6,589 | $5,286 | $10,981 | $9,178 | $7,370 | |
| EBITDA | $9,324 | $3,047 | $6,244 | $8,082 | $10,750 | $8,570 | $5,705 | $6,784 | $5,481 | $11,176 | $9,373 | $7,375 | |
| Interest Expense | $178 | $182 | $186 | $190 | $195 | $199 | $203 | $207 | $211 | $215 | $219 | $223 | |
| Taxes Incurred | $2,685 | $747 | $1,641 | $2,155 | $2,901 | $2,289 | $1,486 | $1,787 | $1,421 | $3,014 | $2,508 | $2,001 | |
| Net Profit | $6,265 | $1,922 | $4,221 | $5,541 | $7,459 | $5,887 | $3,821 | $4,595 | $3,654 | $7,751 | $6,450 | $5,145 | |
| Net Profit/Sales | 14.61% | 5.89% | 11.44% | 13.98% | 16.43% | 14.07% | 10.60% | 11.89% | 9.05% | 15.85% | 14.18% | 12.33% | |
| Pro Forma Cash Flow | |||||||||||||
| Jan | Feb | Mar | Apr | May | Jun | Jul | Aug | Sep | Oct | Nov | Dec | ||
| Cash Received | |||||||||||||
| Cash from Operations | |||||||||||||
| Cash Sales | $42,895 | $32,615 | $36,880 | $39,635 | $45,400 | $41,840 | $36,045 | $38,635 | $40,355 | $48,900 | $45,500 | $41,725 | |
| Subtotal Cash from Operations | $42,895 | $32,615 | $36,880 | $39,635 | $45,400 | $41,840 | $36,045 | $38,635 | $40,355 | $48,900 | $45,500 | $41,725 | |
| Additional Cash Received | |||||||||||||
| Sales Tax, VAT, HST/GST Received | 0.00% | $0 | $0 | $0 | $0 | $0 | $0 | $0 | $0 | $0 | $0 | $0 | $0 |
| New Current Borrowing | $1,214 | $1,214 | $1,214 | $1,214 | $1,214 | $1,214 | $1,214 | $1,214 | $1,214 | $1,214 | $1,214 | $1,214 | |
| New Other Liabilities (interest-free) | $102 | $102 | $102 | $102 | $102 | $102 | $102 | $102 | $102 | $102 | $102 | $102 | |
| New Long-term Liabilities | $0 | $0 | $0 | $0 | $0 | $0 | $0 | $0 | $0 | $0 | $0 | $0 | |
| Sales of Other Current Assets | $0 | $0 | $0 | $0 | $0 | $0 | $0 | $0 | $0 | $0 | $0 | $0 | |
| Sales of Long-term Assets | $0 | $0 | $0 | $0 | $0 | $0 | $0 | $0 | $0 | $0 | $0 | $0 | |
| New Investment Received | $59,000 | $0 | $0 | $0 | $0 | $0 | $0 | $0 | $0 | $0 | $0 | $0 | |
| Subtotal Cash Received | $103,211 | $33,931 | $38,196 | $40,951 | $46,716 | $43,156 | $37,361 | $39,951 | $41,671 | $50,216 | $46,816 | $43,041 | |
| Expenditures | Jan | Feb | Mar | Apr | May | Jun | Jul | Aug | Sep | Oct | Nov | Dec | |
| Expenditures from Operations | |||||||||||||
| Cash Spending | $4,910 | $4,870 | $5,530 | $5,880 | $5,770 | $5,852 | $5,936 | $5,982 | $6,011 | $6,062 | $6,116 | $6,132 | |
| Bill Payments | $8,530 | $15,729 | $10,905 | $10,357 | $10,213 | $11,358 | $10,717 | $9,587 | $17,657 | $31,468 | $38,498 | $31,152 | |
| Subtotal Spent on Operations | $13,440 | $20,599 | $16,435 | $16,237 | $15,983 | $17,210 | $16,653 | $15,569 | $23,668 | $37,530 | $44,614 | $37,284 | |
| Additional Cash Spent | |||||||||||||
| Sales Tax, VAT, HST/GST Paid Out | $0 | $0 | $0 | $0 | $0 | $0 | $0 | $0 | $0 | $0 | $0 | $0 | |
| Principal Repayment of Current Borrowing | $700 | $700 | $700 | $700 | $700 | $700 | $700 | $700 | $700 | $700 | $700 | $700 | |
| Other Liabilities Principal Repayment | $0 | $0 | $0 | $0 | $0 | $0 | $0 | $0 | $0 | $0 | $0 | $0 | |
| Long-term Liabilities Principal Repayment | $0 | $0 | $0 | $0 | $0 | $0 | $0 | $0 | $0 | $0 | $0 | $0 | |
| Purchase Other Current Assets | $0 | $0 | $0 | $0 | $0 | $0 | $0 | $0 | $0 | $0 | $0 | $0 | |
| Purchase Long-term Assets | $7,500 | $0 | $0 | $0 | $0 | $0 | $0 | $0 | $0 | $0 | $0 | $0 | |
| Dividends | $0 | $0 | $0 | $0 | $0 | $0 | $0 | $0 | $0 | $0 | $0 | $0 | |
| Subtotal Cash Spent | $21,640 | $21,299 | $17,135 | $16,937 | $16,683 | $17,910 | $17,353 | $16,269 | $24,368 | $38,230 | $45,314 | $37,984 | |
| Net Cash Flow | $81,571 | $12,632 | $21,061 | $24,014 | $30,033 | $25,246 | $20,008 | $23,682 | $17,303 | $11,986 | $1,502 | $5,057 | |
| Cash Balance | $82,771 | $95,403 | $116,465 | $140,479 | $170,512 | $195,757 | $215,765 | $239,447 | $256,750 | $268,736 | $270,238 | $275,295 | |
| Pro Forma Balance Sheet | |||||||||||||
| Jan | Feb | Mar | Apr | May | Jun | Jul | Aug | Sep | Oct | Nov | Dec | ||
| Assets | Starting Balances | ||||||||||||
| Current Assets | |||||||||||||
| Cash | $1,200 | $82,771 | $95,403 | $116,465 | $140,479 | $170,512 | $195,757 | $215,765 | $239,447 | $256,750 | $268,736 | $270,238 | $275,295 |
| Inventory | $150,000 | $134,370 | $119,665 | $103,094 | $85,248 | $64,651 | $45,510 | $28,742 | $18,068 | $18,790 | $22,647 | $21,140 | $19,531 |
| Other Current Assets | $2,300 | $2,300 | $2,300 | $2,300 | $2,300 | $2,300 | $2,300 | $2,300 | $2,300 | $2,300 | $2,300 | $2,300 | $2,300 |
| Total Current Assets | $153,500 | $219,441 | $217,368 | $221,859 | $228,027 | $237,463 | $243,567 | $246,807 | $259,815 | $277,840 | $293,683 | $293,678 | $297,126 |
| Long-term Assets | |||||||||||||
| Long-term Assets | $4,200 | $11,700 | $11,700 | $11,700 | $11,700 | $11,700 | $11,700 | $11,700 | $11,700 | $11,700 | $11,700 | $11,700 | $11,700 |
| Accumulated Depreciation | $2,050 | $2,245 | $2,440 | $2,635 | $2,830 | $3,025 | $3,220 | $3,415 | $3,610 | $3,805 | $4,000 | $4,195 | $4,200 |
| Total Long-term Assets | $2,150 | $9,455 | $9,260 | $9,065 | $8,870 | $8,675 | $8,480 | $8,285 | $8,090 | $7,895 | $7,700 | $7,505 | $7,500 |
| Total Assets | $155,650 | $228,896 | $226,628 | $230,924 | $236,897 | $246,138 | $252,047 | $255,092 | $267,905 | $285,735 | $301,383 | $301,183 | $304,626 |
| Liabilities and Capital | Jan | Feb | Mar | Apr | May | Jun | Jul | Aug | Sep | Oct | Nov | Dec | |
| Current Liabilities | |||||||||||||
| Accounts Payable | $8,000 | $15,365 | $10,559 | $10,018 | $9,834 | $11,000 | $10,406 | $9,014 | $16,616 | $30,177 | $37,457 | $30,191 | $27,872 |
| Current Borrowing | $22,000 | $22,514 | $23,028 | $23,542 | $24,056 | $24,570 | $25,084 | $25,598 | $26,112 | $26,626 | $27,140 | $27,654 | $28,168 |
| Other Current Liabilities | $1,150 | $1,252 | $1,354 | $1,456 | $1,558 | $1,660 | $1,762 | $1,864 | $1,966 | $2,068 | $2,170 | $2,272 | $2,374 |
| Subtotal Current Liabilities | $31,150 | $39,131 | $34,941 | $35,016 | $35,448 | $37,230 | $37,252 | $36,476 | $44,694 | $58,871 | $66,767 | $60,117 | $58,414 |
| Long-term Liabilities | $0 | $0 | $0 | $0 | $0 | $0 | $0 | $0 | $0 | $0 | $0 | $0 | $0 |
| Total Liabilities | $31,150 | $39,131 | $34,941 | $35,016 | $35,448 | $37,230 | $37,252 | $36,476 | $44,694 | $58,871 | $66,767 | $60,117 | $58,414 |
| Paid-in Capital | $0 | $59,000 | $59,000 | $59,000 | $59,000 | $59,000 | $59,000 | $59,000 | $59,000 | $59,000 | $59,000 | $59,000 | $59,000 |
| Retained Earnings | $112,500 | $124,500 | $124,500 | $124,500 | $124,500 | $124,500 | $124,500 | $124,500 | $124,500 | $124,500 | $124,500 | $124,500 | $124,500 |
| Earnings | $12,000 | $6,265 | $8,187 | $12,408 | $17,949 | $25,408 | $31,295 | $35,116 | $39,711 | $43,364 | $51,116 | $57,566 | $62,711 |
| Total Capital | $124,500 | $189,765 | $191,687 | $195,908 | $201,449 | $208,908 | $214,795 | $218,616 | $223,211 | $226,864 | $234,616 | $241,066 | $246,211 |
| Total Liabilities and Capital | $155,650 | $228,896 | $226,628 | $230,924 | $236,897 | $246,138 | $252,047 | $255,092 | $267,905 | $285,735 | $301,383 | $301,183 | $304,626 |
| Net Worth | $124,500 | $189,765 | $191,687 | $195,908 | $201,449 | $208,908 | $214,795 | $218,616 | $223,211 | $226,864 | $234,616 | $241,066 | $246,211 |
| Personnel Plan | |||||||||||||
| Jan | Feb | Mar | Apr | May | Jun | Jul | Aug | Sep | Oct | Nov | Dec | ||
| Production Personnel | |||||||||||||
| Pharis – Sales Fulfillment | $260 | $260 | $260 | $260 | $260 | $260 | $300 | $300 | $300 | $300 | $300 | $300 | |
| eBay Shipper – Sales Fulfillment | $0 | $0 | $500 | $800 | $840 | $882 | $926 | $972 | $1,021 | $1,072 | $1,126 | $1,182 | |
| Name or Title | $0 | $0 | $0 | $0 | $0 | $0 | $0 | $0 | $0 | $0 | $0 | $0 | |
| Other | $0 | $0 | $0 | $0 | $0 | $0 | $0 | $0 | $0 | $0 | $0 | $0 | |
| Subtotal | $260 | $260 | $760 | $1,060 | $1,100 | $1,142 | $1,226 | $1,272 | $1,321 | $1,372 | $1,426 | $1,482 | |
| Sales and Marketing Personnel | |||||||||||||
| Kandi – Design Consultant | $630 | $630 | $630 | $630 | $630 | $630 | $630 | $630 | $630 | $630 | $630 | $630 | |
| Cheryl – Design Consultant | $600 | $600 | $600 | $600 | $600 | $600 | $600 | $600 | $600 | $600 | $600 | $600 | |
| Pharis – Design Consultant | $260 | $260 | $260 | $260 | $260 | $260 | $260 | $260 | $260 | $260 | $260 | $260 | |
| Doug – Online Marketing Implementation | $200 | $200 | $300 | $350 | $200 | $200 | $200 | $200 | $200 | $200 | $200 | $200 | |
| Other | $0 | $0 | $0 | $0 | $0 | $0 | $0 | $0 | $0 | $0 | $0 | $0 | |
| Subtotal | $1,690 | $1,690 | $1,790 | $1,840 | $1,690 | $1,690 | $1,690 | $1,690 | $1,690 | $1,690 | $1,690 | $1,690 | |
| General and Administrative Personnel | |||||||||||||
| Judy – Owner (Draw against LLC) | $2,000 | $2,000 | $2,000 | $2,000 | $2,000 | $2,000 | $2,000 | $2,000 | $2,000 | $2,000 | $2,000 | $2,000 | |
| Julie – Manager | $840 | $800 | $860 | $860 | $860 | $900 | $900 | $900 | $880 | $880 | $880 | $840 | |
| Robin – Bookkeeper | $120 | $120 | $120 | $120 | $120 | $120 | $120 | $120 | $120 | $120 | $120 | $120 | |
| Other | $0 | $0 | $0 | $0 | $0 | $0 | $0 | $0 | $0 | $0 | $0 | $0 | |
| Subtotal | $2,960 | $2,920 | $2,980 | $2,980 | $2,980 | $3,020 | $3,020 | $3,020 | $3,000 | $3,000 | $3,000 | $2,960 | |
| Other Personnel | |||||||||||||
| Name or title | $0 | $0 | $0 | $0 | $0 | $0 | $0 | $0 | $0 | $0 | $0 | $0 | |
| Name or title | $0 | $0 | $0 | $0 | $0 | $0 | $0 | $0 | $0 | $0 | $0 | $0 | |
| Name or title | $0 | $0 | $0 | $0 | $0 | $0 | $0 | $0 | $0 | $0 | $0 | $0 | |
| Other | $0 | $0 | $0 | $0 | $0 | $0 | $0 | $0 | $0 | $0 | $0 | $0 | |
| Subtotal | $0 | $0 | $0 | $0 | $0 | $0 | $0 | $0 | $0 | $0 | $0 | $0 | |
| Total People | 7 | 7 | 8 | 8 | 8 | 8 | 8 | 8 | 8 | 8 | 8 | 8 | |
| Total Payroll | $4,910 | $4,870 | $5,530 | $5,880 | $5,770 | $5,852 | $5,936 | $5,982 | $6,011 | $6,062 | $6,116 | $6,132 | |


