
The Scarlet Tassel
Executive Summary
One of the nation’s top interior designers, Dan Carithers of Atlanta, said, “If I had $500,000 to spend on a room, I’d spend $400,000 of it on the accessories . . . A sofa’s a sofa, a rug a rug, but accessories are how you can sense what a person is all about. They are the most important ingredient in decorating . . . It’s the accessories that create the “I’m home” feeling.” Source: Atlanta Magazine Shops Fall 2001
The Scarlet Tassel is a start-up retail store offering eclectic home accessories and gifts to consumers wanting to create a personalized home environment – that “I’m home” feeling. The Scarlet Tassel is planning to locate in the Sandy Springs/Lower Roswell area of Atlanta, Georgia catering to middle- and upper-class consumers who look beyond the national home accessory and gift chain stores for those expressions of individual personality and style. In addition to the offering of unique products, unparallel customer service, quality, value will complement the customer experience. In Year Two, The Scarlet Tassel will develop its online presence at www.thescarlettassel.com. In Year Three, The Scarlet Tassel will move to e-commerce, shipping directly to its web customers. The Web will be an extension of the store concept – a virtual business card and portfolio for the company – its online “home.”
Growth plans for The Scarlet Tassel include an expectation of quite comfortable total revenue Year One. Year Two will develop services and marketing plans, in addition to the Web presence, so that a 30% growth rate is realized. Year Three expectations of further growth with development of e-commerce and continued awareness by the consumer are set at approximately 20%. It is the feeling of both owners that these expectations are realistic and attainable.
Deirdre Staab and Shelly Dozier-Mckee, bring a combined 36 years of experience to this venture with expertise that crosses merchandising, marketing, purchasing, forecasting, operations and direct import sourcing. The Scarlet Tassel, Inc. is an S corporation. Deirdre and Shelly each have a 50% share of the business and equity investment. Additional funding is needed for asset purchases and start-up costs to make The Scarlet Tassel a reality.
1.1 Mission
Company Mission
A celebration of the home, The Scarlet Tassel is a store for the quality- and style-conscious consumer. Providing unique, eclectic and affordable home accents and gifts, we intend to generate a fair return to finance continued growth and expanded community involvement.
Customer Creed
The Scarlet Tassel will inform, inspire and show you, our customer, how to create an expression of yourself within your home. Through custom services, smart pricing and a sense of trust, it is our desire that you will look to us as your valued resource to achieve a personalized home environment.
Employee Pledge
Our employees will enjoy a friendly, fair, and creative work environment, which respects diversity, new ideas, and hard work.
1.2 Keys to Success
The primary keys to success for the company will be based on the following factors:
- SELL products that provide quality and value to the consumer while meeting needs for an expression of personal style.
- PROVIDE custom services such as in-store workshops and personalized promotions so that customers are retained to generate repeat purchases and make referrals.
- COMMUNICATE with our customer base through print magazine advertising, postcard mailings and via our website.
- ESTABLISH a visible, accessible and welcoming storefront and website to position us as the premier choice for our products and services within the marketplace and beyond.
- ENSURE through daily management practices the values of The Scarlet Tassel’s mission are followed so that a successful and growth-oriented business is developed and maintained.
1.3 Objectives
- Maintain a direct cost of sales of 45% or less, and gross margin of 55% or greater.
- Maintain operating expenses to equal or less than that of plan.
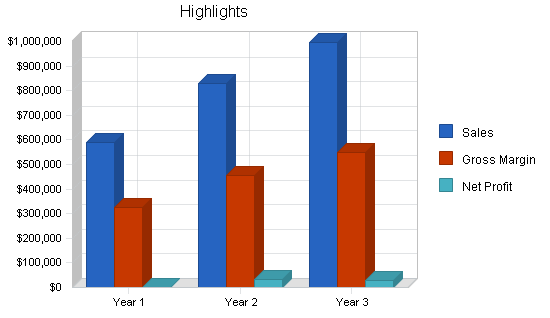
- Generate total revenue of $626,000 in Year One.
- Develop an Internet presence in Year Two.
- Take Internet presence to e-commerce in Year Three.
- Realize an annual growth rate of approximately 30% in Year Two.
- Realize an annual growth rate of approximately 20% in Year Three.
Company Summary
Privately owned and operated by Deirdre Staab and Shelly Dozier-Mckee, The Scarlet Tassel is a newly established retail store offering stylish, eclectic and affordable home accessories and gifts to consumers wanting to create a personalized home environment.
Located in the Sandy Springs/Lower Roswell area of Atlanta, Georgia, The Scarlet Tassel will cater to middle- and upper-class consumers who look beyond the national chain stores for home accessories and gifts.
After having established a successful and growth-oriented business, we look to expand our business to e-commerce during our third year of operation. This additional business channel will allow us to reach a broader customer base as well as expand the level of customer service and personalized services we are able to offer the consumer.
STORE LOCATION
The Scarlet Tassel will be located in the Sandy Springs/Lower Roswell area of Atlanta, Georgia. With easy access from Interstate 285, the Sandy Springs/Lower Roswell area is well known throughout greater Atlanta and attracts shoppers from many parts of the city. As a destination shopping area, consumers come here because of the diversity of business venues available.
National chains such as Target and K-Mart enhance the community that offers many local service establishments such as coffee houses, dry cleaners, restaurants, banks and unique specialty shops. The Scarlet Tassel looks to open a 3,500 square foot store located in an urban lifestyle strip mall offering high visibility and established foot traffic.
The surrounding tenants, primarily small gift, stationery and food-related stores will enhance the shopping experience of The Scarlet Tassel’s customer base. Shopping at The Scarlet Tassel will be easy and convenient due to the following factors:
- High visibility store front from the street level.
- Lighted exterior signage.
- Easy in and out driving access to the shopping complex – traffic light parallel to store location.
- Plentiful parking spots adjacent to the store.
- Lighted parking lot.
STORE OPERATION
The Scarlet Tassel will be open for operation Monday-Sunday, closed major holidays. Hours of operation will be 10:00 a.m.-6:00 p.m. Monday-Saturday and 12:00 p.m.-5:00 p.m. Sunday. Hours will be extended to 7:00 p.m. during the Holidays.
The Scarlet Tassel will initially be staffed by one full time employee, working 40 hours a week and one part-time employee working 30 hours or less a week. When not traveling or attending to outside business, both owners will be on site daily and will provide additional sales and customer support assistance. Additional details on this subject are provided in the Personnel Plan section.
STORE POLICIES
To most effectively service the customer, The Scarlet Tassel will accept the following forms of payment: cash; check; credit Card: Visa, Mastercard and American Express; debit card; traveler’s checks. When accompanied by a sales receipt, merchandise returns will be granted a full refund within 14 days of purchase. A store credit will be granted within 30 days of purchase with or without a sales receipt. Gift recipients can return items for exchange or store credit. Damaged and defective items can be returned for exchange or refund via original form of payment.
2.1 Company Ownership
The Scarlet Tassel is a privately-held S corporation owned by Deirdre Staab and Shelly Dozier-McKee, each with 50% ownership in the company.

2.2 Start-up Summary
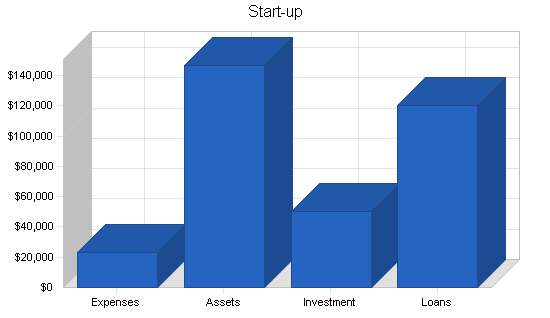
Total current and long-term assets will make up 86% of start-up requirements. Start-up expenses, which are detailed in the following table, comprise the remaining 14%.
As detailed below, start-up funding will be a combination of equal investment by the two owners and a long-term commercial loan, calculated at 10.5% for six years.
Capital Equipment Listing
(Quantity, Description of Asset, Brand/Model, Total Cost)
- 1 4-Line Phone system, Panasonic KXTG4000B: $500
- 1 All-In-One Printer-Fax-Scanner-Copier, Hewlett Packard, D135: $500
- 1 Barcode Label Printer, Eltron: $575
- 1 Local Appserver, Pentium 4, 1.8 GHz, 512 RAM, 40 GB Harddrive, 10/100 NIC, 48x CDRW, 17″ Monitor, Keyboard, Mouse, Windows XP Professional, Norton System Works 2002, PCAnywhere Host & Remote 10.5, Dell Dimension 4500S: $1,329
- 2 Point-of-Sale Systems, Pentium 3, 700 MHz, 256 RAM, Windows 2000, 12″ Touchscreen, Thermal Receipt Printer, Cash Drawer, Credit Card Reader, Hand Scanner, Customer Display, Keyboard, Mouse Posiflex, JIVA PL Series: $6,790
- 3 Battery Power Backup, 3-500 VA UPS APC: $480
- 2 Laptop Computers, Pentium 3, 1.2 GHz, 512 RAM, 30 GB Harddrive, CDRW, Double Capacity Battery, Windows XP Professional Sony, VAIO R505GC: $4,360
- 1 Digital Camera, 3.3 Megapixal Sony, Cybershot DSCS75: $500
- 1 Camera Battery, Lithium Ion Sony: $60
- 2 Camera Memory Sticks, 128 MB Sony: $120
- 1 Camera Carry Pouch LowePro: $11
- 1 Retail Management Software, POS & Inventory Management Celerant ARMS: $5,560
- 1 Accounting Software, QuickBooks Pro Quicken: $249
- 1 Credit Card Software, PCCharge Pro Go Software: $299
Total: $21,333
| Start-up | |
| Requirements | |
| Start-up Expenses | |
| Accounting & Legal Organization | $2,500 |
| Initial Marketing & Advertising | $2,678 |
| Logo Development, Business Cards & Stationery | $2,800 |
| Miscellaneous | $756 |
| Software Training & Installation | $2,923 |
| Store Planner/Designer Services | $5,000 |
| DSL Installation & Service Activation For Utilities | $400 |
| Office Supplies, POS, Giftwrap & Packaging | $3,000 |
| Travel | $3,300 |
| Total Start-up Expenses | $23,357 |
| Start-up Assets | |
| Cash Required | $28,098 |
| Start-up Inventory | $31,770 |
| Other Current Assets | $3,000 |
| Long-term Assets | $83,775 |
| Total Assets | $146,643 |
| Total Requirements | $170,000 |
| Start-up Funding | |
| Start-up Expenses to Fund | $23,357 |
| Start-up Assets to Fund | $146,643 |
| Total Funding Required | $170,000 |
| Assets | |
| Non-cash Assets from Start-up | $118,545 |
| Cash Requirements from Start-up | $28,098 |
| Additional Cash Raised | $0 |
| Cash Balance on Starting Date | $28,098 |
| Total Assets | $146,643 |
| Liabilities and Capital | |
| Liabilities | |
| Current Borrowing | $0 |
| Long-term Liabilities | $120,000 |
| Accounts Payable (Outstanding Bills) | $0 |
| Other Current Liabilities (interest-free) | $0 |
| Total Liabilities | $120,000 |
| Capital | |
| Planned Investment | |
| Deirdre Staab | $25,000 |
| Shelly Dozier-Mckee | $25,000 |
| Additional Investment Requirement | $0 |
| Total Planned Investment | $50,000 |
| Loss at Start-up (Start-up Expenses) | ($23,357) |
| Total Capital | $26,643 |
| Total Capital and Liabilities | $146,643 |
| Total Funding | $170,000 |
Products and Services
The Scarlet Tassel identified a need to gain feedback on the product and service offerings of the concept as well as tap into the buying patterns and market awareness of women within the greater Atlanta area. To do this we conducted a Shoppers Focus Group. Held in June, 2002, the focus group was comprised of 10 women representing a diversity of backgrounds and lifestyles:
- 30-60 years of age
- Homemakers to independent business owners
- Single to married
- Living in four cities within the greater Atlanta area
- Representing several ethnic groups
- Unique and independent decorating styles
The objective of the focus group session was to gain insight into the following topics:
- Shopping experiences
- Store services
- Product concepts
- Market and competitive awareness
- The retail concept that came to be known as The Scarlet Tassel
To solicit feedback, the focus group was asked a series of questions related to shopping, shopping experiences and store services. Additional feedback was gathered through a word association game focusing on the brand identity elements of stores in the Atlanta area. Lastly the group was shown the concept boards for our business and asked to describe what it represented to them.
The ideas gathered provided us with a wealth of information that helped to formulate and define the products, services and marketing strategies outlined in this plan. This focus group was a key element in establishing a successful blueprint for The Scarlet Tassel.
PRODUCTS: The Scarlet Tassel focuses on selling quality- and value-oriented home accessories and gifts to the independent homeowner and decorating trade.
Our eclectic product mix will consist of products that allow for the successful combination of a lot of different styles – blending the old with the new, the classic with the contemporary, the wild with the tame. Products will be showcased via lifestyle merchandising that inspires a personalization of the home environment.
To support continued business expansion and growth, The Scarlet Tassel will firmly establish its product identity through a narrow and focused product assortment in Year One. In Years Two and Three, the product offer will be expanded and enhanced with new product statements and a broadening of the most profitable product categories. This approach will establish a brand identity, allowing us to tailor our offering to meet the needs of our customers.
The following list identifies the categories for Year One and beyond:
Year One
- Decorative Accessories–Tassels
- Decorative Accessories–Clocks
- Decorative Accessories–Desk/Office Accessories
- Decorative Accessories–Floral
- Decorative Accessories–Lighting
- Decorative Accessories–Candles
- Accent Furniture–Shelving
- Accent Furniture–Footstools & Benches
- Accent Furniture–Bed & Bath
- Accent Furniture–Chairs
- Wall Decor–Framed Art
- Wall Decor–Wall Grills & Plaques
- Wall Decor–Mirrors
- Home Textiles–Accent Pillows & Throws
- Special Occasion Gifts–Men’s
- Special Occasion Gifts–Personal/Girlfriend
- Special Occasion Gifts–Housewarming
- Special Occasion Gifts–Hostess
- Special Occasion Gifts–Baby
- Personal Accessories–Bath & Body
- Personal Accessories–Personal Interest Books
- Personal Accessories–Pet Interest
- Seasonal Decor–Halloween
- Seasonal Decor–Fall Harvest
- Seasonal Decor–Christmas
- Garden Decor–Planters
- Garden Decor–Fountains
- Garden Decor–Garden Gifts
- Garden Decor–Miscellaneous Gifts
Year Two
- Decorative Accessories–Tabletop Accessories
- Home Textiles–Accent Rugs
- Home Textiles–Tabletop Linens
- Personal Accessories–Jewelry
- Seasonal Decor–Valentines
- Seasonal Decor–Other
Year Three
- Personal Accessories–Tote Bags
- Personal Accessories–Cards & Stationery
- Garden Decor–Accent Furniture
- Garden Decor–Statuary
As an overview, each of the product categories will be represented as described below:
Decorative Accessories: Encompassing a variety of decorative elements that provide character to a home and give it a personal feel, the price-points in this category will range from $10 to $300.
- Tassels
- Candles and clocks
- Desk and office accessories
- Tabletop accessories
- Dried and silk floral arrangements
- Lamps including tabletop and floor lamps
Accent Furniture: Smaller, more unique furniture items used as accents with larger furniture pieces make up this product category with price-points ranging from $100 to $800.
- Occasional and accent furniture
- Tables
- Shelving
- Footstools and benches
- Bed and bath accessories
Wall Decor: One of the fastest growing product categories in the home decorative market, our wall decor offering will encompass a unique variety of items beyond traditional framed artwork. Price-points in the category will range from $25 to $200.
- Mirrors
- Framed art
- Wall grills and plaques
Home Textiles: Known as the “soft elements” in the home decorative market, our home textile offering will provide the finishing touches to a room or table setting. Price-points in this category will range from $15 to $150.
- Accent pillows
- Accent rugs
- Tabletop linens
Special Occasion Gifts: For unique gift giving occasions, our gift selection will allow our customers to purchase items that reflect their personal sentiments and feelings for the gift giving occasion and gift recipient. Price-points in this category will range from $10 to $80.
- Hostess gifts
- Men’s gifts
- Personal/girlfriend gifts
- Housewarming gifts
- Baby gifts
Personal Accessories: Our personal accessory offering will encompass items that our customers will use for themselves, enhancing their wardrobe, lifestyles and home environments. Price-points in this category will range from $10 to $60.
- Bath and body products
- Jewelry: handcrafted and unique
- Tote bags
- Cards and stationery
- Personal interest books
- Pet interests
Seasonal Decor: Our unique offering of seasonal decor will allow our customers to decorate their homes and entertain family and friends in fun and dynamic ways. Our offering here will focus on several key holidays and range in price-point from $20 to $175.
- Giftable valentines
- Halloween decor
- Fall Harvest decor
- Christmas/New Years decor
- Other
Garden Decor: Allowing our customers to extend their living environments outdoors, our decorative garden offering will feature both decorative elements as well as functional elements. The accent pieces in this category will range in price-point from $25 to $300.
- Statuary
- Planters
- Fountains
- Small accent furniture
- Garden gifts
- Miscellaneous decorative
Focusing on offering products with quality, value, style and uniqueness, The Scarlet Tassel will utilize established vendors from four home decorative product markets to preview and purchase products from: Atlanta International Gift & Home Furnishings Market, Dallas International Gift and Home Accessories Show, New York International Gift Show and High Point International Home Furnishings Market. One-of-a-kind products will be sourced through local artist and craftsmen via major antique markets and craft shows.
SERVICES: To create a point of differentiation between The Scarlet Tassel and other retailers in the area, we will offer a variety of custom, personalized services that further enhance the products offered and shopping experience of our customers. Our service offering will provide one-on-one design inspiration for the customer, will allow the customer to shop in a variety of ways, and will support a broad consumer, business and design trade client base.
Customized Giftwrap: The signature gift wrap offered by The Scarlet Tassel will be the added touch that makes the gift special. The gift wrap will reinforce the brand image of the store.
Corporate Gift Program: As a business-to-business offering, our corporate gift program will allow a business to purchase fun and unique gifts for their client or employee at a 10% discount.
Gift Certificates: Making gift giving easy for a variety of occasions, The Scarlet Tassel will offer gift certificates in a variety of denominations.
Gift Registry & Wish List: Whether for a wedding, birthday, anniversary or other special occasion, our gift registry program will allow friends, families and spouses on the hunt to purchase a gift that the gift recipient has already indicated they would like. It takes the hassle out of selecting a gift.
Realtor Gift Certificate Program: As a way to reach newcomers to Atlanta, our realtor gift program will allow realtors to purchase “welcome” gifts for their clients at a 10% discount. Not only will our exposure to the affluent realtor market enhance sales, but the opportunity to build our customer base will be greatly enhanced.
Creative Workshops: As a way to inspire and educate customers on “do-it-yourself” decorating projects, The Scarlet Tassel will offer a variety of educational workshops that will provide hands-on techniques to decorate and adorn your home. Utilizing products sold in the store, we look to enhance sales as well as make decorating easy for our customers.
“Makeover In A Day:” This unique service will provide the customer with “in-home” decorating assistance, re-creating a room or two in a customer’s house within a day, utilizing both the homeowner’s existing pieces as well as incorporating new decorative pieces from The Scarlet Tassel. Exposing our products and services to the friends and family of customers will enhance our opportunity to attain new customers. This service program will be available to customers during Year Two of operation.
ASID Discount: Offered exclusively to the design trade, an ASID discount of 20% will be extended to Interior Designers.
Preferred Customer Shopping Events: As recognition of our best customers, we will hold preferred customer shopping events allowing those customers to shop special days and hours, and receive personalized shopping assistance and special discount offers.
Newsletter: As a way to communicate with our customer base, we will publish a quarterly newsletter that highlights design trends, new product offers, gift giving ideas and decorating tips. This service program will be available to customers during Year Two of operation.
Customer Comment Card: To ensure that we are servicing our customers fully and offering the products they desire, we will provide a customer comment card where ideas and thoughts can be expressed by the customer. Comments will be reviewed on a regular basis in an effort to enhance products and services.
Personal Shopper: The entire staff of The Scarlet Tassel will possess the skillset to personally assist each customer with all of her shopping and decorating needs. As customers and sales associates establish personal relationships, The Scarlet Tassel will be able to inform the customer about new product arrivals that might interest them as well as provide decorating and gift giving tips that are aimed at the unique and individual customer.
Birthday Recognition: To recognize that important day, The Scarlet Tassel will send out birthday cards to customers while also providing them with a short-term “birthday discount” of 10%.
3.1 Fulfillment
The company has a number of sources available for their product is vast as the home decor market and industry is quite large. Management will rely on three markets for preview and purchase of products from established vendors: Atlanta International Gift & Home Furnishings Market, New York Interntional Gift Show, and High Point International Home Furnishings Market. Unique and one-of-a-kind products will be sourced through local artists and craftmen via major antique markets and craft shows.
Market Analysis Summary
Launching a new business venture during tough economic times can prove challenging, however, through extensive research and analysis the following market findings and projections support the launching of The Scarlet Tassel retail store in 2003.
While the U.S. economy and specific business sectors were hit by a stagnating economy during 3rd and 4th quarter of 2001, the “gift industry” which includes the product categories of home decorative accents, general gifts, collectibles, stationery and greeting cards, and seasonal decorations suffered only a 1% drop generating sales of $54.6 billion against 2000 sales of $55.2 billion.
It has been reported in many industry trade publications that despite the downturn in the economy, American consumers are spending more and more of their disposable income on their home. The home decorative accents segment of the gifts industry continues to perform strongly posting a 2.2% growth over 2000 and reaching $16.9 billion in sales.
As predicted by Unity Marketing, “the future of the gifts and home accents market is positive for the next several years.” Source: Unity Marketing, The Home Report 2001: The Market, The Competitors, The Trends
Closer to home, homeowners in the Sandy Springs/Lower Roswell area of Atlanta spent $1.8 billion on home decorative products in the year 2000. We expect sales to continue to grow as home ownership grows by 8.8% and 61% of homeowners reach a level of earnings above $60,000 per year by the year 2005. Source: CACI Marketing Systems for Georgia 2000 Information Systems, The University of Georgia
The Pulse of the Industry
- “The home has become the most desired status symbol for Americans, and as such, a growing portion of the American families’ discretionary spending is budgeted for the home.” Source: Unity Marketing, The Home Report 2001: The Market, The Competitors, The Trends
- “The home market has been transformed from a largely functional to a fashion business, thus allowing consumers to dress and decorate their houses like they dress and accessorize themselves. Consumers are wanting products that reflect their tastes, values and sensibilities.” Source: Unity Marketing, The Home Report 2001: The Market, The Competitors, The Trends
- “In the past two years consumers spent more money on home furnishings than they did on clothes. Consumers are not just striving to make their homes more ‘beautiful,’ rather they are seeking decorative items that can positively impact the mood and emotional climate of their home.” Source: Unity Marketing, The Gifts and Decorative Accessories Report 2001: The Market, The Industry, The Trends
- “As their lives become more ‘virtual’ and dependent upon computers and technology, consumers will seek out gifts and decorative products which will help ground them in the ‘real’ world.” Source: Unity Marketing, The Gifts and Decorative Accessories Report 2001: The Market, The Industry, The Trends
Shifting channels of distribution are a major trend in retailing today, with many consumers turning to e-commerce for their home needs. A business that establishes itself with multiple channels of operation will set themselves up for continued growth and success. The Scarlet Tassel plans to establish an e-commerce business segment in year 3 of operation.
The Market With More
As a city with dominant growth in the southern region, the Atlanta retail marketplace continues to benefit from the South’s dominance over other regions in almost every indicator of growth and affluence.
- The South has more discretionary income dollars, leading the U.S. with 33.5%.
- The South leads in households with $75,000+ income and $100,000+ income.
- The South leads in projected growth of total personal income.
- The South leads in the number of housing starts at 39.1%.
- The South generates more retail sales than any other U.S. region in every sales category.
- The South is number one in sales of furniture and home furnishings.
Source: U.S. Department of Commerce, Bureau of Census, 2001
4.1 Market Segmentation
The Scarlet Tassel intends to target specific market segments to generate sales.
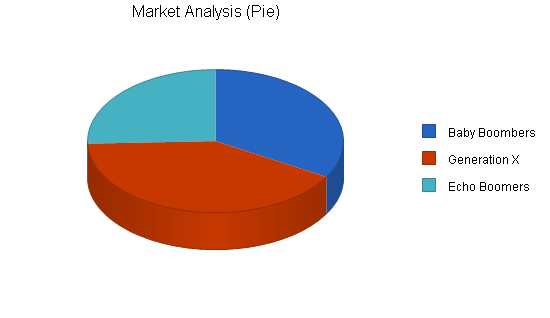
BABY BOOMERS (age 38 to 56) still have kids at home, so they need bigger houses and possessions to put in those houses. Their affluence is reaching its highest level.
GENERATION X (age 24 to 37) is thriftier than previous generations, very home-oriented, and prefers more free time to more money.
ECHO BOOMERS (including people born between 1979 and 2005 – customers who have yet to be born!) will be the most affluent young generation ever (they have access to the Baby Boomers’ money), and they grew up with technology.
Market Segment Characteristics
- Within a 5 mile radius of the Sandy Springs/Lower Roswell area of Atlanta, the population statistics (age 0-59) encompassing the market segments targeted by The Scarlet Tassel totalled 124,964 in 2000. A growth rate of 6.8% is projected through 2005.
- By market segment, The Scarlet Tassel’s customer base will be represented as follows:
- 33.0% Baby Boomers
- 41.0% Generation X
- 26.0% Echo Boomers
- Targeting primarily female shoppers, 51.6% of the market segments targeted by The Scarlet Tassel are female with a growth projection of 6.8% through 2005.
- By race, The Scarlet Tassel’s market segments will be represented as follows:
- 77.5% White
- 7.8% African American
- 6.6% Hispanic
- 3.5% Asian
- 4.6% Other
- The total number of households in 2000 totalled 65,697 and is projected to grow by 8.8% through 2005, totaling 72,073.
- As incomes increase over the next several years, the discretionary income available to spend on home decorative and gift products will increase. In 2000, households generating in excess of $60,000 per year represented 56.8% of total household earners. By 2005 this number is projected to jump to 61.5% of total household earners.
Source: CACI Marketing Systems for Georgia 2000 Information Systems, University of Georgia
Who Is The Scarlet Tassel Customer?
- Middle to Upper Class
- Primarily Female
- 30 – 60 Years of Age
- Educated
- Homeowner
- Social, Enjoys Gatherings With Friends
- Family Oriented
- Values the Comforts of Home
- Relaxed and Approachable Lifestyle
- Quality Conscious
- Value Conscious
- Possesses Style Awareness
| Market Analysis | |||||||
| Year 1 | Year 2 | Year 3 | Year 4 | Year 5 | |||
| Potential Customers | Growth | CAGR | |||||
| Baby Boombers | 3% | 41,281 | 42,519 | 43,795 | 45,109 | 46,462 | 3.00% |
| Generation X | 4% | 50,723 | 52,752 | 54,862 | 57,056 | 59,339 | 4.00% |
| Echo Boomers | 3% | 31,608 | 32,430 | 33,273 | 34,138 | 35,026 | 2.60% |
| Total | 3.31% | 123,612 | 127,701 | 131,930 | 136,303 | 140,827 | 3.31% |
4.2 Service Business Analysis
The state of the industry is being determined in a positive way by consumer attitudes and changes in behavior. Following are a few observations:
- Having seen growth prior to September 11, 2001, the home decorative and gift industry is experiencing continued success as Americans begin to refocus their priorities and place more emphasis on the core values of home and family. This shift in priorities has driven many consumers to sprucing up their homes in a desire to make it more pleasing and personal.
- As consumers become more time-deprived, they are looking to shop at stores whose service offerings are as equal in quality and value as their product offerings.
- As consumers are overwhelmed with choices in their lives, they look for stores to offer them products that will enhance their lifestyle, make their lives more comfortable and provide unique and uncommon product selections beyond the mass market retailers.
- More and more consumers are seeking independent retailers that offer them the feel of home with a more personalized shopping experience.
- In many cases, retail stores are beginning to “look alike” to many consumers. The more personal and interesting the product, the better it reflects your personality. Personalization is making a huge difference. Eclectic doesn’t just mean you have a mix of styles, it means you have things that are intensely personal and can reflect one’s individual style and taste.
- In the service arena, making business easier for consumers is a winning element. Simple things like offering convenient hours, free delivery, and easy return policy will win big points in the consumer’s mind.
4.2.1 Competition and Buying Patterns
The home decorative and gift marketplace is a diverse arena encompassing many choices for the consumer. While The Scarlet Tassel recognizes that our competition in the Sandy Springs/Lower Roswell areas comes in many shapes and sizes, our in-depth analysis of each, as outlined below, has allowed us to identify our market strengths, areas of uniqueness and competitive edge. The following analysis reflects competition located within a three mile radius.
Hospitality House: Located in the Sandy Springs Plaza shopping center as well as several other locations in Atlanta, this gift and decorative accessories store has established itself as a classic and traditional resource for brass, pewter, glass, crystal and wood decorative items. A large percentage of the assortment focuses on tabletop and dining accessories such as bowls, serving utensils, ceramic tableware, vases and linens. They do not offer any decorative items within the lighting, furniture, rug, textile and garden categories. The gift offering is positioned as “special occasion” gifts appropriate for weddings, baby, anniversaries and birthdays. To address seasonal holidays, the store offers small decorative elements such as ornaments and tabletop decor for Valentines, 4th of July, Halloween, Thanksgiving and Christmas. The overall product selection offered by Hospitality House is of high quality and represents a more formal decorating style. The clientele that shops at Hospitality House tend to be older in age. Prices range from $10 for small gift items to $350 for a more formal decorative item. Hours of operation are Monday through Saturday 9:00 a.m. to 6:00 p.m. As they are closed on Sundays, they are not taking advantage of the Sunday traffic the center draws.
What Fun: With a single location in the Sandy Springs Plaza shopping center, this highly whimsical and eclectic gift store offers playful, comical and creative gifts for all occasions, serious or fun. Within the store, items are grouped by gift giving occasion or recipient such as, “For Him,” “For Her,” “Wedding,” “Pet” or Birthday.” Products range from fur covered telephones, novelty books and hand-painted pottery to a chair shaped like a shoe, lava lamps and novelty pet dishes. The store environment is colorful, festive, playful and fun, and reinforces the store name and brand positioning. Opening price-points start at $5.00 and reach $250 on the high end.Establishing a brand position that resolves around elements of “fun,” they have gone so far as to apply this to their store hours: Monday through Saturday 9:59 a.m. to 6:01 p.m. and Sunday 12:01 p.m. to 4:59 p.m.
Store House: This national retail furniture chain store has many locations around Atlanta, with one located in the Sandy Spring Plaza shopping center. With the primary focus on large home furnishing pieces, items within the store can be described as modern, classic and contemporary, with a distinct Scandinavian or Swedish style. The store offers furniture pieces for all rooms in the home as well as a narrowed assortment of decorative accessories such as lamps, ceramics, and artwork and wall decor. As with the furniture, the decorative accessories are more contemporary and modern in style. Observations indicate that the customer that shops at this store is younger to middle age with a distinct decorating style. Pricing starts at $50 for a small decorative accessory to $1,000’s for larger furniture pieces. Interior decorating services are available for an additional fee. Store hours are Monday through Saturday from 9:00 a.m. to 6:00 p.m. and Sunday 12:00 p.m. to 6:00 p.m.
Paper Affair: As the name indicates, the primary focus of this store is a large and diverse offering of paper products: Stationery, cards, gift-wrap, invitations and announcements. One of many locations in Atlanta, the Sandy Spring Plaza store is a bit smaller than their typical store, thus offering less depth in all the product categories they carry. Cards, invitations and announcements make up the largest percentage of the assortment and are further enhanced with custom printing services available. A small offering of personal gifts such as writing instruments, picture frames, books and bath and beauty products are also available. Holidays are addressed with a narrow offering of themed gift and paper products specific to the season. Paper Affair attracts a broad demographic audience as their paper products address many looks, styles, colors, formats and needs. Within the paper goods industry, their main competitors are stores such as Swoozies, Papyrus, Crane and Queen’s Paperie. Given the range of products offered, prices start at $1.25 for a greeting card to $40 for a picture frame. Following a company policy, all locations are open Monday through Friday 10:00 a.m. to 7:00 p.m., Saturday, 10:00 a.m. to 6:00 p.m. and Sunday 12:00 a.m. to 5:00 p.m.
The Beaded Lizard: This independent jewelry and gift store has three locations in the Atlanta area. The Sandy Springs Plaza store has opened in the last year and is smaller than its sister stores. Handcrafted and beaded jewelry make up a large percentage of the assortment with small “all occasion” gifts rounding out the offer. Many pieces are whimsical in style and inexpensive in price. Prices range from $5.00 to $70 for a more intricately designed jewelry or gift item. This store attracts a younger audience, which seemingly looks for more “stylish” pieces that do not require a large investment. Store hours are Monday through Saturday from 10:00 a.m. to 6:00 p.m. with limited Sunday hours of 1:00 p.m. to 5:00 p.m.
Ross Dress for Less: This National Discount Apparel and Accessories store is new to the Southern region and Atlanta Area. The Sandy Springs store is newly opened (September 2002) and is of significant square footage. Primarily selling adult and kids apparel, personal accessories and footwear the store does offer a selection of home decorative accessories and linens. A majority of the items are overstocks or second quality items purchased in the market from full price stores and are being sold at deep discounts. Quality levels tend to be lower because of the price-point positioning and item selections limited given the source of goods. A customer purchasing from this store will not find any decorating inspiration or decorating services available. Ross attracts a wide customer base, primarily those looking for value and discount pricing. The store is open Monday through Sunday.
K-Mart: As a national chain discount store, K-Mart has a diverse product offering that appeals to consumers looking for value pricing. Product statements range from clothing and footwear to assemble-it-yourself furniture, lamps, mass marketed decorative accessories, household linens and electronics. Because of recent bankruptcy filings and stiff competition from Wal-Mart and Target, K-Mart has lost market share.
Marshall’s: Much like Ross Dress for Less, Marshall’s is a national discount store offering clothing, footwear and home products. They too purchase overstocks and “seconds” from the after-market suppliers and offer them at heavily discounted prices. Selections are limited and shopping is a “hunt-and-peck” experience. Items are positioned on shelves by category with little merchandising criteria applied other than get as much on the selling floor as possible. The store is open Monday through Sunday.
Target: This highly recognizable multi-channel discount store offers a wide range of products and styles that appeal to a broad audience. Target has positioned itself as a source for the latest styles and trends at value pricing. Offering clothing and footwear, home decor, cleaning supplies, bath and beauty products, electronics, outdoor camping and sports equipments as well as toys, Target is a one stop shopping source. Because they focus on offering the latest trends and styles many of the gifts and home decorative products tend to be more contemporary and modern in feel. Quality is acceptable but is not recognized as being truly long lasting. Design inspiration is limited within the store and personalized services consist of a baby and wedding registry service. Store Hours are 8:00 a.m. to 10:00 p.m. Monday through Saturday and 9:00 a.m. to 7:00 p.m. on Sundays.
Lakewood Antiques Mall: With a single store located in Sandy Springs, this antiques mall supplements the Lakewood Antiques Fair that comes to Atlanta the second weekend of each month. Set up with individual booths within a larger complex, the primary focus is on antique furnishing, accessories, rugs and garden decor. Because antiques reflect a unique decorating style, this store does not have mass appeal. Pricing can range from $5.00 to many $1,000’s for larger furniture pieces. Each booth owner merchandises his or her own space so there is no pattern or style that flows throughout the store. Sales help is located at the front of the large square footage building so it is difficult to receive personalized assistance. This store is open Monday through Sunday.
The Scarlet Tassel sets itself apart from the “masses” by offering products that are unique in design and style, and are decorative in application. Our goal is to target quality-conscious homeowners who seek personal service, smart pricing, and a sense of trust in where they shop for those unique elements that express their character in their home. We want OUR HOME to be their HOME.
Web Plan Summary
In Year Two, The Scarlet Tassel plans to develop a Web presence and in Year Three, add e-commerce to its business model. The Scarlet Tassel’s website, www.scarlettassel.com and www.thescarlettassel.com, will be a secondary channel of business serving as virtual business card and portfolio for the company, as well as its online “home.”
The website will showcase the product offer available for purchase, and provide design and trend information appropriate to the home decorative market. Additional tips and inspirational ideas will focus on gifts and gift giving. To further show off its expertise, The Scarlet Tassel website will provide a resources area, offering articles, research, product information and website links of interest to its customers.
The Scarlet Tassel website will mirror the image and branding elements showcased in the store and at the same time, keep up with the latest trends in user interface design. The key to the website strategy will be combining a well designed front-end, with a back-end capable of capturing “hits” and customer data for use in future marketing endeavors.
5.1 Website Marketing Strategy
Market strategy in an Internet retail business depends on recognition of expertise by the consumer. For The Scarlet Tassel, it will start with our existing brick-and-mortar store customer base, informing them of our Internet presence and encouraging their word-of-mouth recommendations to others. Further awareness will be heightened by utilizing search engine marketing, banner advertising, and affiliates.
5.2 Development Requirements
Costs that The Scarlet Tassel will expect to incur with development of its website include:
Development Costs
- Upgrade to Celerant ARMS Internet Engine – $7,500.
- Site Design – $3,000.
- Site Implementation – Free. The Scarlet Tassel will utilize the programming services of Andy Staab, husband and friend. Andy Staab has 20 years of experience in software development including custom programming, data management, and Web development. His skills and services are profiled at his own website: www.programmerplus.com. The Scarlet Tassel is grateful for the significant cost savings and advice that this connection will provide.
Ongoing Costs
- Website name registration for both www.thescarlettassel.com and www.scarlettassel.com – $70 per year.
- Site Hosting – $30 or less per month.
- Search Engine Registration – $200 per year.
- Site Design Changes – Changes in the site, such as photography costs (estimated at $150-$200 per shot), are considered to be part of Marketing and Advertising.
Strategy and Implementation Summary
6.1 Competitive Edge
The Scarlet Tassel looks to establish itself competitively as a unique retail environment through its product offering, the scope and level of services it provides, and the expertise of its employees.
PRODUCTS: Sourced through established manufacturers via international trade shows and one-of-a-kind specialty craft fairs, the products offered by The Scarlet Tassel will provide a high level of quality and value to the consumer. The range of products will be unique, with little crossover to other retailers within the Atlanta marketplace.
SERVICES: Connecting with the customer is a key focus for The Scarlet Tassel. Through personalized design services, educational decorating workshops, gift registry, realtor programs, ASID discounts, gift certificates, gift wrap and preferred customer recognition programs, The Scarlet Tassel will provide a level of personalization not commonly found in today’s hectic, mass market. It is our desire that customers look to us as their valued resource to achieve a personalized home environment.
EMPLOYEES: Employees of The Scarlet Tassel will enjoy a friendly, fair and creative work environment, which respects diversity, new ideas and hard work. Development through experience and training will be a primary focus. It is our desire that employees are long-term ensuring an expertise that will support the customer experience.
6.2 Marketing Strategy
In addition to price and item promotional announcements, The Scarlet Tassel will focus its marketing efforts via several key direct-to-consumer advertising vehicles:
Local and Regional Magazine Publications: Each of these advertising vehicles provides a demographic base that lines up nicely with that of The Scarlet Tassel.
Direct Mail Postcards: The Scarlet Tassel will look to increase consumer awareness, retain the existing customer base and promote increased sales via seasonal postcard mailings. These mailings will be targeted around special events and are intended to liquidate slow moving products or showcase vendor negotiated specials.
- Spring Open House–15% to 20% savings opportunity.
- Fall Open House–15% to 20% savings opportunity.
- Holiday Open House–15% to 20% savings opportunity.
- Annual Anniversary Postcard–promotes in-store design seminars, special events and savings opportunities.
Website Marketing: As we establish our e-commerce business segment during Year Three of operation, we will support the business via search engine marketing, banner advertising, URL links and e-mail marketing on all correspondence. This third channel of business will increase the customer base, sales potential and service opportunities provided by The Scarlet Tassel.
6.2.1 Promotion Strategy
The Scarlet Tassel will leverage its expertise, product offerings and marketing strategy to increase its customer base while driving sales and profit. The following sections review the various strategies that will support this effort.
6.3 Sales Strategy
THE CUSTOMER
The Scarlet Tassel will approach sales from a salesperson-customer relationship basis. All sales associates will be trained and encouraged to assist customers in a personal manner, utilizing first names and asking the questions needed to provide the customers with the services they desire. Gathering key customer information and seeking performance feedback on the products and services offered will assist us in the following ways:
- Targeting our marketing efforts more effectively.
- Developing product offers and merchandising formats that will increase sales.
- Developing services that enhance the shopping experience.
- Training and developing sales associates in order to effectively service the customer.
- Increase awareness of The Scarlet Tassel within the retail consumer marketplace.
- Develop future sales opportunities that allow for continued growth of the business.
THE PRODUCT
In order to provide the customer with the most up-to-date home decorative and gift products on the market, we will attend international tradeshows which showcase all of the products manufactured within this category of business. Attending market will not only allow us to ensure our product offer is current and up-to-date but will provide us with fresh, new store merchandising and display ideas.
To stay abreast of market and product trends, we will utilize the following trade publications to reinforce and expand our knowledge base:
- Giftware News
- Home Accents Today
- Home Decor Buyer
- Residential Lighting
- Accessory Merchandising
- Gifts and Decorative Accessories
- Greetings etc.
MERCHANDISING
Products will be showcased via lifestyle merchandising that inspires and promotes multiple purchases. We look to create a strong visual impact creating an invitation to touch and purchase.
PRICING
It is the goal of The Scarlet Tassel to offer style and quality at a value to the consumer. Our pricing structure will support a 55% gross margin and position us competitively within the marketplace. Seasonal promotional offers and annual anniversary sale events will encourage additional sales and multiple unit purchases.
OUR EMPLOYEES
Employees of The Scarlet Tassel are an integral part of the shopping experience for the customer. All employees will be developed for growth and advancement, and compensated fairly with effective training that will enable them to confidently service the customer.
TECHNOLOGY
As we enter the 21st century, proper technology is becoming key to meeting the customer’s expectations. The Scarlet Tassel has chosen Celerant Advanced Retail Management System (Celerant ARMS) as its retail management software. After careful consideration of Retail Pro and other well-known retail software programs, Celerant ARMS was chosen for its advanced real-time capabilities. Company-wide real-time data access in lieu of nightly polling or other end-of-day processes is a feature not offered by most software in this price point. With an eye towards the future, real-time will greatly enhance the experience of The Scarlet Tassel’s customer, especially in an Internet or multi-store environment, without an expensive software change.
Additional features include:
| Point-of-Sale | Transaction Tracking | Customer Management | Inventory Management |
| Customer transactions: receipts, gift certificates, special orders, gift registry Barcode scanning Price check Inventory lookups Gift receipts |
Track and review each register transaction Daily summaries by store and register |
Multiple ship-to addresses Preferences Advanced reporting: lazy/active customers, minimum purchases within inventory class, geographic |
Item entry: matrix, 12 customizable categories, unlimited barcodes Pricing: markdowns, price changes Physical counts |
| Purchase Orders & Receiving | Vendors | Analysis | Administration | Others |
| Quick receiving Order approval process |
Full contact management Multiple contacts for a single vendor Link multiple brands Link multiple remit to contacts for payable generation Track terms and payment |
Complete inventory performance profiling Ordering analysis Graphing Search multiple unrelated brands, classes, styles, etc. Exceptions based on: on-hand levels, sell-thru performance, sales performance, aging Data export to excel |
Store management: centralized administration from a single location Employees: complete rights-based security |
Return Authorizations |
6.3.1 Sales Forecast
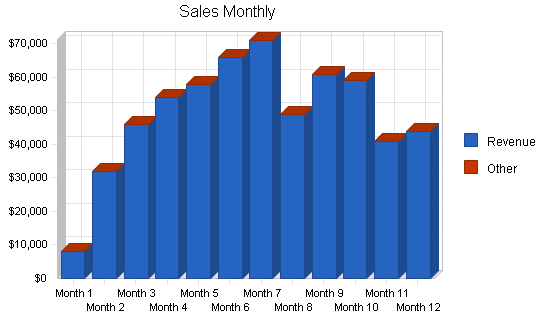
The Sales Forecast, as detailed in the table and charts following, is based on The Scarlet Tassel’s planned retail space of 3,500 square feet and the average $ sales per square foot expected. All revenues in the forecast are from direct retail sales and do not include any miscellaneous income. Monthly sales, as noted in the Appendix, have been adjusted to reflect the “valleys” that the retail business is noted for. Dips in sales are expected, in particular, for the months of January, February, and March.
Quarterly sales are expected to be driven by each major category as follows, and will be enhanced with sales supporting seasonal holidays or gift giving occasions as noted below:
1st Quarter
Holiday Clearance, Valentines Day, Easter
70% – Decorative Accessories
3% – Accent Furniture
6% – Wall Decor
2% – Home Textiles
7% – Special Occasion Gifts
5% – Personal Accessories
3% – Seasonal Decor
4% – Garden Decor
2nd Quarter
Mother’s Day, Father’s Day, Memorial Day, 4th of July
70% – Decorative Accessories
3% – Accent Furniture
5% – Wall Decor
2% – Home Textiles
8% – Special Occasion Gifts
5% – Personal Accessories
3% – Seasonal Decor
4% – Garden Decor
3rd Quarter
Labor Day
70% – Decorative Accessories
4% – Accent Furniture
6% – Wall Decor
2% – Home Textiles
8% – Special Occasion Gifts
5% – Personal Accessories
2% – Seasonal Decor
3% – Garden Decor
4th Quarter
Halloween, Thanksgiving, Christmas, New Year’s
70% – Decorative Accessories
4% – Accent Furniture
4% – Wall Decor
3% – Home Textiles
8% – Special Occasion Gifts
5% – Personal Accessories
4% – Seasonal Decor
2% – Garden Decor
Growth rates for Years One through Three are planned as follows:
- 2003 to 2004 (Year One) – $179 per square foot
- 2004 to 2005 (Year Two) – $237 per square foot; 32.40% growth
- 2005 to 2006 (Year Three) – $284 per square foot; 19.83%% growth
With the industry average estimated at $300 per square foot, growth planned is attainable. In spite of the economic unpredictability we are experiencing, these projections are supported by the continued strength in the Atlanta home decor market. Source: Home Accents Today, Spring 2002

| Sales Forecast | |||
| Year 1 | Year 2 | Year 3 | |
| Sales | |||
| Revenue | $589,000 | $829,000 | $995,000 |
| Other | $0 | $0 | $0 |
| Total Sales | $589,000 | $829,000 | $995,000 |
| Direct Cost of Sales | Year 1 | Year 2 | Year 3 |
| Inventory | $217,930 | $306,730 | $368,150 |
| Inbound Freight | $47,120 | $66,320 | $79,600 |
| Other | $0 | $0 | $0 |
| Subtotal Direct Cost of Sales | $265,050 | $373,050 | $447,750 |
6.4 Milestones
The following table lists important milestones, with dates and persons primarily responsible for planning, as well as budgets where applicable. Mentioned by first name in the table are a few persons whose expertise in their field of work are required to make The Scarlet Tassel a reality. They include:
- Bob Levine – Real Estate Agent, Coldwell Banker Commercial
- Jeff Burkholder – Graphic Artist, Burkholder Designs
- Victor Moldovan, ASID – Store Planner & Designer, Moldovan Interior Design
- Barry Brouner, CPA – Accounting & Tax Consulting
- Steve Anderson – Attorney, Anderson & Dailey

| Milestones | |||||
| Milestone | Start Date | End Date | Budget | Manager | Department |
| Business Entity Setup | 8/1/2002 | 9/1/2002 | $0 | Deirdre/Steve | Marketing |
| Shareholder Agreement Completed & Signed | 9/1/2002 | 10/1/2002 | $0 | Deirdre/Steve | Marketing |
| Corporate Bank Account Opened | 9/1/2002 | 9/1/2002 | $0 | Deirdre/Shelly | Finance |
| Business Plan Completed | 9/15/2002 | 10/1/2002 | $0 | Deirdre/Shelly | Marketing |
| Logo Design Completed | 9/15/2002 | 10/1/2002 | $0 | Shelly/Jeff | Marketing |
| Banks Interviewed for Financing | 10/1/2002 | 11/1/2002 | $0 | Deirdre/Shelly | Finance |
| Store Location Confirmed | 11/1/2002 | 12/1/2002 | $0 | Deirdre/Bob | Operations |
| Lease Agreement Negotiated & Signed | 12/1/2002 | 1/1/2003 | $0 | Deirdre/Bob | Operations |
| Initial Store Design & Plan Approved | 12/1/2002 | 1/1/2003 | $0 | Shelly/Victor | Marketing |
| Business Cards & Stationery Printed | 12/1/2002 | 1/1/2003 | $0 | Shelly | Marketing |
| Computers for Shelly & Deirdre Purchased | 12/1/2002 | 1/1/2003 | $0 | Deirdre | Operations |
| QuickBooks Purchase, Installation & Training | 1/1/2003 | 2/1/2003 | $0 | Deirdre | Finance |
| Advertising Developed | 1/1/2003 | 2/1/2003 | $0 | Shelly/Jeff | Marketing |
| Employee Handbook & Store Policies Developed | 1/1/2003 | 3/1/2003 | $0 | Deirdre | Operations |
| Prep & Distribution of Press Release | 1/1/2003 | 3/1/2003 | $0 | Shelly | Marketing |
| Atlanta International Gift Market & Rug Fair | 1/10/2003 | 1/13/2003 | $0 | Shelly | Merchandising |
| New York International Gift Show | 2/1/2003 | 2/6/2003 | $0 | Shelly | Merchandising |
| Buildout of Retail Space | 2/1/2003 | 4/1/2003 | $0 | Deirdre/Shelly/Victor | Operations/Merchandising |
| Utilities, Insurance, Payroll Service Confirmed | 2/1/2003 | 4/1/2003 | $0 | Deirdre | Operations |
| Remaining Equipment Purchased | 2/1/2003 | 4/1/2003 | $0 | Deirdre | Operations |
| Celerant ARMS Purchase, Installation & Training | 2/1/2003 | 4/15/2003 | $0 | Deirdre | Operations |
| Employment Ad, Interviewing & Hiring | 3/1/2003 | 4/1/2003 | $0 | Deirdre | Operations |
| May Advertising Close Date | 3/1/2003 | 4/1/2003 | $0 | Shelly | Marketing |
| GWEN Conference | 3/12/2003 | 3/13/2003 | $0 | Deirdre | Operations |
| Store Occupancy Date | 4/1/2003 | 4/1/2003 | $0 | Deirdre/Bob | Operations |
| Receive Product | 4/1/2003 | 4/17/2003 | $0 | Deirdre | Operations |
| June Advertising Close Date | 4/1/2003 | 5/1/2003 | $0 | Shelly | Marketing |
| Merchandise Store | 4/18/2003 | 4/24/2003 | $0 | Shelly/Victor | Merchandising |
| Store Opening | 4/25/2003 | 4/25/2003 | $0 | All Employees | All Departments |
| Press Reception | 5/15/2003 | 5/15/2003 | $0 | Shelly | Marketing |
| Store Grand Opening Gala Event | 5/16/2003 | 5/17/2003 | $0 | Shelly | Marketing |
| Totals | $0 | ||||
Management Summary
The Scarlet Tassel has a very strong, experienced and professional management team in co-owners Deirdre Staab and Shelly Dozier-Mckee, with 36 years of combined experience. Each brings to the business their own area of expertise leaving few gaps of knowledge.
Shelly Dozier-Mckee, Co-Owner/Manager – Merchandising & Marketing
Shelly has spent 17 years in the retail and catalog industry, with direct experience in men’s and women’s apparel, footwear, personal accessories, gifts and home decor. She spent 10 years with a large-scale industry-leading international retail and catalog company in the Seattle area. Her extensive background has included positions such as buyer, senior buyer, director of merchandising and general merchandise manager. She has been responsible for strategic planning and business management for business segments generating in excess of $400 million annually, including new business development and implementation. Additionally, Shelly has five years of off-shore sourcing and product development experience. Having spent extensive time in the home decorative marketplace, she is very familiar with the product lines, vendor base and business elements utilized within the home decorative industry. Shelly has a Bachelor of Arts degree from Washington State University, is married, 40 years old and a homeowner in the Smyrna, Georgia area.
Deirdre Staab, Co-Owner/Manager – Operations & Finance
Deirdre is a 19 year veteran of the catalog industry, with direct experience in footwear, personal accessories, gifts and home decor. Her background has included positions such as buyer, purchasing manager, operations manager and senior manager of purchasing & operations. Deirdre’s experience has crossed many diverse areas of responsibility including corporate strategic planning, policy and procedural development, merchandising, purchasing, forecasting, vendor management and compliance, third party warehouse and call center operations, transportation and managing software development in a proprietary system environment. Deirdre’s recognized expertise in inventory management and forecasting has afforded her the honor of being selected as a session panelist at both the 2001 National Conference for Operations & Fulfillment and also at the 2000 Direct Marketing Association’s 17th Annual Catalog Conference & Exhibition. Deirdre has a Bachelor of Science degree from the University of North Carolina at Greensboro, is married, 41 years old and a homeowner in the Smyrna, Georgia area.
Decision-making will be divided as follows:
Shelly Dozier-McKee
Merchandising & Store Planning
Marketing & Advertising
Workshop Development & Instruction
Web Development: Front End
Deirdre Staab
Purchasing & Numerical Analysis
Operations & Accounting
Software & Computer Systems
Web Development: Back End
Shared
Hiring, Employee Development & Policies
Customer Services & Policies
7.1 Personnel Plan
The Scarlet Tassel store hours are planned Monday through Saturday, 10:00 a.m. to 6:00 p.m. and Sunday, 12:00 p.m. to 5:00 p.m.. The Scarlet Tassel will not be open in the evenings unless a workshop or other customer event is taking place. The Personnel Plan, as detailed in the table following, has been developed to support these store hours and expected volumes as per the Sales Forecast section.
Assumptions regarding personnel have been made for Year One through Year Three as follows:
- Year One Ending March, 2004 – Owners, Deirdre Staab and Shelly Dozier-Mckee, will not take a salary the first three months – April, May and June 2003. Starting in July, their salaries will begin to increase incrementally, every two months, until the planned annual salary is reached by January of 2004. One full-time employee and one permanent part-time employee will be hired to start work the first week of April 2003. One temporary part-time employee will be hired to work through the Holiday season – October, November and December 2003. It should be noted that the full-time employee hired is expected to have retail management experience or have enough experience to be considered promotable to assistant manager or manager within a few years, hence, the higher starting salary. The support of a trusted and experienced employee will be needed to enable Deirdre and Shelly to be away from the store when necessary to shop the markets for product. As well, the ability to promote from within supports The Scarlet Tassel’s pledge to its employees. The permanent part-time employee will be hired at the Atlanta average of $10.00 per hour and the temporary part-time employee will be hired at $9.00 per hour. Atlanta Average Source: Atlanta Magazine, Salaries Survey 2002
- Year Two Ending March, 2005 – Salaries for Deirdre and Shelly will increase beginning in July 2004. Current full-time and part-time employees will be provided salary reviews and given appropriate salary increases – 4% has been factored in. A second permanent part-time employee will be hired in July 2004 at the Atlanta average for retail of $10.00 per hour. Atlanta Average Source: Atlanta Magazine, Salaries Survey 2002
- Year Three Ending March, 2006 – Salaries for Deirdre and Shelly will be maintained at their current level. Current full-time and part-time employees will be provided salary reviews and given appropriate salary increases – 4% has been factored in. A second full-time employee will be hired in April 2005, and a temporary part-time employee will be hired for the Holiday season, if needed.
| Personnel Plan | |||
| Year 1 | Year 2 | Year 3 | |
| Co-Owner/Manager–Merchandising & Marketing | $22,506 | $37,500 | $60,000 |
| Co-Owner/Manager–Operations & Finance | $22,506 | $37,500 | $60,000 |
| Full-Time Sales Associate / Manager Trainee | $30,000 | $32,000 | $35,000 |
| Full-Time Sales Associate | $0 | $13,402 | $26,000 |
| Part-Time Sales Associate | $15,776 | $16,410 | $17,063 |
| Part-Time Sales Associate | $0 | $11,875 | $12,350 |
| Part-Time Sales Associate / Holiday Temp | $3,549 | $3,904 | $4,294 |
| Total People | 4 | 5 | 7 |
| Total Payroll | $94,337 | $152,591 | $214,707 |
Financial Plan
The Scarlet Tassel’s financial plan makes some critical assumptions that will determine the potential for future success.
- The Economy. This could not be a better time to start a business as the economy reaches its lowest point of the business cycle and begins its trek back up. Consumer spending is up. “The Commerce Department reported consumers had increased their spending by 1% in July, the largest advance in nine months.” Source: The Wall Street Journal, “In Uneasy Times, Consumers Boost a Fragile U.S. Economy”, September 3, 2002
- Owner Experience. A shorter learning curve will be brought to the business by Deirdre and Shelly due to their extensive backgrounds and in-depth market knowledge.
- Managed Costs. A clear understanding of the need to manage costs and forecast future needs so that the business is not “broad-sided” by the unexpected.
- Wise Purchases. Finding the right product, at the right price will enable the business to meet planned margins and maintain inventory at an attractive level with a high turn rate.
8.1 Projected Profit and Loss
The projected Profit and Loss for three years is detailed in the table and charts following. Monthly projected Profit and Loss for Year One is available in the Appendix. Some assumptions and inclusions to be noted are:
- Accounting and Legal includes: CPA, attorney and payroll service costs.
- Insurance includes: Business property, liability and interruption and key person life insurance. Health Insurance as an employee benefit will be considered in Year Three and is reflected as such.
- Miscellaneous includes: Bank account fees, employment advertising, software maintenance, Web hosting, annual Internet name registration, software upgrades, annual search engine registration when applicable, off-site data backup, and other.
- Merchant Fees assume 80% of total revenue is in credit card sales and are calculated at 2.5%.
- Outbound Freight increases Year Two due to improved RTV procedures. Additional increases in Year Three are expected due to the development of the Web and the outbound shipping that will result from an e-commerce business.
- Rent assumes 3,500 square feet of retail space is charged at fixed per square cost foot plus taxes, maintenance and insurance.
- Payroll taxes and workman’s compensation were calculated at 12% of payroll.
- A 3% inflation factor was applied to select operation expenses for Years Two and Three.
- Marketing and advertising has been maintained for all three years at approximately 4.5% to 6.5% of total revenue.
- Travel costs were increased by 20% in Years Two and Three based on the assumption that the state of the airline and hotel industries will recover from the current economic trends and react with increased rates and as well, to allow for an additional employee to travel if needed.


| Pro Forma Profit and Loss | |||
| Year 1 | Year 2 | Year 3 | |
| Sales | $589,000 | $829,000 | $995,000 |
| Direct Cost of Sales | $265,050 | $373,050 | $447,750 |
| Other Production Expenses | $0 | $0 | $0 |
| Total Cost of Sales | $265,050 | $373,050 | $447,750 |
| Gross Margin | $323,950 | $455,950 | $547,250 |
| Gross Margin % | 55.00% | 55.00% | 55.00% |
| Expenses | |||
| Payroll | $94,337 | $152,591 | $214,707 |
| Travel | $9,900 | $10,680 | $12,816 |
| Depreciation | $19,726 | $19,726 | $19,726 |
| Dues & Subscriptions | $729 | $802 | $882 |
| Entertainment | $700 | $721 | $743 |
| Insurance | $2,552 | $2,617 | $9,885 |
| Marketing and Advertising | $39,113 | $44,979 | $51,726 |
| Merchant Fees | $11,780 | $16,580 | $19,900 |
| Miscellaneous | $2,268 | $3,330 | $3,563 |
| Outbound Freight | $600 | $1,200 | $4,203 |
| Rent | $97,992 | $102,892 | $108,036 |
| Repairs & Maintenance | $600 | $618 | $637 |
| Supplies–Office, POS, Giftwrap, Packaging | $2,706 | $3,247 | $3,897 |
| Taxes–Other and Licenses | $1,595 | $1,700 | $1,850 |
| Telephone and Utilities | $10,116 | $10,419 | $10,732 |
| Payroll Taxes | $14,151 | $22,889 | $32,206 |
| Other | $3,600 | $4,000 | $4,500 |
| Total Operating Expenses | $312,464 | $398,991 | $500,010 |
| Profit Before Interest and Taxes | $11,486 | $56,959 | $47,240 |
| EBITDA | $31,212 | $76,685 | $66,967 |
| Interest Expense | $11,884 | $10,272 | $8,424 |
| Taxes Incurred | $0 | $14,006 | $11,645 |
| Net Profit | ($398) | $32,681 | $27,172 |
| Net Profit/Sales | -0.07% | 3.94% | 2.73% |
8.2 Break-even Analysis
The Break-even Analysis in the table and chart following illustrate the number of units and retail sales that The Scarlet Tassel must make to break-even each month.

| Break-even Analysis | |
| Monthly Revenue Break-even | $47,343 |
| Assumptions: | |
| Average Percent Variable Cost | 45% |
| Estimated Monthly Fixed Cost | $26,039 |
8.3 Projected Cash Flow
The projected Cash Flow for three years is detailed in the table and chart following. Monthly projected Cash Flow for Year One is available for review in the Appendix.
It should be noted that The Scarlet Tassel expects to operate on a cash basis with vendors the first year, hence, no Accounts Payable for the first year. As credit is established with vendors, it is assumed that in the second year 40% to 50% of monies owed to vendors will be reflected in Accounts Payable. It is further assumed that in the third year 70% to 80% of monies owed to vendors will appear in Accounts Payable.

| Pro Forma Cash Flow | |||
| Year 1 | Year 2 | Year 3 | |
| Cash Received | |||
| Cash from Operations | |||
| Cash Sales | $589,000 | $829,000 | $995,000 |
| Subtotal Cash from Operations | $589,000 | $829,000 | $995,000 |
| Additional Cash Received | |||
| Sales Tax, VAT, HST/GST Received | $41,230 | $58,030 | $69,650 |
| New Current Borrowing | $0 | $0 | $0 |
| New Other Liabilities (interest-free) | $0 | $0 | $0 |
| New Long-term Liabilities | $0 | $0 | $0 |
| Sales of Other Current Assets | $0 | $0 | $0 |
| Sales of Long-term Assets | $0 | $0 | $0 |
| New Investment Received | $0 | $0 | $0 |
| Subtotal Cash Received | $630,230 | $887,030 | $1,064,650 |
| Expenditures | Year 1 | Year 2 | Year 3 |
| Expenditures from Operations | |||
| Cash Spending | $559,682 | $806,939 | $949,328 |
| Bill Payments | $0 | $0 | $0 |
| Subtotal Spent on Operations | $559,682 | $806,939 | $949,328 |
| Additional Cash Spent | |||
| Sales Tax, VAT, HST/GST Paid Out | $41,230 | $58,030 | $69,650 |
| Principal Repayment of Current Borrowing | $0 | $0 | $0 |
| Other Liabilities Principal Repayment | $0 | $0 | $0 |
| Long-term Liabilities Principal Repayment | $13,833 | $16,682 | $18,520 |
| Purchase Other Current Assets | $0 | $5,000 | $8,521 |
| Purchase Long-term Assets | $0 | $0 | $0 |
| Dividends | $0 | $0 | $0 |
| Subtotal Cash Spent | $614,745 | $886,651 | $1,046,020 |
| Net Cash Flow | $15,485 | $379 | $18,630 |
| Cash Balance | $43,583 | $43,962 | $62,591 |
8.4 Pro Forma Balance Sheet
The projected Balance Sheet for three years is detailed in the table following. Monthly projections for the first year Balance Sheet are available for review in the Appendix. Planned numbers show that liabilities are expected to decrease approximately 40% by the end of Year Three, increasing owner’s equity and net worth.
| Pro Forma Balance Sheet | |||
| Year 1 | Year 2 | Year 3 | |
| Assets | |||
| Current Assets | |||
| Cash | $43,583 | $43,962 | $62,591 |
| Inventory | $21,780 | $52,127 | $53,353 |
| Other Current Assets | $3,000 | $8,000 | $16,521 |
| Total Current Assets | $68,363 | $104,088 | $132,466 |
| Long-term Assets | |||
| Long-term Assets | $83,775 | $83,775 | $83,775 |
| Accumulated Depreciation | $19,726 | $39,452 | $59,178 |
| Total Long-term Assets | $64,049 | $44,323 | $24,597 |
| Total Assets | $132,412 | $148,411 | $157,063 |
| Liabilities and Capital | Year 1 | Year 2 | Year 3 |
| Current Liabilities | |||
| Accounts Payable | $0 | $0 | $0 |
| Current Borrowing | $0 | $0 | $0 |
| Other Current Liabilities | $0 | $0 | $0 |
| Subtotal Current Liabilities | $0 | $0 | $0 |
| Long-term Liabilities | $106,167 | $89,485 | $70,965 |
| Total Liabilities | $106,167 | $89,485 | $70,965 |
| Paid-in Capital | $50,000 | $50,000 | $50,000 |
| Retained Earnings | ($23,357) | ($23,755) | $8,926 |
| Earnings | ($398) | $32,681 | $27,172 |
| Total Capital | $26,245 | $58,926 | $86,098 |
| Total Liabilities and Capital | $132,412 | $148,411 | $157,063 |
| Net Worth | $26,245 | $58,926 | $86,098 |
8.5 Business Ratios
The following table outlines some of the more important ratios from the {xxxxxxx} industry. The final column, Industry Profile, details specific ratios based on the industry as it is classified by the Standard Industry Classification (SIC) code, xxxx.
| Ratio Analysis | ||||
| Year 1 | Year 2 | Year 3 | Industry Profile | |
| Sales Growth | n.a. | 40.75% | 20.02% | 6.06% |
| 0 | ||||
| Percent of Total Assets | ||||
| Inventory | 16.45% | 35.12% | 33.97% | 36.38% |
| Other Current Assets | 2.27% | 5.39% | 10.52% | 32.54% |
| Total Current Assets | 51.63% | 70.14% | 84.34% | 86.35% |
| Long-term Assets | 48.37% | 29.86% | 15.66% | 13.65% |
| Total Assets | 100.00% | 100.00% | 100.00% | 100.00% |
| Current Liabilities | 0.00% | 0.00% | 0.00% | 33.24% |
| Long-term Liabilities | 80.18% | 60.30% | 45.18% | 14.50% |
| Total Liabilities | 80.18% | 60.30% | 45.18% | 47.74% |
| Net Worth | 19.82% | 39.70% | 54.82% | 52.26% |
| 0 | ||||
| Percent of Sales | ||||
| Sales | 100.00% | 100.00% | 100.00% | 100.00% |
| Gross Margin | 55.00% | 55.00% | 55.00% | 35.01% |
| Selling, General & Administrative Expenses | 14.27% | 1.29% | 21.52% | 15.32% |
| Advertising Expenses | 3.15% | 2.38% | 1.98% | 3.57% |
| Profit Before Interest and Taxes | 1.95% | 6.87% | 4.75% | 1.33% |
| 0 | ||||
| Main Ratios | ||||
| Current | 0.00 | 0.00 | 0.00 | 2.27 |
| Quick | 0.00 | 0.00 | 0.00 | 1.02 |
| Total Debt to Total Assets | 80.18% | 60.30% | 45.18% | 53.23% |
| Pre-tax Return on Net Worth | -1.52% | 79.23% | 45.08% | 4.06% |
| Pre-tax Return on Assets | -0.30% | 31.46% | 24.71% | 8.69% |
| Additional Ratios | Year 1 | Year 2 | Year 3 | |
| Net Profit Margin | -0.07% | 3.94% | 2.73% | n.a |
| Return on Equity | -1.52% | 55.46% | 31.56% | n.a |
| Activity Ratios | ||||
| Inventory Turnover | 10.07 | 10.10 | 8.49 | n.a |
| Accounts Payable Turnover | 0.00 | 0.00 | 0.00 | n.a |
| Payment Days | 0 | 0 | 0 | n.a |
| Total Asset Turnover | 4.45 | 5.59 | 6.34 | n.a |
| Debt Ratios | ||||
| Debt to Net Worth | 4.05 | 1.52 | 0.82 | n.a |
| Current Liab. to Liab. | 0.00 | 0.00 | 0.00 | n.a |
| Liquidity Ratios | ||||
| Net Working Capital | $68,363 | $104,088 | $132,466 | n.a |
| Interest Coverage | 0.97 | 5.55 | 5.61 | n.a |
| Additional Ratios | ||||
| Assets to Sales | 0.22 | 0.18 | 0.16 | n.a |
| Current Debt/Total Assets | 0% | 0% | 0% | n.a |
| Acid Test | 0.00 | 0.00 | 0.00 | n.a |
| Sales/Net Worth | 22.44 | 14.07 | 11.56 | n.a |
| Dividend Payout | 0.00 | 0.00 | 0.00 | n.a |
Appendix
| Sales Forecast | |||||||||||||
| Month 1 | Month 2 | Month 3 | Month 4 | Month 5 | Month 6 | Month 7 | Month 8 | Month 9 | Month 10 | Month 11 | Month 12 | ||
| Sales | |||||||||||||
| Revenue | 0% | $8,000 | $32,000 | $46,000 | $54,000 | $58,000 | $66,000 | $71,000 | $49,000 | $61,000 | $59,000 | $41,000 | $44,000 |
| Other | 0% | $0 | $0 | $0 | $0 | $0 | $0 | $0 | $0 | $0 | $0 | $0 | $0 |
| Total Sales | $8,000 | $32,000 | $46,000 | $54,000 | $58,000 | $66,000 | $71,000 | $49,000 | $61,000 | $59,000 | $41,000 | $44,000 | |
| Direct Cost of Sales | Month 1 | Month 2 | Month 3 | Month 4 | Month 5 | Month 6 | Month 7 | Month 8 | Month 9 | Month 10 | Month 11 | Month 12 | |
| Inventory | $2,960 | $11,840 | $17,020 | $19,980 | $21,460 | $24,420 | $26,270 | $18,130 | $22,570 | $21,830 | $15,170 | $16,280 | |
| Inbound Freight | $640 | $2,560 | $3,680 | $4,320 | $4,640 | $5,280 | $5,680 | $3,920 | $4,880 | $4,720 | $3,280 | $3,520 | |
| Other | $0 | $0 | $0 | $0 | $0 | $0 | $0 | $0 | $0 | $0 | $0 | $0 | |
| Subtotal Direct Cost of Sales | $3,600 | $14,400 | $20,700 | $24,300 | $26,100 | $29,700 | $31,950 | $22,050 | $27,450 | $26,550 | $18,450 | $19,800 | |
| Personnel Plan | |||||||||||||
| Month 1 | Month 2 | Month 3 | Month 4 | Month 5 | Month 6 | Month 7 | Month 8 | Month 9 | Month 10 | Month 11 | Month 12 | ||
| Co-Owner/Manager–Merchandising & Marketing | 0% | $834 | $834 | $834 | $834 | $834 | $1,667 | $1,667 | $2,500 | $2,500 | $3,334 | $3,334 | $3,334 |
| Co-Owner/Manager–Operations & Finance | 0% | $834 | $834 | $834 | $834 | $834 | $1,667 | $1,667 | $2,500 | $2,500 | $3,334 | $3,334 | $3,334 |
| Full-Time Sales Associate / Manager Trainee | 0% | $2,500 | $2,500 | $2,500 | $2,500 | $2,500 | $2,500 | $2,500 | $2,500 | $2,500 | $2,500 | $2,500 | $2,500 |
| Full-Time Sales Associate | 0% | $0 | $0 | $0 | $0 | $0 | $0 | $0 | $0 | $0 | $0 | $0 | $0 |
| Part-Time Sales Associate | 0% | $1,286 | $1,329 | $1,286 | $1,329 | $1,329 | $1,286 | $1,329 | $1,286 | $1,329 | $1,329 | $1,329 | $1,329 |
| Part-Time Sales Associate | 0% | $0 | $0 | $0 | $0 | $0 | $0 | $0 | $0 | $0 | $0 | $0 | $0 |
| Part-Time Sales Associate / Holiday Temp | 0% | $0 | $0 | $0 | $0 | $0 | $0 | $1,196 | $1,157 | $1,196 | $0 | $0 | $0 |
| Total People | 4 | 4 | 4 | 4 | 4 | 4 | 4 | 4 | 4 | 4 | 4 | 4 | |
| Total Payroll | $5,454 | $5,497 | $5,454 | $5,497 | $5,497 | $7,120 | $8,359 | $9,943 | $10,025 | $10,497 | $10,497 | $10,497 | |
| Pro Forma Cash Flow | |||||||||||||
| Month 1 | Month 2 | Month 3 | Month 4 | Month 5 | Month 6 | Month 7 | Month 8 | Month 9 | Month 10 | Month 11 | Month 12 | ||
| Cash Received | |||||||||||||
| Cash from Operations | |||||||||||||
| Cash Sales | $8,000 | $32,000 | $46,000 | $54,000 | $58,000 | $66,000 | $71,000 | $49,000 | $61,000 | $59,000 | $41,000 | $44,000 | |
| Subtotal Cash from Operations | $8,000 | $32,000 | $46,000 | $54,000 | $58,000 | $66,000 | $71,000 | $49,000 | $61,000 | $59,000 | $41,000 | $44,000 | |
| Additional Cash Received | |||||||||||||
| Sales Tax, VAT, HST/GST Received | 7.00% | $560 | $2,240 | $3,220 | $3,780 | $4,060 | $4,620 | $4,970 | $3,430 | $4,270 | $4,130 | $2,870 | $3,080 |
| New Current Borrowing | $0 | $0 | $0 | $0 | $0 | $0 | $0 | $0 | $0 | $0 | $0 | $0 | |
| New Other Liabilities (interest-free) | $0 | $0 | $0 | $0 | $0 | $0 | $0 | $0 | $0 | $0 | $0 | $0 | |
| New Long-term Liabilities | $0 | $0 | $0 | $0 | $0 | $0 | $0 | $0 | $0 | $0 | $0 | $0 | |
| Sales of Other Current Assets | $0 | $0 | $0 | $0 | $0 | $0 | $0 | $0 | $0 | $0 | $0 | $0 | |
| Sales of Long-term Assets | $0 | $0 | $0 | $0 | $0 | $0 | $0 | $0 | $0 | $0 | $0 | $0 | |
| New Investment Received | $0 | $0 | $0 | $0 | $0 | $0 | $0 | $0 | $0 | $0 | $0 | $0 | |
| Subtotal Cash Received | $8,560 | $34,240 | $49,220 | $57,780 | $62,060 | $70,620 | $75,970 | $52,430 | $65,270 | $63,130 | $43,870 | $47,080 | |
| Expenditures | Month 1 | Month 2 | Month 3 | Month 4 | Month 5 | Month 6 | Month 7 | Month 8 | Month 9 | Month 10 | Month 11 | Month 12 | |
| Expenditures from Operations | |||||||||||||
| Cash Spending | $20,364 | $27,214 | $50,703 | $49,872 | $54,110 | $56,846 | $62,008 | $37,752 | $59,818 | $53,262 | $38,113 | $49,621 | |
| Bill Payments | $0 | $0 | $0 | $0 | $0 | $0 | $0 | $0 | $0 | $0 | $0 | $0 | |
| Subtotal Spent on Operations | $20,364 | $27,214 | $50,703 | $49,872 | $54,110 | $56,846 | $62,008 | $37,752 | $59,818 | $53,262 | $38,113 | $49,621 | |
| Additional Cash Spent | |||||||||||||
| Sales Tax, VAT, HST/GST Paid Out | $560 | $2,240 | $3,220 | $3,780 | $4,060 | $4,620 | $4,970 | $3,430 | $4,270 | $4,130 | $2,870 | $3,080 | |
| Principal Repayment of Current Borrowing | $0 | $0 | $0 | $0 | $0 | $0 | $0 | $0 | $0 | $0 | $0 | $0 | |
| Other Liabilities Principal Repayment | $0 | $0 | $0 | $0 | $0 | $0 | $0 | $0 | $0 | $0 | $0 | $0 | |
| Long-term Liabilities Principal Repayment | $0 | $1,203 | $1,214 | $1,225 | $1,235 | $1,246 | $1,257 | $1,268 | $1,279 | $1,290 | $1,302 | $1,313 | |
| Purchase Other Current Assets | $0 | $0 | $0 | $0 | $0 | $0 | $0 | $0 | $0 | $0 | $0 | $0 | |
| Purchase Long-term Assets | $0 | $0 | $0 | $0 | $0 | $0 | $0 | $0 | $0 | $0 | $0 | $0 | |
| Dividends | $0 | $0 | $0 | $0 | $0 | $0 | $0 | $0 | $0 | $0 | $0 | $0 | |
| Subtotal Cash Spent | $20,924 | $30,657 | $55,137 | $54,877 | $59,405 | $62,712 | $68,235 | $42,451 | $65,367 | $58,682 | $42,285 | $54,014 | |
| Net Cash Flow | ($12,364) | $3,583 | ($5,917) | $2,903 | $2,655 | $7,908 | $7,735 | $9,979 | ($97) | $4,448 | $1,585 | ($6,934) | |
| Cash Balance | $15,734 | $19,316 | $13,400 | $16,303 | $18,958 | $26,866 | $34,601 | $44,580 | $44,484 | $48,932 | $50,517 | $43,583 | |
| Pro Forma Profit and Loss | |||||||||||||
| Month 1 | Month 2 | Month 3 | Month 4 | Month 5 | Month 6 | Month 7 | Month 8 | Month 9 | Month 10 | Month 11 | Month 12 | ||
| Sales | $8,000 | $32,000 | $46,000 | $54,000 | $58,000 | $66,000 | $71,000 | $49,000 | $61,000 | $59,000 | $41,000 | $44,000 | |
| Direct Cost of Sales | $3,600 | $14,400 | $20,700 | $24,300 | $26,100 | $29,700 | $31,950 | $22,050 | $27,450 | $26,550 | $18,450 | $19,800 | |
| Other Production Expenses | $0 | $0 | $0 | $0 | $0 | $0 | $0 | $0 | $0 | $0 | $0 | $0 | |
| Total Cost of Sales | $3,600 | $14,400 | $20,700 | $24,300 | $26,100 | $29,700 | $31,950 | $22,050 | $27,450 | $26,550 | $18,450 | $19,800 | |
| Gross Margin | $4,400 | $17,600 | $25,300 | $29,700 | $31,900 | $36,300 | $39,050 | $26,950 | $33,550 | $32,450 | $22,550 | $24,200 | |
| Gross Margin % | 55.00% | 55.00% | 55.00% | 55.00% | 55.00% | 55.00% | 55.00% | 55.00% | 55.00% | 55.00% | 55.00% | 55.00% | |
| Expenses | |||||||||||||
| Payroll | $5,454 | $5,497 | $5,454 | $5,497 | $5,497 | $7,120 | $8,359 | $9,943 | $10,025 | $10,497 | $10,497 | $10,497 | |
| Travel | $0 | $1,000 | $2,200 | $0 | $2,300 | $0 | $2,400 | $0 | $0 | $0 | $2,000 | $0 | |
| Depreciation | $1,644 | $1,644 | $1,644 | $1,644 | $1,644 | $1,644 | $1,644 | $1,644 | $1,644 | $1,644 | $1,644 | $1,644 | |
| Dues & Subscriptions | $122 | $0 | $0 | $234 | $0 | $0 | $175 | $0 | $0 | $198 | $0 | $0 | |
| Entertainment | $175 | $0 | $0 | $175 | $0 | $0 | $175 | $0 | $0 | $175 | $0 | $0 | |
| Insurance | $550 | $182 | $182 | $182 | $182 | $182 | $182 | $182 | $182 | $182 | $182 | $182 | |
| Marketing and Advertising | $2,225 | $6,263 | $2,763 | $2,763 | $4,763 | $2,763 | $2,763 | $3,263 | $2,763 | $2,763 | $2,763 | $3,263 | |
| Merchant Fees | 3% | $160 | $640 | $920 | $1,080 | $1,160 | $1,320 | $1,420 | $980 | $1,220 | $1,180 | $820 | $880 |
| Miscellaneous | $111 | $111 | $111 | $233 | $681 | $111 | $233 | $111 | $111 | $233 | $111 | $111 | |
| Outbound Freight | $50 | $50 | $50 | $50 | $50 | $50 | $50 | $50 | $50 | $50 | $50 | $50 | |
| Rent | $8,166 | $8,166 | $8,166 | $8,166 | $8,166 | $8,166 | $8,166 | $8,166 | $8,166 | $8,166 | $8,166 | $8,166 | |
| Repairs & Maintenance | $50 | $50 | $50 | $50 | $50 | $50 | $50 | $50 | $50 | $50 | $50 | $50 | |
| Supplies–Office, POS, Giftwrap, Packaging | $170 | $179 | $187 | $197 | $207 | $217 | $228 | $239 | $251 | $264 | $277 | $291 | |
| Taxes–Other and Licenses | $120 | $0 | $0 | $0 | $0 | $0 | $0 | $0 | $0 | $275 | $0 | $1,200 | |
| Telephone and Utilities | $843 | $843 | $843 | $843 | $843 | $843 | $843 | $843 | $843 | $843 | $843 | $843 | |
| Payroll Taxes | 15% | $818 | $825 | $818 | $825 | $825 | $1,068 | $1,254 | $1,491 | $1,504 | $1,575 | $1,575 | $1,575 |
| Other | $300 | $300 | $300 | $300 | $300 | $300 | $300 | $300 | $300 | $300 | $300 | $300 | |
| Total Operating Expenses | $20,958 | $25,748 | $23,688 | $22,238 | $26,667 | $23,833 | $28,241 | $27,262 | $27,108 | $28,394 | $29,277 | $29,051 | |
| Profit Before Interest and Taxes | ($16,558) | ($8,148) | $1,612 | $7,462 | $5,233 | $12,467 | $10,809 | ($312) | $6,442 | $4,056 | ($6,727) | ($4,851) | |
| EBITDA | ($14,914) | ($6,505) | $3,256 | $9,106 | $6,877 | $14,111 | $12,453 | $1,332 | $8,086 | $5,700 | ($5,083) | ($3,207) | |
| Interest Expense | $1,050 | $1,039 | $1,029 | $1,018 | $1,007 | $996 | $985 | $974 | $963 | $952 | $940 | $929 | |
| Taxes Incurred | $0 | $0 | $0 | $0 | $0 | $0 | $0 | $0 | $0 | $0 | $0 | $0 | |
| Net Profit | ($17,608) | ($9,188) | $583 | $6,444 | $4,226 | $11,470 | $9,824 | ($1,286) | $5,479 | $3,105 | ($7,667) | ($5,780) | |
| Net Profit/Sales | -220.10% | -28.71% | 1.27% | 11.93% | 7.29% | 17.38% | 13.84% | -2.63% | 8.98% | 5.26% | -18.70% | -13.14% | |
| Pro Forma Balance Sheet | |||||||||||||
| Month 1 | Month 2 | Month 3 | Month 4 | Month 5 | Month 6 | Month 7 | Month 8 | Month 9 | Month 10 | Month 11 | Month 12 | ||
| Assets | Starting Balances | ||||||||||||
| Current Assets | |||||||||||||
| Cash | $28,098 | $15,734 | $19,316 | $13,400 | $16,303 | $18,958 | $26,866 | $34,601 | $44,580 | $44,484 | $48,932 | $50,517 | $43,583 |
| Inventory | $31,770 | $28,170 | $15,840 | $22,770 | $26,730 | $28,710 | $32,670 | $35,145 | $24,255 | $30,195 | $29,205 | $20,295 | $21,780 |
| Other Current Assets | $3,000 | $3,000 | $3,000 | $3,000 | $3,000 | $3,000 | $3,000 | $3,000 | $3,000 | $3,000 | $3,000 | $3,000 | $3,000 |
| Total Current Assets | $62,868 | $46,904 | $38,156 | $39,170 | $46,033 | $50,668 | $62,536 | $72,746 | $71,835 | $77,679 | $81,137 | $73,812 | $68,363 |
| Long-term Assets | |||||||||||||
| Long-term Assets | $83,775 | $83,775 | $83,775 | $83,775 | $83,775 | $83,775 | $83,775 | $83,775 | $83,775 | $83,775 | $83,775 | $83,775 | $83,775 |
| Accumulated Depreciation | $0 | $1,644 | $3,288 | $4,932 | $6,575 | $8,219 | $9,863 | $11,507 | $13,151 | $14,795 | $16,438 | $18,082 | $19,726 |
| Total Long-term Assets | $83,775 | $82,131 | $80,487 | $78,843 | $77,200 | $75,556 | $73,912 | $72,268 | $70,624 | $68,980 | $67,337 | $65,693 | $64,049 |
| Total Assets | $146,643 | $129,035 | $118,644 | $118,013 | $123,233 | $126,223 | $136,447 | $145,014 | $142,460 | $146,659 | $148,473 | $139,504 | $132,412 |
| Liabilities and Capital | Month 1 | Month 2 | Month 3 | Month 4 | Month 5 | Month 6 | Month 7 | Month 8 | Month 9 | Month 10 | Month 11 | Month 12 | |
| Current Liabilities | |||||||||||||
| Accounts Payable | $0 | $0 | $0 | $0 | $0 | $0 | $0 | $0 | $0 | $0 | $0 | $0 | $0 |
| Current Borrowing | $0 | $0 | $0 | $0 | $0 | $0 | $0 | $0 | $0 | $0 | $0 | $0 | $0 |
| Other Current Liabilities | $0 | $0 | $0 | $0 | $0 | $0 | $0 | $0 | $0 | $0 | $0 | $0 | $0 |
| Subtotal Current Liabilities | $0 | $0 | $0 | $0 | $0 | $0 | $0 | $0 | $0 | $0 | $0 | $0 | $0 |
| Long-term Liabilities | $120,000 | $120,000 | $118,797 | $117,583 | $116,358 | $115,123 | $113,876 | $112,619 | $111,351 | $110,072 | $108,782 | $107,480 | $106,167 |
| Total Liabilities | $120,000 | $120,000 | $118,797 | $117,583 | $116,358 | $115,123 | $113,876 | $112,619 | $111,351 | $110,072 | $108,782 | $107,480 | $106,167 |
| Paid-in Capital | $50,000 | $50,000 | $50,000 | $50,000 | $50,000 | $50,000 | $50,000 | $50,000 | $50,000 | $50,000 | $50,000 | $50,000 | $50,000 |
| Retained Earnings | ($23,357) | ($23,357) | ($23,357) | ($23,357) | ($23,357) | ($23,357) | ($23,357) | ($23,357) | ($23,357) | ($23,357) | ($23,357) | ($23,357) | ($23,357) |
| Earnings | $0 | ($17,608) | ($26,796) | ($26,213) | ($19,768) | ($15,542) | ($4,072) | $5,752 | $4,465 | $9,944 | $13,049 | $5,381 | ($398) |
| Total Capital | $26,643 | $9,035 | ($153) | $430 | $6,875 | $11,101 | $22,571 | $32,395 | $31,108 | $36,587 | $39,692 | $32,024 | $26,245 |
| Total Liabilities and Capital | $146,643 | $129,035 | $118,644 | $118,013 | $123,233 | $126,223 | $136,447 | $145,014 | $142,460 | $146,659 | $148,473 | $139,504 | $132,412 |
| Net Worth | $26,643 | $9,035 | ($153) | $430 | $6,875 | $11,101 | $22,571 | $32,395 | $31,108 | $36,587 | $39,692 | $32,024 | $26,245 |

