
JTB Technologies
Executive Summary
JTB Technologies, Inc., is a holding company for three separate sub-corporations, with related but distinct products, services, markets and opportunities. This business plan consolidates the three sub-divisions of the JTB business plan into a well-balanced offering of high quality customer service, branded, well-accepted industrial products, and our own lines of specialty products and secondary services to compliment each division’s efforts. JTB can begin operations within 45 days of funding, as a corporation under the Laws of the Commonwealth of Louisiana. The current plan calls for opening each subcorporation and the holding company all within the same location, to facilitate employee and management training, accounting procedures, and inventory management.
JTB Industrial Sales Division will distribute high-quality Industrial-related products and services to local and national clients in the Automotive and Aerospace Industries, Primary Metals and Machining Industries, Mining and Contractor Industries, and in the Military and Governmental procurement sector.
JTB Products and Services Division will design custom tools tailored to the Automotive, Auto Repair, Sports Service, and Commercial Drilling Industries. Additionally, this division will also provide re-conditioning services to clients using our quality products from the JTB product line. To maximize the equipment and output of the location, this division will be situated within the same building as the other divisions, making it able to service the distributorship’s clients.
JTB Integrated Technologies Division will develop and support a full line of P.C. and Internet-based business (software) applications. Additionally, JTB will develop and support ad-based Internet marketplaces, on-line magazines, custom-developed commercial websites, and other hosted business products tailored to the Industrial marketplace.
To maximize profitability, JTB Technologies, Inc. will consolidate all of its operations into one location. JTB’s divisions will be located in Richfield, Louisiana. This location is very close to the I-82 corridor, providing excellent access to the Mississippi, Arkansas and Texas industrial markets. JTB’s management acquired its roots in the industrial marketplace while managing RL&I Tool and Machine, Inc., a privately held corporation that operated in Missouri for over twenty-five years.
Special points of interest about this corporation include:
- High percentage of minority ownership will allow the business to participate in special-interest contract bids, special employee-training grant procurement, and state offered business development bond offerings.
- The ability of management to work towards developing other avenues of business, including Military and other governmental procurement fulfillment.
Based on the current prices in the Industrial Products and Services market, JTB Technologies, Inc has the potential of making sales of $1,008,798 by year two of the plan. With good management, a revenue growth of 29% annually is expected.
The equity for each investor will be based on his or her investment.

1.1 Mission
JTB will develop and offer only the highest quality products and services.
- Our products will reduce customers’ costs, and have a longer life than the competitors’ products.
- Our re-manufacturing services will also offer the client a solid, value-based purchase backed by a 100% quality commitment and effort by our employees and management.
Using JTB’s own manufacturing facility as a model and test bed for our products, JTB will provide the mid-sized corporate market with new and exciting ways to cost effectively manage all external vendor and customer transactions, yielding continual savings for the users of our products and services. Our manufacturing partners will also add value to our offering of services, further allowing JTB to grow into a high-quality, long-term growth corporation.
1.2 Keys to Success
- Seasoned management with over twenty years of business experience in Industrial Distribution and Metalworking.
- Focused and well-defined long-range goals for longevity. Our plan has been developed to allow flexibility and growth.
- Strong project-management staffing with extensive prior Engineering experience, providing clients with product and service support in an industrial setting.
- Strong marketing goals with niche products and services; targeted services and products delivered with unique marketing approaches.
- Very low internal development costs at startup. Management is well-suited to oversee and develop all projects described in this business plan, limiting pre-production expenses by utilizing industry partnerships to lower the initial costs to bring its services and products to market.
- Previous base of high-quality external support vendors available to build on, with over twenty years of industry contacts to work with, in both the purchasing of quality products, and also in the marketing of our own products.
- Previous successful business plans and experience to draw from. Management’s previous business plan helped in closing an SBA package valued at $240,000 for the acquisition of C.N.C manufacturing equipment. Management will implement and perfect all aspects of the business plan, expecting that a great deal of its own creativity, positive attitude, and energy will be brought into all of the required projects.
1.3 Objectives
Our primary objectives are to:
- Integrate our products and services into the desired marketplaces.
- Utilize our technology products to gain market share.
- Resell this technology and its required support services.
- Provide our clients with high-quality products and services while maintaining high profitability.
Company Summary
JTB Technologies is a holding company for the following three sub-corporations:
- JTB Industrial Sales Division (Sales and Distribution)
- JTB Products and Services Division (Engineering and Manufacturing)
- JTB Integrated Technologies (Marketing Technologies)
JTB Technologies, Inc. will be located in Richfield, Louisiana. This location is very close to the I-82 corridor, providing excellent access to the Mississippi, Arkansas and Texas industrial markets. JTB’s management acquired its roots in the industrial marketplace while managing RL&I Tool and Machine, Inc., a privately held corporation that operated in Missouri for over twenty-five years.
Further experience was also acquired while managing RL&I’s industrial supply division of RL&I Tool and Machine. In late 1999 the Missouri corporation was closed and the management shown in this plan relocated here to Louisiana. Prior to leaving Missouri, Technical Marketing Technologies LLC, a spin-off of the Missouri based corporation was established, and operates as a sole proprietorship here in Louisiana. With our roots firmly planted in the Industrial marketplace, JTB will provide Industrial and Commercial Tools, Safety Products, and Engineered Sales expertise.
The primary partners in this plan are responsible for all phases of business and product development with special emphasis on bringing the latest in computer design into the business. With our roots firmly planted in the Industrial Products and services market JTB will provide Industrial and Commercial Tools, Re-manufacturing Services and engineering expertise acquired over the last twenty-five years while working with the following business types:
- Automotive – Automotive repair, and Auto body industry.
- Automotive – Auto Makers, and their support industries.
- Primary Metals – Machining Industry – Turbine, Valve, Specialty Manufacturers, and Machining industries.
- Sporting Goods Industry – Sporting Goods manufacturers, and Services industries.
- Mining and Contractor Industry – Hole drilling and Utility service providers
In addition to providing these clients with industrial products, JTB’s sub-divisions will also provide technical expertise, engineering assistance and all types of outsourced industrial services. JTB’s services division will be utilized for these services in many cases.
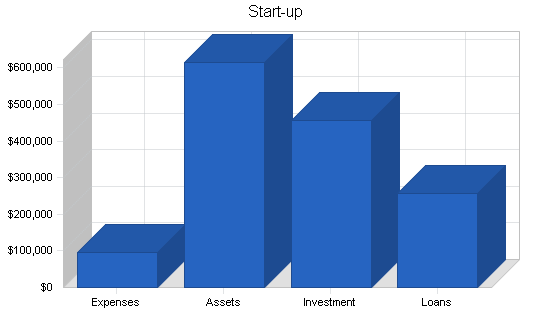
2.1 Start-up Summary
Initial startup will consist of moving Technical Marketing Technologies, LLC from its present location into a nearby 3,500 sq. ft. commercial facility. 1,000 sq. ft. of sales office area, and 2,500 sq. ft. of production space with provisions for further expansion when needed.

Once this is done, Mr. Jeremy will re-establish all of his previous industrial business contacts to develop a well-rounded offering of products for immediate resale. This will include several catalog offerings with over 50,000 products each. A stock list will also be compiled of the major items to be offered adding more customer support value to the business.
In the production area, approximately $125,000 of machinery allowing the firm to produce its products and services will be added. We will include both manually-operated and computer-controlled equipment, depending on availability. At present, the machine tool market has an excess of available equipment which is driving down the costs to purchase these items down considerably.
During this time (within the initial 60 days of startup), several contract-based developers will be added to begin develop of the internet based software, to later drive the inventory-sharing and customer-interactivity aspects of the business.
We anticipate that within 18 months, the business will be at a level to attract further investment, and will be able to buy out its initial investors.
To achieve our objectives, we are seeking $253,150 in loan financing, and an additional $455,000 of investment. These loan will be paid from the cash flow of the business, and will be secured by the assets of the company, and backed by the character, experience and personal guarantees of the owners. Investors will receive dividends as outlined in the plans for each sub-corporation.
| Start-up | |
| Requirements | |
| Start-up Expenses | |
| Legal | $5,400 |
| Stationery etc. | $1,600 |
| Brochures | $11,500 |
| Headhunter Fees (IT Div.) | $2,000 |
| Consultants | $9,000 |
| Insurance | $2,250 |
| Rent | $2,250 |
| Research and Development | $18,000 |
| Patent Process | $18,000 |
| Computers, Office Equipment, Software | $18,700 |
| Accounting System | $3,500 |
| Demo Models | $1,200 |
| Office Supplies | $2,500 |
| Total Start-up Expenses | $95,900 |
| Start-up Assets | |
| Cash Required | $496,250 |
| Start-up Inventory | $22,000 |
| Other Current Assets | $17,000 |
| Long-term Assets | $79,500 |
| Total Assets | $614,750 |
| Total Requirements | $710,650 |
| Start-up Funding | |
| Start-up Expenses to Fund | $95,900 |
| Start-up Assets to Fund | $614,750 |
| Total Funding Required | $710,650 |
| Assets | |
| Non-cash Assets from Start-up | $118,500 |
| Cash Requirements from Start-up | $496,250 |
| Additional Cash Raised | $0 |
| Cash Balance on Starting Date | $496,250 |
| Total Assets | $614,750 |
| Liabilities and Capital | |
| Liabilities | |
| Current Borrowing | $0 |
| Long-term Liabilities | $253,150 |
| Accounts Payable (Outstanding Bills) | $2,500 |
| Other Current Liabilities (interest-free) | $0 |
| Total Liabilities | $255,650 |
| Capital | |
| Planned Investment | |
| Investment- Industrial Sales Div | $0 |
| Investment- Ind Products and Services Div | $230,000 |
| Investment- Integrated Tech Div | $225,000 |
| Additional Investment Requirement | $0 |
| Total Planned Investment | $455,000 |
| Loss at Start-up (Start-up Expenses) | ($95,900) |
| Total Capital | $359,100 |
| Total Capital and Liabilities | $614,750 |
| Total Funding | $710,650 |
2.2 Company Locations and Facilities
JTB will initially work from its Richfield, Louisiana location, After year 5 of this plan, it may be advantageous for JTB to open 3 additional marketing and support offices in the U.S to help expand its services and product support. These offices can be situated as SOHO businesses providing very low costs of operations for JTB, while still doing a proper job in supporting our products.
If the right individuals are sough out, there also may be additional opportunity for them to sell our services and build customer bases of their own allowing our manufacturing and distribution divisions the ability to pursue these new clients as well.
2.3 Company Ownership
JTB will be a privately held corporation co-owned by Rachel L. Jeremy and her husband, Mitchell R. Jeremy. Rachel Jeremy has 10 years experience in production management, and customer services acquired while she worked with RL&I Tool and Machine, Inc where she was also the Secretary for that corporation. Rachel will also add a large percentage to the minority owned shares, allowing the firm to participate in larger contracts requiring minority involvement.
Mitchell R. Jeremy owns and operates Technical Marketing Technologies LLC, a technology and marketing consulting firm. Mr. Jeremy is an innovator with over 25 years of technical experience in the Industrial market with an additional 15 years of integrating computers and other technologies into the manufacturing and distribution of industrial products. Mr. Jeremy has a proven track record of success in launching new business projects and directing operations for a previous Missouri-based corporation as President of RL&I Tool and Machine, Inc.
A percentage of the stock and royalties from our products will be offered to the initial investors.
Products and Services
Over the last five years, Rachel and Mitchell Jeremy have been focusing on customer relation management issues pertaining specifically to how small- to medium-sized industrial distributors, manufacturers, and service related industries interact with their clients via the Internet. For many years, we have also seen a niche in helping the above-mentioned businesses with their product presentations, internal customer management, and external job costing.
One primary objective is to develop P.C.-based marketing and order processing systems, that allow compatibility with our clients’ existing accounting systems. When completed, their sales and order processing will be available online, and function as it did internally without interruption. In many cases, larger corporations are providing EDI services; with high end software and servers in place, these businesses can easily extend larger clients Inventory, Order Tracking, and Engineering Information. Our objective is to bring our version to market, making it possible for the smaller corporations to participate in larger contract bids.
JTB Technologies is a holding company for the following three sub-corporations:
A. JTB Industrial Sales Division (Sales and Distribution)
Providing Industrial clients with specialty technical services:
- Specialty Engineering to reduce the clients production costs through new Tool Applications.
- Reselling quality Industrial products to fulfill clients engineered production needs.
- Contract Bid services, and Contract Servicing.
B. JTB Products and Services Division (Engineering and Manufacturing)
- Manufacturing patented products from the JTB line of Automotive Tool products.
- JTB’s – Max-Drill line of specialty hole producing cutting tools.
- JTB’s – Max-Kut Commercial waterline hole cutting tools.
- JTB’s – Maxi-Kut Insert style drill system for the Sports service Industry.
- Providing reconditioning for the JTB Commercial hole cutter line.
- Providing reconditioning for the JTB drill system for the Sports service Industry.
C. JTB Integrated Technologies (Marketing Technologies)
- Developing Purchasing and Vendor management software.
- Supporting and Hosting of the JTB Server Software Applications.
- Web Portal Development, Industrial Web Site Development.
3.1 Product and Service Description
JTB Industrial Sales Division (Sales and Distribution)
The Industrial Sales Division provides the corporation with the reseller status necessary to participate in regional distribution and products support of the industrial sales division’s intended product lines. As a distributor with experienced engineering skills, the industrial sales division can also work closely with customers, providing expertise in manufacturing and outsourcing.
- Industrial and Commercial Tools and related products and services.
- Multiple catalog resale program of up to 300,000 products
- Safety products, Raw materials such as metals and hard metal products, and MRO maintenance repair items
- Specialty made to print items: machined components, items requiring project management and sub-contracted items.
JTB Products and Services Division (Engineering and Manufacturing)
The Products and Services Division provides the corporation with a stable base of our own products, and further utilizes the equipment with a full array of services to back up our product offering, and the products offered by the industrial sales division, as well.
- Manufacturing of patented products from the JTB line of Automotive Tool products.
- Manufacturing of patented JTB – Max-Drill commercial waterline hole cutting tools.
- Manufacturing of patented JTB – Max-Kut Insert style drill system for the Sports service Industry.
- Providing reconditioning for the Max-Kut Commercial hole cutter line.
- Providing reconditioning for the Max-Kut drill system for the Sports service Industry.
- Providing reconditioning of industrial tools sold by JTB’s Industrial Sales Division.
JTB Integrated Technologies (Marketing Technologies)
The Integrated Technologies Division will provide the corporation with profitable, internet-based marketing media and specially-developed business-growth applications, to create a unique customer service environment. All of the developed applications will be licensed for resale to individual businesses, and web developers. The division will also develop specialty applications to unite groups of businesses to provide larger clients with a strong systems-contract-style of purchasing.
- Web Content
- Industra – Industrial and commercial website system.
- Industrial search engine technology.
- Industrial and Commercial Web development.
- Industrial and Commercial Hosting and Marketing support.
- Data management applications.
3.2 Competitive Comparison
We have a unique advantage in our combination of complimentary sub-corporations. Management has acquired a very unique skills set when it comes to its business perspective and interests. The unique combination of I.T., Distribution, and Manufacturing provides for a unsurpassed test environment which gives the marketing department an almost instant feel for which avenues of marketing work and how they are performing.
JTB’s Industrial Sales Division will purchase goods and services for resale from many sources throughout the U.S. Our distributor relationships with our suppliers will be a key factor in our sales process. Our many years of machining and engineering background will lend credibility to our sales process. An order could be as simple as filling a customer requirement for a specified manufacturer’s EDP number, to getting faxes with requests to provide specialty tools for the manufacturer, so they can complete their manufacturing process.
JTB’s internally manufactured products are developed to perform better than the competition. Our products are developed with the goal of providing our clients a good, value-based purchase that will help them be more profitable in their day-to-day operations. Our commitment to high quality and consistency in our products and services is what sets us apart from others.
3.3 Fulfillment
In addition to direct reselling of products from affiliated manufacturers, our mix of nearly 300,000 industrial and safety products available through our catalog will allow us to compete against the much larger catalog suppliers.
JTB Products and Services fulfillment process includes developing our own product offering combined with well-managed secondary services which compliment our products, and post-sales services for the industrial sales division’s clientele as well.
JTB’s Integrated Technologies Division will fulfill its clients’ needs by developing its own media to support our Web-based products. This media will handle customer support and download capabilities for clients to access our products. Boxed CD versions of our products will be available in our inventory, and shipped as needed. Further fulfillment comes when our staff, or an outsourced engineer, travels to a client to make a hardware or software installation.
3.4 Technology
Computer-Controlled Equipment
With the proper mix of equipment, JTB can work as both a manufacturer and a service provider, repairing its own products, and it’s competitors products as well. Additionally, the equipment gives the business an opportunity to sell itself at the production managers level, as well as at the shop level, forging solid ties with production and engineering managers.
P.C.-based business applications
JTB will develop its own P.C.-based sales and marketing help systems for its employees to use during the sales process. Our applications will have extensions to our Internet sites to aid the customer relations and sales process. Our goal is to have extensive in-house Web development capabilities via our Integrated Technologies Division. Additional plans include multiple industrial portals for our advertising needs, and custom sales applications for licensing.
3-D Prototype Technology
Our prototype service will be handled via the Internet. A client sends a CAD file to our secure dedicated servers, we download the CAD file into the 3-D prototype equipment, and the process of developing a tangible prototype begins. This new technology actually builds a 3-dimensional model of the customer’s intended part; depending on the material, some components are durable enough for field test-fitting. This type of technology will bring JTB much closer to the Aerospace and Automotive industry. This process can also help JTB develop additional products for different markets.
3.5 Future Products and Services
JTB will do what comes naturally to us as we build our marketplace. We will methodically seek out additional products to match our customers requirements while working closely on customer applications to provide our clients with a better overall result in their manufacturing process. Through carefull analysis and testing at our location we will add target market solutions new clients will benefit from.
In particular, we will add products to complement our own lines, and develop a sales strategy around each product. The additional products and services will likely come from our distributor partners as they will be hand picked for their strengths, allowing us to develop high- quality product and service offerings. Our distributor partners can also produce additional private label products for us to incorporate into our lines without adding additional equipment and internal overhead.
Further development on this strategy will come from our engineering software applications; co-developed by our Integrated Technologies Division, these applications will allow us to work with application engineers to fine-tune products to maximize the products’ life, yielding the best possible results.
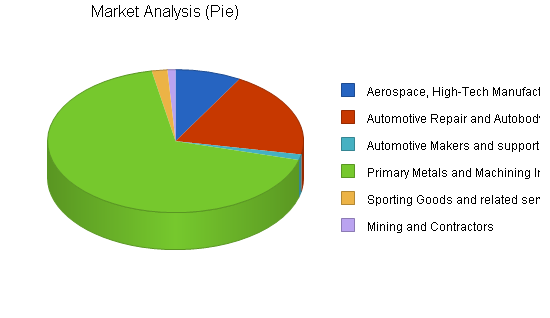
Market Analysis Summary
The national market for JTB consists of 314,555 potential clients in the following categories:
- Aerospace Industry – High Tech Manufacturers, and supporting sub-industries
- Automotive – Automotive repair, and Auto body industry.
- Automotive – Auto Makers, and their support industries.
- Primary Metals – Machining Industry – Turbine, Valve, Specialty Manufacturers, and Machining industries.
- Sporting Industry – Sporting Goods manufacturers, and Services industries.
- Mining and Contractor Industry – Hole drilling and Utility service providers
The Louisiana market consists of 4,553 potential clients in the same categories.
These industries represent our intended target market. Our sales goal is to integrate our Industrial Products and Services into the above markets. Our sales approach is simple, utilizing a well-trained, inside sales staff to approach new clients, and to respond to well-placed ads in industrial publications. Our P.C.-based server applications will make it possible for these businesses to interact closely with JTB and its distributor partners.
4.1 Market Segmentation
We have divided our potential customers into industry groupings. However, their needs are quite similar:
- Our customers are seeking cost reduction in their daily operations. As JTB will function as a distributor and a service provider, we can deliver custom specialty products faster, with fair, competitive prices.
- All of the above markets are seeking longer product life, resulting in higher profitability. Our overall experience in machining, grinding, and production management can provide our clients with actual measurable results.
- All market segments purchase similar products and services, consolidating our internal purchasing and marketing costs, maximizing long range profitability, while reducing external costs as we gradually implement our order placement systems.
- All market segments can be serviced via existing modes of transportation (UPS, Fedex, DHL).
| Market Analysis | |||||||
| Year 1 | Year 2 | Year 3 | Year 4 | Year 5 | |||
| Potential Customers | Growth | CAGR | |||||
| Aerospace, High-Tech Manufacturing | 3% | 25,587 | 26,355 | 27,146 | 27,960 | 28,799 | 3.00% |
| Automotive Repair and Autobody | 9% | 61,228 | 66,739 | 72,746 | 79,293 | 86,429 | 9.00% |
| Automotive Makers and support | 2% | 4,000 | 4,080 | 4,162 | 4,245 | 4,330 | 2.00% |
| Primary Metals and Machining Industry | 7% | 210,000 | 224,700 | 240,429 | 257,259 | 275,267 | 7.00% |
| Sporting Goods and related services | 7% | 6,058 | 6,482 | 6,936 | 7,422 | 7,942 | 7.00% |
| Mining and Contractors | 9% | 3,149 | 3,149 | 3,149 | 3,149 | 3,149 | 0.00% |
| Total | 6.97% | 310,022 | 331,505 | 354,568 | 379,328 | 405,916 | 6.97% |
4.2 Target Market Segment Strategy
Our marketing strategy for each target market segment will vary slightly. We will focus our direct marketing efforts on the Aerospace, Automotive, and Primary Metals and Machining industries, introducing these clients to our products and services. In particular, our combination of over 300,000 catalog items, and our industrial services, providing re-manufacturing and secondary services, will allow us to sell ourselves in many different ways. Also, our base of sub-contract service providers will allow us to offer many different programs via our distributorship.
4.2.1 Market Trends
Online use in our market has changed over the last five years. Business sites are gradually becoming more informational, where originally, businesses were impressed with a more graphical presentation. What has driven this is the search engines, and how they analyze a site’s content for ranking. Additionally, trade magazine ads are now much more likely to contain a business’ Web address, further fortifying JTB’s argument for better marketing solutions. As buyers visit the larger manufacturers’ sites, they become spoiled by the advanced features of the site; upon returning to the smaller business’ site, they may be turned off by its less advanced features. Our niche market is small- to mid-sized corporations. Larger firms like Peoplesoftware, Profit2100, Dimasystems, and Net2soft have targeted larger clientele developing very expensive software and netware packages starting at $10,000 and up.
Over the last five years, we have been working with a limited budget to acquire as much knowledge as possible about script processing to drive user/owned, user/developed site content management systems that incorporate many of the features found in higher-end programs. JTB will bring these products to market for 1/10th of the cost, while earning additional revenues with paid support services.
4.2.2 Market Needs
JTB’s market is serviced by many types of media, marketing, and business applications development companies. Traditionally these developers dictate to the clients what it is exactly they can offer, or a potential client has seen a product they have produced that offers some features they like. In JTB’s case, all of our applications will utilize Web technologies to allow full customization and personalization of our products to exactly match the businesses marketing theme. Our view is simple: the market is made up of businesses looking for work, businesses wanting to sell or distribute products, and a large offering of Web-based sites backed by large trade magazines. Ad rates for the industry are also very high, with most companies except the very large relying on other avenues to develop new clients. Caught in the mix is a large group of small- to mid-sized manufacturers using all types of low-end marketing.
JTB’s management has been working in this marketplace for the last 5 years, collecting information, and talking to businesses about their needs. As I was, most businesses are unhappy with the Web development aspects of marketing, and many of the businesses in this group have not had great success with attracting additional business via their sites. Sites tend to stagnate and are not utilized effectively by the businesses as they are at the mercy of the site developers demanding fees for continual changes. In most cases the developers do nothing in the way of marketing the sites, and I have seen in some cases, sites are not even registered with the search engines.
JTB will develop interactive, Web-based products to replace older technology sites, or work with their existing site. As intended, we will develop our P.C.-based sales and marketing products, to work interactively with the businesses’ sites, providing real-time inventory and other customer-demanded interactivity.
4.3 Service Business Analysis
JTB products and services are focused on some rather unique markets. As such, these markets are supported by niche products and services providers all over the U.S.
Industry by count:
- Auto Body clients available: 62,361
- Commercial utilities and drilling services available: 3,200
- Sporting Good Service Centers: 6,164
- Metalworking and Manufacturing: 238,764
The above client numbers are based on data available from Hugo Dunhill Mailing Lists, Inc., our preferred database provider. Larger firms like Peoplesoftware, Profit2100, Dimasystems, and Net2soft have developed very expensive software and netware packages starting at $10,000 – $50,000 and up. Our cost analysis has shown that there are many cost competitive options available for businesses to choose from, in many cases they are simply unaware they are available. As a service business that will utilize our own products, we can market and demo our products simultaneously, further reducing our costs per solicitation.
JTB’s integrated technologies services business consists of developing customized business growth and customer services solutions. As our clients will be throughout the U.S, most if not all of our work will be done online, via the Internet. JTB will offer distributed software products from well known names in the Accounting, CAD, Engineering, and Shop management software fields, along with our own software titles as well. Our support services will help our clients implement their installations.
As our niche market is small to mid-sized corporations, these potential clients can benefit from our industrial sales division’s distributed products. Once the potential client becomes an established client of any JTB division, each can be reviewed by the internal staff for further potential. JTB’s product and services division will compete for market share with a high-quality offering of products and services that focus on providing the customer with longer operation life, and select product lines tailored to each customers specific needs.
4.3.1 Distributing a Service
JTB’s integrated technologies division will distribute our services online. As mentioned in the fulfillment section 3.3, there are also plans for 3 additional satellite offices to further the growth of our business.
4.3.2 Competition and Buying Patterns
Automotive clients: These clients are made up of individual auto repair businesses. They purchase supplies via local suppliers and catalogs. Our products for this market are specialized time savers, and will be marketed as such. Also, our industrial sales division can sell to these clients via catalogs and through our online sales process. Competition in this marketplace is well developed as local suppliers providing standard products, our unique lines will be directly marketed to the shops, along with information about our industrial supply services.
Commercial Utilities and Drilling clients: These clients are made up of individual commercial service providers and contractors providing hole drilling services. Our process for re-manufacturing / re-building their drilling units will better the OEM’s efforts to make and sell a quality tool. The base cost index for these tools is very high, typically in excess of $2675 per unit. These clients generally pay a minimum of 50% for a rebuild. Competition in this marketplace is developed as commercial plumbing supply houses; typically, the client is on their own in terms of technical help. Our unique cost saving rebuild process will be directly marketed to them, also our industrial sales division can service these clients as well.
Sporting Good Service Centers: These clients are made up of bowling suppliers. Our patented products will out-perform any available products, and create a large re-conditioning market for JTB, as our patented products can only be reproduced by us. Competition in this marketplace is not very strong, as no one has developed a product for this process, nor has there been any standardization for this process. Our Max-Drill product line re-defines the process giving the shops a place for technical help, good service, and a product that provides ease of use, and a very cost-effective process.
Metalworking and Manufacturing: These clients are made up of Machine shops, Aerospace Manufacturers, and other specialty manufacturers requiring industrial products and services. Our services department will add value and services to JTB’s industrial sales division, as it can utilize the services division’s equipment to provide its clients with custom solutions. Competition is strong, as these clients work with both local suppliers, and catalog companies. As JTB has a very marketable mix of industrial sales, and industrial services, this will provide the added edge to acquire clients.
4.3.3 Main Competitors
JTB Technologies, Inc., as a whole, is a holding corporation, rather than a single competing entity in one marketplace. Foreseeing the need for a variety of goals to fulfill a more rounded offering of services, our sub-divisions do have competition both locally, and nationally.
Locally, we will be up against well-established industrial distributorships providing many products and services to the local customer base. These competitors are forced to outsource most of their services. Our business concept will be much more beneficial, cost effective, and expeditious for our clients.
The local distributorships in size compare to our Third, Fourth and Fifth year projections in terms of their size. There are also mega catalog distributorships with sales up to 50 Million annually.
Strategy and Implementation Summary
Our strategy and implementation will be a very straightforward approach to extending our products and services to potential clients via every cost-effective approach possible. Our combined services offering is very unique, and allows for more profitability while staying ahead of other industrial distributors and services providers in terms of delivery and competitive pricing. The combination of our distributorship’s solid inventory, and the ability of the service area to provide re-conditioning and special services to industrial products quickly, allows for faster shipments with fewer logistical problems. For our customers, this means lower costs.
Presently, the local industrial suppliers and service providers do not really provide an effective combination of supplying a cost-effective service strategy that yields the customer any real savings. The local distributors must also rely heavily on outsourcing for many of their services, which drives up the shipping costs to the customer dramatically.
This business plan allows for low-cost implementation of Internet-based customer access, as well as direct marketing where needed. The plan also focuses on the needs of our clients, working within particular parameters that permits the business to respond to small and large clients equally efficiently.
5.1 Value Proposition
JTB’s value proposition is very simple: providing quality and service that meets the customers’ requirements. Our value proposition happens naturally within the JTB divisions; whenever possible, we attempt to utilize our own in-house skills to meet our customers needs.
When accomplished in-house, the value turns into a quality product or service for a reduced overall cost to the customer. Simpler logistics means faster overall services at a reduced cost.
5.2 Competitive Edge
JTB’s combined competitive edge is an overall approach to marketing our goods and services to many different industries. Our unique approach of developing our own branded sales and marketing applications will strengthen our ties to our manufacturing partners and direct clients.
As computer networking is a strong area for me personally, I see the benefits to businesses that have solid, network-based sales and marketing tools in place. Overall, our goal is to utilize our own applications and developed credibility to share our inventory and other services. When completed, JTB will be able to offer much larger clients an extremely large variety of products and services. When presented to these clients in the form of a Web-based purchasing system, it will offer easy integration into their purchasing needs at little or no cost to them, accessible 24 hours a day, 7 days a week.
All of the JTB divisions will benefit from the marketing, strategic ad placement and direct marketing products offered by each of the JTB divisions.
5.3 Marketing Strategy
Key Goals to our marketing plans are as follows:
- Develop a high-profile sales environment, to bring our products to new and existing clients.
- Develop new ways to market our products to potential clients via our branded applications and credibility.
- Develop manufacturing partnerships utilizing our Web-based applications.
- Develop and maintain a high-quality customer service and follow-up program for all of the JTB divisions.
- Develop and utilize an ongoing automated marketing system to contact potential clients.
- Carefully target marketing expenditures to maximize returns on the campaigns.
5.3.1 Pricing Strategy
The industrial sales division will index its pricing against the well-known industrial product catalogs as a benchmark for pricing references. While it is true that these giant catalog companies enjoy better distributor discounts when they make their purchasing arrangements with suppliers, it’s also possible to use their printed prices as a benchmark for our clients to make comparisons with, when they purchase from us. Unless the item is a complete special, or a special standard, it may be found in a catalog somewhere providing us with a good reference index to work from while calculating our discounts on list prices.
In general, it is usually fairly easy to compete in both the catalog business and the industrial sales business in terms of percentages, but we will not structure our pricing to give the house away. What will set us apart is the services offering following the sale. We will generate additional revenues by servicing the distributed products, thus another sales point to be made as well. “Not only can we sell you the new products you need, we can service them in-house as well.”
5.3.2 Promotion Strategy
JTB Industrial Sales will promote sales and specials via the Internet, faxing, mailed sales literature, and printed media sent to the customers with our boxed shipments. Our integrated marketing systems will e-mail buyers about current promotions. Our system will also match these promotions with our clients’ previous purchases customizing our promotions for returning purchasers. Our other divisions’ customer databases will be accessible by the industrial sales division’s staff as well, allowing further solicitations into new markets and clients. With tailored promotions, we hope to gain a large promotion-based clientele, that hopefully yields many return customers to further develop our long-term return customer base.
All of our media marketing products and custom-developed applications can be offered on a trial and demonstration arrangement. Promotional strategy will include a 100% performance guaranty with a money-back offer. Part of our strategy is to develop the products in such a way that modules can be added when the client would like additional features. All of our products will have a help and support area with 24 hour access. This will also allow a no-cost, Web-based demonstration and product marketing environment.
5.3.3 Distribution Strategy
JTB will implement a distribution system developed by our Integrated Technologies Division, which provides the necessary real-time ability to share our inventory online with other suppliers and customers. With the real-time capabilities mixed into our Web-based applications, we will be able to work very closely with our manufacturing partners to fill orders, receive orders, and process requests for a quote. With the ability to extend ourselves with these customized applications, we can actually develop partnerships with any vendor who wants to share their inventory.
With order fulfillment as the major priority behind developing this system, we will work to integrate our clients needs with our abilities, and the abilities of our distributor partners to fulfill our clients’ requirements.
5.3.4 Marketing Programs
- Internet based industrial website banner Ads. As we develop our industrial Internet marketplaces, we will place ads into our sites and many other industrial products’ sites as well.
- Promotional, e-mail-based product e-flyers. As we collect users at our sites, we will build a sales process of delivering e-mail-based promotions to our visitors, highlighting our products and services.
- Catalog supplemental flyer programs delivered with all shipments. Our shipping department will include inventory specials with all boxed shipments to our clients, saving much of the mailing costs.
- Fax-based special promotions. When allowed, we hope to target purchasing agents and buyers with our specials. In all cases and methods of delivery, we can build a promotional special to target our clients’ purchasing history.
- Direct telephone solicitation while taking orders. Our sales staff will close all order calls with a quick overview of our sales specials.
5.3.5 Positioning Statement
Our positioning strategy combines our individual divisions’ strengths, directly marketing each division’s capabilities in an overall fashion to our intended clientele. Further development on this will be implemented through cross marketing our services to established divisional clients. Our integrated technologies will place our business directly into the individual marketplaces, allowing for direct access when potential clients are seeking products and services.
Additionally, our catalog program will also keep the business in direct competition with the larger catalog businesses; our highly-respected products and services will generate a large long-term customer base.
5.4 Strategic Alliances
JTB will develop and implement many strategic alliances to build its product and services offering. Alliances to manufacture our higher volume products will aid in keeping our internal costs in check, while allowing unlimited growth potential by utilizing our distributor partners production capabilities. Further development will include purchasing on a contractual basis, to help lock in pricing on our product offering. Our distributor partners will allow us to offer additional products and services that we could not otherwise offer, also reducing our investments in additional personnel and equipment while maximizing profits.
JTB’s Integrated Technologies division will develop long-term relationships with many media developers, to provide our clients with a broad offering of products and services. Our developer partners and technology suppliers will be hand-picked for their products and capabilities. Our main goal while developing our strategic alliances is to select the best possible providers we can locate. When developed, JTB will utilize our business development applications to network with our clients, and distributor partners to create a unique collaborative environment capable of providing the needed input to fulfill and complete our media projects.
5.5 Sales Strategy
JTB’s Industrial Sales Divisions strategy is summed up in three words: Marketing, Engineering, and Sales. Our unique marketing environments will allow established and potential customers cost-free access to our products and services via Phone, Fax, EDI, and the Internet.
Customers can access their accounts via the Internet to review purchases, request quotes, and place orders. Pre-sales engineering will be available when consultation is needed. JTB will develop online databases about the products we represent; the same database will be available to our staff when conversing with clients about projects. CAD and other engineering software will work out potential issues on specialty projects prior to ordering. After the pre-sale process is complete, the staff will generate a formal quote to be sent to the client in the format they prefer.
The most prominent components of our sales process are ease of use and a knowledgeable staff to promptly fulfill orders. Having purchased from all types of businesses, including cutting tool manufacturers, industrial distributors, and industrial catalog houses, JTB will blend the best features from our purchasing experiences into a comfortable, customer-oriented purchasing environment.
5.5.1 Sales Forecast
JTB’s Industrial Sales Division’s forecast highlights the key products to be initially offered. Remaining flexible, management will be seeking additional avenues of business to develop, adding further sales capability. We feel strongly about developing a very good local customer base, allowing quick growth and establishment of cash flow. Additionally, we anticipate better margins as we become established as direct distributors for many of the lines we would initially offer from catalogs, and through out-of-state purchases from other distributors.
Our sales forecast has an average margin of 36%. As an established direct or stocking distributor we previously had discount arrangements of up to 68% off list pricing these changes would result in an additional 15 – 30% reduction in our direct costs of goods picture.
JTB’s Products and Services Division: Many of the services provided are billable hourly at nearly $60.00 per hour for service work. In comparison, some products manufactured internally will need to be at a lower shop rate to provide for more competitive pricing to break into the different markets. We will work to have many of the patented products manufactured externally, allowing our equipment to be utilized on more profitable work. Contingencies need to be in place to backup all products and services offered in the event of personnel issues, or equipment failure. These factors all affect the break even analysis as well. If we were producing only one or several product lines you could show controlled costs vs products manufactured. This plan however provides additional and substantially more profitable services to all of the clients utilizing our products and services. The services are both fixed price list services, and billable hourly for special work.
With potential clients and distributor partners numbering near 330,000, the sales forecast for JTB’s Integrated Technologies Division looks strong. As we are developing our own products and services for resale, and in the form of renewable subscribed services there is a substantial amount of market available. With the average business spending approximately $3,000 or more annually, this quickly becomes a $990 Million marketplace.
Our sales forecast table uses the following assumptions:
- Metal Tools average growth rate of sales 29.5% annually.
- Commercial, Contractor, Utilities average growth rate of sales 25% annually.
- Safety Products average growth rate of sales 66% annually.
- Work Holding Products average growth rate of sales 49.3% annually.
- Precision Measuring Products average growth rate of sales 49.3% annually.
- Catalog Industrial Products average growth rate of sales 34.3% annually.
- Specialty Purchased Components average growth rate of sales 66.7%
- Tool related Services average growth rate of sales 34.5% Annually.
- Industry Analysis Compound Annual Growth Rate of 7.02%.
The sales growth is affected by numerous factors including:
- JTB’s ability to quickly develop its internal sales staff.
- JTB’s ability to rapidly redevelop management’s previous industry-relations channels.
- The development of the JTB Products and Services Division’s services.
- The development of JTB’s Business Development Division’s marketing products.

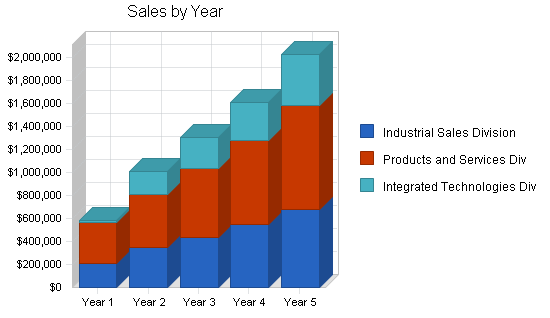
| Sales Forecast | |||||
| Year 1 | Year 2 | Year 3 | Year 4 | Year 5 | |
| Sales | |||||
| Industrial Sales Division | $206,525 | $347,300 | $433,420 | $542,963 | $674,518 |
| Products and Services Div | $354,705 | $461,550 | $601,569 | $729,944 | $902,842 |
| Integrated Technologies Div | $23,204 | $199,948 | $268,330 | $331,797 | $443,411 |
| Total Sales | $584,434 | $1,008,798 | $1,303,319 | $1,604,704 | $2,020,771 |
| Direct Cost of Sales | Year 1 | Year 2 | Year 3 | Year 4 | Year 5 |
| Industrial Sales Division | $128,259 | $212,185 | $263,461 | $315,420 | $407,383 |
| Products and Services Div | $199,051 | $229,974 | $279,739 | $342,839 | $419,700 |
| Integrated Technologies Div | $8,448 | $35,795 | $55,219 | $66,051 | $90,527 |
| Subtotal Direct Cost of Sales | $335,758 | $477,954 | $598,419 | $724,310 | $917,610 |
5.6 Milestones
Secure Leasing, Banking, and Attorney Arrangements – Long term arrangements to secure the equipment financing, banking relations, and general and patent attorney needs.
Setup JTB’s Industrial Services Location – Prepare working area for incoming equipment, wiring, shipping and receiving areas, networked accounting systems, and develop a work flow methodology for the entire shop.
Complete the equipment selections and installation – Equipment will be selected from various machine tool dealers throughout the U.S. These machine tools will be inspected closely for quality, selecting the best possible pieces while working within our budget.
Contractor selection for outsourced manufacturing – Competing contract manufacturers will be providing sample parts and quotations for our products. In particular, contractors will be quoting on the Automotive and Sporting Goods lines, as they have the highest potential volume and will require substantially more manufacturing capacity than we will have available.
Contracted Application Developer selection – JTB will contract for a long-term relationship partner seeking a progressive, well-established multi-talented individual to create the desired P.C.-based business applications we plan to develop as part of our product offering. This individual will work closely with management in a hands-on fashion to custom-develop the base code needed for our application.
Re-establishment of Business Contacts – Our sales manager will personally work to re-establish all of his previous business relationships in the industry, working to build both client and vendor relationships.
JTB Service associate selection and training – Service Associates will be from a production background, familiar with manufacturing and general machining; training will be ongoing for at least 1 year. Management will work with these individuals on a one-on-one basis to accomplish this, and minimize training costs while still completing orders as needed.
Selection of Sales Associates – JTB’s Industrial Sales division will be seeking bright, sales-oriented individuals to fulfill our internal needs for customer support, sales and marketing initiatives, and long-term goals.
Begin Catalog Program – Initially, we will order 250 sets of custom catalogs. We anticipate developing up to 1,200 catalog clients during the 4 years projected in the plan, with 300,000 to 400,000 industrial items available for resale.
Applications development begins – JTB application developer will begin development of our sales, marketing and engineering applications for integration with the corporations’ websites, as an aid for staff members to manage customer requests, engineering help, and exporting sales and engineering information about our products and services offering. When completed, these P.C.-based tools will interact with our Internet-based sites, and will become part of our applications offering of customer support products.
JTB Industrial Services Marketing Campaign – Our marketing campaign will initially target the local market with an initial letter to the key personnel within the target businesses. This introduction will be a combination letter marketing the JTB Industrial Sales Division as well; alternately, the Industrial Sales Divisions sales personnel will be following up on these accounts.
Marketing Sites are established – JTB will develop and manage multiple marketing sites dedicated to target market JTB’s entire line of industrial products and services. These sites will also generate revenue with additional product marketing from our channel partners.
Revenue Sites are established – JTB will develop and manage multiple industry specific sites dedicated to matching buyers with suppliers. These sites will be a pay-per-ad situation, allowing businesses to highlight their products and services. The JTB media groups logo will allow visitors to access our product and service sites. In some cases, JTB will be a vendor in these sites as well.
Distributorship Partnership Development Begins – JTB will implement its distributor partnership program to expand its client base throughout the U.S. Utilizing our custom-developed networking applications, we will be able to share inventory and access other partners’ inventory and services as well.
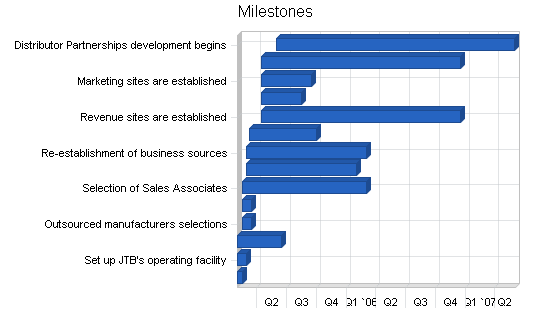
| Milestones | |||||
| Milestone | Start Date | End Date | Budget | Manager | Department |
| Secure Leasing and Banking Arrangements | 2/1/2005 | 2/15/2005 | $1,500 | M.Jeremy | Management |
| Set up JTB’s operating facility | 2/1/2005 | 3/1/2005 | $6,500 | M.Jeremy | Management |
| Equipment selections and installation | 2/1/2005 | 6/15/2005 | $125,000 | M.Jeremy | P&S Div |
| Outsourced manufacturers selections | 2/15/2005 | 3/15/2005 | $3,500 | M.Jeremy | P&S Div |
| Hire application developers | 2/15/2005 | 3/15/2005 | $3,500 | M.Jeremy | IT Div |
| Selection of Sales Associates | 2/15/2005 | 3/1/2006 | $2,000 | M.Jeremy | IS Div |
| Begin industrial services marketing campaign | 3/1/2005 | 1/30/2006 | $3,500 | R.Jeremy | P&S Div |
| Re-establishment of business sources | 3/1/2005 | 3/1/2006 | $2,500 | M.Jeremy | IS Division |
| Selection of Service Associates | 3/10/2005 | 10/1/2005 | $15,000 | R.Jeremy | P&S Div |
| Revenue sites are established | 4/14/2005 | 12/15/2006 | $9,000 | M.Jeremy | IT Div |
| Begin Applications Development | 4/15/2005 | 8/15/2005 | $12,000 | M.Jeremy | IT Div |
| Marketing sites are established | 4/15/2005 | 9/15/2005 | $7,500 | M.Jeremy | IT Div |
| Begin Sales and Catalog Campaign | 4/15/2005 | 12/15/2006 | $4,500 | M.Jeremy | IS Division |
| Distributor Partnerships development begins | 6/1/2005 | 5/30/2007 | $5,000 | M.Jeremy | IT Div |
| Totals | $201,000 | ||||
Web Plan Summary
JTB’s Web-based marketing plan is essentially the same for all of the JTB divisions, with the exception of how each division targets its clients. As JTB will be able to add its services offering into the marketplaces to be developed, we will get day-to-day information and feedback from the various paid ads we place in industrial trade magazines, and with other websites as well. The Web plan is to link our products and services with as many affiliate sites as possible.
When established, these marketplaces and affiliate sites will serve as a very cost-effective marketing tool for all of the JTB divisions, again keeping in mind that each division’s approach to this will be tailored towards its intended potential clients. Each division will have dedicated websites operating under the JTB logo. With a track record available at all times via our servers, we can easily show others seeking a better marketing system, order processing, Web-based marketing, or special applications that JTB products perform as intended, providing affordable long term growth results for our clients.
6.1 Website Marketing Strategy
JTB will develop and manage as many industrial marketplaces as possible, seeking out niche marketing that drives customers to our industrial products and services sites. Also JTB will embed itself into many other sites utilizing search engine technology, affiliate marketing programs, and paid banner ads.
As JTB will develop all of its sites and Internet based applications, this will be done at a considerably lower overall cost that our competitors would spend to develop the same type of Web-based applications.
Management Summary
President and Sales Manager
Mitchell R. Jeremy
Mr. Jeremy will work with the managers and staff of the industrial sales division to train staff, and act as the project manager on bigger projects requiring an engineered sales background. Additionally, Mitchell will train the staff on the technical aspects of the products, and the use of the corporate intranet to further train the sales staff. Mr Jeremy will develop all of the internal and external sales and marketing programs to train and orientate staff and customers with our products and services. New products and programs will be added in layers as they are developed.
Intranet: Mitchell Jeremy will continually develop our company intranet as new products and services are added. Staff will be able to quickly search for items in our inventory, or in our network of distributor partners, our catalog offering will be indexed in the intranet as well. One key training goal for our staff is to make the associates self-sufficient as quickly as possible on our base inventory. Working from standardized product lists and promotions containing many of our base products will expedite the training process.
Additionally, he will be solely responsible for the development, testing, creation, and patenting all of the JTB tool products and services to be offered by the products and services division.
Vice President, Production Manager and Secretary
Rachel L. Jeremy
During year one of the plan, Rachel will act as the Service Team Manager. She will oversee order processing, scheduling of outsourced orders, and act as the general business manager in Mr Jeremy’s absence. After year one, the service team members and service team manager will be fully trained to handle the day-to-day workload in their area. Rachel will then continue to maintain the ongoing day-to-day work schedule, track time and billing issues, and remain in close contact with the clients to ensure that JTB is meeting its required deliveries and all that is required by the customer.
7.1 Middle Management Team
Sales Team Leader
Sales Team Leaders will work in both a sales and marketing role, providing customer support while
continually training to market new products and services.
Customer Support Associate/Manager
The customer support associate/manager will work in all areas of sales, marketing and customer support, providing customer support while continually training to market new products.
Service Team Manager
This manager will keep track of all services offered and products supported, train service personnel, and be responsible for maintaining a quick response time to customer service needs and inquiries.
7.2 Personnel Plan
Sales Associates
Sales Associates will work in both a sales role, providing customer support while continually training to support new products and services offered.
Shipping and Receiving
Responsible for shipping, inventory, and receiving incoming goods. Packing orders for shipment, and miscellaneous jobs throughout the business.
Customer Support Associate/Manager
The customer support associate/manager will work in all areas of sales, marketing and customer support, providing customer support while continually training to market new products.
Customer Support Associate
The customer support associate will be available to cover the operating hours of the office when the manager is unavailable. This role will focus more on developing new clients while also providing customer support when needed.
Sales and Marketing Associate (Shared)
The Sales and Marketing Associate will work in a sales role, new customer development and follow up marketing.
Three Developer Positions:
Application Developer
2nd, Part-time App Developer/QA Tester
Web Developer
These employees are focused specifically on developing our products. These developers will also create updates and provide any additional custom work when needed.
Service Team Manager
The service team manager is a working manager position requiring complete knowledge of all the manufacturing processes. This position will answer directly to the Operations Manager.
Service Team Member
TBA. Service Associates will perform the manual labor required in the service and production department.
| Personnel Plan | |||||
| Year 1 | Year 2 | Year 3 | Year 4 | Year 5 | |
| Production Personnel | |||||
| Shipping and Receiving | $9,600 | $9,600 | $14,400 | $18,800 | $22,500 |
| Application Developer | $48,000 | $50,000 | $50,000 | $50,000 | $50,000 |
| Part-time App Dev/QA | $10,800 | $14,000 | $14,000 | $14,000 | $14,000 |
| Web Developer | $36,000 | $10,800 | $10,800 | $10,800 | $10,800 |
| Service Team Manager | $35,200 | $24,000 | $28,000 | $29,500 | $31,500 |
| Service Team Member | $8,800 | $21,000 | $23,000 | $25,000 | $28,000 |
| Subtotal | $148,400 | $129,400 | $140,200 | $148,100 | $156,800 |
| Sales and Marketing Personnel | |||||
| Sales Team Leader | $30,000 | $30,000 | $31,000 | $31,000 | $31,000 |
| Sales Associate | $9,000 | $14,000 | $16,500 | $19,000 | $22,500 |
| Customer Support Manager | $7,800 | $33,000 | $34,000 | $34,000 | $34,000 |
| Customer Support Associate | $3,600 | $14,000 | $16,000 | $18,000 | $20,000 |
| Sales and Marketing Assoc (shared) | $4,450 | $7,000 | $21,000 | $27,000 | $31,000 |
| Subtotal | $54,850 | $98,000 | $118,500 | $129,000 | $138,500 |
| General and Administrative Personnel | |||||
| Vice President, Production Manager and Secretary | $43,200 | $43,500 | $44,000 | $45,000 | $45,000 |
| President/Sales Manager | $15,800 | $19,000 | $20,000 | $22,000 | $24,000 |
| Subtotal | $59,000 | $62,500 | $64,000 | $67,000 | $69,000 |
| Other Personnel | |||||
| Name or Title | $0 | $0 | $0 | $0 | $0 |
| Name or Title | $0 | $0 | $0 | $0 | $0 |
| Name or Title | $0 | $0 | $0 | $0 | $0 |
| Subtotal | $0 | $0 | $0 | $0 | $0 |
| Total People | 13 | 13 | 13 | 13 | 13 |
| Total Payroll | $262,250 | $289,900 | $322,700 | $344,100 | $364,300 |
Financial Plan
J-Tech’s financial plan is based on raising $445,000 (USD) by way of private equity to develop JTB Technologies, Inc. Additionally, the plan calls for $253,150 (USD) for equipment; these funds will be obtained via a long-term loan. Each division’s requirements are shown below:
- To develop the Industrial Sales Division of the corporation, JTB’s financial plan is based on receiving $181,000 (USD) in long-term loans. To maintain Gross Margins of 36% or better, the Industrial Sales Division will also help develop and create Internet-based industrial sales applications and portals in conjunction with our Integrated Technologies Division.
- To develop the Products and Services Division of the corporation, JTB’s financial plan is based on raising $230,000 (USD) by way of private equity to set up the products and services division of the corporation. An additional $45,000 for equipment will be obtained as a long-term loan. These operational costs are shown in the operating statements projected in this plan. Management expects to achieve a small but stable net profit on sales in just over two years.
- To develop the Integrated Technologies Division of the corporation, JTB’s financial plan is based on raising $225,000 (USD) by way of private equity and $27,150 in long-term loans. To maintain Gross Margins of 36% or better, the business development technologies division will develop, market and support P.C.-based industrial sales applications, and marketing portals.These products or business modules will be developed in conjunction with our industrial sales and industrial products’ divisions input, using our other divisions as a model and test bed. Our unique customer applications will help to speed the quotation and purchasing process of the 300,000 industrial products offered in our industrial division’s catalogs.
The consolidated financial plan combines all divisional operating costs, including personnel, equipment, location costs, depreciation etc. For accuracy and organizational reasons, we have developed three related sub-plans, as each provides exact details of each sub-division goals and position within the corporation. JTB Technologies, Inc. will behave more like a holding company. For this overall plan, the industry profile selected for comparison purposes was an automotive parts and supplies manufacturer, since our combined companies are very similar to this in terms of developing, manufacturing, servicing, and marketing tangible machinery products for end-users. After year five of the plan, management hopes to develop or purchase other divisions.
By the end of FY 2 of this plan, JTB will have developed sales revenue of $1,008,798 (USD) with a Gross Margin on sales of 39.35%. By the end of FY 3 of this plan JTB will have developed sales growth of 29% over year one, and sales of $1,303,319 (USD), while the Gross Margin on sales has increased as the corporation improves on overall performance.
The exit for this plan has been left open; this can be discussed in detail after the plans’ review. I would provide a full recalculated version based on the investors’ requirements. Further discussion on the patented products’ actual values, and expected percentages of the investors’ ownership are left open as well.
8.1 Important Assumptions
As this main plan is comprised of 3 sub-plans providing details of each business segment for more accurate projections, the main plan is used to show the overall development and growth of the business. The key factor in the assumptions is the ability of the business to be developed in its entirety in one location. This greatly reduces operating costs, and provides a more flexible staff situation for cross-training and other issues. We suggest that each plan is reviewed, as each is quite different.
All Profit and Loss tables in this main plan include the numbers from the sub-plans, and take into consideration all of the operating expenses.
Key assumptions around which we have developed this plan are as follows:
- Current business, banking, and economic trends continue to be stable.
- Customer buying trends and orders remain strong.
- Overhead and other external operating cost grow as projected.
- External outsourced costs grow as anticipated.
- Internet buying trends continue to grow in the industrial sector.
The General Assumptions table below is utilized by the business plan to perform calculations on the expected conditions in the business plan. These factors also play heavily into the business’ long-term plan, assuming the business can be developed in its entirety in one location. This greatly reduces operating costs, and provides a more flexible staff situation for cross-training and other issues.
Upon reviewing the plan, you may have noticed management has mentioned expansion through use of its online marketing system via numerous channel partners throughout the U.S. The possible revenues from this have not been added into any projections. Management’s position on the plan’s assumptions is that we can make better long-term arrangements, which should better the projected cash position shown.
| General Assumptions | |||||
| Year 1 | Year 2 | Year 3 | Year 4 | Year 5 | |
| Plan Month | 1 | 2 | 3 | 4 | 5 |
| Current Interest Rate | 10.00% | 10.00% | 10.00% | 10.00% | 10.00% |
| Long-term Interest Rate | 10.00% | 10.00% | 10.00% | 10.00% | 10.00% |
| Tax Rate | 0.00% | 30.00% | 0.00% | 30.00% | 0.00% |
| Other | 0 | 0 | 0 | 0 | 0 |
8.1.1 Assumptions Notation
Additional comments regarding the business plan assumptions, Break-even analysis, and the Projected Profit and Loss and our intended accounting system implementation: Management has selected a high-quality, networked accounting system with capabilities of having multiple businesses running while still offering full consolidation of the business for accounting purposes.
This system is complete with project management capabilities and budgeting; as such, management will implement a budgeted approach for the projects while adjusting costs in JTB’s favor wherever possible.
All Profit and Loss tables in this plan include all of the projections from JTB’s three divisions. We suggest that each plan is reviewed, as each is quite different.
8.2 Key Financial Indicators
As this plan includes three sub-divisions, the corporations overall financial health is comfortably averaged out between the three divisions during the first two years of business.
The key financial indicators include:
- Sales growth in this plan does extremely well, as the business offers a broad range of products and services. Growth of approximately 37% per year can also be attributed to the unique marketing products that we will develop and use in our marketing process to reach customers all over the U.S.
- Gross Margins in this plan average 38% annually, and are attributed to our products and services selections and how they apply to their individual markets. Our intranet-based inside sales and marketing products provide our sales staff with the ability to calculate the margins per order placed while processing orders. Product and Vendor selections play a key role in profitability as well.
- Operating Expenses in this plan remain stable as the projected personnel plan, and operating expenses are essentially fixed during the first five years of the plan.
- Inventory Turnover in the business plan shows good control over the planned inventory, and short and JIT ordering is not a problem. In many cases, we will implement vendor drop shipments, further lessening the need for additional inventory. Some inventory lag could occur if a client wants inventory on hand for special products; we would then be required to stock these products.
- Collection Days are set to average 45 days. One key goal will be for the business to target financially healthy businesses. We also anticipate a very large market of small order purchases placed with credit card or e-check via the internet.

8.3 Break-even Analysis
As a start-up, JTB’s break-even analysis is difficult to project, as our industrial products are mixed with product development lead times, and the initial time to market. The major factor in our break-even point is the long lead-time for JTB’s software development. We expect to reach break-even for the entire corporation early in the second year.
The initial goal is to bring the hard products to market within 60 days from startup along with the addition of numerous well-accepted industrial products for resale. What will set JTB apart from the other industrial entities is its ability for flexibility, expansion, and its individual divisions with key individuals all under one roof targeting each market segment JTB will pursue.
With this in mind, the goal is to build a solid base for the corporation with our primary products and services while continuing the development phase of our distribution software.

| Break-even Analysis | |
| Monthly Revenue Break-even | $49,492 |
| Assumptions: | |
| Average Percent Variable Cost | 57% |
| Estimated Monthly Fixed Cost | $21,059 |
8.4 Projected Profit and Loss
Please be sure to read note 8.1.1 in the Important Assumptions, section 8.1 regarding our Accounting system and methodology.
The Projected Profit and Loss table takes into consideration all of the basic operating costs for the entire corporation and all of its divisions. The P&L in this business plan also includes a full depreciation schedule while remaining profitable. When management produced the table, we would have preferred to project a softer startup with more of a gradual expense growth as we added equipment and services.
Management’s goal is to work with a leasing company that will provide a construction type loan/lease situation allowing us time to hand-select the best possible equipment while minimizing the cash outlay during this process. For the purposes of this plan, and to maintain a conservative approach, we have expensed this equipment in the start-up table. With this considered, the long term goal has not changed and is reflected in year 2006.
With consideration given to note 8.1.1, management still feels it can produce a better-structured corporation than what is shown in the existing business plan. Other considerations not included in the P&L are the burden of management, and management’s output. Please remember when you do review the P&L, that the 3 JTB divisions will actually be operating under one roof. As such, management’s role will be to fill in, in all areas of production wherever needed to complete orders.
Management’s operating schedule will also be overlapped to “keep our doors open” more operating hours than any of the other 9 to 5 operations. Management anticipates running at least 50 hours per week allowing us to develop more business on the west coast’ which is also not calculated in the P&L.


| Pro Forma Profit and Loss | |||||
| Year 1 | Year 2 | Year 3 | Year 4 | Year 5 | |
| Sales | $584,434 | $1,008,798 | $1,303,319 | $1,604,704 | $2,020,771 |
| Direct Cost of Sales | $335,758 | $477,954 | $598,419 | $724,310 | $917,610 |
| Production Payroll | $148,400 | $129,400 | $140,200 | $148,100 | $156,800 |
| Contracted Graphics Development | $4,500 | $4,500 | $4,500 | $4,500 | $4,500 |
| Total Cost of Sales | $488,658 | $611,854 | $743,119 | $876,910 | $1,078,910 |
| Gross Margin | $95,776 | $396,944 | $560,200 | $727,794 | $941,861 |
| Gross Margin % | 16.39% | 39.35% | 42.98% | 45.35% | 46.61% |
| Operating Expenses | |||||
| Sales and Marketing Expenses | |||||
| Sales and Marketing Payroll | $54,850 | $98,000 | $118,500 | $129,000 | $138,500 |
| Advertising/Promotion | $13,800 | $18,000 | $24,300 | $25,300 | $26,300 |
| Other Sales and Marketing Expenses | $0 | $0 | $0 | $0 | $0 |
| . | $0 | $0 | $0 | $0 | $0 |
| Total Sales and Marketing Expenses | $68,650 | $116,000 | $142,800 | $154,300 | $164,800 |
| Sales and Marketing % | 11.75% | 11.50% | 10.96% | 9.62% | 8.16% |
| General and Administrative Expenses | |||||
| General and Administrative Payroll | $59,000 | $62,500 | $64,000 | $67,000 | $69,000 |
| Sales and Marketing and Other Expenses | $8,400 | $14,700 | $23,500 | $25,000 | $30,200 |
| Depreciation | $10,696 | $10,700 | $10,700 | $10,700 | $10,700 |
| Rent (consolidated) | $26,400 | $26,400 | $26,400 | $26,400 | $26,400 |
| Utilities (consolidated) | $14,300 | $15,000 | $15,800 | $16,200 | $16,700 |
| Equipment lease Ind Prod Div | $35,988 | $35,988 | $35,988 | $35,988 | $35,988 |
| Prototype and Printing Equipment | $10,710 | $12,852 | $12,852 | $12,852 | $12,852 |
| Insurance (consolidated) | $12,000 | $18,000 | $20,000 | $22,000 | $24,000 |
| Payroll Taxes (consolidated) | $0 | $0 | $0 | $0 | $0 |
| CPA – Accounting and Payroll | $4,200 | $4,400 | $4,600 | $4,600 | $4,600 |
| Off-site secure backup storage | $360 | $400 | $400 | $400 | $400 |
| Computer maintenance and software upgrades | $2,000 | $3,000 | $4,000 | $5,000 | $6,000 |
| Total General and Administrative Expenses | $184,054 | $203,940 | $218,240 | $226,140 | $236,840 |
| General and Administrative % | 31.49% | 20.22% | 16.74% | 14.09% | 11.72% |
| Other Expenses: | |||||
| Other Payroll | $0 | $0 | $0 | $0 | $0 |
| Consultants | $0 | $6,000 | $6,000 | $6,000 | $6,000 |
| Other Other Expenses | $0 | $0 | $0 | $0 | $0 |
| Total Other Expenses | $0 | $6,000 | $6,000 | $6,000 | $6,000 |
| Other % | 0.00% | 0.59% | 0.46% | 0.37% | 0.30% |
| Total Operating Expenses | $252,704 | $325,940 | $367,040 | $386,440 | $407,640 |
| Profit Before Interest and Taxes | ($156,928) | $71,004 | $193,160 | $341,354 | $534,221 |
| EBITDA | ($146,232) | $81,704 | $203,860 | $352,054 | $544,921 |
| Interest Expense | $24,425 | $22,849 | $21,202 | $19,556 | $17,909 |
| Taxes Incurred | $0 | $14,447 | $0 | $96,539 | $0 |
| Net Profit | ($181,353) | $33,709 | $171,958 | $225,259 | $516,312 |
| Net Profit/Sales | -31.03% | 3.34% | 13.19% | 14.04% | 25.55% |
8.5 Projected Cash Flow
The projected cash flow comfortably reflects the businesses position to repay the initial investors near year 4 and 5 of the plan; please remember when you review this table, it is for the entire corporation. When reviewing the projected cash flow, its important to note the largest growth in sales is from outsourced manufacturing as this is not really segmented for review. Additional segmentation information can be found in the market segmentation table in section 4.1.
The outsourced manufacturing allows the company to have the product lines it desires while utilizing its internal personnel on the more profitable services to be offered. The outsourced products operate under a fixed cost situation, while the services area will for the most part be working in a cost plus situation filling special and rush requests that carry a much higher shop rate. As the cash flow projects only the base products described in the business plan, its highly probable JTB will be involved with more outsourced products in years two through five, furthering our potential profitability.
Please review section 8.1 regarding the Important Assumptions to get a better feel for the explained projected cash flow.

| Pro Forma Cash Flow | |||||
| Year 1 | Year 2 | Year 3 | Year 4 | Year 5 | |
| Cash Received | |||||
| Cash from Operations | |||||
| Cash Sales | $146,109 | $252,200 | $325,830 | $401,176 | $505,193 |
| Cash from Receivables | $329,424 | $677,524 | $922,609 | $1,147,369 | $1,438,049 |
| Subtotal Cash from Operations | $475,532 | $929,723 | $1,248,439 | $1,548,545 | $1,943,242 |
| Additional Cash Received | |||||
| Sales Tax, VAT, HST/GST Received | $0 | $0 | $0 | $0 | $0 |
| New Current Borrowing | $0 | $0 | $0 | $0 | $0 |
| New Other Liabilities (interest-free) | $0 | $0 | $0 | $0 | $0 |
| New Long-term Liabilities | $0 | $0 | $0 | $0 | $0 |
| Sales of Other Current Assets | $0 | $0 | $0 | $0 | $0 |
| Sales of Long-term Assets | $0 | $0 | $0 | $0 | $0 |
| New Investment Received | $0 | $0 | $350,000 | $0 | $0 |
| Subtotal Cash Received | $475,532 | $929,723 | $1,598,439 | $1,548,545 | $1,943,242 |
| Expenditures | Year 1 | Year 2 | Year 3 | Year 4 | Year 5 |
| Expenditures from Operations | |||||
| Cash Spending | $262,250 | $289,900 | $322,700 | $344,100 | $364,300 |
| Bill Payments | $449,376 | $723,975 | $809,928 | $1,029,456 | $1,155,538 |
| Subtotal Spent on Operations | $711,626 | $1,013,875 | $1,132,628 | $1,373,556 | $1,519,838 |
| Additional Cash Spent | |||||
| Sales Tax, VAT, HST/GST Paid Out | $0 | $0 | $0 | $0 | $0 |
| Principal Repayment of Current Borrowing | $0 | $0 | $0 | $0 | $0 |
| Other Liabilities Principal Repayment | $0 | $0 | $0 | $0 | $0 |
| Long-term Liabilities Principal Repayment | $16,428 | $16,466 | $16,466 | $16,466 | $16,466 |
| Purchase Other Current Assets | $0 | $0 | $0 | $0 | $0 |
| Purchase Long-term Assets | $0 | $0 | $0 | $0 | $0 |
| Dividends | $0 | $0 | $320,000 | $70,000 | $160,000 |
| Subtotal Cash Spent | $728,054 | $1,030,341 | $1,469,094 | $1,460,022 | $1,696,304 |
| Net Cash Flow | ($252,522) | ($100,618) | $129,345 | $88,523 | $246,938 |
| Cash Balance | $243,728 | $143,110 | $272,455 | $360,978 | $607,916 |
8.6 Projected Balance Sheet
JTB’s projected balance sheet shows a strong cash development capability over the projected 5 year plan. The projected balance sheet, like the rest of the business plan, assumes the business remains at its startup location during the first five years of operations, keeping costs relatively fixed for the projections. Again, as mentioned in the Important Assumptions section 8.1, management still feels it can develop a stronger situation than what is reflected here.
The business will build its cash position while also developing a strong net worth. Total assets exceed $1 Million by year 5 as well. A full depreciation schedule and payment schedule is included to depreciate the long-term assets.
During the life of the plan, inventory requirements may change as we offer our clients different purchasing options and build our inventory of used products. Any differences in cash flow and inventory would show that the cash is tied up in inventory. With this in mind, we would try to keep the required inventory down to reasonable levels wherever possible.
The products and services division is a service oriented segment of the business. Many of the services offered are tied to particular product lines offered, allowing the business to create multiple income streams throughout the development of the plan. For segmentation purposes, some products have both labor and materials to manufacture a product, some have labor only when providing a service. The segmentation shown in the plan does not break the finer details of this down. This is also the case with the other two divisions as well; both can provide labor-based services with their product offering as well.
The overall projected balance sheet reflects a strong corporation capable of fully repaying the original investors, and a corporation that can attract further investors later in the plan if desired. The long-term plan for the corporation looks good as the continued growth of our distributor partner program is beginning to show good growth as well.
| Pro Forma Balance Sheet | |||||
| Year 1 | Year 2 | Year 3 | Year 4 | Year 5 | |
| Assets | |||||
| Current Assets | |||||
| Cash | $243,728 | $143,110 | $272,455 | $360,978 | $607,916 |
| Accounts Receivable | $108,902 | $187,977 | $242,857 | $299,017 | $376,546 |
| Inventory | $65,223 | $92,846 | $116,247 | $143,129 | $180,239 |
| Other Current Assets | $17,000 | $17,000 | $17,000 | $17,000 | $17,000 |
| Total Current Assets | $434,854 | $440,933 | $648,560 | $820,123 | $1,181,701 |
| Long-term Assets | |||||
| Long-term Assets | $79,500 | $79,500 | $79,500 | $79,500 | $79,500 |
| Accumulated Depreciation | $10,696 | $21,396 | $32,096 | $42,796 | $53,496 |
| Total Long-term Assets | $68,804 | $58,104 | $47,404 | $36,704 | $26,004 |
| Total Assets | $503,658 | $499,037 | $695,964 | $856,827 | $1,207,705 |
| Liabilities and Capital | Year 1 | Year 2 | Year 3 | Year 4 | Year 5 |
| Current Liabilities | |||||
| Accounts Payable | $89,189 | $67,326 | $78,761 | $100,831 | $111,863 |
| Current Borrowing | $0 | $0 | $0 | $0 | $0 |
| Other Current Liabilities | $0 | $0 | $0 | $0 | $0 |
| Subtotal Current Liabilities | $89,189 | $67,326 | $78,761 | $100,831 | $111,863 |
| Long-term Liabilities | $236,722 | $220,256 | $203,790 | $187,324 | $170,858 |
| Total Liabilities | $325,911 | $287,582 | $282,551 | $288,155 | $282,721 |
| Paid-in Capital | $455,000 | $455,000 | $805,000 | $805,000 | $805,000 |
| Retained Earnings | ($95,900) | ($277,253) | ($563,545) | ($461,587) | ($396,328) |
| Earnings | ($181,353) | $33,709 | $171,958 | $225,259 | $516,312 |
| Total Capital | $177,747 | $211,455 | $413,413 | $568,672 | $924,984 |
| Total Liabilities and Capital | $503,658 | $499,037 | $695,964 | $856,827 | $1,207,705 |
| Net Worth | $177,747 | $211,455 | $413,413 | $568,672 | $924,984 |
8.7 Business Ratios
For comparison, we have used the industry profile for an automotive parts supplier and manufacturer. JTB Technologies is very similar with distribution as a supplier (Ind sales division), and manufacturing automotive products (products and service div), with the exception of our marketing division JTB Integrated Technologies.
The averaged ratios of the 3 divisions reflect a strong growth with regards to its Gross Margins as these margins are made up of many elements combining distribution, products, and services in this plan. Initially we are slightly lower on the Gross margin in comparison to the industry profile partially due to new equipment debt load, and the training period to reach full capacity.
Our long-term assets will decline below industry profiles as equipment is paid down, but our overall Debt to Asset ratios are much better than the industry in overall results as leaner manufacturing and better coordinated use of our channel partners come into play allowing for more growth without incurring additional expense.
Our General and Administrative ratios are initially higher than the industry, but this personnel plays an essential role as the business grows towards its growth and outsourcing goals. Also the industry standard profile could reflect more automation than we have at this point, their requirements could reflect less personnel.
Our sales growth is substantially greater as we are adding new products and services each year to the plan, and our Gross average margins are also higher than the profile, due to the high profitability in our marketing products and services.
Overall our ratios are better than the industry as we have maximized our marketing budgets and marketing avenues while keeping costs in check. Further maximization comes in the form of training the sales staff on maintaining profit per order levels when processing orders. Our unique order processing Intranet, and Internet package makes for streamlined repeat ordering by customers further allowing our staff to process orders more efficiently, while reducing the internal costs of processing orders.
| Ratio Analysis | ||||||
| Year 1 | Year 2 | Year 3 | Year 4 | Year 5 | Industry Profile | |
| Sales Growth | 0.00% | 72.61% | 29.20% | 23.12% | 25.93% | 2.95% |
| Percent of Total Assets | ||||||
| Accounts Receivable | 21.62% | 37.67% | 34.90% | 34.90% | 31.18% | 24.07% |
| Inventory | 12.95% | 18.61% | 16.70% | 16.70% | 14.92% | 46.47% |
| Other Current Assets | 3.38% | 3.41% | 2.44% | 1.98% | 1.41% | 15.56% |
| Total Current Assets | 86.34% | 88.36% | 93.19% | 95.72% | 97.85% | 86.10% |
| Long-term Assets | 13.66% | 11.64% | 6.81% | 4.28% | 2.15% | 13.90% |
| Total Assets | 100.00% | 100.00% | 100.00% | 100.00% | 100.00% | 100.00% |
| Current Liabilities | 17.71% | 13.49% | 11.32% | 11.77% | 9.26% | 45.21% |
| Long-term Liabilities | 47.00% | 44.14% | 29.28% | 21.86% | 14.15% | 15.13% |
| Total Liabilities | 64.71% | 57.63% | 40.60% | 33.63% | 23.41% | 60.34% |
| Net Worth | 35.29% | 42.37% | 59.40% | 66.37% | 76.59% | 39.66% |
| Percent of Sales | ||||||
| Sales | 100.00% | 100.00% | 100.00% | 100.00% | 100.00% | 100.00% |
| Gross Margin | 16.39% | 39.35% | 42.98% | 45.35% | 46.61% | 19.32% |
| Selling, General & Administrative Expenses | 47.42% | 36.01% | 29.79% | 31.32% | 21.06% | 11.47% |
| Advertising Expenses | 2.36% | 1.78% | 1.86% | 1.58% | 1.30% | 0.31% |
| Profit Before Interest and Taxes | -26.85% | 7.04% | 14.82% | 21.27% | 26.44% | 0.58% |
| Main Ratios | ||||||
| Current | 4.88 | 6.55 | 8.23 | 8.13 | 10.56 | 1.76 |
| Quick | 4.14 | 5.17 | 6.76 | 6.71 | 8.95 | 0.67 |
| Total Debt to Total Assets | 64.71% | 57.63% | 40.60% | 33.63% | 23.41% | 64.48% |
| Pre-tax Return on Net Worth | -102.03% | 22.77% | 41.59% | 56.59% | 55.82% | 1.69% |
| Pre-tax Return on Assets | -36.01% | 9.65% | 24.71% | 37.56% | 42.75% | 4.75% |
| Additional Ratios | Year 1 | Year 2 | Year 3 | Year 4 | Year 5 | |
| Net Profit Margin | -31.03% | 3.34% | 13.19% | 14.04% | 25.55% | n.a |
| Return on Equity | -102.03% | 15.94% | 41.59% | 39.61% | 55.82% | n.a |
| Activity Ratios | ||||||
| Accounts Receivable Turnover | 4.02 | 4.02 | 4.02 | 4.02 | 4.02 | n.a |
| Collection Days | 42 | 72 | 80 | 82 | 81 | n.a |
| Inventory Turnover | 9.99 | 6.05 | 5.72 | 5.59 | 5.68 | n.a |
| Accounts Payable Turnover | 6.01 | 10.43 | 10.43 | 10.43 | 10.43 | n.a |
| Payment Days | 31 | 41 | 32 | 31 | 33 | n.a |
| Total Asset Turnover | 1.16 | 2.02 | 1.87 | 1.87 | 1.67 | n.a |
| Debt Ratios | ||||||
| Debt to Net Worth | 1.83 | 1.36 | 0.68 | 0.51 | 0.31 | n.a |
| Current Liab. to Liab. | 0.27 | 0.23 | 0.28 | 0.35 | 0.40 | n.a |
| Liquidity Ratios | ||||||
| Net Working Capital | $345,665 | $373,607 | $569,799 | $719,292 | $1,069,838 | n.a |
| Interest Coverage | -6.42 | 3.11 | 9.11 | 17.46 | 29.83 | n.a |
| Additional Ratios | ||||||
| Assets to Sales | 0.86 | 0.49 | 0.53 | 0.53 | 0.60 | n.a |
| Current Debt/Total Assets | 18% | 13% | 11% | 12% | 9% | n.a |
| Acid Test | 2.92 | 2.38 | 3.68 | 3.75 | 5.59 | n.a |
| Sales/Net Worth | 3.29 | 4.77 | 3.15 | 2.82 | 2.18 | n.a |
| Dividend Payout | 0.00 | 0.00 | 1.86 | 0.31 | 0.31 | n.a |
8.8 Long-term Plan
The long-term outlook for JTB Technologies, Inc. looks strong with continued growth in all areas. Our long-term goals for the corporation after year five of the plan would be to consider how to better position the business in its marketplace. Year five of our plan does include the addition of several satellite offices. We will monitor their performance closely and consider developing more of these highly profitable arrangements.
With our base firmly established here, our location can serve as the master model and training facility for developing other locations in the U.S. The logistical problems sometimes encountered with our products and services could also be improved with regional locations, making our offerings more attractive to potential clients.

Appendix
| Sales Forecast | |||||||||||||
| Month 1 | Month 2 | Month 3 | Month 4 | Month 5 | Month 6 | Month 7 | Month 8 | Month 9 | Month 10 | Month 11 | Month 12 | ||
| Sales | |||||||||||||
| Industrial Sales Division | 0% | $2,100 | $3,740 | $5,600 | $10,255 | $12,895 | $15,375 | $19,375 | $22,725 | $24,975 | $27,545 | $29,865 | $32,075 |
| Products and Services Div | 0% | $1,000 | $1,915 | $6,220 | $12,270 | $18,500 | $26,920 | $34,300 | $39,320 | $45,400 | $51,520 | $55,520 | $61,820 |
| Integrated Technologies Div | 0% | $0 | $0 | $0 | $0 | $0 | $600 | $600 | $1,200 | $1,800 | $4,444 | $5,810 | $8,750 |
| Total Sales | $3,100 | $5,655 | $11,820 | $22,525 | $31,395 | $42,895 | $54,275 | $63,245 | $72,175 | $83,509 | $91,195 | $102,645 | |
| Direct Cost of Sales | Month 1 | Month 2 | Month 3 | Month 4 | Month 5 | Month 6 | Month 7 | Month 8 | Month 9 | Month 10 | Month 11 | Month 12 | |
| Industrial Sales Division | $1,295 | $2,314 | $3,500 | $6,389 | $8,023 | $9,546 | $12,046 | $14,121 | $15,501 | $17,098 | $18,525 | $19,901 | |
| Products and Services Div | $490 | $1,050 | $3,340 | $6,066 | $9,587 | $14,537 | $18,654 | $21,262 | $24,573 | $29,723 | $32,721 | $37,048 | |
| Integrated Technologies Div | $0 | $0 | $0 | $0 | $0 | $384 | $384 | $768 | $1,152 | $1,577 | $1,838 | $2,345 | |
| Subtotal Direct Cost of Sales | $1,785 | $3,364 | $6,840 | $12,455 | $17,610 | $24,467 | $31,084 | $36,151 | $41,226 | $48,398 | $53,084 | $59,294 | |
| Personnel Plan | |||||||||||||
| Month 1 | Month 2 | Month 3 | Month 4 | Month 5 | Month 6 | Month 7 | Month 8 | Month 9 | Month 10 | Month 11 | Month 12 | ||
| Production Personnel | |||||||||||||
| Shipping and Receiving | $800 | $800 | $800 | $800 | $800 | $800 | $800 | $800 | $800 | $800 | $800 | $800 | |
| Application Developer | $4,000 | $4,000 | $4,000 | $4,000 | $4,000 | $4,000 | $4,000 | $4,000 | $4,000 | $4,000 | $4,000 | $4,000 | |
| Part-time App Dev/QA | $0 | $0 | $0 | $1,200 | $1,200 | $1,200 | $1,200 | $1,200 | $1,200 | $1,200 | $1,200 | $1,200 | |
| Web Developer | $3,000 | $3,000 | $3,000 | $3,000 | $3,000 | $3,000 | $3,000 | $3,000 | $3,000 | $3,000 | $3,000 | $3,000 | |
| Service Team Manager | $0 | $3,200 | $3,200 | $3,200 | $3,200 | $3,200 | $3,200 | $3,200 | $3,200 | $3,200 | $3,200 | $3,200 | |
| Service Team Member | $0 | $0 | $0 | $0 | $1,100 | $1,100 | $1,100 | $1,100 | $1,100 | $1,100 | $1,100 | $1,100 | |
| Subtotal | $7,800 | $11,000 | $11,000 | $12,200 | $13,300 | $13,300 | $13,300 | $13,300 | $13,300 | $13,300 | $13,300 | $13,300 | |
| Sales and Marketing Personnel | |||||||||||||
| Sales Team Leader | $2,500 | $2,500 | $2,500 | $2,500 | $2,500 | $2,500 | $2,500 | $2,500 | $2,500 | $2,500 | $2,500 | $2,500 | |
| Sales Associate | $0 | $0 | $900 | $900 | $900 | $900 | $900 | $900 | $900 | $900 | $900 | $900 | |
| Customer Support Manager | $0 | $0 | $0 | $0 | $0 | $0 | $0 | $0 | $0 | $2,600 | $2,600 | $2,600 | |
| Customer Support Associate | $0 | $0 | $0 | $0 | $0 | $0 | $0 | $0 | $0 | $1,200 | $1,200 | $1,200 | |
| Sales and Marketing Assoc (shared) | $0 | $250 | $250 | $250 | $250 | $250 | $250 | $250 | $250 | $500 | $500 | $1,450 | |
| Subtotal | $2,500 | $2,750 | $3,650 | $3,650 | $3,650 | $3,650 | $3,650 | $3,650 | $3,650 | $7,700 | $7,700 | $8,650 | |
| General and Administrative Personnel | |||||||||||||
| Vice President, Production Manager and Secretary | $3,600 | $3,600 | $3,600 | $3,600 | $3,600 | $3,600 | $3,600 | $3,600 | $3,600 | $3,600 | $3,600 | $3,600 | |
| President/Sales Manager | $0 | $1,200 | $1,200 | $1,200 | $1,400 | $1,400 | $1,400 | $1,600 | $1,600 | $1,600 | $1,600 | $1,600 | |
| Subtotal | $3,600 | $4,800 | $4,800 | $4,800 | $5,000 | $5,000 | $5,000 | $5,200 | $5,200 | $5,200 | $5,200 | $5,200 | |
| Other Personnel | |||||||||||||
| Name or Title | $0 | $0 | $0 | $0 | $0 | $0 | $0 | $0 | $0 | $0 | $0 | $0 | |
| Name or Title | $0 | $0 | $0 | $0 | $0 | $0 | $0 | $0 | $0 | $0 | $0 | $0 | |
| Name or Title | $0 | $0 | $0 | $0 | $0 | $0 | $0 | $0 | $0 | $0 | $0 | $0 | |
| Subtotal | $0 | $0 | $0 | $0 | $0 | $0 | $0 | $0 | $0 | $0 | $0 | $0 | |
| Total People | 6 | 8 | 9 | 10 | 11 | 11 | 11 | 11 | 11 | 13 | 13 | 13 | |
| Total Payroll | $13,900 | $18,550 | $19,450 | $20,650 | $21,950 | $21,950 | $21,950 | $22,150 | $22,150 | $26,200 | $26,200 | $27,150 | |
| General Assumptions | |||||||||||||
| Month 1 | Month 2 | Month 3 | Month 4 | Month 5 | Month 6 | Month 7 | Month 8 | Month 9 | Month 10 | Month 11 | Month 12 | ||
| Plan Month | 1 | 2 | 3 | 4 | 5 | 6 | 7 | 8 | 9 | 10 | 11 | 12 | |
| Current Interest Rate | 10.00% | 10.00% | 10.00% | 10.00% | 10.00% | 10.00% | 10.00% | 10.00% | 10.00% | 10.00% | 10.00% | 10.00% | |
| Long-term Interest Rate | 10.00% | 10.00% | 10.00% | 10.00% | 10.00% | 10.00% | 10.00% | 10.00% | 10.00% | 10.00% | 10.00% | 10.00% | |
| Tax Rate | Tax Rate | 30.00% | 30.00% | 30.00% | 30.00% | 30.00% | 30.00% | 30.00% | 30.00% | 30.00% | 30.00% | 30.00% | 30.00% |
| Other | 0 | 0 | 0 | 0 | 0 | 0 | 0 | 0 | 0 | 0 | 0 | 0 | |
| Pro Forma Profit and Loss | |||||||||||||
| Month 1 | Month 2 | Month 3 | Month 4 | Month 5 | Month 6 | Month 7 | Month 8 | Month 9 | Month 10 | Month 11 | Month 12 | ||
| Sales | $3,100 | $5,655 | $11,820 | $22,525 | $31,395 | $42,895 | $54,275 | $63,245 | $72,175 | $83,509 | $91,195 | $102,645 | |
| Direct Cost of Sales | $1,785 | $3,364 | $6,840 | $12,455 | $17,610 | $24,467 | $31,084 | $36,151 | $41,226 | $48,398 | $53,084 | $59,294 | |
| Production Payroll | $7,800 | $11,000 | $11,000 | $12,200 | $13,300 | $13,300 | $13,300 | $13,300 | $13,300 | $13,300 | $13,300 | $13,300 | |
| Contracted Graphics Development | $375 | $375 | $375 | $375 | $375 | $375 | $375 | $375 | $375 | $375 | $375 | $375 | |
| Total Cost of Sales | $9,960 | $14,739 | $18,215 | $25,030 | $31,285 | $38,142 | $44,759 | $49,826 | $54,901 | $62,073 | $66,759 | $72,969 | |
| Gross Margin | ($6,860) | ($9,084) | ($6,395) | ($2,505) | $110 | $4,753 | $9,516 | $13,419 | $17,274 | $21,436 | $24,436 | $29,676 | |
| Gross Margin % | -221.29% | -160.64% | -54.10% | -11.12% | 0.35% | 11.08% | 17.53% | 21.22% | 23.93% | 25.67% | 26.80% | 28.91% | |
| Operating Expenses | |||||||||||||
| Sales and Marketing Expenses | |||||||||||||
| Sales and Marketing Payroll | $2,500 | $2,750 | $3,650 | $3,650 | $3,650 | $3,650 | $3,650 | $3,650 | $3,650 | $7,700 | $7,700 | $8,650 | |
| Advertising/Promotion | $450 | $1,100 | $1,100 | $1,150 | $1,250 | $1,250 | $1,250 | $1,250 | $1,250 | $1,250 | $1,250 | $1,250 | |
| Other Sales and Marketing Expenses | $0 | $0 | $0 | $0 | $0 | $0 | $0 | $0 | $0 | $0 | $0 | $0 | |
| . | $0 | $0 | $0 | $0 | $0 | $0 | $0 | $0 | $0 | $0 | $0 | $0 | |
| Total Sales and Marketing Expenses | $2,950 | $3,850 | $4,750 | $4,800 | $4,900 | $4,900 | $4,900 | $4,900 | $4,900 | $8,950 | $8,950 | $9,900 | |
| Sales and Marketing % | 95.16% | 68.08% | 40.19% | 21.31% | 15.61% | 11.42% | 9.03% | 7.75% | 6.79% | 10.72% | 9.81% | 9.64% | |
| General and Administrative Expenses | |||||||||||||
| General and Administrative Payroll | $3,600 | $4,800 | $4,800 | $4,800 | $5,000 | $5,000 | $5,000 | $5,200 | $5,200 | $5,200 | $5,200 | $5,200 | |
| Sales and Marketing and Other Expenses | $450 | $450 | $450 | $450 | $450 | $450 | $950 | $950 | $950 | $950 | $950 | $950 | |
| Depreciation | $891 | $891 | $891 | $891 | $891 | $891 | $891 | $891 | $891 | $891 | $891 | $891 | |
| Rent (consolidated) | $2,200 | $2,200 | $2,200 | $2,200 | $2,200 | $2,200 | $2,200 | $2,200 | $2,200 | $2,200 | $2,200 | $2,200 | |
| Utilities (consolidated) | $1,150 | $1,150 | $1,150 | $1,150 | $1,150 | $1,150 | $1,150 | $1,250 | $1,250 | $1,250 | $1,250 | $1,250 | |
| Equipment lease Ind Prod Div | $2,999 | $2,999 | $2,999 | $2,999 | $2,999 | $2,999 | $2,999 | $2,999 | $2,999 | $2,999 | $2,999 | $2,999 | |
| Prototype and Printing Equipment | $0 | $0 | $1,071 | $1,071 | $1,071 | $1,071 | $1,071 | $1,071 | $1,071 | $1,071 | $1,071 | $1,071 | |
| Insurance (consolidated) | $950 | $950 | $950 | $950 | $950 | $950 | $1,050 | $1,050 | $1,050 | $1,050 | $1,050 | $1,050 | |
| Payroll Taxes (consolidated) | 15% | $0 | $0 | $0 | $0 | $0 | $0 | $0 | $0 | $0 | $0 | $0 | $0 |
| CPA – Accounting and Payroll | $350 | $350 | $350 | $350 | $350 | $350 | $350 | $350 | $350 | $350 | $350 | $350 | |
| Off-site secure backup storage | 15% | $30 | $30 | $30 | $30 | $30 | $30 | $30 | $30 | $30 | $30 | $30 | $30 |
| Computer maintenance and software upgrades | $0 | $0 | $0 | $0 | $0 | $2,000 | $0 | $0 | $0 | $0 | $0 | $0 | |
| Total General and Administrative Expenses | $12,620 | $13,820 | $14,891 | $14,891 | $15,091 | $17,091 | $15,691 | $15,991 | $15,991 | $15,991 | $15,991 | $15,991 | |
| General and Administrative % | 407.11% | 244.39% | 125.98% | 66.11% | 48.07% | 39.84% | 28.91% | 25.28% | 22.16% | 19.15% | 17.54% | 15.58% | |
| Other Expenses: | |||||||||||||
| Other Payroll | $0 | $0 | $0 | $0 | $0 | $0 | $0 | $0 | $0 | $0 | $0 | $0 | |
| Consultants | $0 | $0 | $0 | $0 | $0 | $0 | $0 | $0 | $0 | $0 | $0 | $0 | |
| Other Other Expenses | $0 | $0 | $0 | $0 | $0 | $0 | $0 | $0 | $0 | $0 | $0 | $0 | |
| Total Other Expenses | $0 | $0 | $0 | $0 | $0 | $0 | $0 | $0 | $0 | $0 | $0 | $0 | |
| Other % | 0.00% | 0.00% | 0.00% | 0.00% | 0.00% | 0.00% | 0.00% | 0.00% | 0.00% | 0.00% | 0.00% | 0.00% | |
| Total Operating Expenses | $15,570 | $17,670 | $19,641 | $19,691 | $19,991 | $21,991 | $20,591 | $20,891 | $20,891 | $24,941 | $24,941 | $25,891 | |
| Profit Before Interest and Taxes | ($22,430) | ($26,754) | ($26,036) | ($22,196) | ($19,881) | ($17,238) | ($11,075) | ($7,472) | ($3,617) | ($3,505) | ($505) | $3,785 | |
| EBITDA | ($21,539) | ($25,863) | ($25,145) | ($21,305) | ($18,990) | ($16,347) | ($10,184) | ($6,581) | ($2,726) | ($2,614) | $386 | $4,676 | |
| Interest Expense | $2,098 | $2,087 | $2,075 | $2,064 | $2,053 | $2,041 | $2,030 | $2,018 | $2,007 | $1,996 | $1,984 | $1,973 | |
| Taxes Incurred | $0 | $0 | $0 | $0 | $0 | $0 | $0 | $0 | $0 | $0 | $0 | $0 | |
| Net Profit | ($24,529) | ($28,841) | ($28,112) | ($24,260) | ($21,934) | ($19,279) | ($13,105) | ($9,491) | ($5,624) | ($5,501) | ($2,489) | $1,812 | |
| Net Profit/Sales | -791.24% | -510.01% | -237.83% | -107.70% | -69.86% | -44.95% | -24.15% | -15.01% | -7.79% | -6.59% | -2.73% | 1.77% | |
| Pro Forma Cash Flow | |||||||||||||
| Month 1 | Month 2 | Month 3 | Month 4 | Month 5 | Month 6 | Month 7 | Month 8 | Month 9 | Month 10 | Month 11 | Month 12 | ||
| Cash Received | |||||||||||||
| Cash from Operations | |||||||||||||
| Cash Sales | $775 | $1,414 | $2,955 | $5,631 | $7,849 | $10,724 | $13,569 | $15,811 | $18,044 | $20,877 | $22,799 | $25,661 | |
| Cash from Receivables | $0 | $1,240 | $3,347 | $6,707 | $13,147 | $20,442 | $28,146 | $36,723 | $44,294 | $51,006 | $58,665 | $65,706 | |
| Subtotal Cash from Operations | $775 | $2,654 | $6,302 | $12,339 | $20,996 | $31,166 | $41,715 | $52,535 | $62,338 | $71,883 | $81,464 | $91,367 | |
| Additional Cash Received | |||||||||||||
| Sales Tax, VAT, HST/GST Received | 0.00% | $0 | $0 | $0 | $0 | $0 | $0 | $0 | $0 | $0 | $0 | $0 | $0 |
| New Current Borrowing | $0 | $0 | $0 | $0 | $0 | $0 | $0 | $0 | $0 | $0 | $0 | $0 | |
| New Other Liabilities (interest-free) | $0 | $0 | $0 | $0 | $0 | $0 | $0 | $0 | $0 | $0 | $0 | $0 | |
| New Long-term Liabilities | $0 | $0 | $0 | $0 | $0 | $0 | $0 | $0 | $0 | $0 | $0 | $0 | |
| Sales of Other Current Assets | $0 | $0 | $0 | $0 | $0 | $0 | $0 | $0 | $0 | $0 | $0 | $0 | |
| Sales of Long-term Assets | $0 | $0 | $0 | $0 | $0 | $0 | $0 | $0 | $0 | $0 | $0 | $0 | |
| New Investment Received | $0 | $0 | $0 | $0 | $0 | $0 | $0 | $0 | $0 | $0 | $0 | $0 | |
| Subtotal Cash Received | $775 | $2,654 | $6,302 | $12,339 | $20,996 | $31,166 | $41,715 | $52,535 | $62,338 | $71,883 | $81,464 | $91,367 | |
| Expenditures | Month 1 | Month 2 | Month 3 | Month 4 | Month 5 | Month 6 | Month 7 | Month 8 | Month 9 | Month 10 | Month 11 | Month 12 | |
| Expenditures from Operations | |||||||||||||
| Cash Spending | $13,900 | $18,550 | $19,450 | $20,650 | $21,950 | $21,950 | $21,950 | $22,150 | $22,150 | $26,200 | $26,200 | $27,150 | |
| Bill Payments | $2,143 | $9,885 | $11,657 | $12,609 | $26,776 | $35,195 | $45,447 | $51,159 | $54,808 | $59,664 | $68,545 | $71,489 | |
| Subtotal Spent on Operations | $16,043 | $28,435 | $31,107 | $33,259 | $48,726 | $57,145 | $67,397 | $73,309 | $76,958 | $85,864 | $94,745 | $98,639 | |
| Additional Cash Spent | |||||||||||||
| Sales Tax, VAT, HST/GST Paid Out | $0 | $0 | $0 | $0 | $0 | $0 | $0 | $0 | $0 | $0 | $0 | $0 | |
| Principal Repayment of Current Borrowing | $0 | $0 | $0 | $0 | $0 | $0 | $0 | $0 | $0 | $0 | $0 | $0 | |
| Other Liabilities Principal Repayment | $0 | $0 | $0 | $0 | $0 | $0 | $0 | $0 | $0 | $0 | $0 | $0 | |
| Long-term Liabilities Principal Repayment | $1,369 | $1,369 | $1,369 | $1,369 | $1,369 | $1,369 | $1,369 | $1,369 | $1,369 | $1,369 | $1,369 | $1,369 | |
| Purchase Other Current Assets | $0 | $0 | $0 | $0 | $0 | $0 | $0 | $0 | $0 | $0 | $0 | $0 | |
| Purchase Long-term Assets | $0 | $0 | $0 | $0 | $0 | $0 | $0 | $0 | $0 | $0 | $0 | $0 | |
| Dividends | $0 | $0 | $0 | $0 | $0 | $0 | $0 | $0 | $0 | $0 | $0 | $0 | |
| Subtotal Cash Spent | $17,412 | $29,804 | $32,476 | $34,628 | $50,095 | $58,514 | $68,766 | $74,678 | $78,327 | $87,233 | $96,114 | $100,008 | |
| Net Cash Flow | ($16,637) | ($27,150) | ($26,174) | ($22,290) | ($29,099) | ($27,348) | ($27,051) | ($22,143) | ($15,989) | ($15,350) | ($14,651) | ($8,641) | |
| Cash Balance | $479,613 | $452,463 | $426,290 | $404,000 | $374,901 | $347,553 | $320,502 | $298,359 | $282,370 | $267,020 | $252,369 | $243,728 | |
| Pro Forma Balance Sheet | |||||||||||||
| Month 1 | Month 2 | Month 3 | Month 4 | Month 5 | Month 6 | Month 7 | Month 8 | Month 9 | Month 10 | Month 11 | Month 12 | ||
| Assets | Starting Balances | ||||||||||||
| Current Assets | |||||||||||||
| Cash | $496,250 | $479,613 | $452,463 | $426,290 | $404,000 | $374,901 | $347,553 | $320,502 | $298,359 | $282,370 | $267,020 | $252,369 | $243,728 |
| Accounts Receivable | $0 | $2,325 | $5,326 | $10,844 | $21,031 | $31,430 | $43,160 | $55,720 | $66,430 | $76,267 | $87,893 | $97,624 | $108,902 |
| Inventory | $22,000 | $20,215 | $16,851 | $10,011 | $13,701 | $19,371 | $26,914 | $34,192 | $39,766 | $45,349 | $53,238 | $58,392 | $65,223 |
| Other Current Assets | $17,000 | $17,000 | $17,000 | $17,000 | $17,000 | $17,000 | $17,000 | $17,000 | $17,000 | $17,000 | $17,000 | $17,000 | $17,000 |
| Total Current Assets | $535,250 | $519,153 | $491,640 | $464,145 | $455,731 | $442,702 | $434,626 | $427,414 | $421,555 | $420,986 | $425,151 | $425,386 | $434,854 |
| Long-term Assets | |||||||||||||
| Long-term Assets | $79,500 | $79,500 | $79,500 | $79,500 | $79,500 | $79,500 | $79,500 | $79,500 | $79,500 | $79,500 | $79,500 | $79,500 | $79,500 |
| Accumulated Depreciation | $0 | $891 | $1,783 | $2,674 | $3,565 | $4,457 | $5,348 | $6,239 | $7,131 | $8,022 | $8,913 | $9,805 | $10,696 |
| Total Long-term Assets | $79,500 | $78,609 | $77,717 | $76,826 | $75,935 | $75,043 | $74,152 | $73,261 | $72,369 | $71,478 | $70,587 | $69,695 | $68,804 |
| Total Assets | $614,750 | $597,762 | $569,358 | $540,971 | $531,666 | $517,745 | $508,778 | $500,675 | $493,924 | $492,464 | $495,737 | $495,081 | $503,658 |
| Liabilities and Capital | Month 1 | Month 2 | Month 3 | Month 4 | Month 5 | Month 6 | Month 7 | Month 8 | Month 9 | Month 10 | Month 11 | Month 12 | |
| Current Liabilities | |||||||||||||
| Accounts Payable | $2,500 | $11,409 | $13,215 | $14,309 | $30,633 | $40,016 | $51,697 | $58,068 | $62,177 | $67,709 | $77,853 | $81,055 | $89,189 |
| Current Borrowing | $0 | $0 | $0 | $0 | $0 | $0 | $0 | $0 | $0 | $0 | $0 | $0 | $0 |
| Other Current Liabilities | $0 | $0 | $0 | $0 | $0 | $0 | $0 | $0 | $0 | $0 | $0 | $0 | $0 |
| Subtotal Current Liabilities | $2,500 | $11,409 | $13,215 | $14,309 | $30,633 | $40,016 | $51,697 | $58,068 | $62,177 | $67,709 | $77,853 | $81,055 | $89,189 |
| Long-term Liabilities | $253,150 | $251,781 | $250,412 | $249,043 | $247,674 | $246,305 | $244,936 | $243,567 | $242,198 | $240,829 | $239,460 | $238,091 | $236,722 |
| Total Liabilities | $255,650 | $263,190 | $263,627 | $263,352 | $278,307 | $286,321 | $296,633 | $301,635 | $304,375 | $308,538 | $317,313 | $319,146 | $325,911 |
| Paid-in Capital | $455,000 | $455,000 | $455,000 | $455,000 | $455,000 | $455,000 | $455,000 | $455,000 | $455,000 | $455,000 | $455,000 | $455,000 | $455,000 |
| Retained Earnings | ($95,900) | ($95,900) | ($95,900) | ($95,900) | ($95,900) | ($95,900) | ($95,900) | ($95,900) | ($95,900) | ($95,900) | ($95,900) | ($95,900) | ($95,900) |
| Earnings | $0 | ($24,529) | ($53,370) | ($81,481) | ($105,742) | ($127,675) | ($146,955) | ($160,060) | ($169,551) | ($175,175) | ($180,676) | ($183,165) | ($181,353) |
| Total Capital | $359,100 | $334,571 | $305,730 | $277,619 | $253,358 | $231,425 | $212,145 | $199,040 | $189,549 | $183,925 | $178,424 | $175,935 | $177,747 |
| Total Liabilities and Capital | $614,750 | $597,762 | $569,358 | $540,971 | $531,666 | $517,745 | $508,778 | $500,675 | $493,924 | $492,464 | $495,737 | $495,081 | $503,658 |
| Net Worth | $359,100 | $334,571 | $305,730 | $277,619 | $253,358 | $231,425 | $212,145 | $199,040 | $189,549 | $183,925 | $178,424 | $175,935 | $177,747 |
| Long-term | ||||||||||
| Year 1 | Year 2 | Year 3 | Year 4 | Year 5 | Year 6 | Year 7 | Year 8 | Year 9 | Year 10 | |
| Sales | $584,434 | $1,008,798 | $1,303,319 | $1,604,704 | $2,020,771 | $2,166,942 | $2,318,189 | $2,411,867 | $2,550,497 | $2,662,957 |
| Cost of Sales | $488,658 | $611,854 | $743,119 | $876,910 | $1,078,910 | $1,146,672 | $1,232,935 | $1,283,395 | $1,364,157 | $1,431,032 |
| Gross Margin | $95,776 | $396,944 | $560,200 | $727,794 | $941,861 | $1,020,270 | $1,085,254 | $1,128,472 | $1,186,340 | $1,231,925 |
| Gross Margin % | 16.39% | 39.35% | 42.98% | 45.35% | 46.61% | 47.08% | 46.81% | 46.79% | 46.51% | 46.26% |
| Operating Expenses | $252,704 | $325,940 | $367,040 | $386,440 | $407,640 | $476,693 | $478,899 | $490,721 | $507,339 | $517,599 |
| Operating Income | ($156,928) | $71,004 | $193,160 | $341,354 | $534,221 | $543,577 | $606,355 | $637,751 | $679,001 | $714,326 |
| Net Income | ($181,353) | $33,709 | $171,958 | $225,259 | $516,312 | $365,827 | $408,077 | $429,206 | $456,968 | $480,741 |
| Current Assets | $434,854 | $440,933 | $648,560 | $820,123 | $1,181,701 | $1,348,152 | $1,543,406 | $1,734,009 | $1,949,112 | $2,144,024 |
| Long-term Assets | $68,804 | $58,104 | $47,404 | $36,704 | $26,004 | $15,304 | $4,604 | $0 | $0 | $0 |
| Current Liabilities | $89,189 | $67,326 | $78,761 | $100,831 | $111,863 | $205,573 | $223,916 | $229,108 | $250,160 | $275,017 |
| Long-term Liabilities | $236,722 | $220,256 | $203,790 | $187,324 | $170,858 | $145,230 | $119,602 | $106,460 | $93,744 | $81,028 |
| Equity | $177,747 | $211,455 | $413,413 | $568,672 | $924,984 | $1,012,653 | $1,204,492 | $1,398,441 | $1,605,208 | $1,787,979 |


