
Kona-Q
Executive Summary
Kona-Q is a fast-casual restaurant, serving fast, fresh, healthy grilled meats and vegetables. The first store will be located in Salem, Oregon with aggressive growth plans of one new store every 12 months. Kona-Q is an Oregon Corporation with Kevin Anderson as the president.
The Market
The market can be divided into two market segments, families and individuals. Families will comprise the majority of dinner time business with individuals making up the majority of lunch time business. The family segment is increasing annually at 9% with 26,585 potential customers. The individuals have a 8% growth rate with 33, 654 potential people within the segment. Kona-Q will be operating within the fast-casual niche of the restaurant industry, competing against fast food and traditional sit down restaurants.
Services and Products
Kona-Q provides an unmet dining experience. All patrons receive excellent customer service, encouraging them to return. The menu offerings are fast, simple, healthy, and easy to prepare.
Competitive Edge
The customer experience is extremely important as an effective way of distinguishing Kona-Q. Having such a good experience will encourage repeat business. The second competitive edge is Kona-Q’s offering of fast, healthy food.
Management
Kevin Anderson has spent seven years in the restaurant industry. Kevin received a dual major of accounting and entrepreneurship from Lewis and Clark College.
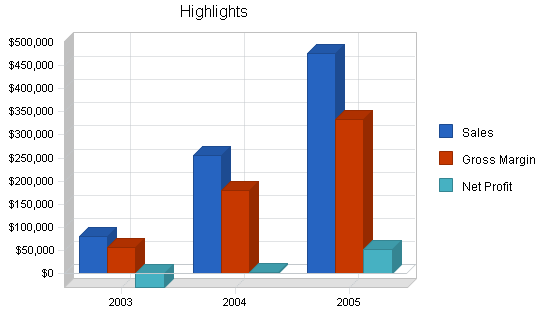
Sales have been forecasted to be $255K and $475K for years two and three. Net profit will be 9.07% for year three.
1.1 Mission
Kona-Q’s mission is to become the premier fast-casual dining experience. This will be accomplished by offering an unprecedented experience coupled with great food and reasonable prices.
1.2 Objectives
- To become the premier fast-casual restaurant in every market entered.
- To open a new store every 12 months.
- To offer high-quality food and a wonderful experience at reasonable prices.
1.3 Keys to Success
- Offer simple, delicious menu items.
- Treat every customer as if they are the only customer.
- Design and employ strict financial controls.
Company Summary
2.1 Company History
Kona-Q purchased the assets of Litto’s Bento in Salem, Oregon. This method was chosen as a way to quickly enter the market and leverage the goodwill already established from the former business.
Kevin was friends with the former owner and the menu and equipment was similar to Kona-Q’s needs. Litto’s Bento was purchased for $75,000 including equipment.
Kona-Q is forecasting for aggressive growth. The intervals for opening a new store will be approximately one every 12 months.
Each location will be 1,000 square feet, on average, able to serve approximately 50,000 people. For restaurants to succeed, the key factor is location. Kona-Q has developed criteria for future site locations.
Traffic counts are to be 20,000 or greater and near a national anchor. The decision to open a new store is not strictly every 12 months but when a new ideal location opens up.
For the opening of a new location, Kona-Q will incur the following expenses:
- $75K in build out expenses.
- $10K in equipment including BBQ, rice cooker, refrigerator, small wares, tables and chairs.

| Past Performance | |||
| 2000 | 2001 | 2002 | |
| Sales | $90,401 | $110,214 | $115,454 |
| Gross Margin | $18,080 | $22,043 | $23,091 |
| Gross Margin % | 20.00% | 20.00% | 20.00% |
| Operating Expenses | $72,321 | $88,171 | $92,363 |
| Balance Sheet | |||
| 2000 | 2001 | 2002 | |
| Current Assets | |||
| Cash | $4,546 | $5,252 | $4,989 |
| Other Current Assets | $0 | $0 | $0 |
| Total Current Assets | $4,546 | $5,252 | $4,989 |
| Long-term Assets | |||
| Long-term Assets | $19,898 | $21,112 | $22,141 |
| Accumulated Depreciation | $6,565 | $7,887 | $8,989 |
| Total Long-term Assets | $13,333 | $13,225 | $13,152 |
| Total Assets | $17,879 | $18,477 | $18,141 |
| Current Liabilities | |||
| Accounts Payable | $2,332 | $3,252 | $4,242 |
| Current Borrowing | $0 | $0 | $0 |
| Other Current Liabilities (interest free) | $0 | $0 | $0 |
| Total Current Liabilities | $2,332 | $3,252 | $4,242 |
| Long-term Liabilities | $4,000 | $3,252 | $2,858 |
| Total Liabilities | $6,332 | $6,504 | $7,100 |
| Paid-in Capital | $0 | $0 | $0 |
| Retained Earnings | $11,547 | $11,973 | $11,041 |
| Earnings | $0 | $0 | $0 |
| Total Capital | $11,547 | $11,973 | $11,041 |
| Total Capital and Liabilities | $17,879 | $18,477 | $18,141 |
| Other Inputs | |||
| Payment Days | 0 | 0 | 30 |
2.2 Company Ownership
Kevin Anderson is the main shareholder in the Oregon based corporation. A corporation was formed as a means of creating liability protection of the owners.
Services
Kona-Q provides an unmet dining experience in the fast-casual niche of the restaurant industry. All patrons receive benchmarked customer attention, encouraging them to return. The menu offerings are fast, simple, healthy, and easy to prepare.
- Chicken skewer, teriyaki or curry- $5.00
- Beef skewer, teriyaki or curry- $5.00
- Vegetable skewers, teriyaki or curry- $4.00
- Add rice, white or brown- $1.50
- Add vegetables- $2.00
- Green salad with soy ginger vinaigrette- $2.50
- Beverages include iced teas, hot teas, soft drinks, coffee, and bottled water
- Assorted pre-prepared desserts
All dishes have a signature pineapple slice for decoration and eating pleasure. All the meats are marinated in a sweet soy ginger sauce overnight.
Market Analysis Summary
The market can be divided into two market segments, families and individuals. Families will comprise the majority of dinner time business with individuals making up the majority of lunch time business.
Kona-Q will be operating within the fast-casual niche of the restaurant industry. They will be competing against other segments within the industry such as fast food as well as more traditional sit down restaurants.
4.1 Target Market Segment Strategy
Kona-Q will be focusing on families and individuals for several specific reasons. Most dinner service is for families.
As more households become two income families, the adults have less time to prepare meals. Going out to dinner eliminates the need to prepare a meal and offers time to catch up with each other.
The lunch business is driven by individuals. Many go out to lunch to get out of the work setting. Others have business meetings at lunch. This creates a large market of potential customers that is especially attractive.
4.2 Market Segmentation
The market has been segmented into two distinct groups.
Families: forecasted to contribute 67% of the dinner time revenue.
- Have 2.4 children
- >$50K in household income
- 67% have an undergraduate degree
- 26% have graduate level coursework
- Go out to eat 1.6 times a week
- Dinners out are used as a meal replacement since neither parent has time to cook a meal at home
- Sophisticated families that live within three miles of the site
Individuals: comprise 69% of the lunch time revenue.
- Ages 19-47
- Individual income average is $36,000
- 72% of the individuals over 23 have an undergraduate education
- Eat out 2.3 times a week
- Young professionals that live near the location
- Shoppers who patronize the nearby high rent stores

| Market Analysis | |||||||
| 2003 | 2004 | 2005 | 2006 | 2007 | |||
| Potential Customers | Growth | CAGR | |||||
| Families | 9% | 26,585 | 28,978 | 31,586 | 34,429 | 37,528 | 9.00% |
| Individuals | 8% | 33,654 | 36,346 | 39,254 | 42,394 | 45,786 | 8.00% |
| Total | 8.45% | 60,239 | 65,324 | 70,840 | 76,823 | 83,314 | 8.45% |
4.3 Service Business Analysis
Kona-Q operates within the large restaurant industry. While the industry has its upswings and downturns, the variance is less than the economy itself. People need to eat, they can eat in and save money, but the convenience of dining out creates a significant incentive. This is not to suggest that restaurants are recession proof, they are less affected by the general state of the economy.
Within the restaurant industry there are several different segments:
- Fast food: McDonalds, Burger King
- Pizza: delivery and dine in
- Buffets: all you can eat
- Lounges: combining food and alcohol
- Fine dining: typically at the highest price point
- Fast-casual: combination of fast service and sit down dining
Kona-Q operates within the relatively new fast-casual segment. This segment has grown in response to the increased need for quality food, in a sit down environment, but with fast service. This is a recognition that many of the customers are dining out because they do not have the time to cook themselves.
4.3.1 Competition and Buying Patterns
Kona-Q faces competition from a variety of competitors:
- Fast food: Offers the convenience of fast service. The food product is not competitive, but people are often willing to sacrifice quality for convenience.
- Take out: Take away service allows a customer to enjoy already prepared food in their home.
- Sit down dining: For customers that have the time to have a leisurely meal. Food service takes longer and the menu options are more extensive.
- Sandwich shops: Considered to be part of the fast food segment, they are a direct competitor of Kona-Q as their food product is more healthy than the fried alternatives of fast food. This competition comes primarily during lunch hours.
- Grocery markets: Serving prepared foods.
Customer buying patterns typically revolve around several different factors:

- Location: The restaurant is located near to work or home.
- Convenience: People eat out as it is quicker than preparing a meal themselves. Factors of convenience relative to sit down restaurants are the time it takes to be seated, served, and the hours of operation.
- Quality: The menu items must meet minimum levels of quality for people to be willing to spend money on the food, particularly when there are so many different options available.
Strategy and Implementation Summary
Kona-Q will leverage its two-pronged competitive edge to quickly gain market share. The competitive edge consists of an experience focus (ensuring that the customer’s experience is top notch) and offering a fast, healthy dining-out alternative. Kona-Q’s marketing effort will focus on communicating the message that it offers a convenient, healthy dining experience. This will be accomplished through a variety of ways to be detailed in the Marketing Strategy section. Kona-Q’s sales strategy will be an effort to convert potential and first-time customers into long-term customers.
5.1 Competitive Edge
Kona-Q will rely on a two part competitive advantage to help it become the premier fast-casual offering.
- The importance of the experience. With so many restaurants and prepared food being offered at grocery markets, the customer experience becomes extremely important as an effective way of distinguishing offerings. When a customer has a good experience at a restaurant, there is a significant chance that they will become a repeat customer. It is this experience that remains in the customer’s mind well after they have consumed all of their food. This memory is what is communicated to their friends and colleagues.
- Fast, healthy food alternative. There is a huge market demand for fast, convenient food that can be consumed without dietary concerns. Kona-Q offers exactly this, vegetables and meats that are grilled with or without healthy marinades and sauces that add flavor not fat. White or brown rice is offered as the starch of the meal. In addition to the plentiful amount of vegetables offered, green salads are also available.
5.2 Marketing Strategy
The goal of the marketing strategy will be to raise awareness levels regarding Kona-Q and the offerings and value. The message will be that Kona-Q is a convenient, healthy fast-casual alternative restaurant. Kona-Q will employ several marketing outlets:
- Print media advertising: The Willamette Week, a weekly entertainment guide. Similar weekly entertainment guides will be used with expansion to different cities.
- Flyers: Passed around to local businesses with coupons attached to introduce the community to Kona-Q and creating an economic incentive to try it.
- Entertainment book coupons: Presented within the first eight months of entering a market. The effectiveness of these books diminishes after approximately eight months and Kona-Q will turn to more cost effective marketing expenditures.
5.3 Sales Strategy
The strategy of the sales effort will be to convert potential and first-time customers into long-term customers. This will be accomplished using several techniques.
- Punch cards: After 10 meals purchased, the 11th will be free. Punch cards are an effective way of increasing sales from a specific customer. They are effective because they provide the customer with a sense of additional value, it gives the feeling of value with the free entree. People love getting something beyond what they pay for and the punch card provides this.
- Concentrating on the customer’s experience: Customers will not come back if they are not happy with their dining experience. All employees go through a comprehensive training process that includes training on how to offer the customer the finest experience. The employees are empowered to resolve issues and are encouraged to seek assistance from the manager for a conflict that they are unable to resolve.
5.3.1 Sales Forecast
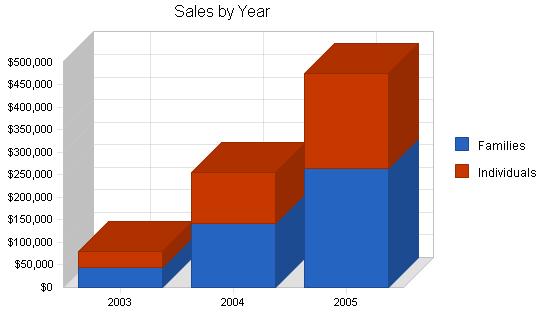
Sales will be modest during the first few months but will grow incrementally.
The second store is forecasted to open on month 13, subsequent new stores will open at the earlier indicated 12 month intervals.
Please note that the sales forecast for the first year reflects store number one. For years two and three the sales forecasts represent the company wide sales figures. Please review the following table and charts for additional detail of the sales forecasts, broken down in monthly and annual increments.

| Sales Forecast | |||
| 2003 | 2004 | 2005 | |
| Sales | |||
| Families | $45,026 | $142,545 | $265,454 |
| Individuals | $35,571 | $112,611 | $209,709 |
| Total Sales | $80,597 | $255,156 | $475,163 |
| Direct Cost of Sales | 2003 | 2004 | 2005 |
| Families | $13,508 | $42,764 | $79,636 |
| Individuals | $10,671 | $33,783 | $62,913 |
| Subtotal Direct Cost of Sales | $24,179 | $76,547 | $142,549 |
5.4 Milestones
Kona-Q has identified four milestones for the organization. The milestones were chosen to develop achievable yet lofty performance goals for Kona-Q. The milestones were picked to be easy to measure. The following table offers detailed information regarding the milestones.
| Milestones | |||||
| Milestone | Start Date | End Date | Budget | Manager | Department |
| Completion of the business plan | 1/1/2003 | 2/15/2003 | $0 | Kevin | Operations |
| Opening of the second store | 1/1/2003 | 1/30/2004 | $0 | Kevin | Business development |
| Profitability | 1/1/2003 | 4/30/2005 | $0 | Kevin | Accounting |
| Expansion into a new market | 1/1/2003 | 02/30/06 | $0 | Kevin | Business development |
| Totals | $0 | ||||
Web Plan Summary
Kona-Q will have a Web presence with a simple, user-friendly website. The website will be used for menu information, contact and location information, as well as background for the story of Kona-Q.
Currently, Kona-Q has no plans to offer online menu ordering. Kona-Q will reconsider this decision at a later date if it appears that customer demand requests this feature.
6.1 Website Marketing Strategy
The website will rely on two methods of marketing as a means for developing awareness of the site and increasing the number of visitors.
- Search engine submission: The website will be submitted to various search engines.
- Printed material: Kona-Q will reference the website address on all printed material that is passed out including menus, business cards, and advertising media.
6.2 Development Requirements
Kona-Q has identified a skilled Web designer to design and develop the website. This programmer has impressive credentials from the State of Oregon Web development department. Kona-Q has negotiated a below market bid for the website.
Management Summary
Kevin Anderson is the driving force behind Kona-Q. Kevin has spent the last seven years in the restaurant industry. Kevin received his undergraduate degree, a dual major of accounting and entrepreneurship from Lewis and Clark in Portland, Oregon.
7.1 Personnel Plan
- Kevin: New site searches, build out project management, accounting, and grill operation.
- Cook: Food preparation and cooking.
- Misc.: Busing, dishwashing, cleaning, and other assorted activities.
- Manager: Assigned to each store.
| Personnel Plan | |||
| 2003 | 2004 | 2005 | |
| Kevin | $24,000 | $30,000 | $34,000 |
| Cook | $12,650 | $27,600 | $41,400 |
| Manager | $0 | $20,000 | $40,000 |
| Misc. | $9,900 | $21,600 | $32,400 |
| Total People | 3 | 6 | 9 |
| Total Payroll | $46,550 | $99,200 | $147,800 |
Financial Plan
The following sections will outline important financial information.
8.1 Important Assumptions
The following section will detail important Financial Assumptions.
| General Assumptions | |||
| 2003 | 2004 | 2005 | |
| Plan Month | 1 | 2 | 3 |
| Current Interest Rate | 10.00% | 10.00% | 10.00% |
| Long-term Interest Rate | 10.00% | 10.00% | 10.00% |
| Tax Rate | 30.00% | 30.00% | 30.00% |
| Other | 0 | 0 | 0 |
8.2 Projected Cash Flow
The following chart and table will indicate Projected Cash Flow.

| Pro Forma Cash Flow | |||
| 2003 | 2004 | 2005 | |
| Cash Received | |||
| Cash from Operations | |||
| Cash Sales | $80,597 | $255,156 | $475,163 |
| Subtotal Cash from Operations | $80,597 | $255,156 | $475,163 |
| Additional Cash Received | |||
| Sales Tax, VAT, HST/GST Received | $0 | $0 | $0 |
| New Current Borrowing | $20,000 | $0 | $0 |
| New Other Liabilities (interest-free) | $0 | $0 | $0 |
| New Long-term Liabilities | $0 | $75,000 | $75,000 |
| Sales of Other Current Assets | $0 | $0 | $0 |
| Sales of Long-term Assets | $0 | $0 | $0 |
| New Investment Received | $10,000 | $0 | $0 |
| Subtotal Cash Received | $110,597 | $330,156 | $550,163 |
| Expenditures | 2003 | 2004 | 2005 |
| Expenditures from Operations | |||
| Cash Spending | $46,550 | $99,200 | $147,800 |
| Bill Payments | $50,960 | $127,404 | $242,199 |
| Subtotal Spent on Operations | $97,510 | $226,604 | $389,999 |
| Additional Cash Spent | |||
| Sales Tax, VAT, HST/GST Paid Out | $0 | $0 | $0 |
| Principal Repayment of Current Borrowing | $5,500 | $5,500 | $5,500 |
| Other Liabilities Principal Repayment | $0 | $0 | $0 |
| Long-term Liabilities Principal Repayment | $0 | $7,500 | $7,500 |
| Purchase Other Current Assets | $0 | $0 | $0 |
| Purchase Long-term Assets | $0 | $75,000 | $75,000 |
| Dividends | $0 | $0 | $0 |
| Subtotal Cash Spent | $103,010 | $314,604 | $477,999 |
| Net Cash Flow | $7,586 | $15,552 | $72,164 |
| Cash Balance | $12,575 | $28,127 | $100,291 |
8.3 Break-even Analysis
The Break-even Analysis indicates that $10,099 will be needed in monthly revenue to reach the break-even point.

| Break-even Analysis | |
| Monthly Revenue Break-even | $10,099 |
| Assumptions: | |
| Average Percent Variable Cost | 30% |
| Estimated Monthly Fixed Cost | $7,069 |
8.4 Projected Profit and Loss
The following table indicates Projected Profit and Loss.


| Pro Forma Profit and Loss | |||
| 2003 | 2004 | 2005 | |
| Sales | $80,597 | $255,156 | $475,163 |
| Direct Cost of Sales | $24,179 | $76,547 | $142,549 |
| Other Costs of Sales | $0 | $0 | $0 |
| Total Cost of Sales | $24,179 | $76,547 | $142,549 |
| Gross Margin | $56,418 | $178,609 | $332,614 |
| Gross Margin % | 70.00% | 70.00% | 70.00% |
| Expenses | |||
| Payroll | $46,550 | $99,200 | $147,800 |
| Sales and Marketing and Other Expenses | $3,600 | $7,200 | $10,000 |
| Depreciation | $12,996 | $20,000 | $24,000 |
| Rent | $9,000 | $18,000 | $27,000 |
| Utilities | $2,400 | $4,800 | $7,200 |
| Insurance | $2,400 | $4,800 | $7,200 |
| Payroll Taxes | $6,983 | $14,880 | $22,170 |
| Other | $900 | $1,800 | $2,700 |
| Total Operating Expenses | $84,829 | $170,680 | $248,070 |
| Profit Before Interest and Taxes | ($28,411) | $7,929 | $84,544 |
| EBITDA | ($15,415) | $27,929 | $108,544 |
| Interest Expense | $1,867 | $4,836 | $11,036 |
| Taxes Incurred | $0 | $928 | $22,052 |
| Net Profit | ($30,278) | $2,165 | $51,456 |
| Net Profit/Sales | -37.57% | 0.85% | 10.83% |
8.5 Projected Balance Sheet
The following table will indicate the Projected Balance Sheet.
| Pro Forma Balance Sheet | |||
| 2003 | 2004 | 2005 | |
| Assets | |||
| Current Assets | |||
| Cash | $12,575 | $28,127 | $100,291 |
| Other Current Assets | $0 | $0 | $0 |
| Total Current Assets | $12,575 | $28,127 | $100,291 |
| Long-term Assets | |||
| Long-term Assets | $22,141 | $97,141 | $172,141 |
| Accumulated Depreciation | $21,985 | $41,985 | $65,985 |
| Total Long-term Assets | $156 | $55,156 | $106,156 |
| Total Assets | $12,731 | $83,283 | $206,447 |
| Liabilities and Capital | 2003 | 2004 | 2005 |
| Current Liabilities | |||
| Accounts Payable | $4,610 | $10,996 | $20,705 |
| Current Borrowing | $14,500 | $9,000 | $3,500 |
| Other Current Liabilities | $0 | $0 | $0 |
| Subtotal Current Liabilities | $19,110 | $19,996 | $24,205 |
| Long-term Liabilities | $2,858 | $70,358 | $137,858 |
| Total Liabilities | $21,968 | $90,354 | $162,063 |
| Paid-in Capital | $10,000 | $10,000 | $10,000 |
| Retained Earnings | $11,041 | ($19,237) | ($17,071) |
| Earnings | ($30,278) | $2,165 | $51,456 |
| Total Capital | ($9,237) | ($7,071) | $44,384 |
| Total Liabilities and Capital | $12,731 | $83,283 | $206,447 |
| Net Worth | ($9,237) | ($7,071) | $44,384 |
8.6 Business Ratios
The following table indicates common Business Ratios specific to Kona-Q as well as industry ratios.
| Ratio Analysis | ||||
| 2003 | 2004 | 2005 | Industry Profile | |
| Sales Growth | -30.19% | 216.58% | 86.22% | 6.96% |
| Percent of Total Assets | ||||
| Other Current Assets | 0.00% | 0.00% | 0.00% | 28.39% |
| Total Current Assets | 98.77% | 33.77% | 48.58% | 37.68% |
| Long-term Assets | 1.23% | 66.23% | 51.42% | 62.32% |
| Total Assets | 100.00% | 100.00% | 100.00% | 100.00% |
| Current Liabilities | 150.10% | 24.01% | 11.72% | 19.17% |
| Long-term Liabilities | 22.45% | 84.48% | 66.78% | 29.21% |
| Total Liabilities | 172.55% | 108.49% | 78.50% | 48.38% |
| Net Worth | -72.55% | -8.49% | 21.50% | 51.62% |
| Percent of Sales | ||||
| Sales | 100.00% | 100.00% | 100.00% | 100.00% |
| Gross Margin | 70.00% | 70.00% | 70.00% | 59.31% |
| Selling, General & Administrative Expenses | 105.61% | 70.92% | 60.97% | 39.09% |
| Advertising Expenses | 0.00% | 0.00% | 0.00% | 2.75% |
| Profit Before Interest and Taxes | -35.25% | 3.11% | 17.79% | 1.59% |
| Main Ratios | ||||
| Current | 0.66 | 1.41 | 4.14 | 1.26 |
| Quick | 0.66 | 1.41 | 4.14 | 0.87 |
| Total Debt to Total Assets | 172.55% | 108.49% | 78.50% | 3.27% |
| Pre-tax Return on Net Worth | 327.79% | -43.75% | 165.62% | 54.38% |
| Pre-tax Return on Assets | -237.82% | 3.71% | 35.61% | 7.17% |
| Additional Ratios | 2003 | 2004 | 2005 | |
| Net Profit Margin | -37.57% | 0.85% | 10.83% | n.a |
| Return on Equity | 0.00% | 0.00% | 115.93% | n.a |
| Activity Ratios | ||||
| Accounts Payable Turnover | 11.13 | 12.17 | 12.17 | n.a |
| Payment Days | 29 | 21 | 23 | n.a |
| Total Asset Turnover | 6.33 | 3.06 | 2.30 | n.a |
| Debt Ratios | ||||
| Debt to Net Worth | 0.00 | 0.00 | 3.65 | n.a |
| Current Liab. to Liab. | 0.87 | 0.22 | 0.15 | n.a |
| Liquidity Ratios | ||||
| Net Working Capital | ($6,535) | $8,131 | $76,086 | n.a |
| Interest Coverage | -15.22 | 1.64 | 7.66 | n.a |
| Additional Ratios | ||||
| Assets to Sales | 0.16 | 0.33 | 0.43 | n.a |
| Current Debt/Total Assets | 150% | 24% | 12% | n.a |
| Acid Test | 0.66 | 1.41 | 4.14 | n.a |
| Sales/Net Worth | 0.00 | 0.00 | 10.71 | n.a |
| Dividend Payout | 0.00 | 0.00 | 0.00 | n.a |
Appendix
| Sales Forecast | |||||||||||||
| Jan | Feb | Mar | Apr | May | Jun | Jul | Aug | Sep | Oct | Nov | Dec | ||
| Sales | |||||||||||||
| Families | 0% | $0 | $3,445 | $3,665 | $3,701 | $3,898 | $3,998 | $4,141 | $4,202 | $4,336 | $4,454 | $4,545 | $4,641 |
| Individuals | 0% | $0 | $2,722 | $2,895 | $2,924 | $3,079 | $3,158 | $3,271 | $3,320 | $3,425 | $3,519 | $3,591 | $3,666 |
| Total Sales | $0 | $6,167 | $6,560 | $6,625 | $6,977 | $7,156 | $7,412 | $7,522 | $7,761 | $7,973 | $8,136 | $8,307 | |
| Direct Cost of Sales | Jan | Feb | Mar | Apr | May | Jun | Jul | Aug | Sep | Oct | Nov | Dec | |
| Families | $0 | $1,034 | $1,100 | $1,110 | $1,169 | $1,199 | $1,242 | $1,261 | $1,301 | $1,336 | $1,364 | $1,392 | |
| Individuals | $0 | $816 | $869 | $877 | $924 | $948 | $981 | $996 | $1,028 | $1,056 | $1,077 | $1,100 | |
| Subtotal Direct Cost of Sales | $0 | $1,850 | $1,968 | $1,987 | $2,093 | $2,147 | $2,224 | $2,256 | $2,328 | $2,392 | $2,441 | $2,492 | |
| Personnel Plan | |||||||||||||
| Jan | Feb | Mar | Apr | May | Jun | Jul | Aug | Sep | Oct | Nov | Dec | ||
| Kevin | 0% | $2,000 | $2,000 | $2,000 | $2,000 | $2,000 | $2,000 | $2,000 | $2,000 | $2,000 | $2,000 | $2,000 | $2,000 |
| Cook | 0% | $0 | $1,150 | $1,150 | $1,150 | $1,150 | $1,150 | $1,150 | $1,150 | $1,150 | $1,150 | $1,150 | $1,150 |
| Manager | 0% | $0 | $0 | $0 | $0 | $0 | $0 | $0 | $0 | $0 | $0 | $0 | $0 |
| Misc. | 0% | $0 | $900 | $900 | $900 | $900 | $900 | $900 | $900 | $900 | $900 | $900 | $900 |
| Total People | 1 | 3 | 3 | 3 | 3 | 3 | 3 | 3 | 3 | 3 | 3 | 3 | |
| Total Payroll | $2,000 | $4,050 | $4,050 | $4,050 | $4,050 | $4,050 | $4,050 | $4,050 | $4,050 | $4,050 | $4,050 | $4,050 | |
| General Assumptions | |||||||||||||
| Jan | Feb | Mar | Apr | May | Jun | Jul | Aug | Sep | Oct | Nov | Dec | ||
| Plan Month | 1 | 2 | 3 | 4 | 5 | 6 | 7 | 8 | 9 | 10 | 11 | 12 | |
| Current Interest Rate | 10.00% | 10.00% | 10.00% | 10.00% | 10.00% | 10.00% | 10.00% | 10.00% | 10.00% | 10.00% | 10.00% | 10.00% | |
| Long-term Interest Rate | 10.00% | 10.00% | 10.00% | 10.00% | 10.00% | 10.00% | 10.00% | 10.00% | 10.00% | 10.00% | 10.00% | 10.00% | |
| Tax Rate | 30.00% | 30.00% | 30.00% | 30.00% | 30.00% | 30.00% | 30.00% | 30.00% | 30.00% | 30.00% | 30.00% | 30.00% | |
| Other | 0 | 0 | 0 | 0 | 0 | 0 | 0 | 0 | 0 | 0 | 0 | 0 | |
| Pro Forma Profit and Loss | |||||||||||||
| Jan | Feb | Mar | Apr | May | Jun | Jul | Aug | Sep | Oct | Nov | Dec | ||
| Sales | $0 | $6,167 | $6,560 | $6,625 | $6,977 | $7,156 | $7,412 | $7,522 | $7,761 | $7,973 | $8,136 | $8,307 | |
| Direct Cost of Sales | $0 | $1,850 | $1,968 | $1,987 | $2,093 | $2,147 | $2,224 | $2,256 | $2,328 | $2,392 | $2,441 | $2,492 | |
| Other Costs of Sales | $0 | $0 | $0 | $0 | $0 | $0 | $0 | $0 | $0 | $0 | $0 | $0 | |
| Total Cost of Sales | $0 | $1,850 | $1,968 | $1,987 | $2,093 | $2,147 | $2,224 | $2,256 | $2,328 | $2,392 | $2,441 | $2,492 | |
| Gross Margin | $0 | $4,317 | $4,592 | $4,637 | $4,884 | $5,009 | $5,189 | $5,265 | $5,433 | $5,581 | $5,695 | $5,815 | |
| Gross Margin % | 0.00% | 70.00% | 70.00% | 70.00% | 70.00% | 70.00% | 70.00% | 70.00% | 70.00% | 70.00% | 70.00% | 70.00% | |
| Expenses | |||||||||||||
| Payroll | $2,000 | $4,050 | $4,050 | $4,050 | $4,050 | $4,050 | $4,050 | $4,050 | $4,050 | $4,050 | $4,050 | $4,050 | |
| Sales and Marketing and Other Expenses | $300 | $300 | $300 | $300 | $300 | $300 | $300 | $300 | $300 | $300 | $300 | $300 | |
| Depreciation | $1,083 | $1,083 | $1,083 | $1,083 | $1,083 | $1,083 | $1,083 | $1,083 | $1,083 | $1,083 | $1,083 | $1,083 | |
| Rent | $750 | $750 | $750 | $750 | $750 | $750 | $750 | $750 | $750 | $750 | $750 | $750 | |
| Utilities | $200 | $200 | $200 | $200 | $200 | $200 | $200 | $200 | $200 | $200 | $200 | $200 | |
| Insurance | $200 | $200 | $200 | $200 | $200 | $200 | $200 | $200 | $200 | $200 | $200 | $200 | |
| Payroll Taxes | 15% | $300 | $608 | $608 | $608 | $608 | $608 | $608 | $608 | $608 | $608 | $608 | $608 |
| Other | $75 | $75 | $75 | $75 | $75 | $75 | $75 | $75 | $75 | $75 | $75 | $75 | |
| Total Operating Expenses | $4,908 | $7,266 | $7,266 | $7,266 | $7,266 | $7,266 | $7,266 | $7,266 | $7,266 | $7,266 | $7,266 | $7,266 | |
| Profit Before Interest and Taxes | ($4,908) | ($2,949) | ($2,673) | ($2,628) | ($2,381) | ($2,256) | ($2,077) | ($2,000) | ($1,832) | ($1,685) | ($1,571) | ($1,450) | |
| EBITDA | ($3,825) | ($1,866) | ($1,590) | ($1,545) | ($1,298) | ($1,173) | ($994) | ($917) | ($749) | ($602) | ($488) | ($367) | |
| Interest Expense | $24 | $190 | $186 | $181 | $177 | $172 | $168 | $163 | $158 | $154 | $149 | $145 | |
| Taxes Incurred | $0 | $0 | $0 | $0 | $0 | $0 | $0 | $0 | $0 | $0 | $0 | $0 | |
| Net Profit | ($4,932) | ($3,139) | ($2,859) | ($2,809) | ($2,558) | ($2,428) | ($2,244) | ($2,163) | ($1,991) | ($1,838) | ($1,720) | ($1,595) | |
| Net Profit/Sales | 0.00% | -50.91% | -43.58% | -42.41% | -36.66% | -33.93% | -30.28% | -28.76% | -25.65% | -23.06% | -21.14% | -19.20% | |
| Pro Forma Cash Flow | |||||||||||||
| Jan | Feb | Mar | Apr | May | Jun | Jul | Aug | Sep | Oct | Nov | Dec | ||
| Cash Received | |||||||||||||
| Cash from Operations | |||||||||||||
| Cash Sales | $0 | $6,167 | $6,560 | $6,625 | $6,977 | $7,156 | $7,412 | $7,522 | $7,761 | $7,973 | $8,136 | $8,307 | |
| Subtotal Cash from Operations | $0 | $6,167 | $6,560 | $6,625 | $6,977 | $7,156 | $7,412 | $7,522 | $7,761 | $7,973 | $8,136 | $8,307 | |
| Additional Cash Received | |||||||||||||
| Sales Tax, VAT, HST/GST Received | 0.00% | $0 | $0 | $0 | $0 | $0 | $0 | $0 | $0 | $0 | $0 | $0 | $0 |
| New Current Borrowing | $0 | $20,000 | $0 | $0 | $0 | $0 | $0 | $0 | $0 | $0 | $0 | $0 | |
| New Other Liabilities (interest-free) | $0 | $0 | $0 | $0 | $0 | $0 | $0 | $0 | $0 | $0 | $0 | $0 | |
| New Long-term Liabilities | $0 | $0 | $0 | $0 | $0 | $0 | $0 | $0 | $0 | $0 | $0 | $0 | |
| Sales of Other Current Assets | $0 | $0 | $0 | $0 | $0 | $0 | $0 | $0 | $0 | $0 | $0 | $0 | |
| Sales of Long-term Assets | $0 | $0 | $0 | $0 | $0 | $0 | $0 | $0 | $0 | $0 | $0 | $0 | |
| New Investment Received | $10,000 | $0 | $0 | $0 | $0 | $0 | $0 | $0 | $0 | $0 | $0 | $0 | |
| Subtotal Cash Received | $10,000 | $26,167 | $6,560 | $6,625 | $6,977 | $7,156 | $7,412 | $7,522 | $7,761 | $7,973 | $8,136 | $8,307 | |
| Expenditures | Jan | Feb | Mar | Apr | May | Jun | Jul | Aug | Sep | Oct | Nov | Dec | |
| Expenditures from Operations | |||||||||||||
| Cash Spending | $2,000 | $4,050 | $4,050 | $4,050 | $4,050 | $4,050 | $4,050 | $4,050 | $4,050 | $4,050 | $4,050 | $4,050 | |
| Bill Payments | $4,304 | $1,926 | $4,177 | $4,287 | $4,305 | $4,404 | $4,454 | $4,525 | $4,554 | $4,621 | $4,680 | $4,724 | |
| Subtotal Spent on Operations | $6,304 | $5,976 | $8,227 | $8,337 | $8,355 | $8,454 | $8,504 | $8,575 | $8,604 | $8,671 | $8,730 | $8,774 | |
| Additional Cash Spent | |||||||||||||
| Sales Tax, VAT, HST/GST Paid Out | $0 | $0 | $0 | $0 | $0 | $0 | $0 | $0 | $0 | $0 | $0 | $0 | |
| Principal Repayment of Current Borrowing | $0 | $0 | $550 | $550 | $550 | $550 | $550 | $550 | $550 | $550 | $550 | $550 | |
| Other Liabilities Principal Repayment | $0 | $0 | $0 | $0 | $0 | $0 | $0 | $0 | $0 | $0 | $0 | $0 | |
| Long-term Liabilities Principal Repayment | $0 | $0 | $0 | $0 | $0 | $0 | $0 | $0 | $0 | $0 | $0 | $0 | |
| Purchase Other Current Assets | $0 | $0 | $0 | $0 | $0 | $0 | $0 | $0 | $0 | $0 | $0 | $0 | |
| Purchase Long-term Assets | $0 | $0 | $0 | $0 | $0 | $0 | $0 | $0 | $0 | $0 | $0 | $0 | |
| Dividends | $0 | $0 | $0 | $0 | $0 | $0 | $0 | $0 | $0 | $0 | $0 | $0 | |
| Subtotal Cash Spent | $6,304 | $5,976 | $8,777 | $8,887 | $8,905 | $9,004 | $9,054 | $9,125 | $9,154 | $9,221 | $9,280 | $9,324 | |
| Net Cash Flow | $3,696 | $20,190 | ($2,216) | ($2,262) | ($1,927) | ($1,848) | ($1,642) | ($1,603) | ($1,393) | ($1,249) | ($1,144) | ($1,017) | |
| Cash Balance | $8,685 | $28,876 | $26,659 | $24,397 | $22,470 | $20,622 | $18,981 | $17,377 | $15,985 | $14,736 | $13,592 | $12,575 | |
| Pro Forma Balance Sheet | |||||||||||||
| Jan | Feb | Mar | Apr | May | Jun | Jul | Aug | Sep | Oct | Nov | Dec | ||
| Assets | Starting Balances | ||||||||||||
| Current Assets | |||||||||||||
| Cash | $4,989 | $8,685 | $28,876 | $26,659 | $24,397 | $22,470 | $20,622 | $18,981 | $17,377 | $15,985 | $14,736 | $13,592 | $12,575 |
| Other Current Assets | $0 | $0 | $0 | $0 | $0 | $0 | $0 | $0 | $0 | $0 | $0 | $0 | $0 |
| Total Current Assets | $4,989 | $8,685 | $28,876 | $26,659 | $24,397 | $22,470 | $20,622 | $18,981 | $17,377 | $15,985 | $14,736 | $13,592 | $12,575 |
| Long-term Assets | |||||||||||||
| Long-term Assets | $22,141 | $22,141 | $22,141 | $22,141 | $22,141 | $22,141 | $22,141 | $22,141 | $22,141 | $22,141 | $22,141 | $22,141 | $22,141 |
| Accumulated Depreciation | $8,989 | $10,072 | $11,155 | $12,238 | $13,321 | $14,404 | $15,487 | $16,570 | $17,653 | $18,736 | $19,819 | $20,902 | $21,985 |
| Total Long-term Assets | $13,152 | $12,069 | $10,986 | $9,903 | $8,820 | $7,737 | $6,654 | $5,571 | $4,488 | $3,405 | $2,322 | $1,239 | $156 |
| Total Assets | $18,141 | $20,754 | $39,862 | $36,562 | $33,217 | $30,207 | $27,276 | $24,552 | $21,865 | $19,390 | $17,058 | $14,831 | $12,731 |
| Liabilities and Capital | Jan | Feb | Mar | Apr | May | Jun | Jul | Aug | Sep | Oct | Nov | Dec | |
| Current Liabilities | |||||||||||||
| Accounts Payable | $4,242 | $1,787 | $4,034 | $4,144 | $4,158 | $4,256 | $4,303 | $4,373 | $4,400 | $4,465 | $4,522 | $4,565 | $4,610 |
| Current Borrowing | $0 | $0 | $20,000 | $19,450 | $18,900 | $18,350 | $17,800 | $17,250 | $16,700 | $16,150 | $15,600 | $15,050 | $14,500 |
| Other Current Liabilities | $0 | $0 | $0 | $0 | $0 | $0 | $0 | $0 | $0 | $0 | $0 | $0 | $0 |
| Subtotal Current Liabilities | $4,242 | $1,787 | $24,034 | $23,594 | $23,058 | $22,606 | $22,103 | $21,623 | $21,100 | $20,615 | $20,122 | $19,615 | $19,110 |
| Long-term Liabilities | $2,858 | $2,858 | $2,858 | $2,858 | $2,858 | $2,858 | $2,858 | $2,858 | $2,858 | $2,858 | $2,858 | $2,858 | $2,858 |
| Total Liabilities | $7,100 | $4,645 | $26,892 | $26,452 | $25,916 | $25,464 | $24,961 | $24,481 | $23,958 | $23,473 | $22,980 | $22,473 | $21,968 |
| Paid-in Capital | $0 | $10,000 | $10,000 | $10,000 | $10,000 | $10,000 | $10,000 | $10,000 | $10,000 | $10,000 | $10,000 | $10,000 | $10,000 |
| Retained Earnings | $11,041 | $11,041 | $11,041 | $11,041 | $11,041 | $11,041 | $11,041 | $11,041 | $11,041 | $11,041 | $11,041 | $11,041 | $11,041 |
| Earnings | $0 | ($4,932) | ($8,071) | ($10,930) | ($13,740) | ($16,298) | ($18,726) | ($20,970) | ($23,134) | ($25,125) | ($26,963) | ($28,683) | ($30,278) |
| Total Capital | $11,041 | $16,109 | $12,970 | $10,111 | $7,301 | $4,743 | $2,315 | $71 | ($2,093) | ($4,084) | ($5,922) | ($7,642) | ($9,237) |
| Total Liabilities and Capital | $18,141 | $20,754 | $39,862 | $36,562 | $33,217 | $30,207 | $27,276 | $24,552 | $21,865 | $19,390 | $17,058 | $14,831 | $12,731 |
| Net Worth | $11,041 | $16,109 | $12,970 | $10,111 | $7,301 | $4,743 | $2,315 | $71 | ($2,093) | ($4,084) | ($5,922) | ($7,642) | ($9,237) |


