
Southeast Health Plans
Executive Summary
Southeast Health Plans, Inc. is a service company that will provide health plan administrative services to self-insured employers. The company will concentrate on employers with 50 to 500 employees. Many of these employers have current HMO, PPO, or major national insurance carrier health plans. While the majority of employers with 500 or more employees have at least some element of self-insurance incorporated into their health care programs, our target market is often ignored by the major national insurance companies. While more than 80% of companies with 500 or more employees are self-insured, the management of Southeast Health Plans has identified that less than 25% of Atlanta area companies with 50 to 500 employees have self-insured plans.
The market for self-insured and administrative services consist of those companies that are currently self-insured and companies that have other types of health plans that will be encouraged to shift to self-insurance. One factor in the transition to self-insurance is the availability of quality administrative and consultative services. Southeast Health Plans, Inc. is led by experienced management and has formed a strategic alliance with Blair Mill Administrator, a wholly owned subsidiary of Blue Cross/Blue Shield of Pennsylvania, for the purpose of providing first class benefits management services to its target market.
Southeast Health Plans, Inc. will achieve revenue of more than $5 million in five years with a net profit after tax of $1.6 million. The company will turn profitable in year three with after-tax earnings of $560 thousand. As a marketing organization and service provider, margins will be extremely high with gross margins above 80% (less only sales incentive costs) and approaching 50% after all operating expenses, once market penetration has reached maturity.
The key to success for Southeast Plans, Inc. will be the ability to attract the initial capital in order to successfully market its services in the metro Atlanta area and in northern Georgia. Adequate professional sales staffing is essential. The company must then expand a successful formula throughout Southeastern markets. Cost control, particularly with regard to sales and marketing programs, will enable controlled expansion that is fully funded by internal cash flow.

1.1 Objectives
The objectives for the company are:
- To initiate co-operative marketing utilizing Blair Mill advertising executions with media in the Atlanta metro market.
- To hire sales staff both currently identified and unidentified to implement sales lead follow-up strategy.
- To have at least 4,800 cumulative employees under management by the end of year one.
- To approach break-even by the end of year two holding total loss for the second year under $100 thousand while increasing market share.
- To shift to earnings in year three and to accelerate gross margin contributions by building market maturity on top of infrastructure.
- To expand regionally with both media and sales personnel to penetrate new markets while consolidating service capability.
- To constantly achieve cost benefit through an expanding provider network while not compromising patient care.
- To have more than 98,000 cumulative employees under management by the end of year five.
1.2 Mission
Southeast Health Plans, Inc. is dedicated to providing small and mid-size employers with a comprehensive benefits administration program that will enable employers to control health benefits costs while allowing employees within the plan to have access to quality health care. By combining self-insurance with stop-loss programs and efficient plan administration Southeast will provide to its clientele, both employers and employees, the best of health care with the minimum of restrictions and the broadest individual choice of providers. Southeast will deliver a balance of quality care and freedom of choice at a fair price.
1.3 Keys to Success
The keys to success in this business are:
- Marketing. Southeast Health Plans will have the ability to sell both directly to employers and through independent insurance brokers and agents. It will be necessary to establish name recognition among more established programs. It is essential that media budgets be controlled and that closing ratios of at least 5% of leads per year be maintained.
- Service quality. The services provided by Blair Mill Administrators are already state-of-the art among small-employer providers. The value added experience of the Southeast Health Plans, Inc. management team and their provider networks will ensure customer satisfaction. It is a necessity that clients maintain satisfaction both with service and plan cost to minimize client erosion and to combat competition. Renewals should exceed 85% of established clients.
- Controlled growth. Growth needs to be aggressive with rapid expansion to new geographic markets but also must focus on profitability. Each established market must mature as new markets develop so that growth can be internally funded. Cash flow management is essential. Both market expansion and media effectiveness must be constantly tested, and then reviewed or refined as required.
Company Summary
Southeast Health Plans, Inc. is a service company founded by experienced medical insurance industry executives to both serve and capitalize upon the growing number of small and midsize companies that seek to control health benefits costs and manage risk by self-insurance.
The utilization of Blair Mill’s existing services, products and infrastructure enables Southeast to provide necessary service without incurring the costs of establishing proprietary programs. In addition, Blair Mill’s existing provider networks enable Southeast to serve employers with multiple locations or a wide-spread workforce.
Southeast targets those employers who have from 50 to 500 employees. Services include all-encompassing benefit management programs. Blair Mill Administrators will be utilized to provide benefits management services including:
- A full array of managed care services
- Patient care management
- Local, regional, and national provider networks
- Tailored administrative services
- Flexible plan design
- Underwriting and actuarial services
- Comprehensive information management and data reporting
- Thorough stop-loss insurance administration.
2.1 Start-up Summary
The following tables and chart show a summary of our start-up requirements and anticipated funding.

| Start-up | |
| Requirements | |
| Start-up Expenses | |
| Legal | $0 |
| Consultants | $12,500 |
| Offering Expenses | $15,000 |
| Total Start-up Expenses | $27,500 |
| Start-up Assets | |
| Cash Required | $272,500 |
| Other Current Assets | $0 |
| Long-term Assets | $0 |
| Total Assets | $272,500 |
| Total Requirements | $300,000 |
| Start-up Funding | |
| Start-up Expenses to Fund | $27,500 |
| Start-up Assets to Fund | $272,500 |
| Total Funding Required | $300,000 |
| Assets | |
| Non-cash Assets from Start-up | $0 |
| Cash Requirements from Start-up | $272,500 |
| Additional Cash Raised | $0 |
| Cash Balance on Starting Date | $272,500 |
| Total Assets | $272,500 |
| Liabilities and Capital | |
| Liabilities | |
| Current Borrowing | $0 |
| Long-term Liabilities | $0 |
| Accounts Payable (Outstanding Bills) | $0 |
| Other Current Liabilities (interest-free) | $0 |
| Total Liabilities | $0 |
| Capital | |
| Planned Investment | |
| Private Placement ’96 | $300,000 |
| Investor | $0 |
| Additional Investment Requirement | $0 |
| Total Planned Investment | $300,000 |
| Loss at Start-up (Start-up Expenses) | ($27,500) |
| Total Capital | $272,500 |
| Total Capital and Liabilities | $272,500 |
| Total Funding | $300,000 |
2.2 Company Ownership
Southeast Health Plans, Inc. is a privately-held Georgia corporation. It is owned by its founders and managing partners: James J. Peters, Thomas R. Cormier, and L. Richard Schumacher, MD.
The company has been established with the founders’ own capital. The founders have negotiated an exclusive strategic alliance with Blair Mill Administrators for certain markets in the state of Georgia.
The founders are now seeking to extend outside ownership interest for the first time in order to raise the funds required to execute the expansion plans of the business.
2.3 Company Locations and Facilities
Southeast Health Plans, Inc. currently occupies office space at … Atlanta, GA.
The phone number is … and the fax number is … .
The current offices provide sufficient space to launch business in the Atlanta and north Georgia market. More space will be required as the Atlanta market matures and central services are provided to other geographic markets. In addition, local sales offices will be required in other markets.
Increases in rental costs are included in the plan’s pro forma profit and loss as they are expected to be incurred.

Services
As health care in the United States has been changing rapidly over the past two decades, so has the way health care has been provided and how it is billed and paid. Large insurance companies and private physicians have given way to HMOs and Managed Care Plans and the TPA (Third Party Administrator) has been prospering. A TPA (like Blair Mill) exists to administer all the health care functions for a company that would have been handled by an insurance company. HMOs primarily contract for services based upon price, then re-sell those services to groups. Often, service and choice are less than satisfactory. But, most importantly, cost-effective concerns predominate. Employers are seeking to provide health care for employees at an affordable cost. A backlash has been the increase in self-insured programs administered by TPAs.
In short, a business now demands much more in the way of service and analysis than traditional support institutions have been providing to their clients. The claims processor is a case in point. Merely processing claims does nothing to help a business analyze and control its health benefits plan and to control the costs associated with the plan. And there has not traditionally been a measure for the “quality” of health care service.
Southeast has compiled, through its own proprietary systems and an alliance of external providers, a service mix that includes Network Administration Services, Network Contracting Services, Policy Formation and Quality Assurance, and Marketing Services.
Health benefits are a fact of life for any business. The small and mid-size business is concerned with cost control and administration, just as in any other department of their business operations, except they are ill-equipped in personnel, know-how, and in systems, to administer health care internally.
Thus a full array of TPA self-insured services would include:
- Claims experience analysis and cost projections
- Plan design consulting
- Comprehensive plan analysis
- Provider network analysis
- Plan documentation
- Stop-loss brokerage and administration
- Prescription drug programs
- Vision benefits administration
- Dental benefits administration
- COBRA administration
- Short-term disability administration
- Worker’s compensation services
- Custom tailored services.
3.1 Competitive Comparison
Health plans for businesses and their employees comprise a multi-billion dollar industry that is highly competitive. Well known national insurance companies like Prudential, Cigna, Aetna/US Healthcare, and the regional Blue Cross and Blue Shield Companies seek the employer’s dollar. A plenitude of HMOs, both regional and national, also compete. Many companies are already self-insured. Some of these companies use TPAs for outside claims processing while others use insurers or attempt to self-administer. Certain claims processors are also gravitating toward benefits management services.
Southeast Health Plans believes that a niche exists that is both too small for concentrated coverage by large national companies and that is not well served with broad enough quality services by other TPAs. Most TPAs are still evolving toward the service mix that small and mid-size companies are demanding. By providing those quality services now, at a fair price, Southeast believes a competitive sales advantage exists that will permit attainment of the market shares sought.
3.2 Sales Literature
Much of the sales materials and literature prepared by Blair Mill will be utilized by Southeast. Advertising executions are included in a supplement to this plan. Direct mail pieces are being developed. A Blair Mill portfolio and video tape provides a professional presentation to prospective clients.
3.3 Fulfillment
The Strategic Alliance with Blair Mill Administrators of Philadelphia, PA., provides the principal source of health plan administrative services. Southeast will earn revenue both from enrollment sales as well as from cost advantages in the delivery of health care services.
From a product perspective, this relationship is analogous to the role of a regional dealer that sells services and brand name products within a licensed and protected geographic area. The dealer brings competence and value-added expertise to the enterprise while the source brings the credibility of brand name recognition and a substantial existing client base. This serves to reduce the risk normally associated with an early stage, unrecognized health services provider.
On the health care provider side, the sourcing of health care services is already in place from a variety of provider organizations. Southeast management has had working relationships with Georgia Baptist Health Care System, Meridian Medical Group, Emory Health System, Columbia/HCA, Northside Hospitals, Scottish Rite Medical Centers and other independent health care organizations.
The management of Southeast Health Plans remains in ongoing negotiations with physician groups and hospitals to obtain the optimum mix of quality service and price for its clients. The health care providers are receptive both from the standpoint of pricing and freedom to control care. Both consumer and provider benefit from a cost/benefit mix that they find preferable to the insured HMO or Managed Care models. It is not anticipated that service sourcing will be a problem for Southeast Health Plans. Rather, the key to success will be marketing to employers coupled with provider cost negotiation. Quality of care will not be compromised.
3.4 Future Services
Future services will include establishing both a geographic network of clients and health care providers throughout the southeast. As Southeast Health Plans grows and expands it will begin to look less like a TPA and more like a Health Plan. As critical mass of clientele and medical providers is achieved cost benefit is attained and administrative functions and services are consolidated in economies of scale. At that point of critical mass when approximately 50,000 cumulative employees are under managed care the option exists for Southeast to develop its own proprietary heath plan. Many administrative services and functions that will be outsourced by Southeast can be developed as internal company centers.
At that point options exist to finance the shift to a Health Plan company. Mezzanine, or Venture funding will be obtainable for a company with $5 million in revenue and $1.6 million in earnings (and no debt). After ramp-up to a $10 to $20 million dollar company an IPO is a potential. Also, the company would be an attractive target for acquisition.
Market Analysis Summary
The initial target market is the Atlanta metro and north Georgia market. The agreement with Blair Mill encompasses the following zip codes:
All three digits beginning with [Proprietary and confidential information removed].
This includes all of metro Atlanta and surrounding counties in north Georgia. At present Southeast Health Plans holds the only strategic marketing alliance with Blair Mill in the entire southeastern United States. Both sides recognize and desire an expanded agreement after phase one goals and objectives are attained.
The critical data to establish potential customer base and market share is to sort employers within the region by number of employees, regardless of whether they are currently with an HMO, an outside insurance carrier, are self-insured, or have no insurance. All are potential clients of Southeast Health Plans. The curve to attainment of critical mass is one of education, media, contact, and sales closure.
The market segment data is presented in the next section.
4.1 Market Segmentation
Within the targeted ZIP codes defined by the agreement with Blair Mill, the management of Southeast Health Plans has identified 1,801 employers with 50 to 500 employees. Of these, 1,289 are known to have an identifiable insurance carrier, 446 are known to be self-insured, and 66 are known to have no insurance.
Southeast has a clearly defined and identifiable market niche that enables highly targeted and efficient marketing of its services.
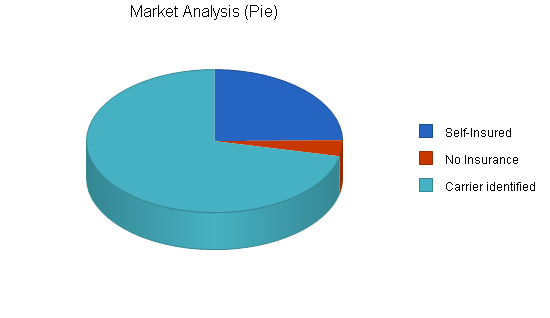
| Market Analysis | |||||||
| Year 1 | Year 2 | Year 3 | Year 4 | Year 5 | |||
| Potential Customers | Growth | CAGR | |||||
| Self-Insured | 10% | 446 | 491 | 540 | 594 | 653 | 10.00% |
| No Insurance | 0% | 66 | 66 | 66 | 66 | 66 | 0.00% |
| Carrier identified | 0% | 1,289 | 1,289 | 1,289 | 1,289 | 1,289 | 0.00% |
| Total | 2.76% | 1,801 | 1,846 | 1,895 | 1,949 | 2,008 | 2.76% |
4.2 Service Business Analysis
Together the national insurance carriers, HMOs, and PPOs account for 72% of the current market for employer-based health plan services. The majority of HMOs and PPOs have their own marketing and sales programs which include company employed sales forces. National insurance companies may have company sales people or may utilize independent insurance agents. Both have strong media programs.
Neither, however, provide the mix of services that Southeast Health Plans can provide. Nor can they provide the quality/cost ratio or the ancillary consultative and custom services of Southeast combined with Blair Mill. Thus, Southeast feels that this entire employer universe of 1,801 companies is vulnerable to penetration.
4.2.1 Competition and Buying Patterns
Buying patterns vary by the size of the employer and according to his internal organization.
The company with 50 to 100 employers may have health care handled by the owner or a key executive. Often it is the responsibility of the Personnel Administrator as an individual (if that function is internal to the company). Also, Personnel Administration may be outsourced, but benefits may not. Sometimes an independent benefits brokerage firm handles all recommendations.
Larger companies from 200 to 500 employees may have Personnel Departments of several people. They might also employ a broker or a consultant.
Thus, it is imperative that Southeast have flexible programs and sales and marketing efforts that are targeted to a diverse set of potential buying patterns.
It is worthy to note that customer buying patterns for health plan coverage tend to revolve around annual renewal dates. That’s when competition intensifies from traditional providers. Southeast will have an extremely significant marketing advantage since an employer may retain Southeast for its proprietary service mix at any time. Southeast can initiate service for a client by helping him analyze and administer his current plan. Often, such an engagement will progress to full service and to administration of self-insurance.
4.2.2 Business Participants
Insurance carriers provide economic protection only. Such protection is at a high cost. Deductibles are increasing and the employer’s ability to handle the cost burden of medical insurance coverage is diminishing. Compromises must be made in the extent of coverage, the size of the deductible, the medical services included, or often the employee is required to cover an ever-increasing percentage of the cost of his own plan as a payroll deduction. These are all unattractive options both for the employer and the individual client. The spiraling cost of health care is the culprit.
HMOs have gained substantial and significant market share over the past two decades. Their cumulative share of covered insured employees now exceeds the national commercial insurance carriers by a wide margin. However, these plans have been ruled primarily by cost containment strictures. Freedom of choice is severely limited – there is a perception that the quality of care is at an all-time low. Liability issues are beginning to surface based on compromised or neglected care due to cost parameters. Many service costs are not adequately covered under these plans and the provider base of physicians are extremely dissatisfied with compensation allowances. Many physicians complain that the freedom of decision is diminishing constantly from time and cost constraints that are imposed upon them. The ultimate client, the individual patient, is equally dissatisfied. Thus, the employer becomes dissatisfied as well.
The market niche for the quality TPA is ripe for picking. However, services must be of high quality. Many small TPAs are promising high levels of service but often don’t deliver as promised because of the expense of building the internal resources required to compete effectively. Southeast Health Plans, by virtue of its alliance with Blair Mill Administrators, already has the necessary resources in place.
4.2.3 Distributing a Service
HMOs and Managed Care Companies are experienced and effective direct marketers. They employ media marketing and company sales forces to good effect. The primary problem they face is increasing dissatisfaction with their product. They will not be able to provide the multi-regional, customizable services that an increasing number of employers will demand. In addition, self-insurance is contrary to the buy-and-resell philosophy of these providers.
Many national insurance companies market through company sales forces and independent brokers and agents. Herein lies a potential barrier to entry into the small company market for an emerging TPA. Often the company has a pre-existing relationship with an insurance agent that may encompass a broader range of insurance services than health care. The company is, in fact, buying a “package” of varied insurance coverages that are necessary to business operation and also happen to include health care coverage. The task here is one of general education about the potential of self-insurance programs. If the insurance agent doesn’t provide this alternative he stands to eventually lose the health insurance coverage. But his current “franchise” with his client can be a barrier.
It is the intention of Southeast Health Plans both to market directly and to work through independent agents to reach their existing clients. A competitive agent compensation program is in place to accomplish this objective. It is the intention of the company to both work with independent agents who recognize the mutual value of co-operation or to sell in head-to-head competition with those who don’t.
Ultimately, product, service, and price will prevail. All sales forecasts of the company recognize the time line of market penetration, and have realistic, if not conservative, market share goals.
Strategy and Implementation Summary
With provider services already in place, the launching of sales and marketing strategies and implementation is the next task of Southeast Health Plans. Executions include print media in targeted general business publications, direct mail programs, and sales contact follow-up.
In addition contacts and seminars directed at independent agents and benefit brokerage firms will be launched. Additional sales materials will be produced that are targeted specifically toward these intermediary “customers.”
5.1 Marketing Strategy
Print media utilized will be the weekly Atlanta Business Chronicle. An extensive direct mail lead generation campaign will also be employed, targeted at employers, brokers, and consultants. Both will be followed by direct sales contact by Southeast’s professional sales executives.
5.1.1 Pricing Strategy
Pricing for administrative services provided by Blair Mill is billed on a cost-per-employee basis.
Actual medical costs within self-insured programs will vary as a combination function of negotiated provider service costs coupled with the level of stop-loss (deductible) coverage.
Revenues to Southeast Health Plans, Inc. are determined by sales commission formulas and also by cost advantages for medical services negotiated by Southeast contracted care providers. Thus, if Southeast provides medical service to the plan at a cost below the expected cost for the same service, differential revenue accrues to Southeast.
In both cases there is a time lag to realization of revenue. Sales commissions are paid 30 to 60 days in arrears based upon collection from customers. Service cost revenues are based upon actual services utilized and are also paid 30 to 60 days in arrears. All revenue projections included in this plan are based upon these delayed collection premises while all expenses are treated as cash when incurred (even if paid on 30 day terms). Thus, all cash flow analyses will err on the conservative side.
According to the terms of the existing agreement with Blair Mill, Southeast Health Plans will earn 25% of medical facility cost savings (as incurred) in years one and two and 17% in year three.
All services revenues generated by Southeast for new clients produced for Blair Mill will be paid as sales commissions according to the formula contained in the agreement. (A copy of the agreement is available to investors).
The sales commissions are as follows:
- 11.2% of all fees in the first year of the sale.
- 2% of all fees in the second and third years.
- 5% of all fees in the fourth year and in each renewal year thereafter.
- Blair Mill administrative service costs average about $15 per month per employee covered.
- In addition, commissions on new stop-loss policies will average 15% in year one.
5.2 Sales Strategy
The sales strategy for Southeast Health Plans is based upon concentrated targeted direct marketing with sales call follow-up. Closing ratios are estimated at only 5% of prospects to yield cumulative covered plan employees projected in the sales forecasts. Thus, higher closing ratios are potentially possible and would accelerate growth and revenue beyond the forecasts.
All forecasts are based upon per employee estimates. Dollar charges are based upon “A,” “B”, and “C” size markets and the prevailing costs for medical care for those markets respectively. Back-up market data is too extensive to include in this plan.
Note: An “A” market is defined as metro Atlanta. A “B” market is a population center over one million. A “C” market is any market below one million in population.
Annual projected revenues are illustrated in the chart below.
Monthly sales forecasts for the first year are included in the appendix.
Note: A total of 23 employer groups have already become active through Blair Mill as of November 1, 1996. Revenues based upon health care cost savings will show up in the beginning of 1997. Initial monthly revenues are based upon these employer groups, which represent approximately 1,500 employees (already 31% of the first year goal of 4,800 covered employees).
On an average annual basis, the revenue projections for health care savings revenue to Southeast are based upon $7.40 per employee for 1997. This number is for “A” markets. “B” markets are estimated at $5.66, and “C” markets at $3.71 per employee. Rationale: Atlanta is over-bedded and under-utilized, while in smaller markets the reverse is true.
Additional selling and retention fees are added to the above estimates to obtain total revenue numbers. In “A” markets, for example, this is set at $1.75 for new employees and at $0.75 for renewal/retention fees.
5.2.1 Sales Forecast
The following sales forecasts are based upon the premises previously presented.
Management feels these forecasts are highly attainable.


| Sales Forecast | |||
| Year 1 | Year 2 | Year 3 | |
| Sales | |||
| Sales | $288,599 | $1,399,223 | $3,067,966 |
| Other | $0 | $0 | $0 |
| Total Sales | $288,599 | $1,399,223 | $3,067,966 |
| Direct Cost of Sales | Year 1 | Year 2 | Year 3 |
| Sales | $57,000 | $201,000 | $427,500 |
| Other | $0 | $0 | $0 |
| Subtotal Direct Cost of Sales | $57,000 | $201,000 | $427,500 |
5.3 Strategic Alliances
In addition to the primary strategic alliance with Blair Mill, Southeast Health Plans, Inc. has already formed alliances on the health care provider network side which will provide cost advantages and thereby guaranteed revenue via Blair Mill on billed medical services.
The initial agreement with Columbia Health Care Systems will provide coverage to a substantial portion of metro Atlanta. In addition, a second agreement is forthcoming with Independent Health Care Providers, which includes DeKalb Medical Center, Scottish Rite Hospitals, and Northside Hospital System. Comprehensive availability for Atlanta Metro will then be in place. 52% of available hospital beds will then be included. Cost savings are reflected in revenue projections on a per covered employee basis.
5.4 Milestones
Milestones already achieved:
- Founder “seed” funding of $200 K to develop and research plan, secure strategic alliances, and establish initial infrastructure.
- Strategic alliances in place with Blair Mill and with Columbia Health Systems.
- 23 employer groups and 1500 employees already under managed care contracts.
- 52% of Atlanta metro area available hospital beds under contract at acceptable cost discounts.
Upcoming milestones:
- Obtain $300 K capital to staff and launch full sales and marketing executions.
- Present Blair Mill products and services to 50 of the largest employers in our target market by March 1, 1997.
- To reach stated first year goal of 4800 covered plan employees by January 1, 1998.
- To reach first year revenue goal of $288 K by December 31, 1997.
- To attain break-even cash flow by the end of year two.

| Milestones | |||||
| Milestone | Start Date | End Date | Budget | Manager | Department |
| Sample Milestones | 1/4/2008 | 1/4/2008 | $0 | ABC | Department |
| Finish Business Plan | 5/13/2009 | 6/12/2009 | $100 | Dude | LeGrande Fromage |
| Acquire Financing | 5/23/2009 | 7/12/2009 | $200 | Dudette | Legumers |
| Ah HA! Event | 6/2/2009 | 6/7/2009 | $60 | Marianne | Bosses |
| Oooooh Noooooo! Event | 7/2/2009 | 7/7/2009 | $250 | Marionette | Chèvre deBlâme |
| Grande Opening | 7/12/2009 | 7/17/2009 | $500 | Gloworm | Nobs |
| Marketing Program Starts | 6/12/2009 | 7/7/2009 | $1,000 | Glower | Marketeers |
| Plan vs. Actual Review | 11/7/2009 | 11/14/2009 | $0 | Galore | Alles |
| First Break-even Month | 3/11/2010 | 4/10/2010 | $0 | Bouys | Salers |
| Hire Employees | 2/7/2010 | 3/9/2010 | $150 | Gulls | HRM |
| Upgrade Business Plan Pro | 4/28/2010 | 4/30/2010 | $100 | Brass | Bossies |
| Totals | $2,360 | ||||
Management Summary
The founding management of Southeast Health Plans has an accumulated 75 plus years of industry related experience. All are well versed in industry fundamentals, educated in the evolution of the health care services industry, and share a vision for the successful positioning of Southeast Health Plans, Inc. within the industry.
6.1 Organizational Structure
The three founders will manage the company’s growth jointly as managing partners.
All staff and sales and marketing personnel will report to them through a sales manager (heavy in industry experience) who has also been identified.
Future branch offices will each have a general manager.
6.2 Management Team
James J. Peters, Managing Partner
Mr. Peters has more than 25 years experience in sales and marketing management in employee benefits, securities, and real estate.
He has managed the marketing and sale of pension investment services for MetLife in their Western region and for CNA and Pacific Mutual nationally.
Mr. Peters joined the MetLife HealthCare Network of Georgia as Regional Director for managed care sales in 1992. He built the marketing, sales, and service organizations for the Georgia network. Under his leadership, the network added 40,000 new, fully insured members over three years.
Mr. Peters holds a BA from the University of Notre Dame and an MA from the University of Oregon.
Thomas R. Cormier, Managing Partner
Mr. Cormier has more than 25 years of experience in the field of Employee Benefits. He began his career with Aetna Life and Casualty as a group insurance underwriter. As Project Team Leader in the Group Actuarial Department he developed procedures for the coordination of operations among departments within the Group Insurance Division.
He then spent 15 years with MetLife in the sale and servicing of large group accounts, support for regional sales staff, and budget administration.
Most recently, he was responsible for integration of capitated services with fee-for-service contracts, and the installation of risk pool arrangements for MetLife networks. He also was responsible for interfacing with corporate MIS.
Mr. Cormier holds a BA from the University of Notre Dame.
L. Richard Schumacher, MD, Managing Partner
Dr. Schumacher is a specialist in internal medicine with 25 years in practice who has been in leadership positions in managed care organizations since 1983. He has more than eight years experience in two major national insurance companies serving as Regional Medical Director and then as Vice President of Medical Affairs for Prudential in the Southeast. He later became CEO of MetLife’s Georgia HMO. He has established himself as a well respected advisor/consultant within the managed care industry.
Dr. Schumacher holds a BA from Amherst College and a Doctor of Medicine from the University of Pennsylvania School of Medicine.
Jeffrey E. Farmer, Sales Manager
Mr. Farmer is a sales management professional with a consistently outstanding record of production achievement in employee benefits and managed care sales. He worked first for US Healthcare in their Boston office and was subsequently recruited by John Hancock.
He later joined MetLife Group Benefits in their Tampa regional office and graduated from the MetLife Group Benefits Training Program. With MetLife Health Care, Mr. Farmer led all MetLife sales representatives in 1995 with more than $12 million in managed health care sales.
Mr. Farmer has a current extensive and active client base. He has completed all Health Insurance of America (HIAA) courses with honors. He is a member of the National Association of Health Underwriters, and the Atlanta Association of Health Underwriters.
Mr. Farmer holds a BA from Boston College.
6.3 Personnel Plan
The following table illustrates the Personnel Plan for Southeast Health Plans, Inc. Specific needs, compensation, and timing are indicated for each position. Future branch office staffing needs are lumped together as one line item.
| Personnel Plan | |||
| Year 1 | Year 2 | Year 3 | |
| James J. Peters | $60,000 | $60,000 | $66,000 |
| Thomas R. Cormier | $60,000 | $60,000 | $66,000 |
| L. Richard Schumacher | $60,000 | $60,000 | $66,000 |
| Jeffrey Farmer, Sales Mgr. | $64,992 | $66,000 | $66,000 |
| Sales Executive | $42,000 | $45,000 | $48,000 |
| Sales Executive | $42,000 | $45,000 | $48,000 |
| Sales Executive | $10,500 | $45,000 | $48,000 |
| Account Service Executive | $36,000 | $38,000 | $40,000 |
| Administrative Asst. | $30,000 | $30,000 | $32,000 |
| Administrative Asst. | $6,000 | $24,000 | $25,000 |
| VP Corp Dev. | $18,000 | $24,000 | $30,000 |
| CFO | $12,000 | $60,000 | $66,000 |
| Branch Sales | $0 | $200,000 | $380,000 |
| Total People | 0 | 0 | 0 |
| Total Payroll | $441,492 | $757,000 | $981,000 |
6.4 Management Team Gaps
Two current gaps exist within the management team:
- a Chief Financial Officer
- a Business Development (Capitalization) Specialist.
Both functions will be performed on a consultative basis in the first year of operations (1997). The CFO position can later be filled on a full-time basis, and capitalization will be handled by Investment Banking Relationships.
The interim positions will be staffed by:
- Interim CFO
*Confidential and Proprietary information omitted.* - Interim VP Corporate Development
Timothy Dineen
Mr. Dineen is Principal and Founder of Leprechaun Capital. He is experienced in raising capital for both public and private companies in an advisory capacity.
Mr. Dineen holds a BA from the University of Notre Dame.
6.5 Other Management Considerations
An advisory board of prominent managed health care professionals is already being assembled. These individuals are available for consultative assignment as well as Strategic Planning for Southeast Health Plans, Inc. The preliminary advisory board includes:
Dr. Nancy W. Ashbach, MD, MBA
Dr. Ashbach is a former CEO of MetLife of Colorado and Utah with responsibility for HMO, POS, and PPO products. Her areas of expertise include outcomes management, reference standard benefits, and doctor/plan relationships.
Dr. Leslie Moldauer, MD
Dr. Moldauer is a psychiatrist who was formerly the National Director of Mental Health and Chemical Dependency Services at MetLife Health Care Management Corporation. Her special interest is in the integration of mental health and chemical dependency programs into health plans as a whole.
Dr. Tighe E. Shomer, MD
Dr. Schomer has been Medical Director for a national managed care company with more than 200,000 HMO members and 1,250,000 PPO members. He has been a partner and director in a medical software and hardware company. He also advises Fortune 500 clients on issues pertaining to managed care, particularly preventative care and quality improvement.
Financial Plan
The financial plan for rapid, but controlled growth for Southeast Health Plans, Inc. is presented in detail in the following sections.
Initial capitalization (after $300 thousand founder’s seed funding) is pegged at $1 million (with cash streaming in from April through September).
The company will be debt free at that point (barring any interim management decisions to accelerate growth further). The company will also have significant IPO potential in the future and/or be an acquisition candidate in an industry that traditionally undergoes consolidation.
7.1 Important Assumptions
The financial assumptions upon which this plan is based are outlined in the following table:
| General Assumptions | |||
| Year 1 | Year 2 | Year 3 | |
| Plan Month | 1 | 2 | 3 |
| Current Interest Rate | 8.00% | 8.00% | 8.00% |
| Long-term Interest Rate | 8.00% | 8.00% | 8.00% |
| Tax Rate | 33.00% | 33.00% | 33.00% |
| Other | 0 | 0 | 0 |
7.2 Key Financial Indicators
Key financial indicators are increasing sales volume coupled with maintenance and improvement of margins. On-going cost control is paramount to success.

7.3 Break-even Analysis
Monthly break-even, based upon fixed initial market overheads, will be attained prior to the end of year two.
Cost control and market maturation will then accelerate profitability which increases disproportionately as market development costs are offset with a critical mass of baseline business in each new market.

| Break-even Analysis | |
| Monthly Revenue Break-even | $72,637 |
| Assumptions: | |
| Average Percent Variable Cost | 20% |
| Estimated Monthly Fixed Cost | $58,291 |
7.4 Projected Profit and Loss
Southeast Health Plans, Inc. projects over-all profitability in year three.


| Pro Forma Profit and Loss | |||
| Year 1 | Year 2 | Year 3 | |
| Sales | $288,599 | $1,399,223 | $3,067,966 |
| Direct Cost of Sales | $57,000 | $201,000 | $427,500 |
| Other Costs of Sales | $0 | $0 | $0 |
| Total Cost of Sales | $57,000 | $201,000 | $427,500 |
| Gross Margin | $231,599 | $1,198,223 | $2,640,466 |
| Gross Margin % | 80.25% | 85.63% | 86.07% |
| Expenses | |||
| Payroll | $441,492 | $757,000 | $981,000 |
| Marketing/Promotion | $180,000 | $288,000 | $456,000 |
| Depreciation | $0 | $0 | $0 |
| Rent | $30,000 | $90,000 | $120,000 |
| Telephone/Utilities | $12,000 | $24,000 | $30,000 |
| Payroll Taxes | $0 | $0 | $0 |
| Contract/Consultants | $36,000 | $0 | $0 |
| Total Operating Expenses | $699,492 | $1,159,000 | $1,587,000 |
| Profit Before Interest and Taxes | ($467,893) | $39,223 | $1,053,466 |
| EBITDA | ($467,893) | $39,223 | $1,053,466 |
| Interest Expense | $0 | $0 | $0 |
| Taxes Incurred | $0 | $12,944 | $347,644 |
| Net Profit | ($467,893) | $26,279 | $705,822 |
| Net Profit/Sales | -162.13% | 1.88% | 23.01% |
7.5 Projected Cash Flow
Cash flow is the most critical indicator of business success.
At no point does our business model run out of cash. Significant margin for error is included. Initial and second round investment is procured prior to need and allowing for potential time lag to close.
All future growth is based upon a debt-free internally funded model. Attainment of targeted sales revenues will ensure the accumulation of required cash to execute expansion plans as presented.
Plans can always be curtailed or postponed in the event of future sales shortfalls.

| Pro Forma Cash Flow | |||
| Year 1 | Year 2 | Year 3 | |
| Cash Received | |||
| Cash from Operations | |||
| Cash Sales | $288,599 | $1,399,223 | $3,067,966 |
| Subtotal Cash from Operations | $288,599 | $1,399,223 | $3,067,966 |
| Additional Cash Received | |||
| Sales Tax, VAT, HST/GST Received | $0 | $0 | $0 |
| New Current Borrowing | $0 | $0 | $0 |
| New Other Liabilities (interest-free) | $0 | $0 | $0 |
| New Long-term Liabilities | $0 | $0 | $0 |
| Sales of Other Current Assets | $0 | $0 | $0 |
| Sales of Long-term Assets | $0 | $0 | $0 |
| New Investment Received | $1,000,000 | $0 | $0 |
| Subtotal Cash Received | $1,288,599 | $1,399,223 | $3,067,966 |
| Expenditures | Year 1 | Year 2 | Year 3 |
| Expenditures from Operations | |||
| Cash Spending | $441,492 | $757,000 | $981,000 |
| Bill Payments | $286,967 | $593,351 | $1,318,251 |
| Subtotal Spent on Operations | $728,459 | $1,350,351 | $2,299,251 |
| Additional Cash Spent | |||
| Sales Tax, VAT, HST/GST Paid Out | $0 | $0 | $0 |
| Principal Repayment of Current Borrowing | $0 | $0 | $0 |
| Other Liabilities Principal Repayment | $0 | $0 | $0 |
| Long-term Liabilities Principal Repayment | $0 | $0 | $0 |
| Purchase Other Current Assets | $0 | $0 | $0 |
| Purchase Long-term Assets | $0 | $0 | $0 |
| Dividends | $0 | $0 | $0 |
| Subtotal Cash Spent | $728,459 | $1,350,351 | $2,299,251 |
| Net Cash Flow | $560,140 | $48,872 | $768,715 |
| Cash Balance | $832,640 | $881,512 | $1,650,227 |
7.6 Projected Balance Sheet
Projected Balance Sheet follows.
| Pro Forma Balance Sheet | |||
| Year 1 | Year 2 | Year 3 | |
| Assets | |||
| Current Assets | |||
| Cash | $832,640 | $881,512 | $1,650,227 |
| Other Current Assets | $0 | $0 | $0 |
| Total Current Assets | $832,640 | $881,512 | $1,650,227 |
| Long-term Assets | |||
| Long-term Assets | $0 | $0 | $0 |
| Accumulated Depreciation | $0 | $0 | $0 |
| Total Long-term Assets | $0 | $0 | $0 |
| Total Assets | $832,640 | $881,512 | $1,650,227 |
| Liabilities and Capital | Year 1 | Year 2 | Year 3 |
| Current Liabilities | |||
| Accounts Payable | $28,033 | $50,626 | $113,519 |
| Current Borrowing | $0 | $0 | $0 |
| Other Current Liabilities | $0 | $0 | $0 |
| Subtotal Current Liabilities | $28,033 | $50,626 | $113,519 |
| Long-term Liabilities | $0 | $0 | $0 |
| Total Liabilities | $28,033 | $50,626 | $113,519 |
| Paid-in Capital | $1,300,000 | $1,300,000 | $1,300,000 |
| Retained Earnings | ($27,500) | ($495,393) | ($469,114) |
| Earnings | ($467,893) | $26,279 | $705,822 |
| Total Capital | $804,607 | $830,886 | $1,536,709 |
| Total Liabilities and Capital | $832,640 | $881,512 | $1,650,227 |
| Net Worth | $804,607 | $830,886 | $1,536,709 |
7.7 Business Ratios
These business ratios are only partially relevant as long as the business is able to remain debt free. Industry profile ratios based on the Standard Industrial Classification (SIC) code 6411, Insurance Agencies and Brokerages, are shown for comparison.
| Ratio Analysis | ||||
| Year 1 | Year 2 | Year 3 | Industry Profile | |
| Sales Growth | 0.00% | 384.83% | 119.26% | 3.95% |
| Percent of Total Assets | ||||
| Other Current Assets | 0.00% | 0.00% | 0.00% | 93.54% |
| Total Current Assets | 100.00% | 100.00% | 100.00% | 93.54% |
| Long-term Assets | 0.00% | 0.00% | 0.00% | 6.46% |
| Total Assets | 100.00% | 100.00% | 100.00% | 100.00% |
| Current Liabilities | 3.37% | 5.74% | 6.88% | 35.88% |
| Long-term Liabilities | 0.00% | 0.00% | 0.00% | 9.61% |
| Total Liabilities | 3.37% | 5.74% | 6.88% | 45.49% |
| Net Worth | 96.63% | 94.26% | 93.12% | 54.51% |
| Percent of Sales | ||||
| Sales | 100.00% | 100.00% | 100.00% | 100.00% |
| Gross Margin | 80.25% | 85.63% | 86.07% | 100.00% |
| Selling, General & Administrative Expenses | 242.38% | 83.76% | 63.06% | 59.40% |
| Advertising Expenses | 0.00% | 0.00% | 0.00% | 1.23% |
| Profit Before Interest and Taxes | -162.13% | 2.80% | 34.34% | 6.74% |
| Main Ratios | ||||
| Current | 29.70 | 17.41 | 14.54 | 1.91 |
| Quick | 29.70 | 17.41 | 14.54 | 1.64 |
| Total Debt to Total Assets | 3.37% | 5.74% | 6.88% | 54.69% |
| Pre-tax Return on Net Worth | -58.15% | 4.72% | 68.55% | 7.55% |
| Pre-tax Return on Assets | -56.19% | 4.45% | 63.84% | 16.65% |
| Additional Ratios | Year 1 | Year 2 | Year 3 | |
| Net Profit Margin | -162.13% | 1.88% | 23.01% | n.a |
| Return on Equity | -58.15% | 3.16% | 45.93% | n.a |
| Activity Ratios | ||||
| Accounts Payable Turnover | 11.24 | 12.17 | 12.17 | n.a |
| Payment Days | 27 | 23 | 22 | n.a |
| Total Asset Turnover | 0.35 | 1.59 | 1.86 | n.a |
| Debt Ratios | ||||
| Debt to Net Worth | 0.03 | 0.06 | 0.07 | n.a |
| Current Liab. to Liab. | 1.00 | 1.00 | 1.00 | n.a |
| Liquidity Ratios | ||||
| Net Working Capital | $804,607 | $830,886 | $1,536,709 | n.a |
| Interest Coverage | 0.00 | 0.00 | 0.00 | n.a |
| Additional Ratios | ||||
| Assets to Sales | 2.89 | 0.63 | 0.54 | n.a |
| Current Debt/Total Assets | 3% | 6% | 7% | n.a |
| Acid Test | 29.70 | 17.41 | 14.54 | n.a |
| Sales/Net Worth | 0.36 | 1.68 | 2.00 | n.a |
| Dividend Payout | 0.00 | 0.00 | 0.00 | n.a |
Appendix
| Sales Forecast | |||||||||||||
| Month 1 | Month 2 | Month 3 | Month 4 | Month 5 | Month 6 | Month 7 | Month 8 | Month 9 | Month 10 | Month 11 | Month 12 | ||
| Sales | |||||||||||||
| Sales | 0% | $11,101 | $11,102 | $12,017 | $13,845 | $15,674 | $18,415 | $22,985 | $27,554 | $32,123 | $36,692 | $41,261 | $45,830 |
| Other | 0% | $0 | $0 | $0 | $0 | $0 | $0 | $0 | $0 | $0 | $0 | $0 | $0 |
| Total Sales | $11,101 | $11,102 | $12,017 | $13,845 | $15,674 | $18,415 | $22,985 | $27,554 | $32,123 | $36,692 | $41,261 | $45,830 | |
| Direct Cost of Sales | Month 1 | Month 2 | Month 3 | Month 4 | Month 5 | Month 6 | Month 7 | Month 8 | Month 9 | Month 10 | Month 11 | Month 12 | |
| Sales | $0 | $0 | $1,500 | $3,000 | $3,000 | $4,500 | $7,500 | $7,500 | $7,500 | $7,500 | $7,500 | $7,500 | |
| Other | $0 | $0 | $0 | $0 | $0 | $0 | $0 | $0 | $0 | $0 | $0 | $0 | |
| Subtotal Direct Cost of Sales | $0 | $0 | $1,500 | $3,000 | $3,000 | $4,500 | $7,500 | $7,500 | $7,500 | $7,500 | $7,500 | $7,500 | |
| Personnel Plan | |||||||||||||
| Month 1 | Month 2 | Month 3 | Month 4 | Month 5 | Month 6 | Month 7 | Month 8 | Month 9 | Month 10 | Month 11 | Month 12 | ||
| James J. Peters | 0% | $5,000 | $5,000 | $5,000 | $5,000 | $5,000 | $5,000 | $5,000 | $5,000 | $5,000 | $5,000 | $5,000 | $5,000 |
| Thomas R. Cormier | 0% | $5,000 | $5,000 | $5,000 | $5,000 | $5,000 | $5,000 | $5,000 | $5,000 | $5,000 | $5,000 | $5,000 | $5,000 |
| L. Richard Schumacher | 0% | $5,000 | $5,000 | $5,000 | $5,000 | $5,000 | $5,000 | $5,000 | $5,000 | $5,000 | $5,000 | $5,000 | $5,000 |
| Jeffrey Farmer, Sales Mgr. | 0% | $5,416 | $5,416 | $5,416 | $5,416 | $5,416 | $5,416 | $5,416 | $5,416 | $5,416 | $5,416 | $5,416 | $5,416 |
| Sales Executive | 0% | $3,500 | $3,500 | $3,500 | $3,500 | $3,500 | $3,500 | $3,500 | $3,500 | $3,500 | $3,500 | $3,500 | $3,500 |
| Sales Executive | 0% | $3,500 | $3,500 | $3,500 | $3,500 | $3,500 | $3,500 | $3,500 | $3,500 | $3,500 | $3,500 | $3,500 | $3,500 |
| Sales Executive | 0% | $0 | $0 | $0 | $0 | $0 | $0 | $0 | $0 | $0 | $3,500 | $3,500 | $3,500 |
| Account Service Executive | 0% | $3,000 | $3,000 | $3,000 | $3,000 | $3,000 | $3,000 | $3,000 | $3,000 | $3,000 | $3,000 | $3,000 | $3,000 |
| Administrative Asst. | 0% | $2,500 | $2,500 | $2,500 | $2,500 | $2,500 | $2,500 | $2,500 | $2,500 | $2,500 | $2,500 | $2,500 | $2,500 |
| Administrative Asst. | 0% | $0 | $0 | $0 | $0 | $0 | $0 | $0 | $0 | $0 | $2,000 | $2,000 | $2,000 |
| VP Corp Dev. | 0% | $1,500 | $1,500 | $1,500 | $1,500 | $1,500 | $1,500 | $1,500 | $1,500 | $1,500 | $1,500 | $1,500 | $1,500 |
| CFO | 0% | $1,000 | $1,000 | $1,000 | $1,000 | $1,000 | $1,000 | $1,000 | $1,000 | $1,000 | $1,000 | $1,000 | $1,000 |
| Branch Sales | 0% | $0 | $0 | $0 | $0 | $0 | $0 | $0 | $0 | $0 | $0 | $0 | $0 |
| Total People | 0 | 0 | 0 | 0 | 0 | 0 | 0 | 0 | 0 | 0 | 0 | 0 | |
| Total Payroll | $35,416 | $35,416 | $35,416 | $35,416 | $35,416 | $35,416 | $35,416 | $35,416 | $35,416 | $40,916 | $40,916 | $40,916 | |
| Pro Forma Profit and Loss | |||||||||||||
| Month 1 | Month 2 | Month 3 | Month 4 | Month 5 | Month 6 | Month 7 | Month 8 | Month 9 | Month 10 | Month 11 | Month 12 | ||
| Sales | $11,101 | $11,102 | $12,017 | $13,845 | $15,674 | $18,415 | $22,985 | $27,554 | $32,123 | $36,692 | $41,261 | $45,830 | |
| Direct Cost of Sales | $0 | $0 | $1,500 | $3,000 | $3,000 | $4,500 | $7,500 | $7,500 | $7,500 | $7,500 | $7,500 | $7,500 | |
| Other Costs of Sales | $0 | $0 | $0 | $0 | $0 | $0 | $0 | $0 | $0 | $0 | $0 | $0 | |
| Total Cost of Sales | $0 | $0 | $1,500 | $3,000 | $3,000 | $4,500 | $7,500 | $7,500 | $7,500 | $7,500 | $7,500 | $7,500 | |
| Gross Margin | $11,101 | $11,102 | $10,517 | $10,845 | $12,674 | $13,915 | $15,485 | $20,054 | $24,623 | $29,192 | $33,761 | $38,330 | |
| Gross Margin % | 100.00% | 100.00% | 87.52% | 78.33% | 80.86% | 75.56% | 67.37% | 72.78% | 76.65% | 79.56% | 81.82% | 83.64% | |
| Expenses | |||||||||||||
| Payroll | $35,416 | $35,416 | $35,416 | $35,416 | $35,416 | $35,416 | $35,416 | $35,416 | $35,416 | $40,916 | $40,916 | $40,916 | |
| Marketing/Promotion | $15,000 | $15,000 | $15,000 | $15,000 | $15,000 | $15,000 | $15,000 | $15,000 | $15,000 | $15,000 | $15,000 | $15,000 | |
| Depreciation | $0 | $0 | $0 | $0 | $0 | $0 | $0 | $0 | $0 | $0 | $0 | $0 | |
| Rent | $2,500 | $2,500 | $2,500 | $2,500 | $2,500 | $2,500 | $2,500 | $2,500 | $2,500 | $2,500 | $2,500 | $2,500 | |
| Telephone/Utilities | $1,000 | $1,000 | $1,000 | $1,000 | $1,000 | $1,000 | $1,000 | $1,000 | $1,000 | $1,000 | $1,000 | $1,000 | |
| Payroll Taxes | 15% | $0 | $0 | $0 | $0 | $0 | $0 | $0 | $0 | $0 | $0 | $0 | $0 |
| Contract/Consultants | $3,000 | $3,000 | $3,000 | $3,000 | $3,000 | $3,000 | $3,000 | $3,000 | $3,000 | $3,000 | $3,000 | $3,000 | |
| Total Operating Expenses | $56,916 | $56,916 | $56,916 | $56,916 | $56,916 | $56,916 | $56,916 | $56,916 | $56,916 | $62,416 | $62,416 | $62,416 | |
| Profit Before Interest and Taxes | ($45,815) | ($45,814) | ($46,399) | ($46,071) | ($44,242) | ($43,001) | ($41,431) | ($36,862) | ($32,293) | ($33,224) | ($28,655) | ($24,086) | |
| EBITDA | ($45,815) | ($45,814) | ($46,399) | ($46,071) | ($44,242) | ($43,001) | ($41,431) | ($36,862) | ($32,293) | ($33,224) | ($28,655) | ($24,086) | |
| Interest Expense | $0 | $0 | $0 | $0 | $0 | $0 | $0 | $0 | $0 | $0 | $0 | $0 | |
| Taxes Incurred | $0 | $0 | $0 | $0 | $0 | $0 | $0 | $0 | $0 | $0 | $0 | $0 | |
| Net Profit | ($45,815) | ($45,814) | ($46,399) | ($46,071) | ($44,242) | ($43,001) | ($41,431) | ($36,862) | ($32,293) | ($33,224) | ($28,655) | ($24,086) | |
| Net Profit/Sales | -412.71% | -412.66% | -386.11% | -332.76% | -282.26% | -233.51% | -180.25% | -133.78% | -100.53% | -90.55% | -69.45% | -52.56% | |
| Pro Forma Cash Flow | |||||||||||||
| Month 1 | Month 2 | Month 3 | Month 4 | Month 5 | Month 6 | Month 7 | Month 8 | Month 9 | Month 10 | Month 11 | Month 12 | ||
| Cash Received | |||||||||||||
| Cash from Operations | |||||||||||||
| Cash Sales | $11,101 | $11,102 | $12,017 | $13,845 | $15,674 | $18,415 | $22,985 | $27,554 | $32,123 | $36,692 | $41,261 | $45,830 | |
| Subtotal Cash from Operations | $11,101 | $11,102 | $12,017 | $13,845 | $15,674 | $18,415 | $22,985 | $27,554 | $32,123 | $36,692 | $41,261 | $45,830 | |
| Additional Cash Received | |||||||||||||
| Sales Tax, VAT, HST/GST Received | 0.00% | $0 | $0 | $0 | $0 | $0 | $0 | $0 | $0 | $0 | $0 | $0 | $0 |
| New Current Borrowing | $0 | $0 | $0 | $0 | $0 | $0 | $0 | $0 | $0 | $0 | $0 | $0 | |
| New Other Liabilities (interest-free) | $0 | $0 | $0 | $0 | $0 | $0 | $0 | $0 | $0 | $0 | $0 | $0 | |
| New Long-term Liabilities | $0 | $0 | $0 | $0 | $0 | $0 | $0 | $0 | $0 | $0 | $0 | $0 | |
| Sales of Other Current Assets | $0 | $0 | $0 | $0 | $0 | $0 | $0 | $0 | $0 | $0 | $0 | $0 | |
| Sales of Long-term Assets | $0 | $0 | $0 | $0 | $0 | $0 | $0 | $0 | $0 | $0 | $0 | $0 | |
| New Investment Received | $0 | $0 | $0 | $200,000 | $100,000 | $200,000 | $100,000 | $200,000 | $200,000 | $0 | $0 | $0 | |
| Subtotal Cash Received | $11,101 | $11,102 | $12,017 | $213,845 | $115,674 | $218,415 | $122,985 | $227,554 | $232,123 | $36,692 | $41,261 | $45,830 | |
| Expenditures | Month 1 | Month 2 | Month 3 | Month 4 | Month 5 | Month 6 | Month 7 | Month 8 | Month 9 | Month 10 | Month 11 | Month 12 | |
| Expenditures from Operations | |||||||||||||
| Cash Spending | $35,416 | $35,416 | $35,416 | $35,416 | $35,416 | $35,416 | $35,416 | $35,416 | $35,416 | $40,916 | $40,916 | $40,916 | |
| Bill Payments | $717 | $21,500 | $21,550 | $23,050 | $24,500 | $24,550 | $26,100 | $29,000 | $29,000 | $29,000 | $29,000 | $29,000 | |
| Subtotal Spent on Operations | $36,133 | $56,916 | $56,966 | $58,466 | $59,916 | $59,966 | $61,516 | $64,416 | $64,416 | $69,916 | $69,916 | $69,916 | |
| Additional Cash Spent | |||||||||||||
| Sales Tax, VAT, HST/GST Paid Out | $0 | $0 | $0 | $0 | $0 | $0 | $0 | $0 | $0 | $0 | $0 | $0 | |
| Principal Repayment of Current Borrowing | $0 | $0 | $0 | $0 | $0 | $0 | $0 | $0 | $0 | $0 | $0 | $0 | |
| Other Liabilities Principal Repayment | $0 | $0 | $0 | $0 | $0 | $0 | $0 | $0 | $0 | $0 | $0 | $0 | |
| Long-term Liabilities Principal Repayment | $0 | $0 | $0 | $0 | $0 | $0 | $0 | $0 | $0 | $0 | $0 | $0 | |
| Purchase Other Current Assets | $0 | $0 | $0 | $0 | $0 | $0 | $0 | $0 | $0 | $0 | $0 | $0 | |
| Purchase Long-term Assets | $0 | $0 | $0 | $0 | $0 | $0 | $0 | $0 | $0 | $0 | $0 | $0 | |
| Dividends | $0 | $0 | $0 | $0 | $0 | $0 | $0 | $0 | $0 | $0 | $0 | $0 | |
| Subtotal Cash Spent | $36,133 | $56,916 | $56,966 | $58,466 | $59,916 | $59,966 | $61,516 | $64,416 | $64,416 | $69,916 | $69,916 | $69,916 | |
| Net Cash Flow | ($25,032) | ($45,814) | ($44,949) | $155,379 | $55,758 | $158,449 | $61,469 | $163,138 | $167,707 | ($33,224) | ($28,655) | ($24,086) | |
| Cash Balance | $247,468 | $201,654 | $156,705 | $312,084 | $367,842 | $526,291 | $587,760 | $750,898 | $918,605 | $885,381 | $856,726 | $832,640 | |
| Pro Forma Balance Sheet | |||||||||||||
| Month 1 | Month 2 | Month 3 | Month 4 | Month 5 | Month 6 | Month 7 | Month 8 | Month 9 | Month 10 | Month 11 | Month 12 | ||
| Assets | Starting Balances | ||||||||||||
| Current Assets | |||||||||||||
| Cash | $272,500 | $247,468 | $201,654 | $156,705 | $312,084 | $367,842 | $526,291 | $587,760 | $750,898 | $918,605 | $885,381 | $856,726 | $832,640 |
| Other Current Assets | $0 | $0 | $0 | $0 | $0 | $0 | $0 | $0 | $0 | $0 | $0 | $0 | $0 |
| Total Current Assets | $272,500 | $247,468 | $201,654 | $156,705 | $312,084 | $367,842 | $526,291 | $587,760 | $750,898 | $918,605 | $885,381 | $856,726 | $832,640 |
| Long-term Assets | |||||||||||||
| Long-term Assets | $0 | $0 | $0 | $0 | $0 | $0 | $0 | $0 | $0 | $0 | $0 | $0 | $0 |
| Accumulated Depreciation | $0 | $0 | $0 | $0 | $0 | $0 | $0 | $0 | $0 | $0 | $0 | $0 | $0 |
| Total Long-term Assets | $0 | $0 | $0 | $0 | $0 | $0 | $0 | $0 | $0 | $0 | $0 | $0 | $0 |
| Total Assets | $272,500 | $247,468 | $201,654 | $156,705 | $312,084 | $367,842 | $526,291 | $587,760 | $750,898 | $918,605 | $885,381 | $856,726 | $832,640 |
| Liabilities and Capital | Month 1 | Month 2 | Month 3 | Month 4 | Month 5 | Month 6 | Month 7 | Month 8 | Month 9 | Month 10 | Month 11 | Month 12 | |
| Current Liabilities | |||||||||||||
| Accounts Payable | $0 | $20,783 | $20,783 | $22,233 | $23,683 | $23,683 | $25,133 | $28,033 | $28,033 | $28,033 | $28,033 | $28,033 | $28,033 |
| Current Borrowing | $0 | $0 | $0 | $0 | $0 | $0 | $0 | $0 | $0 | $0 | $0 | $0 | $0 |
| Other Current Liabilities | $0 | $0 | $0 | $0 | $0 | $0 | $0 | $0 | $0 | $0 | $0 | $0 | $0 |
| Subtotal Current Liabilities | $0 | $20,783 | $20,783 | $22,233 | $23,683 | $23,683 | $25,133 | $28,033 | $28,033 | $28,033 | $28,033 | $28,033 | $28,033 |
| Long-term Liabilities | $0 | $0 | $0 | $0 | $0 | $0 | $0 | $0 | $0 | $0 | $0 | $0 | $0 |
| Total Liabilities | $0 | $20,783 | $20,783 | $22,233 | $23,683 | $23,683 | $25,133 | $28,033 | $28,033 | $28,033 | $28,033 | $28,033 | $28,033 |
| Paid-in Capital | $300,000 | $300,000 | $300,000 | $300,000 | $500,000 | $600,000 | $800,000 | $900,000 | $1,100,000 | $1,300,000 | $1,300,000 | $1,300,000 | $1,300,000 |
| Retained Earnings | ($27,500) | ($27,500) | ($27,500) | ($27,500) | ($27,500) | ($27,500) | ($27,500) | ($27,500) | ($27,500) | ($27,500) | ($27,500) | ($27,500) | ($27,500) |
| Earnings | $0 | ($45,815) | ($91,629) | ($138,028) | ($184,099) | ($228,341) | ($271,342) | ($312,773) | ($349,635) | ($381,928) | ($415,152) | ($443,807) | ($467,893) |
| Total Capital | $272,500 | $226,685 | $180,871 | $134,472 | $288,401 | $344,159 | $501,158 | $559,727 | $722,865 | $890,572 | $857,348 | $828,693 | $804,607 |
| Total Liabilities and Capital | $272,500 | $247,468 | $201,654 | $156,705 | $312,084 | $367,842 | $526,291 | $587,760 | $750,898 | $918,605 | $885,381 | $856,726 | $832,640 |
| Net Worth | $272,500 | $226,685 | $180,871 | $134,472 | $288,401 | $344,159 | $501,158 | $559,727 | $722,865 | $890,572 | $857,348 | $828,693 | $804,607 |


