
Wooderful Floors
Executive Summary
Wooderful Floors is a start-up company that offers wood floor refinishing to the Pittsburgh, Pennsylvania area. The company was formed as a L.L.C. by Logan Madison.
Keys to Success
Wooderful Floors has identified several keys of success that will be instrumental in its progression to profitability within the first year.
- Attention to detail: Every floor worked on must be done to precise, caring standards.
- 100% customer satisfaction: Every customer must be happy with the work.
- Business efficiency: All processes and activities in the business must be analyzed and determined if the most efficient process is being used.
Competitive Edge
Wooderful Floors will focus on environmentalism and trusted experience to gain market share. Wooderful Floors exclusively uses a water-based finishing product. This relatively new product is just as durable as the polyurethane alternatives, is non-toxic, and does not release toxic fumes into the air. The alternative products often force the home owner to vacate the home for several days due to the toxicity of the fumes. Wooderful Floors has extensive experience with this water-based product. Logan is the most experienced service provider for water-based products.
Management
Logan Madison received his Bachelor of Arts from Allegheny College. He worked as a floor refinisher for the last several years with a general contractor. From the first month that the water-based products entered the market, Logan was using them and learning more and more about the proper application of these breakthrough products.
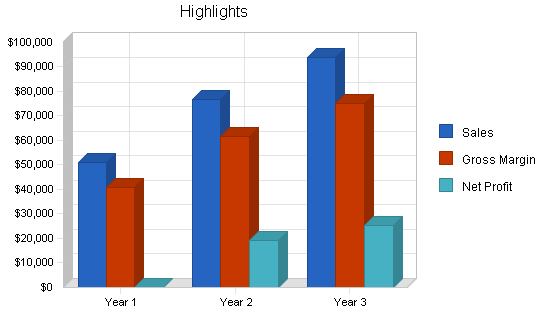
Through a combination of skill and experience, Logan will lead Wooderful Floors to profitability with the first year. Wooderful Floors is forecasted to achieve steady growth in sales for years two and three, and corresponding increases in net profit.
1.1 Mission
It is Wooderful Floors’ mission to offer the highest-quality environmentally-sound wood floor refinishing service in Pittsburgh. Through fair pricing, careful craftsmen-like work and 100% customer satisfaction, Wooderful Floors will quickly gain a base of loyal customers.
1.2 Keys to Success
- Attention to detail, every floor must be refinished to perfection.
- Customers must be 100% satisfied will all of Wooderful Floors’ work.
- Although floor refinishing is a labor of love, attention to detail regarding business efficiency must be applied in order for Wooderful Floors to be a sustainable company.
1.3 Objectives
- To become the premier environmentally-sound wood floor refinisher.
- Become profitable within year one.
- Achieve significant gains in market penetration.
Company Summary
Wooderful Floors is a newly formed Pennsylvania-based L.L.C. that offers customers environmentally-sound wood floor refinishing options. The company has been founded by Logan Madison as a start up in January.
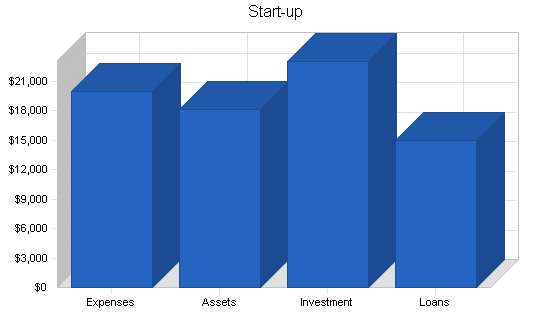
2.1 Start-up Summary
Wooderful Floors will require the following start-up equipment:
- Used van
- Drum sanders
- Floor edgers
- Buffers
- Circular/palm sanders
- Putty knives and scrapers
- Shop vacuum cleaners
- Ear protection, dust masks, safety goggles
- Lamb’s wool and natural bristle brushes
- Foam applicators
- Air compressor
- Various hand tools
- Pneumatic nail finisher
- Computer with Microsoft Office, QuickBooks Pro, a printer, and an Internet connection
| Start-up | |
| Requirements | |
| Start-up Expenses | |
| Legal | $500 |
| Brochures | $250 |
| Assorted tools | $10,000 |
| Insurance | $500 |
| Van | $8,000 |
| Website design | $650 |
| Total Start-up Expenses | $19,900 |
| Start-up Assets | |
| Cash Required | $10,100 |
| Other Current Assets | $0 |
| Long-term Assets | $8,000 |
| Total Assets | $18,100 |
| Total Requirements | $38,000 |
2.2 Company Ownership
Wooderful Floors is wholly owned by Logan Madison. The business has been financed by owner investment and a long-term bank loan.
Services
Wooderful Floors offers the Pittsburgh community an environmentally safe wood floor refinishing service.
The services begin with a floor assessment. Whole boards may need to be replaced, but usually only small cracks need to be filled. The next step of refinishing is the sanding of the floor. This is always done layer by layer in a uniform manner. Throughout the sanding process cracks are checked for and fixed as needed. Three grades of sanding occur: rough, medium, and fine.
Once the floor has been sanded and vacuumed, the floor is now buffed using a super fine abrasive screen. The buffing helps tighten the wood grain to prepare it for accepting the stain. After the stain has been applied, the finish is applied and left to dry. Wooderful Floors provides every customer with a brief tutorial and documentation for care and maintenance of their refinished wood surface.
Wooderful Floors exclusively uses a water-based, environmentally sound finishing treatment. Within the last four years there has been a technological breakthrough in hard wood floor treatments that allows the industry to offer an extremely durable water-based solution.
The competing products on the market are:
- Polyurethane: This is a popular and durable finish that comes in satin, semi-gloss, and high-gloss. While this finish is durable, it leaves a plastic sheen that decreases its attractiveness, is not dog nail resistant, and the chemicals that make up the liquid are quite toxic.
- Swedish finish: This alternative is durable but has toxic fumes. Home owners must vacate the home for 2-3 days to allow the fumes to pass.
Wooderful Floors water-based finish has the same or superior durability characteristics as the competing brands and is not toxic. Wooderful Floors’ prices will be slightly higher than competitors due to the high cost of the water-based finish product. The company will use superior service and market the environmental benefits of products used to justify the higher service cost.
The pricing schedule is based on square footage and other features that may impact the time to refinish such as ornate trims, etc.
Market Analysis Summary
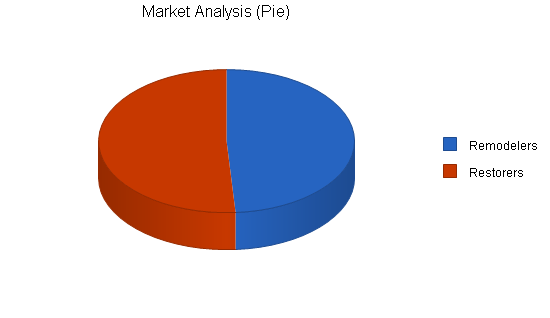
Wooderful Floors has identified two market segments that it will target: remodelers and restorers. Remodelers are redecorating one or more rooms within a house, restorers are refinishing their wood floor to the original shine. These two segments are targeted due to their willingness to do a complete, refinishing job to their floor and to their environmental commitment.
Wooderful Floors operates within the wood floor refinishing service business. There are many different competitors in this niche that are described in detail in the Service Business Analysis, and Competition and Buying Patterns sections.
4.1 Market Segmentation
Two distinct market segments will be targeted for Wooderful Floors’ marketing and sales campaign.
Remodelers
Home owners who are remodeling one or more rooms of a house. The remodeling is likely to include both floor work, wall coverings/movement, and possibly ceiling work. Each project is fairly extensive. Demographic data for this group includes:
- 1st or 2nd time home buyers
- >$60,000 in household income
- Single family
- Have lived in their home for at least 1.7 years
- 65% have an undergraduate degree
- 27% have a graduate degree
- Are environmentally conscious
- 17% buy organic produce
- 52% participate in some sort of human powered activity such as hiking or cycling at least twice a week
- 17% had a SUV but sold it out of environmental concerns
Restorers
Home owners refinishing the surface of their wood floor.
- 1st time home buyer
- Median household income is $51,000
- Single family
- Have lived in the home for 2.3 years
- 57% have an undergraduate degree
- Are environmentally conscious
- 44% participate in a human powered activity twice a week
| Market Analysis | |||||||
| Year 1 | Year 2 | Year 3 | Year 4 | Year 5 | |||
| Potential Customers | Growth | CAGR | |||||
| Remodelers | 6% | 98,747 | 104,672 | 110,952 | 117,609 | 124,666 | 6.00% |
| Restorers | 7% | 103,225 | 110,451 | 118,183 | 126,456 | 135,308 | 7.00% |
| Total | 6.51% | 201,972 | 215,123 | 229,135 | 244,065 | 259,974 | 6.51% |
4.2 Target Market Segment Strategy
The two market segments were chosen as a way of identifying customers that would use wood floor refinishing services. The difference between the target segments is the extent of the project. Remodelers may be harder to reach than the restorers, since the remodelers have more demands on their time dealing with multiple decisions for the whole project.

As the demographic data in the Market Segmentation section indicates, both groups of customers have environmental tendencies. This is an important characteristic for Wooderful Floors because its water-based floor finishing treatment offers the most value to those that have environmental concerns.
4.3 Service Business Analysis
Wooderful Floors operates within the wood floor refinishing service business. This industry is primarily residential base since 90% of wood floors are found in private residences. This industry is primarily made up of refinishers who can make small repairs. A smaller segment are installers who also offer refinishing. The industry was valued at $588 million in 2002 in the USA.
The industry has many competitors. Some competitors have a minimum square footage requirement, most offer all types of finishing products, but others like Wooderful Floors may only offer one type of finishing product. Some companies compete on price, some on speed, some on service, some on finished product quality. Companies within the industry indicate that 19% of their business is from word-of-mouth referrals.
4.3.1 Competition and Buying Patterns
A search in the Yellow Pages finds twelve companies that offer wood floor refinishing. Four offer the water based-finishing product, but Wooderful Floors is the only company that exclusively offers the water-based product. Four popular competitors include:
- Spotless Floors: This company installs wood floors as well as refinishes them. Customers must wait 4-6 weeks before a service appointment can be made.
- Touch of Class Wood Floor Refinishing: They offer all types of floor refinishing, competing on price. Quality of work is average.
- Nicolusi Brothers Wood Floor Refinishing: They only offer QuickBooks refinishing, claiming it is the only type of finish that they can recommend.
- Floor Finishes: A high end, full service floor contractor, offering work in wood, tile, and carpet.
Strategy and Implementation Summary
Wooderful Floors will steadily gain market share by leveraging its competitive edge of an environmental focus and being the most experienced refinisher with the new water-based finishing product.
Wooderful Floors’ marketing strategy will develop awareness regarding the non-toxic wood floor refinishing. Several different communication methods will be used. Recognizing influence of word-of-mouth recommendations in this industry, Wooderful Floors will use customer referral coupons to create economic incentives for referrals.
The sales effort for the wood floor refinishing will focus on Wooderful Floors’ competitive edge regarding specialization on environmentally-sound refinishes and offering the community the most experience with this new technology.
5.1 Competitive Edge
Wooderful Floors has a significant competitive advantage of being the only service provider that specializes on water-based products:
- Environmental focus: By only offering a water-based solution, Wooderful Floors is signalling to the market that they have environmental considerations.
- Experience: Wooderful Floors will be the service provider with the most experience with the water-based product since that is the only style of finishes that they work at.
5.2 Marketing Strategy
The marketing strategy will communicate that Wooderful Floors offers a new type of wood floor refinishing that is safe for home owners and the environment. This message will be distributed by:
Advertisements:
- The Pittsburgh Herald: The main daily paper. Once a week there is a home improvement section in which Wooderful Floors will advertise.
- The Pittsburgh Weekly: A popular weekly entertainment guide. This publication is pro-environment so the readership demographic are similar to Wooderful Floors’ targeted customers.
- Yellow Pages.
Customer referral coupons: These coupons will be distributed as an economic incentive for customers. The customer receives cash back if the coupon is used by the person they give it to.
5.3 Sales Strategy
The sales strategy focuses on emphasizing Wooderful Floors’ competitive edge of being environmentally conscious and having the greatest amount of experience in the industry. Wooderful Floors will stand out from its competitors as a company that cares about the environment and the safety of its clients.
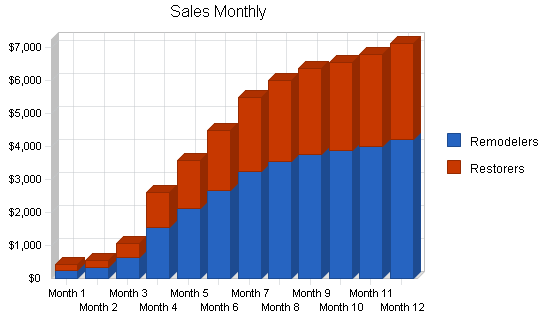
5.3.1 Sales Forecast
Wooderful Floors has adopted a conservative sales forecast as a method for predicting future sales as well as benchmarking progress.
Because the business is being funded by debt, a conservative forecast was chosen to better ensure that future obligations will be met. Please review the following table and charts which offer graphical presentations of the future sales.

| Sales Forecast | |||
| Year 1 | Year 2 | Year 3 | |
| Sales | |||
| Remodelers | $30,123 | $45,445 | $55,454 |
| Restorers | $20,785 | $31,357 | $38,263 |
| Total Sales | $50,908 | $76,802 | $93,717 |
| Direct Cost of Sales | Year 1 | Year 2 | Year 3 |
| Remodelers | $6,025 | $9,089 | $11,091 |
| Restorers | $4,157 | $6,271 | $7,653 |
| Subtotal Direct Cost of Sales | $10,182 | $15,360 | $18,743 |
5.4 Milestones
Wooderful Floors has chosen several milestones which will act as achievable goals for the company to reach within the first two years of operation. The milestones will be quantifiable goals so that it will be easy to discern when they are reached.
| Milestones | |||||
| Milestone | Start Date | End Date | Budget | Manager | Department |
| Business plan completion | 6/1/2003 | 6/30/2003 | $0 | Logan | Business Formation |
| Final equipment purchased | 1/1/2004 | 2/20/2004 | $0 | Logan | Operations |
| First large job | 3/15/2004 | 3/15/2004 | $0 | Logan | Sales |
| Profitability | 1/1/2004 | 1/1/2004 | $0 | Logan | Operations |
| Totals | $0 | ||||
Web Plan Summary
A simple website will be used as a marketing tool for the organization. The focus will be on the environmental concerns that Wooderful Floors has and the way it has met those concerns.
Logan’s experience, both as a floor refinisher and a pioneer of the use of water-based finishing products will be emphasized. General contact information and details regarding the environmentally-friendly products will be highlighted on the site.
6.1 Website Marketing Strategy
Wooderful Floors will submit the website to various search engines.
It is important that the website has been submitted to search engines so that it comes up high on the lists of hits when a specific customer is seeking out information regarding wood floor refinishing.
6.2 Development Requirements
Logan will employ a friend who will design and develop the website for the bargain price of $650.
Management Summary
Wooderful Floors has been founded and will be lead by Logan Madison. Logan received his Bachelor of Arts degree from Allegheny College. He worked for a general contractor performing wood floor refinishing for seven years before starting Wooderful Floors.
7.1 Personnel Plan
Logan will be the primary employee. He will use QuickBooks Pro for accounting and invoicing. For large jobs Logan will employ an additional laborer.
| Personnel Plan | |||
| Year 1 | Year 2 | Year 3 | |
| Logan | $24,000 | $25,000 | $30,000 |
| Additional employee | $4,200 | $833 | $1,000 |
| Total People | 2 | 2 | 2 |
| Total Payroll | $28,200 | $25,833 | $31,000 |
Financial Plan
The following sections will outline important financial information.
8.1 Start-up Funding
Funds for start up will be a combination of owner investment and a long-term bank loan, with an interest rate of not more than 7% for seven years.
| Start-up Funding | |
| Start-up Expenses to Fund | $19,900 |
| Start-up Assets to Fund | $18,100 |
| Total Funding Required | $38,000 |
| Assets | |
| Non-cash Assets from Start-up | $8,000 |
| Cash Requirements from Start-up | $10,100 |
| Additional Cash Raised | $0 |
| Cash Balance on Starting Date | $10,100 |
| Total Assets | $18,100 |
| Liabilities and Capital | |
| Liabilities | |
| Current Borrowing | $0 |
| Long-term Liabilities | $15,000 |
| Accounts Payable (Outstanding Bills) | $0 |
| Other Current Liabilities (interest-free) | $0 |
| Total Liabilities | $15,000 |
| Capital | |
| Planned Investment | |
| Owner | $15,000 |
| Other | $0 |
| Additional Investment Requirement | $8,000 |
| Total Planned Investment | $23,000 |
| Loss at Start-up (Start-up Expenses) | ($19,900) |
| Total Capital | $3,100 |
| Total Capital and Liabilities | $18,100 |
| Total Funding | $38,000 |
8.2 Important Assumptions
The following table details important Financial Assumptions.
| General Assumptions | |||
| Year 1 | Year 2 | Year 3 | |
| Plan Month | 1 | 2 | 3 |
| Current Interest Rate | 10.00% | 10.00% | 10.00% |
| Long-term Interest Rate | 7.00% | 7.00% | 7.00% |
| Tax Rate | 30.00% | 30.00% | 30.00% |
| Other | 0 | 0 | 0 |
8.3 Break-even Analysis
The Break-even Analysis indicates what will be needed in monthly revenue to reach the break-even point.

| Break-even Analysis | |
| Monthly Revenue Break-even | $4,156 |
| Assumptions: | |
| Average Percent Variable Cost | 20% |
| Estimated Monthly Fixed Cost | $3,325 |
8.4 Projected Profit and Loss
The following table and charts presents Projected Profit and Loss.


| Pro Forma Profit and Loss | |||
| Year 1 | Year 2 | Year 3 | |
| Sales | $50,908 | $76,802 | $93,717 |
| Direct Cost of Sales | $10,182 | $15,360 | $18,743 |
| Other Costs of Sales | $0 | $0 | $0 |
| Total Cost of Sales | $10,182 | $15,360 | $18,743 |
| Gross Margin | $40,726 | $61,442 | $74,974 |
| Gross Margin % | 80.00% | 80.00% | 80.00% |
| Expenses | |||
| Payroll | $28,200 | $25,833 | $31,000 |
| Sales and Marketing and Other Expenses | $1,200 | $1,200 | $1,200 |
| Depreciation | $2,664 | $2,666 | $2,666 |
| Utilities | $1,200 | $1,200 | $1,200 |
| Payroll Taxes | $4,230 | $0 | $0 |
| Insurance | $2,400 | $2,400 | $2,400 |
| Total Operating Expenses | $39,894 | $33,299 | $38,466 |
| Profit Before Interest and Taxes | $832 | $28,142 | $36,508 |
| EBITDA | $3,496 | $30,808 | $39,174 |
| Interest Expense | $963 | $803 | $624 |
| Taxes Incurred | $0 | $8,202 | $10,765 |
| Net Profit | ($130) | $19,138 | $25,119 |
| Net Profit/Sales | -0.26% | 24.92% | 26.80% |
8.5 Projected Cash Flow
The following table and chart displays the Projected Cash Flow.

| Pro Forma Cash Flow | |||
| Year 1 | Year 2 | Year 3 | |
| Cash Received | |||
| Cash from Operations | |||
| Cash Sales | $50,908 | $76,802 | $93,717 |
| Subtotal Cash from Operations | $50,908 | $76,802 | $93,717 |
| Additional Cash Received | |||
| Sales Tax, VAT, HST/GST Received | $0 | $0 | $0 |
| New Current Borrowing | $0 | $0 | $0 |
| New Other Liabilities (interest-free) | $0 | $0 | $0 |
| New Long-term Liabilities | $0 | $0 | $0 |
| Sales of Other Current Assets | $0 | $0 | $0 |
| Sales of Long-term Assets | $0 | $0 | $0 |
| New Investment Received | $0 | $0 | $0 |
| Subtotal Cash Received | $50,908 | $76,802 | $93,717 |
| Expenditures | Year 1 | Year 2 | Year 3 |
| Expenditures from Operations | |||
| Cash Spending | $28,200 | $25,833 | $31,000 |
| Bill Payments | $17,963 | $28,979 | $34,459 |
| Subtotal Spent on Operations | $46,163 | $54,813 | $65,459 |
| Additional Cash Spent | |||
| Sales Tax, VAT, HST/GST Paid Out | $0 | $0 | $0 |
| Principal Repayment of Current Borrowing | $0 | $0 | $0 |
| Other Liabilities Principal Repayment | $0 | $0 | $0 |
| Long-term Liabilities Principal Repayment | $2,304 | $2,460 | $2,639 |
| Purchase Other Current Assets | $0 | $0 | $0 |
| Purchase Long-term Assets | $0 | $0 | $0 |
| Dividends | $0 | $0 | $0 |
| Subtotal Cash Spent | $48,467 | $57,273 | $68,098 |
| Net Cash Flow | $2,441 | $19,529 | $25,620 |
| Cash Balance | $12,541 | $32,071 | $57,690 |
8.6 Projected Balance Sheet
The following table shows the Projected Balance Sheet.
| Pro Forma Balance Sheet | |||
| Year 1 | Year 2 | Year 3 | |
| Assets | |||
| Current Assets | |||
| Cash | $12,541 | $32,071 | $57,690 |
| Other Current Assets | $0 | $0 | $0 |
| Total Current Assets | $12,541 | $32,071 | $57,690 |
| Long-term Assets | |||
| Long-term Assets | $8,000 | $8,000 | $8,000 |
| Accumulated Depreciation | $2,664 | $5,330 | $7,996 |
| Total Long-term Assets | $5,336 | $2,670 | $4 |
| Total Assets | $17,877 | $34,741 | $57,694 |
| Liabilities and Capital | Year 1 | Year 2 | Year 3 |
| Current Liabilities | |||
| Accounts Payable | $2,211 | $2,397 | $2,871 |
| Current Borrowing | $0 | $0 | $0 |
| Other Current Liabilities | $0 | $0 | $0 |
| Subtotal Current Liabilities | $2,211 | $2,397 | $2,871 |
| Long-term Liabilities | $12,696 | $10,236 | $7,597 |
| Total Liabilities | $14,907 | $12,633 | $10,468 |
| Paid-in Capital | $23,000 | $23,000 | $23,000 |
| Retained Earnings | ($19,900) | ($20,030) | ($893) |
| Earnings | ($130) | $19,138 | $25,119 |
| Total Capital | $2,970 | $22,107 | $47,226 |
| Total Liabilities and Capital | $17,877 | $34,741 | $57,694 |
| Net Worth | $2,970 | $22,107 | $47,226 |
8.7 Business Ratios
The following table displays common business ratios relevant to Wooderful Floors as well as the wood floor industry. Please note that there are some variances between Wooderful’s ratios and the industry. Industry profile ratios are based on the Standard Industrial Classification (SIC) code 1752.
This can be explained by the fact that Wooderful is a small operation, with few employees and little capital expenses. Having the operation small helps them achieve above industry margins.
| Ratio Analysis | ||||
| Year 1 | Year 2 | Year 3 | Industry Profile | |
| Sales Growth | 0.00% | 50.86% | 22.02% | 5.11% |
| Percent of Total Assets | ||||
| Other Current Assets | 0.00% | 0.00% | 0.00% | 32.94% |
| Total Current Assets | 70.15% | 92.31% | 99.99% | 75.88% |
| Long-term Assets | 29.85% | 7.69% | 0.01% | 24.12% |
| Total Assets | 100.00% | 100.00% | 100.00% | 100.00% |
| Current Liabilities | 12.37% | 6.90% | 4.98% | 38.68% |
| Long-term Liabilities | 71.02% | 29.46% | 13.17% | 13.31% |
| Total Liabilities | 83.39% | 36.36% | 18.14% | 51.99% |
| Net Worth | 16.61% | 63.64% | 81.86% | 48.01% |
| Percent of Sales | ||||
| Sales | 100.00% | 100.00% | 100.00% | 100.00% |
| Gross Margin | 80.00% | 80.00% | 80.00% | 29.46% |
| Selling, General & Administrative Expenses | 88.28% | 37.26% | 34.91% | 14.86% |
| Advertising Expenses | 0.00% | 0.00% | 0.00% | 0.47% |
| Profit Before Interest and Taxes | 1.63% | 36.64% | 38.96% | 2.37% |
| Main Ratios | ||||
| Current | 5.67 | 13.38 | 20.09 | 1.74 |
| Quick | 5.67 | 13.38 | 20.09 | 1.38 |
| Total Debt to Total Assets | 83.39% | 36.36% | 18.14% | 6.96% |
| Pre-tax Return on Net Worth | -4.39% | 123.67% | 75.98% | 57.15% |
| Pre-tax Return on Assets | -0.73% | 78.70% | 62.20% | 16.25% |
| Additional Ratios | Year 1 | Year 2 | Year 3 | |
| Net Profit Margin | -0.26% | 24.92% | 26.80% | n.a |
| Return on Equity | -4.39% | 86.57% | 53.19% | n.a |
| Activity Ratios | ||||
| Accounts Payable Turnover | 9.12 | 12.17 | 12.17 | n.a |
| Payment Days | 27 | 29 | 28 | n.a |
| Total Asset Turnover | 2.85 | 2.21 | 1.62 | n.a |
| Debt Ratios | ||||
| Debt to Net Worth | 5.02 | 0.57 | 0.22 | n.a |
| Current Liab. to Liab. | 0.15 | 0.19 | 0.27 | n.a |
| Liquidity Ratios | ||||
| Net Working Capital | $10,330 | $29,673 | $54,819 | n.a |
| Interest Coverage | 0.86 | 35.06 | 58.49 | n.a |
| Additional Ratios | ||||
| Assets to Sales | 0.35 | 0.45 | 0.62 | n.a |
| Current Debt/Total Assets | 12% | 7% | 5% | n.a |
| Acid Test | 5.67 | 13.38 | 20.09 | n.a |
| Sales/Net Worth | 17.14 | 3.47 | 1.98 | n.a |
| Dividend Payout | 0.00 | 0.00 | 0.00 | n.a |
Appendix
| Sales Forecast | |||||||||||||
| Month 1 | Month 2 | Month 3 | Month 4 | Month 5 | Month 6 | Month 7 | Month 8 | Month 9 | Month 10 | Month 11 | Month 12 | ||
| Sales | |||||||||||||
| Remodelers | 0% | $250 | $325 | $622 | $1,545 | $2,121 | $2,654 | $3,232 | $3,545 | $3,754 | $3,858 | $4,005 | $4,212 |
| Restorers | 0% | $173 | $224 | $429 | $1,066 | $1,463 | $1,831 | $2,230 | $2,446 | $2,590 | $2,662 | $2,763 | $2,906 |
| Total Sales | $423 | $549 | $1,051 | $2,611 | $3,584 | $4,485 | $5,462 | $5,991 | $6,344 | $6,520 | $6,768 | $7,118 | |
| Direct Cost of Sales | Month 1 | Month 2 | Month 3 | Month 4 | Month 5 | Month 6 | Month 7 | Month 8 | Month 9 | Month 10 | Month 11 | Month 12 | |
| Remodelers | $50 | $65 | $124 | $309 | $424 | $531 | $646 | $709 | $751 | $772 | $801 | $842 | |
| Restorers | $35 | $45 | $86 | $213 | $293 | $366 | $446 | $489 | $518 | $532 | $553 | $581 | |
| Subtotal Direct Cost of Sales | $85 | $110 | $210 | $522 | $717 | $897 | $1,092 | $1,198 | $1,269 | $1,304 | $1,354 | $1,424 | |
| Personnel Plan | |||||||||||||
| Month 1 | Month 2 | Month 3 | Month 4 | Month 5 | Month 6 | Month 7 | Month 8 | Month 9 | Month 10 | Month 11 | Month 12 | ||
| Logan | 0% | $2,000 | $2,000 | $2,000 | $2,000 | $2,000 | $2,000 | $2,000 | $2,000 | $2,000 | $2,000 | $2,000 | $2,000 |
| Additional employee | 0% | $0 | $0 | $0 | $0 | $500 | $500 | $500 | $500 | $500 | $500 | $600 | $600 |
| Total People | 1 | 1 | 1 | 1 | 2 | 2 | 2 | 2 | 2 | 2 | 2 | 2 | |
| Total Payroll | $2,000 | $2,000 | $2,000 | $2,000 | $2,500 | $2,500 | $2,500 | $2,500 | $2,500 | $2,500 | $2,600 | $2,600 | |
| General Assumptions | |||||||||||||
| Month 1 | Month 2 | Month 3 | Month 4 | Month 5 | Month 6 | Month 7 | Month 8 | Month 9 | Month 10 | Month 11 | Month 12 | ||
| Plan Month | 1 | 2 | 3 | 4 | 5 | 6 | 7 | 8 | 9 | 10 | 11 | 12 | |
| Current Interest Rate | 10.00% | 10.00% | 10.00% | 10.00% | 10.00% | 10.00% | 10.00% | 10.00% | 10.00% | 10.00% | 10.00% | 10.00% | |
| Long-term Interest Rate | 7.00% | 7.00% | 7.00% | 7.00% | 7.00% | 7.00% | 7.00% | 7.00% | 7.00% | 7.00% | 7.00% | 7.00% | |
| Tax Rate | 30.00% | 30.00% | 30.00% | 30.00% | 30.00% | 30.00% | 30.00% | 30.00% | 30.00% | 30.00% | 30.00% | 30.00% | |
| Other | 0 | 0 | 0 | 0 | 0 | 0 | 0 | 0 | 0 | 0 | 0 | 0 | |
| Pro Forma Profit and Loss | |||||||||||||
| Month 1 | Month 2 | Month 3 | Month 4 | Month 5 | Month 6 | Month 7 | Month 8 | Month 9 | Month 10 | Month 11 | Month 12 | ||
| Sales | $423 | $549 | $1,051 | $2,611 | $3,584 | $4,485 | $5,462 | $5,991 | $6,344 | $6,520 | $6,768 | $7,118 | |
| Direct Cost of Sales | $85 | $110 | $210 | $522 | $717 | $897 | $1,092 | $1,198 | $1,269 | $1,304 | $1,354 | $1,424 | |
| Other Costs of Sales | $0 | $0 | $0 | $0 | $0 | $0 | $0 | $0 | $0 | $0 | $0 | $0 | |
| Total Cost of Sales | $85 | $110 | $210 | $522 | $717 | $897 | $1,092 | $1,198 | $1,269 | $1,304 | $1,354 | $1,424 | |
| Gross Margin | $338 | $439 | $841 | $2,089 | $2,868 | $3,588 | $4,370 | $4,793 | $5,075 | $5,216 | $5,415 | $5,695 | |
| Gross Margin % | 80.00% | 80.00% | 80.00% | 80.00% | 80.00% | 80.00% | 80.00% | 80.00% | 80.00% | 80.00% | 80.00% | 80.00% | |
| Expenses | |||||||||||||
| Payroll | $2,000 | $2,000 | $2,000 | $2,000 | $2,500 | $2,500 | $2,500 | $2,500 | $2,500 | $2,500 | $2,600 | $2,600 | |
| Sales and Marketing and Other Expenses | $100 | $100 | $100 | $100 | $100 | $100 | $100 | $100 | $100 | $100 | $100 | $100 | |
| Depreciation | $222 | $222 | $222 | $222 | $222 | $222 | $222 | $222 | $222 | $222 | $222 | $222 | |
| Utilities | $100 | $100 | $100 | $100 | $100 | $100 | $100 | $100 | $100 | $100 | $100 | $100 | |
| Payroll Taxes | 15% | $300 | $300 | $300 | $300 | $375 | $375 | $375 | $375 | $375 | $375 | $390 | $390 |
| Insurance | $200 | $200 | $200 | $200 | $200 | $200 | $200 | $200 | $200 | $200 | $200 | $200 | |
| Total Operating Expenses | $2,922 | $2,922 | $2,922 | $2,922 | $3,497 | $3,497 | $3,497 | $3,497 | $3,497 | $3,497 | $3,612 | $3,612 | |
| Profit Before Interest and Taxes | ($2,584) | ($2,483) | ($2,081) | ($833) | ($629) | $91 | $873 | $1,296 | $1,578 | $1,719 | $1,803 | $2,083 | |
| EBITDA | ($2,362) | ($2,261) | ($1,859) | ($611) | ($407) | $313 | $1,095 | $1,518 | $1,800 | $1,941 | $2,025 | $2,305 | |
| Interest Expense | $86 | $85 | $84 | $83 | $82 | $81 | $80 | $79 | $77 | $76 | $75 | $74 | |
| Taxes Incurred | $0 | $0 | $0 | $0 | $0 | $0 | $0 | $0 | $0 | $0 | $0 | $0 | |
| Net Profit | ($2,670) | ($2,568) | ($2,165) | ($916) | ($711) | $10 | $793 | $1,217 | $1,501 | $1,643 | $1,728 | $2,009 | |
| Net Profit/Sales | -632.04% | -467.52% | -205.98% | -35.09% | -19.84% | 0.23% | 14.52% | 20.32% | 23.66% | 25.19% | 25.52% | 28.22% | |
| Pro Forma Cash Flow | |||||||||||||
| Month 1 | Month 2 | Month 3 | Month 4 | Month 5 | Month 6 | Month 7 | Month 8 | Month 9 | Month 10 | Month 11 | Month 12 | ||
| Cash Received | |||||||||||||
| Cash from Operations | |||||||||||||
| Cash Sales | $423 | $549 | $1,051 | $2,611 | $3,584 | $4,485 | $5,462 | $5,991 | $6,344 | $6,520 | $6,768 | $7,118 | |
| Subtotal Cash from Operations | $423 | $549 | $1,051 | $2,611 | $3,584 | $4,485 | $5,462 | $5,991 | $6,344 | $6,520 | $6,768 | $7,118 | |
| Additional Cash Received | |||||||||||||
| Sales Tax, VAT, HST/GST Received | 0.00% | $0 | $0 | $0 | $0 | $0 | $0 | $0 | $0 | $0 | $0 | $0 | $0 |
| New Current Borrowing | $0 | $0 | $0 | $0 | $0 | $0 | $0 | $0 | $0 | $0 | $0 | $0 | |
| New Other Liabilities (interest-free) | $0 | $0 | $0 | $0 | $0 | $0 | $0 | $0 | $0 | $0 | $0 | $0 | |
| New Long-term Liabilities | $0 | $0 | $0 | $0 | $0 | $0 | $0 | $0 | $0 | $0 | $0 | $0 | |
| Sales of Other Current Assets | $0 | $0 | $0 | $0 | $0 | $0 | $0 | $0 | $0 | $0 | $0 | $0 | |
| Sales of Long-term Assets | $0 | $0 | $0 | $0 | $0 | $0 | $0 | $0 | $0 | $0 | $0 | $0 | |
| New Investment Received | $0 | $0 | $0 | $0 | $0 | $0 | $0 | $0 | $0 | $0 | $0 | $0 | |
| Subtotal Cash Received | $423 | $549 | $1,051 | $2,611 | $3,584 | $4,485 | $5,462 | $5,991 | $6,344 | $6,520 | $6,768 | $7,118 | |
| Expenditures | Month 1 | Month 2 | Month 3 | Month 4 | Month 5 | Month 6 | Month 7 | Month 8 | Month 9 | Month 10 | Month 11 | Month 12 | |
| Expenditures from Operations | |||||||||||||
| Cash Spending | $2,000 | $2,000 | $2,000 | $2,000 | $2,500 | $2,500 | $2,500 | $2,500 | $2,500 | $2,500 | $2,600 | $2,600 | |
| Bill Payments | $29 | $872 | $898 | $1,005 | $1,314 | $1,580 | $1,759 | $1,951 | $2,054 | $2,122 | $2,157 | $2,221 | |
| Subtotal Spent on Operations | $2,029 | $2,872 | $2,898 | $3,005 | $3,814 | $4,080 | $4,259 | $4,451 | $4,554 | $4,622 | $4,757 | $4,821 | |
| Additional Cash Spent | |||||||||||||
| Sales Tax, VAT, HST/GST Paid Out | $0 | $0 | $0 | $0 | $0 | $0 | $0 | $0 | $0 | $0 | $0 | $0 | |
| Principal Repayment of Current Borrowing | $0 | $0 | $0 | $0 | $0 | $0 | $0 | $0 | $0 | $0 | $0 | $0 | |
| Other Liabilities Principal Repayment | $0 | $0 | $0 | $0 | $0 | $0 | $0 | $0 | $0 | $0 | $0 | $0 | |
| Long-term Liabilities Principal Repayment | $192 | $192 | $192 | $192 | $192 | $192 | $192 | $192 | $192 | $192 | $192 | $192 | |
| Purchase Other Current Assets | $0 | $0 | $0 | $0 | $0 | $0 | $0 | $0 | $0 | $0 | $0 | $0 | |
| Purchase Long-term Assets | $0 | $0 | $0 | $0 | $0 | $0 | $0 | $0 | $0 | $0 | $0 | $0 | |
| Dividends | $0 | $0 | $0 | $0 | $0 | $0 | $0 | $0 | $0 | $0 | $0 | $0 | |
| Subtotal Cash Spent | $2,221 | $3,064 | $3,090 | $3,197 | $4,006 | $4,272 | $4,451 | $4,643 | $4,746 | $4,814 | $4,949 | $5,013 | |
| Net Cash Flow | ($1,799) | ($2,514) | ($2,039) | ($586) | ($422) | $213 | $1,011 | $1,348 | $1,598 | $1,706 | $1,819 | $2,105 | |
| Cash Balance | $8,301 | $5,787 | $3,748 | $3,162 | $2,740 | $2,954 | $3,965 | $5,313 | $6,911 | $8,617 | $10,436 | $12,541 | |
| Pro Forma Balance Sheet | |||||||||||||
| Month 1 | Month 2 | Month 3 | Month 4 | Month 5 | Month 6 | Month 7 | Month 8 | Month 9 | Month 10 | Month 11 | Month 12 | ||
| Assets | Starting Balances | ||||||||||||
| Current Assets | |||||||||||||
| Cash | $10,100 | $8,301 | $5,787 | $3,748 | $3,162 | $2,740 | $2,954 | $3,965 | $5,313 | $6,911 | $8,617 | $10,436 | $12,541 |
| Other Current Assets | $0 | $0 | $0 | $0 | $0 | $0 | $0 | $0 | $0 | $0 | $0 | $0 | $0 |
| Total Current Assets | $10,100 | $8,301 | $5,787 | $3,748 | $3,162 | $2,740 | $2,954 | $3,965 | $5,313 | $6,911 | $8,617 | $10,436 | $12,541 |
| Long-term Assets | |||||||||||||
| Long-term Assets | $8,000 | $8,000 | $8,000 | $8,000 | $8,000 | $8,000 | $8,000 | $8,000 | $8,000 | $8,000 | $8,000 | $8,000 | $8,000 |
| Accumulated Depreciation | $0 | $222 | $444 | $666 | $888 | $1,110 | $1,332 | $1,554 | $1,776 | $1,998 | $2,220 | $2,442 | $2,664 |
| Total Long-term Assets | $8,000 | $7,778 | $7,556 | $7,334 | $7,112 | $6,890 | $6,668 | $6,446 | $6,224 | $6,002 | $5,780 | $5,558 | $5,336 |
| Total Assets | $18,100 | $16,079 | $13,343 | $11,082 | $10,274 | $9,630 | $9,622 | $10,411 | $11,537 | $12,913 | $14,397 | $15,994 | $17,877 |
| Liabilities and Capital | Month 1 | Month 2 | Month 3 | Month 4 | Month 5 | Month 6 | Month 7 | Month 8 | Month 9 | Month 10 | Month 11 | Month 12 | |
| Current Liabilities | |||||||||||||
| Accounts Payable | $0 | $842 | $865 | $961 | $1,262 | $1,521 | $1,694 | $1,882 | $1,983 | $2,051 | $2,083 | $2,145 | $2,211 |
| Current Borrowing | $0 | $0 | $0 | $0 | $0 | $0 | $0 | $0 | $0 | $0 | $0 | $0 | $0 |
| Other Current Liabilities | $0 | $0 | $0 | $0 | $0 | $0 | $0 | $0 | $0 | $0 | $0 | $0 | $0 |
| Subtotal Current Liabilities | $0 | $842 | $865 | $961 | $1,262 | $1,521 | $1,694 | $1,882 | $1,983 | $2,051 | $2,083 | $2,145 | $2,211 |
| Long-term Liabilities | $15,000 | $14,808 | $14,616 | $14,424 | $14,232 | $14,040 | $13,848 | $13,656 | $13,464 | $13,272 | $13,080 | $12,888 | $12,696 |
| Total Liabilities | $15,000 | $15,650 | $15,481 | $15,385 | $15,494 | $15,561 | $15,542 | $15,538 | $15,447 | $15,323 | $15,163 | $15,033 | $14,907 |
| Paid-in Capital | $23,000 | $23,000 | $23,000 | $23,000 | $23,000 | $23,000 | $23,000 | $23,000 | $23,000 | $23,000 | $23,000 | $23,000 | $23,000 |
| Retained Earnings | ($19,900) | ($19,900) | ($19,900) | ($19,900) | ($19,900) | ($19,900) | ($19,900) | ($19,900) | ($19,900) | ($19,900) | ($19,900) | ($19,900) | ($19,900) |
| Earnings | $0 | ($2,670) | ($5,238) | ($7,403) | ($8,320) | ($9,031) | ($9,020) | ($8,227) | ($7,010) | ($5,509) | ($3,866) | ($2,139) | ($130) |
| Total Capital | $3,100 | $430 | ($2,138) | ($4,303) | ($5,220) | ($5,931) | ($5,920) | ($5,127) | ($3,910) | ($2,409) | ($766) | $961 | $2,970 |
| Total Liabilities and Capital | $18,100 | $16,079 | $13,343 | $11,082 | $10,274 | $9,630 | $9,622 | $10,411 | $11,537 | $12,913 | $14,397 | $15,994 | $17,877 |
| Net Worth | $3,100 | $430 | ($2,138) | ($4,303) | ($5,220) | ($5,931) | ($5,920) | ($5,127) | ($3,910) | ($2,409) | ($766) | $961 | $2,970 |


