
Hisarlik Hardware
Executive Summary
Last year Wilusa Magazine surveyed current downtown residents and found that hardware stores are one of the top ten things needed to make downtown a great place to live. The same reasons that make downtown a great place to live also make it a great place to work.
The demographics of home ownership have changed radically in downtown Indianapolis. Today’s hardware store, which more and more is dominated by the “big box stores”, is cold, uninviting, and usually involves substantial driving time from downtown Wilusa. Hisarlik Hardware is uniquely positioned to take advantage of this new fact of life. Conveniently located to serve the Troas, Sinope Bay, Miletus Square, and Lycia areas, as well as all of Arazawa Township, Hisarlik Hardware offers parts, materials, and advice to tackle any home or do-it-yourself (d-i-y) project, whether the customer is a complete novice or a contractor. The focus is on helping the customer identify what they want and need as soon as they enter the store.
Through the use of superior personal customer attention, great product selection, and reasonable prices, Hisarlik Hardware will capitalize on this promising opportunity. A location is being secured that offers excellent traffic with a built-in magnet for urban dwellers–downtown’s only grocery store sharing the parking lot. The Building Blocks parent organization will help efficiently lay out and plan the store to increase sales and give the customers the utmost in attention. Hisarlik’s management team has a wealth of business, financial, and mechanical experience that will ensure a great investment and the overall success of the venture. The projected growth rate for Hisarlik Hardware is quite steady and has the potential to grow exponentially along with the increase in residential development downtown.
Hisarlik Hardware will produce positive cash flow its first year of operations. Hisarlik will also produce a net profit in its first year of operations.
1.1 Objectives
There are four major objectives of this business plan, of which three are immediate and the fourth is of a longer-term nature.
- Determine the feasibility of a downtown hardware store.
- Develop the strategy to open, manage and grow a profitable downtown hardware store venture.
- Establish a firm budget to operate and manage the business from concept to start up to operation, with good cash flow and consistent profits.
- Explore potential growth in downtown market and evolve new sources of business.
1.2 Mission
Hisarlik Hardware’s mission is to create a downtown hardware store that is reliable and convenient. A store that offers great service and selection of hardware and home improvement products in a customer friendly environment.
Hisarlik Hardware will cater to downtown residents, downtown property managers, downtown businesses, contractors, and suburban commuters. Our customers will become loyal because of the great advice, prompt service, good staff attitudes, the overall quality of the shopping experience, and the fact that we consistently have solutions for their needs.
1.3 Feasibility of the Business
Hector Priamson and Troy Enterprises went through a long and thorough process of looking at different business ventures that would allow them to go into business and be a long-term success. Through this process retail hardware became a potential opportunity. The following items are considered “must have” items in order to make Hector Priamson and Troy Enterprises not only feasible, but a tremendous success.
- An industry that is healthy, resistant to economic swings, and allows an entrepreneur to influence the stores results.
- A market that can deliver the kind of potential that will allow a store to be profitable.
- A store location that will be easy for customers to find, allow easy access, plenty of parking and have economic terms that allow the store to be successful.
- A successful and cooperative “partner”, such as Building Blocks, a national hardware co-operative, that will help research, plan, market, and operate a hardware store.
- A financial package that would allow the business to begin operations and operate in terms that would be realistic and successful for all involved whether it was private investors or the bank.
- Participants must possess the business skills, a strong work ethic, and a level of competitiveness required to make the business a success.
Building Blocks provides all of the tools and Hector Priamson possesses the financial, entrepreneurial, mechanical, and management skills needed to be successful in this business.
1.4 Keys to Success
- Hardware Industry: The Home Improvement industry has been consistently growing at a rate of 7% per year for the past decade according to the US Department of Commerce, with total US Sales of over $313 billion in 2002. While the economy has fluctuated up and down over the past decade, the growth of the hardware industry has continued to grow at the same pace. The “Big Box” stores have also created a “Do-it-yourself” mentality in this country, a mentality that has a positive effect on the independent hardware store.
- Location: The proposed location for Hisarlik Hardware is Troas Marketplace, a retail and commercial property on the corner of E. Anglia St. between N. Umberland St. and N. Mercia Blvd. Troas Marketplace primary tenants are Scamander’s Food Market located across the parking lot and Buckbasket Cleaners adjacent to the proposed site. Scamander’s is a huge draw. Scamander’s is the only grocery store in downtown Wilusa. The location of this store is known to all downtown residents, one block from the trendy and hip Wessex Avenue. The Troas Marketplace offers plenty of parking, very important for a downtown location, as well as easy access to the parking lot from E. Anglia St. or N. Mercia St. E. Anglia St. is a major eastbound thoroughfare east of downtown.
- Urban Products: The location in downtown Wilusa will require a different product mix than a suburban store. There will be a unique product demand from urban dwellers. Building Blocks will be a big part of determining the mix of products that will be right for the urban market through their IAIS program (Inventory Always In Stock). Hisarlik Hardware will be in touch with, and focus on, the downtown urban market, delivering products that are applicable to local customers, and marketing these items at competitive prices.
- Commercial Customers: Hisarlik Hardware will also focus on becoming the hardware products source for every building and business in downtown Wilusa. We will work hard to establish relationships with property managers and service personnel. There are also plans to set up a delivery service to the downtown business market making it even easier for customers to get the products they need, when they need them. While Hisarlik Hardware may be convenient and easy to access, potential customers may not find it to be convenient to leave their offices. There will be an emphasis to establish business accounts for each of these customers to make doing business easy for them.
- Building Blocks : It is crucial to have a co-op like Building Blocks behind efforts to open a store like Hisarlik Hardware. They provide all of the tools to be successful in the hardware business including research, floor plans, marketing, and systems and instructions for operating a hardware store. To become a Building Blocks Member (Member of the Building Blocks Co-op) really means they will provide an entrepreneur a “business in box”, yet allow the members to control their own business. There are extensive marketing programs that have been built based on input from members to help generate sales, increase traffic and ultimately increase profits.
- Service and Convenience: Service and Convenience are the keys to success in this business. They are also the strengths of independent hardware stores. The store needs to be easy to get to and easy to use when the customer walks inside. Our personnel have experience in high-end client hospitality. This experience will be invaluable in dealing with customers and clients. We will also keep meticulous records on what customers are looking for that we do not currently have in stock. As discussed earlier, a delivery program will be developed to make it easy for business customers to receive products without leaving the office. We will also market to the suburban commuter who works downtown and can take advantage of the convenience of stopping on their way to or from work. Happy hour specials to encourage shopping after the five o’clock whistle will be instituted.
% agree I like getting everything I need for a home maintenance project in one stop 76.3% I like being able to shop for home decor products where I shop for building materials 31.4% A neighborhood hardware store meets most of my home improvement/maintenance needs 25.8% For most purchases, I prefer a neighborhood hardware store instead of a large home improvement center 24.1% —Retail Forward, Home Improvement Shopper Update, 2001 - Repair/Project Resource Area: Hisarlik Hardware will leverage the strength of an established reputation for superb service built by other Building Blocks Co-op member stores. It is a reputation that has positioned Building Blocks to be the leading independent hardware stores (from Consumer Checkbook, Aug 2003), and filling the gaps in the “Big Box” retailers one-size-fits-all offerings. The Resource area will allow the customer to ask for help or directions as they enter the store. This area will also offer assistance as they start a project, help in finding what they need, sharing know-how in completing a project, and advice on how to get a project done. Store employees will be knowledgeable in home repairs/projects, home improvement, and mechanical repair and retro-fit. In addition, the resource area will be used to conduct short training sessions and demonstrations in home repair and home improvement projects.
- The Tool Room Rental: A rental business will be established under the Building Blocks’ “The Tool Room Rentals” tool rental program. This will not only help with the initial cash flow, but will also be a source of additional sales as every tool will need accessories to go with the rental. We will also think about party rental items to be included in the rental inventory. Building Blocks will aid in developing the right rental product mix for this urban market.
All of these keys will be combined to drive sales and ultimately the bottom line…net profit.

Company Summary
In the company summary section, we will review the Troy Enterprises business and corporate entity and ownership, the role of Building Blocks in the business, the proposed location, and the start-up costs and funding.
2.1 Start-up Summary
Hisarlik Hardware has worked very closely with Building Blocks Hardware to establish a detailed start-up cost list. Building Blocks’ knowledge, track record and expertise have been invaluable in setting up this venture.
2.1.1 Start-up Expenses
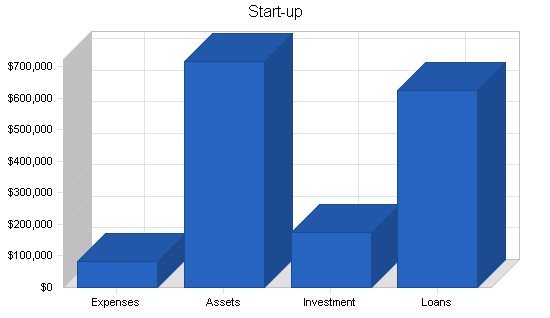
The start-up costs of Hisarlik Hardware, as detailed below, will consist primarily of inventory, equipment and fixtures. Hector Priamson will invest cash, benefits and labor to the start up. Investors will contribute substantially. The company will secure an SBA 7(a) loan to be paid back on a 7-year amortization.
There is an amount budgeted for leasehold improvements which is intended to make minor modifications to the proposed site to prepare it for opening. These improvements include replacing missing ceiling tiles and cleaning, polishing, or redoing the floor tile. It is anticipated that the new floor tile can be laid over the existing tile at a substantial savings with no loss in quality or durability.
| Start-up | |
| Requirements | |
| Start-up Expenses | |
| The Tool Room Rental Training | $1,200 |
| Salaries for Fixture Set-up | $14,716 |
| Merchandiser Cost for Regular Merchandise Set-up | $32,000 |
| Merhcandiser Cost for Paint and Tool Shop | $12,500 |
| Set-up Salaries | $22,916 |
| Other | $0 |
| Total Start-up Expenses | $83,332 |
| Start-up Assets | |
| Cash Required | $96,164 |
| Start-up Inventory | $344,000 |
| Other Current Assets | $30,400 |
| Long-term Assets | $246,104 |
| Total Assets | $716,668 |
| Total Requirements | $800,000 |
2.2 Building Blocks’ Role
With the merger of Kadmus, Homer & Company and Delphi/Ouroboros, Building Blocks is a cooperative comprised of members who are entrepreneur-retailers. Building Blocks is committed to empowering the independent retailer by setting industry and market standards with their niche businesses and unique brand of creative marketing, wide product assortment, award winning merchandising and technology, and quality training and business expertise. Building Blocks’ buying power of more than $2.5 billion annually helps pass on benefits to independent members.
Building Blocks has been a world leader in the hardware industry in product selection and customer service for do-it-yourselfers since 1948.
Vision
To be the best-in-class provider of products and solution choices that drive our members’ and our co-op’s profitability.Mission
To provide:
- Choices of retail and commercial solutions to drive members’ sales and profits
- Assortments to support the solutions
- Operational excellence in the delivery of products and solutions
2.2.1 Market Reseach
Building Blocks has a wealth of experience and know-how on opening new hardware stores, with 6,567 stores worldwide. Building Blocks has become a leader in determining what factors make a hardware retailer successful.
Building Blocks currently uses a service called Yorikle. This service is used to define the demographics and the expenditure potential of new markets. For Hisarlik Hardware, the report was run on a one-, two-, and three-mile radius around the proposed location. The report showed an exceptional amount of business (only reporting households, the study does not include property managers, businesses, or commuters), especially considering that there is no direct competition in the area. The reports also get very specific as far as what the potential market is for hardware overall as well as specific categories within a store. There are also numbers reports for the expected growth in the area over the next five years.
2.2.2 Planning
Building Blocks supplies professional design services to maximize merchandisable space and traffic flow. Services include fixture plans, interior signage and decor, merchandising plans, lighting, basic site plans, and exterior storefront elevations. These plans are custom developed for each location and each store’s footprint. The associated costs are included in the start-up costs.
A unique plan will be done for the proposed site for Hisarlik Hardware. This process will begin as soon as the lease for the property is signed.
2.2.3 Support
Building Blocks provides a variety of support to all current members as well as prospects seeking to join the co-op. The support comes to members in the form of retail consultants, knowledge, profit building programs, retail automation, training, advertising & promotion, a national brand, buying power, semi-annual markets, and an operations and distribution network.
Retail Consultant
Every member and prospect is assigned a retail consultant who works with them on an ongoing basis. There is also a retail operations specialist who helps prospects open new stores. There are regional marketing staff that are available as well as individual Building Blocks staff for individual marketing programs.
Knowledge
All specialists share their wealth of personal knowledge as well as having access to Building Blocks’ cumulative knowledge and experience. Building Blocks has made this model work since 1948. It works very well and enables members to be very successful business people and has made Building Blocks the largest retail hardware co-operative in North America.
Proven Profit Building
Building Blocks makes available a large number of programs that entrepreneurs can choose to participate in. They include retail pricing systems, electronic order entry systems, commercial and industrial sales, category specific planograms, and direct mail circulars, just to name a few.
2.2.4 Retail Automation
Building Blocks leads the industry in automating their stores. Building Blocks has brought their stores into the future with the automation which is made available to members. This is a strength of Building Blocks and a service that is available to all of their members. This automation helps the members in many different ways including inventory control, ordering, sales, and accounts receivable, all tied together in one system called Delian.
Experienced technical support personnel work with members to ensure current retail automation capabilities are compatible with Building Blocks’ existing system. Building Blocks’ existing system is Delian, an industry leading software program based on Triad Eagle for Windows platform. Delian is an easy-to-use, easy-to-learn tool that contains up-to-the-minute ordering and inventory accuracy, point of sale, accounts receivable, and much more. It contains all the daily business tools needed to manage Hisarlik Hardware.
- Inventory: Building Blocks’ industry leading retail merchandise approach is designed to organize a store’s departments, maximize space by removing non-selling inventory, ultimately freeing up valuable floor space. This unique concept accommodates the needs of customers by featuring the right merchandise assortment proven to increase overall profits. Category specific guidelines and planograms maximize retail sales and inventory turns. IAIS is based on the best selling items from the most successful Building Blocks stores.
- Ordering: Building Blocks has made ordering easy. The Delian program helps track the needs and generates the necessary inventory levels. Orders can be placed through the Building Blocks electronic order Entry System.
- Pricing: Building Blocks’ Retail Pricing System enhances the ability of each store to maintain a competitive price image while maximizing profitability. Building Blocks’ Retail Consultant will help establish retail pricing which results in increased sales opportunities and profit margins based on downtown Wilusa.
2.2.5 Training
Building Blocks has educational programs which they call Building Blocks University. Programs have been growing year after year and last year they offered certificate programs for new members. There are four required courses and four Building Blocks University workshops and seminars. There is also required course work for any member that is opening a The Tool Room Rentals as part of their program.
There are five core programs for new store owners which make up the initial training. They are:
- Certificate of Business Management
- Certificate of Marketing Management
- Certificate of Ownership Management
- Certificate of Retail and Sales Management
- Certificate of Human Resource Management
When a member opens a The Tool Room Rentals business there is also required training that applies only to The Tool Room Rentals. There is also a wide range of do-it-yourself programs that are on CD-ROM and video.
2.2.6 Advertising and Promotion
Building Blocks’ marketing programs are second to none in the industry. They include every tool needed to be successful in the retail hardware business. They include Power Events, interior and exterior signage, online programs, and custom circulars.
Every member store is assigned a field marketing manager. The marketing manager makes the members aware of the marketing tools available and how best to use them.
There are marketing strategy programs, programs that increase traffic, increase transactions, and those that merely build the brand. All are made available, and it is the savvy member who uses the right programs and spend their advertising dollars best. Based on the marketing experience Hisarlik Hardware has, this is a strength most start-up businesses do not possess.
- Marketing Strategies: The field marketing managers work with each member to determine the needs and issues for each store. They look at the market penetration and awareness in the market. As this information is gathered, a list of strengths and weaknesses is developed and programs designed to work on each of the objectives. A very basic local store marketing tool kit is given to each member. This is designed to show members what has been successful and basic marketing information that can be used on the local level. There are also national programs that support what is done on a local level. They include national television, radio, and newspaper.
- Increasing Traffic: Building Blocks has also developed programs designed to drive traffic to the stores. They include bargain of the month, circulars, Yellow Page programs, and local television, radio and newspaper. Circulars play a huge role in local advertising. There are three ways to get the circulars in the hands of the consumer, newspaper insertion, ADVO circular distribution and direct mail. Each of these programs have different costs associated with them and different penetration in the market. Circulars can be designed for an individual store. They are all customizable and can be generated in any volume necessary. Building Blocks also plans four Power Events throughout the year which are nationally advertised programs supported by television, radio and print. In 2003, Building Blocks saw a significant increase in traffic and bottom line during each of the Power Events.
- Increasing Transactions: Programs have been developed to increase the amount of each transactions. There are display shelving end caps, wing panels, and clip strips that help increase sales on these specially priced items. There are also online sign making programs that help members produce professional signs and save money on creative and printing jobs. Muzak is a program of in-store audio and messaging which customers cannot ignore, and that drives them to specials and promotions they may not have been aware of.
- Brand Building: The brand building programs are designed to reinforce the established Building Blocks name, both on the interior and exterior of the store. Programs have also been designed for vehicle graphics.
2.2.7 National Brand
For over 40 years, the name Building Blocks has stood for trust, service and fair prices. Building Blocks’ brand positioning statement is “Building Blocks is the best place to get just what you need to complete home repair and maintenance projects quickly and easily.” It is a name with heritage and integrity. Consistent national media and the fact that Building Blocks is the largest co-op of independent hardware store owners, has established Building Blocks as a recognizable name in retail hardware.
The bottom line is people know that the Building Blocks name means hardware. That is an asset new businesses work for years to establish.
2.2.8 Buying Power
An independent hardware store cannot compete in the current market, without a co-op behind them. A Building Blocks member has the benefit of $2.5 billion in buying power which is passed on in savings and profits. That makes Building Blocks the largest co-op of its kind in North America.
This is the main factor in making sure all Building Blocks members are getting products at the best possible prices to enable them to maximize profits.
2.2.9 Semi-Annual Markets
Building Blocks holds semi-annual markets where members can buy products and plan purchases for the upcoming seasons. Markets are held in March (Fall/Winter) and October (Spring/Summer). Members are informed of new items and trends in the industry at these markets enabling them to make good purchasing decisions. There are also programs which allow members to make purchasing commitments at large cash savings.
2.2.10 Operations and Distribution Network
Building Blocks has established a network of strategically placed distribution centers throughout the United States to assure timely deliveries regardless of where the store is located. Trucks deliver at least once per week and twice if necessary. This is a huge benefit, because this process allows excess inventory to sit in the distribution center as opposed to the store shelves. Over 64,000 items can be purchased on a per piece basis enabling stores to get whatever quantity is needed at any time.
2.3 Company Ownership
Troy Enterprises, Inc. is a privately-held S corporation, currently 100% owned by its founder and president, Hector Priamson and his wife Andromache Eetion. The company will be operating under the name of Hisarlik Hardware. There are expected to be investors in the new venture. Individual investors will own no more than 15% of Troy Enterprises, Inc. These investors will provide investment in the way of seed cash to help start the business and none of the investors will be active participants in any management decisions.
In order to make Troy Enterprises, Inc. financially viable, there are three major factors necessary to get the business up and running. First, a feasible concept. We have found that with Building Blocks in the downtown Wilusa market. Second, the business needs someone to manage it. It needed a professional with a good deal of experience to operate and manage the business. This manager needs a sound financial background as well as an entrepreneurial spirit. Third, the business needs financial support. This support will come from three different sources. Hector Priamson will invest time and some capital to start the business. There is a need for investors to help with the initial capital to allow the business to have enough equity to get off the ground. The final piece of financial support is the faith and commitment of a financial institution to loan the remaining funds that are needed to operate the business.
2.3.1 Hector Priamson
Troy Enterprises, Inc. founder and president is Hector Priamson. Hector is a resident of Ilion. He is married to Andromache Eetion who is currently a realtor with Ahhiyawa, Hatti & Company.
Hector will spend 100% of his time on this new start-up venture. Hector has a wealth of experience in business. He started his career straight out of college with a very exclusive “Big Eight” Accounting firm. While with Manapa Tarhunda and Co. Hector earned his CPA license. His interests led him to Wilusa, where he became involved in one of the city’s unique industries, Samothracing. He started on the accounting side of the racing business and soon broke out into the part of the business that generates the revenue, sponsorship sales.
His career led him to Trireme Racing Group where he served as the Vice President of Business Operations. He led the turn-around of this team and company solidifying major sponsorships with companies like Corinthian Leather, Medusa-Gorgon Oars, and Posidon Libations. He served in that position from 1996 through 2001. During that period of time, Hector also served on the CURRAGH Franchise Board (rules making board of the sanctioning body). His reputation and success led him to the top marketing position, Vice President of Sales and Marketing. Hector served in that capacity from December of 2001 through July of 2003, at which time he left the company to pursue his current business, Troy Enterprises, Inc.
Hector’s expertise in the entrepreneurial business of oarsports will be invaluable in his new venture. He has a keen sense of finance, marketing, management of inventory, accounting and bookkeeping practices, and staff management. This experience will be invaluable in leading Troy Enterprises and making sound business decisions in the future.
Hector’s resume, as Confidential and Proprietary information, has been omitted from this sample business plan.
2.4 Company Locations and Facilities
When Hisarlik Hardware began this project the key component was the location. Hector Priamson/Troy Enterprises and Building Blocks felt several criteria were crucial to making this venture a success. The ideal size was determined to be between 7,500 and 10,000 sq.ft. The price per square foot was important because the economics obviously had to work. Adequate parking and easy access were must-have criteria while searching for locations. A location with only street parking was not considered an alternative. Being located on a major thoroughfare with visibility is important to get the store recognized as a solution for hardware. Adequate signage that traffic can recognize is key. Additionally, intangibles such as other commercial neighbors and the neighborhood makeup were considered.
Based on these criteria, a site at 310 East Anglia Street is was selected. It is part of the Troas Marketplace.
This property shares a parking lot with Scamander’s Food Market and Buckbasket Cleaners which is the most important of the intangible factors. This Scamander’s generates $12.0 million in revenue and is Scamander’s most successful store in Wilusa. Scamander’s is the only grocery store in the downtown area, and is an icon in the downtown residential community. In discussions with Scamander’s, they said the Troas store has much more traffic than their other locations. They have found the average customer visits the Troas store every two days versus once a week for the others. Hisarlik feels this is a huge advantage for its venture as this will drive more traffic, more often to the Troas parking lot. Scamander’s is in the middle of its lease for this property and seems pleased with the results. Hisarlik does not anticipate this advantage changing by a move by Scamander’s, whose lease extends through the year five.
The proposed site has plenty of parking spots and excellent access from eastbound Anglia Street and northbound Mercia Blvd.
Signage marquees sit on both streets as well as on the north, west, and south sides of 310 East Anglia Street. Furthermore, the location is perfectly set on eastbound Anglia Street, which is one of the major thoroughfares. There is a driveway entrance and exit to Anglia Street.
The proposed site is ideal in size measuring 9,509 sq. ft. and was formerly an Osco Drug store that was closed as Osco downsized their Wilusa operations. According to the landlord, the closing of this location by Osco had nothing to do with the location, but rather, a change in priority within the company. The property needs very little in tenant improvements in order to be open for business. The terms of the lease are currently being negotiated. It is anticipated that Hisarlik Hardware will retain the property within the budgeted guidelines. There were many properties that were investigated; however, for the stated reasons this is the best option as of last November.
The neighborhood has gone through major renovation over the past 10 years. It is now a rejuvenated upscale neighborhood. There is also major new development around the proposed site. There is a brand new condominium development directly across East Anglia Street. The development is called Lemnos Square.
There are three other new condominium developments under construction that are one block away. They are Troas Terrace, The Anatolia, and The Konya.
The proposed location is one block from the successful Wessex Avenue District. Wilusa has done a fantastic job in bringing in new business and culture into this area of downtown.
According to Wilusa Downtown Inc., Downtown has seen record demand and occupancy levels, driving the surge of residential development. This has led to more than 615 new residential units currently in the pipeline.
The city of Wilusa is also reviewing plans for the former Cressida Agora site. The plans all include a large number of residential and retail sites on the 29 acre site. This site is located 2 blocks south of the proposed location.
Development downtown is happening in many different ways. There is commercial, residential, as well as government development currently in process or planned. All of these things add to the desirable nature of the proposed site. We would be “right in the middle of it.”
Products and Services
Hisarlik Hardware will offer traditional retail hardware. These products include electrical supplies, automotive, hardware, housewares, lawn and garden, building supplies, paint, plumbing, tools and rental. There are other small services that will be offered including key cutting, glass cutting, and other small repairs.
Hisarlik will work with Building Blocks to develop the right product mix. The initial order of inventory will take into account the fact that this is an urban store and the product mix may contain different items than a suburban store. Hisarlik Hardware will rely on Building Blocks’ expertise, knowledge, and their IAIS inventory management program in developing this initial order.
3.1 Product and Service Description
Hisarlik Hardware will stock traditional retail hardware items. The product mix will be changed slightly from suburban stores. The history of the store will then be used along with IAIS to develop the right product mix that takes advantage of the available square footage and maximizes profits.
Hisarlik Hardware will open a The Tool Room Rentals store within the hardware store. This is a program that will help cash flow as well as increase sales of rental accessories and support items.
Hisarlik will also have key cutting, glass cutting, and other small services like screen repairs.
3.1.1 IAIS
IAIS stands for Inventory Always In Stock. This is a program that was developed by Building Blocks based on feedback from their members. The members were looking for assistance in managing their departments and knowing what is selling and what is not.
This program has the following benefits to members who take part in it:
- ORGANIZE departments with a more consistent merchandise assortment
- REMOVE non-selling inventory
- FREE UP valuable floor space
- INCREASE a store’s overall profits.
Building Blocks delivers to member stores IAIS merchandising guides, assortment guides, and recommends what inventory to carry and what not to carry.
This is an invaluable tool for a new member because the new store can rely on the history of current stores to help in their merchandising.
3.1.2 Retail Pricing System
Hisarlik Hardware will once again rely on Building Blocks to deliver the correct pricing for the market. As discussed earlier, low cost is not one of the main factors for customers to shop at a convenient hardware store location. Hisarlik will continue to work with Building Blocks to charge the right price to maximize profits.
3.2 Future Products and Services
Hisarlik Hardware will listen to its customers to understand what other needs are not being met. Those needs could include additional store locations in the future and an expansion of products and services offered at the current location. There may be other businesses that can be offshoots of retail hardware that help service or provide convenience to Hisarlik customers.
Market Analysis Summary
The Market Analysis looks at potential customers and potential business. Hisarlik Hardware explored the market segments, their needs, and did a marketing analysis.
The need for this venture was looked at first. Does downtown need a hardware store? The answer was a resounding yes.
Once the need was established, Hisarlik needed to analyze the make up of its customers, who and how many. Who is the potential customer? How many potential customers are there?
Once it was determined that there was a need and who the customer is, the next step was to figure out how to make them Hisarlik Hardware customers. How to get the potential customer in the store?
4.1 Market Segmentation
There are six major market segments:
- Downtown Residents: Downtown Residents will make up as much as 40% of the potential business of the store. This is an ever growing and expanding group. Downtown Resident levels are at an all-time high. There are also major projects like the former Cressida Agora site and the Troilus Townhomes in downtown Wilusa that will increase the numbers of residents. Wilusa Downtown, Inc. estimates there are currently 615 new residential units currently in the pipeline. In addition, 91 renovation permits were issued last year on existing downtown residential structures.
- Property Managers: Every residential building and every commercial building downtown has a property manager that keep the properties in good repair. These property managers all need supplies and materials that are conveniently available. These managers will be able to rely on Hisarlik Hardware to stock what they need. Hisarlik feels the store will prove to be a quick, easy, and convenient way to fulfill the needs of these property managers. Hisarlik and Building Blocks both feel paint and paint supplies will be a big percentage of what these property managers will buy. The City of Wilusa estimated there was $18.0 million in paint and wallpaper Retail Sales in 2002 (within a three mile radius of the proposed location).
- Contractors: As stated earlier, there were 91 renovation permits and 615 new residential units under construction in the last year. The new residential units represented $261 million investment in downtown. Hisarlik Hardware will work to become a reliable supplier to these contractors working in the area. We will also open early in the morning to help supply and be a convenient source for the contractors who start work early each day.
- Downtown Business: Every downtown business will need supplies from time to time. The City of Wilusa states there are 2,861 businesses located within one mile of the proposed location. As of the time of opening the focus will be to sell this group traditional retail hardware supplies. As the business is established, Hisarlik will work to develop the Commercial Supply Network for these businesses.
- Suburban Commuters: Since the proposed location is on a major Eastbound thoroughfare (E. Anglia Street) out of the downtown, the potential is encouraging for Suburban Commuters to stop on their lunch hour or on their way home from work. Research tells us that these commuters will be in search of good service and convenient shopping, things they may not find in their suburban neighborhoods.
- Commercial Sales: This could be the largest growth area of business that Hisarlik Hardware will have. As Hisarlik develops a positive reputation, there will be a push to activate the MRO (Building Blocks’ commercial and industrial supply network). Once again with so many businesses located downtown there is an infinite amount of business. There are also a large number of Federal, State and Local government entities located downtown. These is also one major university and several major hospitals within two miles of the proposed location.

| Market Analysis | |||||||
| Year 1 | Year 2 | Year 3 | Year 4 | Year 5 | |||
| Potential Customers | Growth | CAGR | |||||
| Downtown Residents | 0% | 450,000 | 450,000 | 450,000 | 450,000 | 450,000 | 0.00% |
| Property Managers | 0% | 297,000 | 297,000 | 297,000 | 297,000 | 297,000 | 0.00% |
| Contractors | 0% | 255,000 | 255,000 | 255,000 | 255,000 | 255,000 | 0.00% |
| Downtown Businesses | 0% | 180,000 | 180,000 | 180,000 | 180,000 | 180,000 | 0.00% |
| Suburban Commuters | 0% | 110,000 | 110,000 | 110,000 | 110,000 | 110,000 | 0.00% |
| Commercial Sales | 0% | 38,930 | 38,930 | 38,930 | 38,930 | 38,930 | 0.00% |
| Total | 0.00% | 1,330,930 | 1,330,930 | 1,330,930 | 1,330,930 | 1,330,930 | 0.00% |
4.2 Target Market Segment Strategy
Each market segment is unique and requires different marketing to attract them.
- Downtown Residents: The proposed location really takes care of this segment by itself. Because the proposed location shares the parking lot with Scamander’s (the only grocery store downtown) it will act as a magnet to bring people to Hisarlik Hardware. Scamander’s estimates customers visit their store every 2-3 days, which is fantastic for traffic. Based on discussions with Scamander’s they are willing to work with Hisarlik to develop co-op programs to work together to build both businesses. There will also be direct mail programs and circulars to downtown residents to convert old habits as the business is started. There will also be a Building Blocks loyalty program implemented called Building Blocks Rewards. This program not only gives valuable research data, but also helps the store learn buying habits of the regular customers.
- Property Managers: It is expected that this group also has a significant need for downtown hardware and will find the store by word of mouth. Hisarlik will not rely on that. There will be a sales program to set up accounts with property managers and let them know about great service that is available. A list will be developed to pursue and court in order to build this business. Keeping in mind this group is in search of convenience and ease of shopping, having a delivery option will also be important to this group.
- Contractors: Hisarlik Hardware will have to go out and pursue this group. Hisarlik will have to visit job sites and let contractors know that Hisarlik is an option and the most viable option available. Delivery and hours of operation will be very important to this group.
- Downtown Businesses: There will be a direct mail program set up to make these businesses aware of the store and that it is an option for their hardware needs. The key to this group is awareness. They will also be looking for an easy and convenient way to get hardware items.
- Suburban Commuters: The direct mail program to offer hardware convenience to businesses will also create awareness with the suburban commuters. However, it is thought that the biggest attraction will be the outdoor signage. There will be signs on E. Anglia St. and Mercia Blvd. Both streets are high traffic areas and should create a good deal of awareness. Awnings are also thought to be an option on the Anglia St. side of the building. The color will not only be a change to what traffic is used to seeing but also exposure for the business.
- Commercial Sales: This segment is going to come down to hard work. It will require a dedicated sales person calling on potential customers and developing relationships with Commercial customers to turn this segment into a strong revenue stream.
4.2.1 Market Needs
Downtown residents have already expressed the need for a local hardware store, as is documented in the April 2003 issue of Wilusa Magazine. Residents recognize the need and will be supportive of a retailer answering their concerns. The data that has been supplied to Hisarlik Hardware (by Yorikle, a market research firm used by Building Blocks ) shows there is a population of nearly 53,000 people and more than 20,000 households within two miles of the proposed location. The analysis provided by Yorikle states the area could support a 19,000 sq. ft. store. We are proposing a 9,500 sq. ft. store. In other words, there is enough business in this area to support a store twice the proposed size. The report has also found there is more than $2.5 million of potential sales revenue, based on the number of households alone (not including any of the other segments). The potential is expected to grow to more than $3.0 million by 2007.
Hisarlik Hardware believes the key to the need analysis is that all of the research and potential was measured by households, and households only. The households only make up one segment of the potential business the store expects to generate.
4.2.2 Market Trends
When Hector Priamson initially looked at the hardware business, one of the most important factors was the fact this industry seems to be immune to significant fluctuations in the economy. Based on information from the US Department of Commerce, the home improvement retailing industry has consistently grown at a rate of 7% for the past decade and similar growth is expected for the foreseeable future.
In the 1990’s the growth in the industry was attributable to strong home sales, economic prosperity, and significant amounts of home renovation. Since 2000, growth has stayed at the same levels even though some of these factors have changed. Growth since the year 2000 was attributable to low interest rates and refinancing. According to the Federal Reserve Board, 35% of all refinancing goes to home improvement.
What does the future hold? 93% of all Americans plan to stay in their current homes and 78% of homeowners plan to undertake home improvement projects in the next year. How much will they spend? 69% of homeowners plan to spend as much or more in the coming year than they did last year. Home improvement budgets have grown 31% since the year 2000.
4.3 Service Business Analysis
Hisarlik Hardware is being encouraged by Building Blocks to enter the equipment and party rental business upon opening the store. Based on conversations with other members, the rental component has been an overwhelming success adding to cash flow of the business as well as increasing traffic to the store. Reports of success unanimously talk about the fact that “renters” need tools and accessories to go with the rental equipment adding to the overall profitability of the store.
In the downtown market, the make-up of the rental inventory will vary a bit from what a suburban store might have. Hisarlik Hardware will work with the Building Blocks Rental people to determine the inventory. Hisarlik will rely on the knowledge and expertise of Building Blocks.
An investmentm is required upon opening for the initial purchase of the equipment to rent. Building Blocks has the necessary training and computer support to make this a very logical addition to the traditional hardware store.
4.3.1 Competition and Buying Patterns
The “Big Boxes”, such as Lowe’s, Menard’s, and Home Depot have had a significant effect on the Home Improvement industry. According to the National Retail Hardware Association, based in Wilusa, the Big Boxes have expanded the market, increasing consumer participation in home improvement. However, the National Retail Hardware Association feels that the Big Boxes are nearing a saturation point, and in the future, they cannot open many more stores without it affecting and threatening other current Big Box locations.
“This competition has not kept independent hardware stores, home centers, and lumberyards from prospering. These stores are much more professionally operated than they were just a decade ago, and most posted strong profits last year.”
—NRHA, 2004 Market Measure
Independent Hardware stores need to focus on their strengths.
Service. 88% of consumers have a favorable opinion of small business vs. 61% for big business (the lowest since 1993).
Convenience. Consumers want to get everything they need in one trip to the store. The Independent hardware stores are able to do this, because they work with their customers.
“There are four ways to compete
- Assortment & Variety
- Service & Experience
- Convenience
- Price
But price is only one of them.”
—M. Chandler, a retail industry consultant
4.3.2 Main Competitors
Hardware
There is no immediate local competition. The nearest hardware store is 1.8 miles away on South Hasan Dag Avenue. The store is a small, 4,000 sq. ft., and isn’t current in its products or presentation.
Because of the lack of product and poor shopping presentation, residents do not consider this an option for hardware. The next closest hardware store is 2.7 miles away. There are several stores that are 3 to 4 miles from the proposed site. Studies say customers do not want to travel more than 3-7 minutes to a location. While these stores could serve the need, their location does not make them a viable option to downtown residents because of distance and neighborhoods.
The “Big Box” stores such as Lowe’s, Home Depot, and Menard’s are built to serve suburban Wilusa. The closest Lowe’s is 12.5 miles and 17 minutes west of Hisarlik Hardware’s proposed location. The nearest Home Depot is 10.5 miles or 16 minutes west of Hisarlik. Menard’s is 9.3 miles and 14 minutes east of the location. There are no stores that are convenient to the downtown market. To get to any of these, customers must plan on spending 30-40 minutes of driving roundtrip at a minimum before even walking into the store. Hisarlik Hardware will be a 2-3 mile drive or 5-10 minutes maximum travel to the store. This convenience will be a major selling point for the business.
From discussions between Hisarlik Hardware and the parent company of Building Blocks, regarding the possibility of a “Big Box” store opening in the downtown area, it seems unlikely due to the size of the potential market, cost, and lack of real estate, to build such a structure in Arazawa Township.
Rentals
An analysis of competitors in the equipment and party rental field is similar to that of the hardware industry. There is one competitor that is southeast of downtown, 1.5 miles from the proposed location. The company, Best Rentals, Inc., handles equipment and party rentals.
Tent rental has one competitor that is downtown. An factor in tent rental may be the clean new equipment and, once again, great service available from Hisarlik. American Tent and Awning is located 1.8 miles from the proposed location. One advantage for Hisarlik in tent/party rental is that a customer can cover more bases with the variety of equipment and supplies from a rental and hardware store versus a company that focuses solely on tent rental.
The closest tool rental company is 2.3 miles from the proposed location. Hisarlik Hardware feels that significant progress can be made into the tool rental business because of convenience. Hisarlik expects to be a fantastic solution for contractors working downtown who need equipment for the day or for the project. Residents downtown have smaller homes and condominiums, consequently they do not have room to own bulky or large quantities of equipment. This is expected to be a benefit for the rental business.
Strategy and Implementation Summary
Emphasize Customer Service
Hisarlik Hardware will build a reputation of fantastic customer service, building upon what Building Blocks stores and the Building Blocks brand have already established. We will establish our business, by offering a clear cut leader in retail hardware in downtown Wilusa.
Build a Relationship-Oriented Business
Fantastic service will lead to long term loyal relationships with our customers and clients. The goal is to have our customer base become reliant on Hisarlik to stock items and have solutions for their needs. The customers will soon understand the value of the relationship.
Focus on Target Markets
Hisarlik will focus on the market segments identified earlier in this document. Each of the market segments will have sales initiatives to focus on each group.
Differentiate and Fulfill the Promise
Hisarlik Hardware can’t just market and sell products and services, we must actually deliver as well. We need to make sure we have the knowledge-intensive business and service-intensive business we claim to have. This service has to be consistent and deliver what the customer is looking for.
5.1 Marketing Strategy
The Building Blocks Power Events are advertising programs supported by national advertising during peak buying periods for planned home care products. Power Events focus on those high traffic times of the year with a multimedia campaign. A strong mix of national television and radio advertising, circulars, Sunday supplements, and POP sign kits deliver a sense of urgency to visit the store. A small 8-page and large 12-page circular are available for each Power Event to help carry the theme and promote the sale. There are four Power Events each year.
Hisarlik Hardware will also place ads in the Yellow Pages. The Yellow Pages continue to be a source of a good number of customers.
Hisarlik Hardware will also rely on the media to help spread the word about this new business downtown. Fox Television’s local morning TV show goes on location to promote local businesses. Radio can be used in many different ways, radio remotes for the opening of the store. Wilusa Magazine has already identified an issue, a follow up story is very appropriate. The Wilusa Star covers new and significant businesses in Wilusa, Hisarlik feels this store will fit that description.
5.1.1 Potential Customers
Every person is a potential customer of a hardware store. Hisarlik Hardware will carry items everyone needs. The average household spends $135 per year on items found in a hardware store according to Yorikle, a research firm retained by Building Blocks. The key to getting the potential customer to spend their $135 or more in Hisarlik Hardware are include the following attributes:
- convenience
- service
- reliability
- knowledgeable
- progressive
- exceed customer expectations
All of these attributes will be present in Hisarlik Hardware. In order to be convenient, Hisarlik will have to adapt to its environment, the location will be key to making it easy for customers to get to the store. The store must also be open when the customers arrive. In addition, a delivery service will be available to make it easier for regular customers to not have to leave what they are doing to get the products they need. There will also be accounts set up to make it easier for regular customers to get items, without having to deal with petty cash, company credit cards, or company checks for each visit to the store.
Customers expect to get great service at Building Blocks Hardware stores, which is evidenced by the fact 50% of all hardware shoppers will avoid the “Big Box” retailers and opt instead for the personal service like Hisarlik Hardware. We will also need to be reliable, which means that customers will depend on us to inventory what they need and understand and anticipate their needs. Customers want to come into a hardware store having the confidence they will find what they need. The store will possess a knowledgeable and friendly staff. The staff has to understand and interpret what the customer needs and find the product that will fit that need. Hisarlik Hardware will also be progressive, by that we mean we will continue to evolve and understand what the customer needs and develop new markets where the need exists.
5.2 Sales Strategy
Hisarlik Hardware will be offering a convenient solution which all downtown residents need. Customers will be introduced to Hisarlik through targeted advertising, direct mail, signage, and word of mouth. Hisarlik will also take advantage of all the Building Blocks programs that help create loyalty and awareness among the potential customers in the market.
The direct sales force will consist of two seasoned sales people led by Hector Priamson. The focus will be on property managers and all downtown businesses to create an awareness of the store location and the fact that the store is a potential solution for retail hardware needs.
Glaucus Sarpedon will also work on the commercial accounts and government accounts located in the downtown market.
5.2.1 Sales Forecast
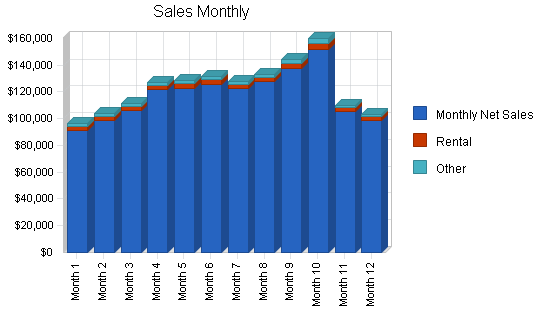
The sales projections start in the month of March, 2004. Sales steadily increase along with the awareness of the store through September. In September, there is a small dip in sales then a steady rise through the Christmas season and December the stores best month of the year. There is a traditional slow season that runs through January and February each year. The goal of Hisarlik Hardware will be to develop programs that take as much slack out of the sales as possible and get them in line with the rest of the sales year.
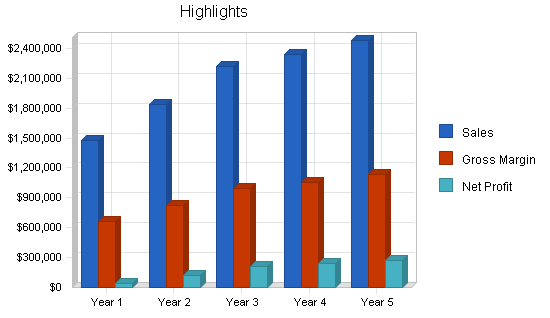
Sales are estimated by Building Blocks to be $125 to $175 per square foot of the total area of the store. The Gross Margin will range from 40% to 45%. There is a 25% growth predicted for the second year of sales driven by awareness, growth in rentals and growth in commercial sales.
The immediate goal is to achieve robust sales in the first year. It is thought that double digit percentage total sales increases can be achieved and maintained throughout the five years of this business plan.
| Sales Forecast | |||||
| Year 1 | Year 2 | Year 3 | Year 4 | Year 5 | |
| Sales | |||||
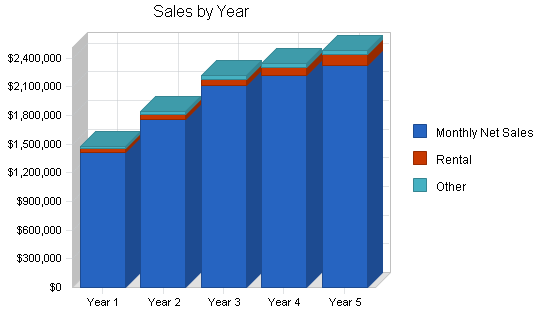
| Monthly Net Sales | $1,410,502 | $1,757,402 | $2,108,883 | $2,214,327 | $2,325,043 |
| Rental | $38,930 | $50,609 | $65,792 | $85,529 | $111,188 |
| Other | $27,471 | $32,965 | $39,558 | $43,514 | $47,865 |
| Total Sales | $1,476,903 | $1,840,977 | $2,214,233 | $2,343,370 | $2,484,097 |
| Direct Cost of Sales | Year 1 | Year 2 | Year 3 | Year 4 | Year 5 |
| Cost of Goods Sold | $818,091 | $1,019,293 | $1,223,152 | $1,284,310 | $1,348,525 |
| Other | $0 | $0 | $0 | $0 | $0 |
| Subtotal Direct Cost of Sales | $818,091 | $1,019,293 | $1,223,152 | $1,284,310 | $1,348,525 |
5.2.2 Sales Programs
Building Blocks has loyalty programs like Building Blocks Rewards that Hisarlik Hardware will participate in. This program has been developed to build a loyal following of customers that use the card for shopping benefits.
By the second year accounts will be set up for businesses, property managers, and contractors to make shopping easy for them. This program will allow these customers to shop and make it easy for them to pay for items on account. This program will have to be managed very carefully, and Hector Priamson’s financial background will prove to be very useful in managing these accounts.
5.3 Strategic Alliances
Hisarlik Hardware has already contacted Scamander’s Food Market and have the word of the General Store Manager that they would be interested in developing programs to work together with Hisarlik for the betterment of both businesses. Both will stand to benefit from each other.
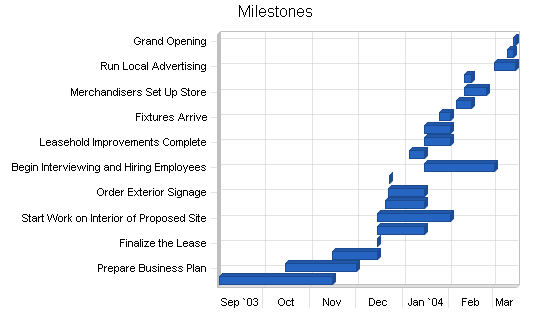
5.4 Milestones
Hisarlik True Value has worked with True Value to establish a realistic time line to work within to have the store open for business in March of 2004. The time line is listed in the Milestones table below.
| Milestones | |||||
| Milestone | Start Date | End Date | Budget | Manager | Department |
| Research Feasibility | 9/1/2003 | 11/15/2003 | $0 | Hector Priamson | Department |
| Prepare Business Plan | 10/15/2003 | 12/1/2003 | $500 | Hector Priamson | Department |
| Secure Financing | 11/15/2003 | 12/15/2003 | $0 | Hector Priamson | Department |
| Finalize the Lease | 12/15/2003 | 12/15/2003 | $0 | Hector Priamson | Department |
| Sign Building Blocks Member Agreement | 12/15/2003 | 1/15/2004 | $6,000 | Hector Priamson | Department |
| Start Work on Interior of Proposed Site | 12/15/2003 | 2/1/2004 | $4,000 | Hector Priamson | Department |
| Review Fixture Layout Plan | 12/20/2003 | 1/15/2004 | $0 | Hector Priamson | Department |
| Order Exterior Signage | 12/22/2003 | 1/15/2004 | $25,000 | Hector Priamson | Department |
| Order Fixtures | 12/23/2003 | 12/23/2003 | $50,000 | Hector Priamson | Department |
| Begin Interviewing and Hiring Employees | 1/15/2004 | 3/1/2004 | $0 | Hector Priamson | Department |
| Initial Merchandise Order is Placed | 1/5/2004 | 1/15/2004 | $0 | Hector Priamson | Department |
| Leasehold Improvements Complete | 1/15/2004 | 2/1/2004 | $0 | Hector Priamson | Department |
| Order Interior Signage | 1/15/2004 | 2/1/2004 | $7,500 | Hector Priamson | Department |
| Fixtures Arrive | 1/25/2004 | 2/1/2004 | $0 | Hector Priamson | Department |
| Merchandise Arrives | 2/5/2004 | 2/15/2004 | $0 | Hector Priamson | Department |
| Merchandisers Set Up Store | 2/10/2004 | 2/25/2004 | $0 | Hector Priamson | Department |
| Exterior Signage Installed | 2/10/2004 | 2/15/2004 | $0 | Hector Priamson | Department |
| Run Local Advertising | 3/1/2004 | 3/15/2004 | $0 | Hector Priamson | Department |
| Open Informally | 3/10/2004 | 3/14/2004 | $0 | Hector Priamson | Department |
| Grand Opening | 3/14/2004 | 3/15/2004 | $0 | Hector Priamson | Department |
| Totals | $93,000 | ||||
5.5 Competitive Edge
The competitive edge has been covered throughout this document. Location is the biggest key to this business. There are no true competitors in our business in downtown Wilusa. Our future customers have had to work harder to get the same or lesser service less conveniently. We will be in their back yard and be easy to work with and have products they need.
Hisarlik Hardware have staff that understand customer service and how to treat customers so that they want to shop in the Hisarlik Hardware environment.
Web Plan Summary
Obviously, we are in the age of computers and the Internet. Customers are ultimately looking for the simplest, most reliable, and least consuming way to get the goods and services they need.
Therefore, a Web strategy is important to keep up with the changing world and stay ahead of potential competition. Customers that buy on the Internet do not care where a business is located, so it is important that a name and a reputation be established that customers can rely on whether it is in the store or on the Internet.
6.1 Website Marketing Strategy
Building Blocks has a sensational program for their members. It allows a member to establish their own website with member information and use the established product background linked to buildingblockshardware.com. Customers can then go on line and order products very easily. This is a program that a normal small business could not afford to invest in.
The Internet is also a valuable communication tool with customers. The site includes a custom home page, store location along with a map, store hours, services and selection, in-store coupons, 1,000 item in-store catalog, and as many custom pages as a member needs.
Management Summary
Hisarlik Hardware will be managed by Hector Priamson on a day-to-day basis. He will devote 100% of his time to this venture. There are two key employees joining Hector in this venture, Penthesilea Thracian and Glaucus Sarpedon.
Hisarlik expects that there will be up to 17 employees in total, some full time and others part time.
7.1 Organizational Structure
Hisarlik Hardware will be managed, organized, and run by Hector Priamson. The company will have three key employees, Hector, Penthesilea (Penthe) Thracian, and Glaucus (Glus) Sarpedon. These three all know each other very well, Penthe and Glus having worked for Hector in the past in the oarsports industry. They bring a unique set of skills to this venture which will prove invaluable in the future.
The company will be organized with Hector Priamson as its president. He will be responsible for all of the financial affairs, inventory management, cash management, manage the cashier staff, advertising, marketing, as well as the day-to-day contact with Building Blocks. Hector will also have relationships with attorneys and accountants to stay on top of all business matters. Additionally, he will also manage the day-to-day operation of the rental business. While this seems like a lot, these are routine tasks Hector has performed for many different companies for many years. As good as Hector is, he can’t do it all. He will rely on two former employees from his.
Penthesilea Thracian has been in the oarsports business for the better part of 30 years. She is looking for a change and Hisarlik Hardware is just what she had in mind. Penthe has managed teams, and developed and run programs from the ground up. Her experience led her to winning the 1981 Salamis 500 as the crew chief of Al Cibiades’ trireme at Dardanelles Racing. Working with large companies and manufacturers that wanted absolute accountability in their programs, Penthe was the gal that was brought in to handle it. Over the past 5 years, she has added another unique skill that will nicely complement her mechanical skills; hospitality. Penthe managed the hospitality program for Corinth Racing. That job really entailed looking after people and providing great service, a skill that will be invaluable for Hisarlik Hardware.
Glaucus Sarpedon is an extremely driven young man who graduated from Hattusili University. Glus decided he wanted to work in oarsports. When he put his mind to it, that is exactly where he ended up. He joined Dardanelles Racing where he worked in the hospitality area, also gaining the valuable service quality that will be necessary for this new role. He also had the responsibility of moving, setting up, and servicing the complete hospitality fleet. He has mechanical skills that he will bring with him as well. Glus also filled the role of Team Coordinator, this role is the “quarterback” of the organization. He was responsible for anticipating what the team was going to need, when they would need it, and how much they would need. Glus will be a huge asset to the company.
Each of these folks have departments that will be assigned to them and a staff that will help them manage the departments. They will be responsible for hiring the staff that will report directly to them. Hisarlik Hardware will also develop an incentive plan rewarding successful departments and department sales growth. The experience and trust Hector Priamson has in these two individuals will allow him to focus on managing the business.
7.2 Management Team Gaps
A review of potential gaps in the experience or know-how of this venture does not show any glaring weaknesses. Hisarlik Hardware‘s Achilles heel is the lack of actual hardware store business experience. While the three key individuals do not have that direct experience, they will draw heavily upon the instruction, training, and specialist support available from the Building Blocks co-op organization. Building Blocks is in the business of passing on their experience and knowledge to assist their members to be be successful.
7.3 Personnel Plan
The personnel plan was developed in conjunction with Building Blocks and some consulting with the folks at Konya Building Blocks Hardware in Catalhoyuk.
The plan was developed so there are at least 2 managers, 1 cashier, and 2 specialists on duty at all times. The average number of people working at any one time is between 5.5 and 7.1 on busy Saturdays. All employees will have the ability and knowledge to run the cash registers.
Hector Priamson, Penthesilea Thracian and Glaucus Sarpedon will start with base pay as laid out in the following table. The cashiers will be paid $7-$8 per hour. Full-time specialist staff will be paid between $9 and $10 per hour. Other part-time help will be paid $6 per hour.
It is felt there is a pool of retired “handy men” that can fill many of these roles. The $6 per hour employees are thought to be high school or college kids.
Employee hiring will start in January, training will begin in February and work in March.
| Personnel Plan | |||||
| Year 1 | Year 2 | Year 3 | Year 4 | Year 5 | |
| President (Hector Priamson) | $55,000 | $60,000 | $65,000 | $70,000 | $75,000 |
| General Manager (Penthesilea Thracian) | $40,000 | $45,000 | $50,000 | $55,000 | $55,000 |
| Asst. Gen. Manager (Glaucus Serpadon) | $35,000 | $40,000 | $45,000 | $45,000 | $45,000 |
| Cashiers | $27,876 | $28,852 | $29,861 | $30,907 | $31,988 |
| Specialists | $90,348 | $99,383 | $109,321 | $113,147 | $117,107 |
| Other | $0 | $0 | $0 | $0 | $0 |
| Total People | 17 | 20 | 20 | 21 | 21 |
| Total Payroll | $248,224 | $273,234 | $299,183 | $314,054 | $324,096 |
Financial Plan
The business will need substantial start-up capital. It is expected that a good portion of that amount will be secured through SBA financing.
Sales are expected to start conservatively the first year and increase steadily through the fifth year of operations. Operating income will pay back the start-up loan over a seven year amortization.
Inventory Turnover ratios are predicted to be in excess of 4.3. The goal will be to get this ratio to exceed 5.0. To do that Hisarlik will be required to purchase smartly and drive sales.
Cash will be retained in the business to cover cash operating needs as well as future expansion of other Hisarlik Hardware locations.
It is expected that dividends will be paid to the investors annually. The amount of the dividends is estimated to be 50% of profits.
After the first year of operations, it is expected that Hector Priamson will be able to trim expenses in the business as efficiency, experience, and knowledge work together and help the business operate better. Estimates are extremely conservative in the budgeting process.
8.1 Start-up Funding
Owner
Hector Priamson will invest cash, benefits and labor to the start up.
Investors
Troy Enterprises is in the process of negotiating with potential investors for the seed cash needed to start the business. It is expected that a tidy sum will be raised to start the business. It is expected that no more than 15% interest will be given to each investor.
Bank Financing
Troy Enterprises is submitting business plans and other requested documents to financial institutions in pursuit of the additional money needed to finance the rest of the company and provide operating cash for the business. It is expected that the loan will be a part of the SBA 7(a) program. It is assumed that the terms of the loan will require repayment in 7 years, at a rate of 8%.
| Start-up Funding | |
| Start-up Expenses to Fund | $83,332 |
| Start-up Assets to Fund | $716,668 |
| Total Funding Required | $800,000 |
| Assets | |
| Non-cash Assets from Start-up | $620,504 |
| Cash Requirements from Start-up | $96,164 |
| Additional Cash Raised | $0 |
| Cash Balance on Starting Date | $96,164 |
| Total Assets | $716,668 |
| Liabilities and Capital | |
| Liabilities | |
| Current Borrowing | $0 |
| Long-term Liabilities | $625,000 |
| Accounts Payable (Outstanding Bills) | $0 |
| Other Current Liabilities (interest-free) | $0 |
| Total Liabilities | $625,000 |
| Capital | |
| Planned Investment | |
| Hector Priamson | $50,000 |
| Investor 1 | $75,000 |
| Investor 2 | $50,000 |
| Additional Investment Requirement | $0 |
| Total Planned Investment | $175,000 |
| Loss at Start-up (Start-up Expenses) | ($83,332) |
| Total Capital | $91,668 |
| Total Capital and Liabilities | $716,668 |
| Total Funding | $800,000 |
8.2 Important Assumptions
The table below presents the assumptions used in the financial calculations of this business plan.
| General Assumptions | |||||
| Year 1 | Year 2 | Year 3 | Year 4 | Year 5 | |
| Plan Month | 1 | 2 | 3 | 4 | 5 |
| Current Interest Rate | 8.00% | 8.00% | 8.00% | 8.00% | 8.00% |
| Long-term Interest Rate | 8.00% | 8.00% | 8.00% | 8.00% | 8.00% |
| Tax Rate | 30.00% | 30.00% | 30.00% | 30.00% | 30.00% |
| Other | 0 | 0 | 0 | 0 | 0 |
8.3 Key Financial Indicators
As shown in the Benchmarks chart below, our key financial indicators are:
- Projected Sales: Projections are based on estimates calculated by Building Blocks based on demographics and potential in the market place. Sales will consistently increase as the store gains experience, in addition to the consistent growth expected in the home improvement category nationwide.
- Gross Margins: Building Blocks expects that the Gross Margin can increase in years 2-5, however for this analysis, the gross margin was kept consistent at 42% on inventory sales. Overall, the rental and other income have driven the gross margin up by 2 points. Building Blocks expects that Gross Margin on inventory could rise as high as 44%.
- Operating Expenses: Operating expenses growth is primarily caused by an increase in salaries as the business gets established, as well as a small percentage increase for COL over the next five years. Operating expenses are expected to increase at a rate of 6-8% per year.
- Inventory Turnover: Hisarlik Hardware will maintain just-in-time inventory levels. Building Blocks distribution will help maintain those levels. Inventory is projected to turn 4.3 times per year. The goal is to get inventory turns to exceed 5.0, through good purchasing decisions.

8.4 Break-even Analysis
The Break-even Analysis has determined approximate break-even sales as shown below. There will be a constant monitor on this number in an attempt to lower it. Once again, it is believed that efficiencies, experience, and knowledge will help in decreasing the break-even number.
Sales are expected to be well in excess of this number for each month.

| Break-even Analysis | |
| Monthly Revenue Break-even | $102,932 |
| Assumptions: | |
| Average Percent Variable Cost | 55% |
| Estimated Monthly Fixed Cost | $45,915 |
8.5 Projected Profit and Loss
The Profit and Loss statement makes it very clear which areas will need attention. Payroll is by far the largest expense the company incurs (besides cost of goods sold). Staff will need to be managed and hours regulated so that hours worked correlate to sales. Emphasis will be placed on minimizing expenses that do not help generate bottom line.
The company generates a profit as sales revenue gets above the break-even line. A push on sales will be very important in generating bottom line profits. Interest expense is also a large line item that diminishes over time, but is a necessary expense on the front end of the business.


| Pro Forma Profit and Loss | |||||
| Year 1 | Year 2 | Year 3 | Year 4 | Year 5 | |
| Sales | $1,476,903 | $1,840,977 | $2,214,233 | $2,343,370 | $2,484,097 |
| Direct Cost of Sales | $818,091 | $1,019,293 | $1,223,152 | $1,284,310 | $1,348,525 |
| Other Costs of Goods | $0 | $0 | $0 | $0 | $0 |
| Total Cost of Sales | $818,091 | $1,019,293 | $1,223,152 | $1,284,310 | $1,348,525 |
| Gross Margin | $658,812 | $821,683 | $991,081 | $1,059,061 | $1,135,572 |
| Gross Margin % | 44.61% | 44.63% | 44.76% | 45.19% | 45.71% |
| Expenses | |||||
| Payroll | $248,224 | $273,234 | $299,183 | $314,054 | $324,096 |
| Account Name | $0 | $0 | $0 | $0 | $0 |
| Depreciation | $48,021 | $48,021 | $48,021 | $48,021 | $48,021 |
| Advertising Expense-Circulars | $15,136 | $18,867 | $22,693 | $24,016 | $25,458 |
| Advertising Expense-Newspapers | $3,397 | $4,234 | $5,093 | $5,390 | $5,713 |
| Advertising Expense-Yellow Pages | $2,604 | $2,604 | $2,604 | $2,604 | $2,604 |
| Advertising Expense-National | $7,680 | $9,573 | $11,514 | $12,186 | $12,917 |
| Lease | $114,638 | $125,424 | $134,933 | $144,442 | $153,951 |
| Utilities | $9,000 | $9,250 | $9,500 | $9,750 | $10,000 |
| Telephone | $4,431 | $5,523 | $6,643 | $7,030 | $7,452 |
| Accounting and Legal | $6,384 | $7,661 | $9,193 | $11,032 | $13,238 |
| Store and Office Supplies | $14,769 | $18,410 | $18,821 | $19,919 | $21,115 |
| Insurance | $10,032 | $10,338 | $10,648 | $10,967 | $11,296 |
| Delivery Vehicle Expense | $6,000 | $6,000 | $6,000 | $6,000 | $6,000 |
| Payroll Taxes | $22,321 | $24,591 | $26,926 | $28,265 | $29,169 |
| Employee Benefits | $16,428 | $18,071 | $19,426 | $20,883 | $22,449 |
| State Property Tax Expense | $2,500 | $2,500 | $2,500 | $2,500 | $2,500 |
| Travel | $2,871 | $3,000 | $3,200 | $3,500 | $4,000 |
| Other | $16,548 | $17,052 | $18,600 | $20,400 | $21,600 |
| Total Operating Expenses | $550,984 | $604,353 | $655,497 | $690,957 | $721,579 |
| Profit Before Interest and Taxes | $107,828 | $217,330 | $335,584 | $368,104 | $413,992 |
| EBITDA | $155,849 | $265,351 | $383,605 | $416,125 | $462,013 |
| Interest Expense | $47,148 | $41,783 | $35,771 | $29,260 | $22,208 |
| Taxes Incurred | $18,204 | $52,664 | $89,944 | $101,653 | $117,535 |
| Other Income | |||||
| Interest Income | $0 | $0 | $0 | $0 | $0 |
| Other Income Account Name | $0 | $0 | $0 | $0 | $0 |
| Total Other Income | $0 | $0 | $0 | $0 | $0 |
| Other Expense | |||||
| Account Name | $0 | $0 | $0 | $0 | $0 |
| Other Expense Account Name | $0 | $0 | $0 | $0 | $0 |
| Total Other Expense | $0 | $0 | $0 | $0 | $0 |
| Net Other Income | $0 | $0 | $0 | $0 | $0 |
| Net Profit | $42,476 | $122,883 | $209,869 | $237,191 | $274,249 |
| Net Profit/Sales | 2.88% | 6.67% | 9.48% | 10.12% | 11.04% |
8.6 Projected Cash Flow
The company generates a net positive cash flow in its first year. It is assumed that Accounts Payable will be repaid in 45 days. Repayment of debt is a significant factor in the amount of cash that gets paid out. Long-term debt is on a 7-year amortization.
Dividends are paid in December of each year. The assumption is that 50% of profits are paid out to shareholders and investors.

| Pro Forma Cash Flow | |||||
| Year 1 | Year 2 | Year 3 | Year 4 | Year 5 | |
| Cash Received | |||||
| Cash from Operations | |||||
| Cash Sales | $1,476,903 | $1,840,977 | $2,214,233 | $2,343,370 | $2,484,097 |
| Subtotal Cash from Operations | $1,476,903 | $1,840,977 | $2,214,233 | $2,343,370 | $2,484,097 |
| Additional Cash Received | |||||
| Non Operating (Other) Income | $0 | $0 | $0 | $0 | $0 |
| Sales Tax, VAT, HST/GST Received | $0 | $0 | $0 | $0 | $0 |
| New Current Borrowing | $0 | $0 | $0 | $0 | $0 |
| New Other Liabilities (interest-free) | $0 | $0 | $0 | $0 | $0 |
| New Long-term Liabilities | $0 | $0 | $0 | $0 | $0 |
| Sales of Other Current Assets | $0 | $0 | $0 | $0 | $0 |
| Sales of Long-term Assets | $0 | $0 | $0 | $0 | $0 |
| New Investment Received | $0 | $0 | $0 | $0 | $0 |
| Subtotal Cash Received | $1,476,903 | $1,840,977 | $2,214,233 | $2,343,370 | $2,484,097 |
| Expenditures | Year 1 | Year 2 | Year 3 | Year 4 | Year 5 |
| Expenditures from Operations | |||||
| Cash Spending | $248,224 | $273,234 | $299,183 | $314,054 | $324,096 |
| Bill Payments | $998,841 | $1,351,063 | $1,682,641 | $1,761,830 | $1,851,152 |
| Subtotal Spent on Operations | $1,247,065 | $1,624,298 | $1,981,824 | $2,075,884 | $2,175,248 |
| Additional Cash Spent | |||||
| Non Operating (Other) Expense | $0 | $0 | $0 | $0 | $0 |
| Sales Tax, VAT, HST/GST Paid Out | $0 | $0 | $0 | $0 | $0 |
| Principal Repayment of Current Borrowing | $0 | $0 | $0 | $0 | $0 |
| Other Liabilities Principal Repayment | $0 | $0 | $0 | $0 | $0 |
| Long-term Liabilities Principal Repayment | $66,629 | $72,159 | $78,148 | $84,634 | $91,659 |
| Purchase Other Current Assets | $0 | $0 | $0 | $0 | $0 |
| Purchase Long-term Assets | $0 | $0 | $0 | $0 | $0 |
| Dividends | $21,311 | $61,442 | $104,935 | $118,596 | $137,125 |
| Subtotal Cash Spent | $1,335,005 | $1,757,898 | $2,164,906 | $2,279,113 | $2,404,032 |
| Net Cash Flow | $141,898 | $83,078 | $49,327 | $64,257 | $80,065 |
| Cash Balance | $238,062 | $321,140 | $370,467 | $434,724 | $514,789 |
8.7 Projected Balance Sheet
The balance sheet is very straight forward. No significant purchases of assets are expected or anticipated.
Using Building Blocks’ IAIS, online ordering, and weekly delivery systems allows Hisarlik Hardware to restock inventory in a just-in-time fashion. Inventory levels will be maintained with re-orders tied to Cost of Goods Sold. Additional inventory purchases will be made one month prior to participation in the quarterly Building Blocks nationally advertised Power Event sales. The first Power Event coincides with Hisarlik Hardware’s Grand Opening. Inventory will be allowed to drop somewhat at the end of December, after the Holiday purchasing, and for year-end tax accounting purposes.
There is a possibility of rental purchases in the future if the right products are found to add to the current inventory.
| Pro Forma Balance Sheet | |||||
| Year 1 | Year 2 | Year 3 | Year 4 | Year 5 | |
| Assets | |||||
| Current Assets | |||||
| Cash | $238,062 | $321,140 | $370,467 | $434,724 | $514,789 |
| Inventory | $334,000 | $330,689 | $396,826 | $419,970 | $445,190 |
| Other Current Assets | $30,400 | $30,400 | $30,400 | $30,400 | $30,400 |
| Total Current Assets | $602,462 | $682,229 | $797,693 | $885,094 | $990,379 |
| Long-term Assets | |||||
| Long-term Assets | $246,104 | $246,104 | $246,104 | $246,104 | $246,104 |
| Accumulated Depreciation | $48,021 | $96,042 | $144,063 | $192,084 | $240,105 |
| Total Long-term Assets | $198,083 | $150,062 | $102,041 | $54,020 | $5,999 |
| Total Assets | $800,545 | $832,291 | $899,734 | $939,114 | $996,378 |
| Liabilities and Capital | Year 1 | Year 2 | Year 3 | Year 4 | Year 5 |
| Current Liabilities | |||||
| Accounts Payable | $129,341 | $171,805 | $212,461 | $217,880 | $229,679 |
| Current Borrowing | $0 | $0 | $0 | $0 | $0 |
| Other Current Liabilities | $0 | $0 | $0 | $0 | $0 |
| Subtotal Current Liabilities | $129,341 | $171,805 | $212,461 | $217,880 | $229,679 |
| Long-term Liabilities | $558,371 | $486,212 | $408,064 | $323,430 | $231,771 |
| Total Liabilities | $687,712 | $658,017 | $620,525 | $541,310 | $461,450 |
| Paid-in Capital | $175,000 | $175,000 | $175,000 | $175,000 | $175,000 |
| Retained Earnings | ($104,643) | ($123,609) | ($105,660) | ($14,387) | $85,679 |
| Earnings | $42,476 | $122,883 | $209,869 | $237,191 | $274,249 |
| Total Capital | $112,833 | $174,274 | $279,209 | $397,804 | $534,928 |
| Total Liabilities and Capital | $800,545 | $832,291 | $899,734 | $939,114 | $996,378 |
| Net Worth | $112,833 | $174,274 | $279,209 | $397,804 | $534,928 |
8.8 Business Ratios
The Ratio Analysis looks very encouraging. Industry Profile data is based on Standard Industrial Classification code 5252, Hardware Stores.
- Gross margin: Increases each year and peaks at 45%. It is anticipated that after year two, the gross margin percentage could be increased by as much as 2 points. The Gross Margin is a little high due to the fact that the rental income is included in this calculation with no cost of sales.
- Selling, General and Administrative Expenses: It is encouraging that these expenses as a percentage of sales are decreasing. These expense will continue to be looked at to find new savings to deliver bottom line.
- Quick Ratio: The Quick Ratio is good staying in the 2 range for the entire first 5 years.
- Net Profit margin: Net profit margin continues to grow. The goal will be to minimize expenses and get the Net Profit margin in the 15 range.
- Inventory Turnover: Inventory turnover as calculated here is 2.3 to 3.5 times. The goal will be to get that percentage to exceed 5 times per year. The calculation is skewed on this table because of rental income being included in sales.
| Ratio Analysis | ||||||
| Year 1 | Year 2 | Year 3 | Year 4 | Year 5 | Industry Profile | |
| Sales Growth | 0.00% | 24.65% | 20.27% | 5.83% | 6.01% | 5.13% |
| Percent of Total Assets | ||||||
| Inventory | 41.72% | 39.73% | 44.10% | 44.72% | 44.68% | 47.00% |
| Other Current Assets | 3.80% | 3.65% | 3.38% | 3.24% | 3.05% | 22.34% |
| Total Current Assets | 75.26% | 81.97% | 88.66% | 94.25% | 99.40% | 82.03% |
| Long-term Assets | 24.74% | 18.03% | 11.34% | 5.75% | 0.60% | 17.97% |
| Total Assets | 100.00% | 100.00% | 100.00% | 100.00% | 100.00% | 100.00% |
| Current Liabilities | 16.16% | 20.64% | 23.61% | 23.20% | 23.05% | 31.52% |
| Long-term Liabilities | 69.75% | 58.42% | 45.35% | 34.44% | 23.26% | 21.36% |
| Total Liabilities | 85.91% | 79.06% | 68.97% | 57.64% | 46.31% | 52.88% |
| Net Worth | 14.09% | 20.94% | 31.03% | 42.36% | 53.69% | 47.12% |
| Percent of Sales | ||||||
| Sales | 100.00% | 100.00% | 100.00% | 100.00% | 100.00% | 100.00% |
| Gross Margin | 44.61% | 44.63% | 44.76% | 45.19% | 45.71% | 34.51% |
| Selling, General & Administrative Expenses | 41.72% | 37.96% | 35.28% | 35.07% | 34.67% | 21.03% |
| Advertising Expenses | 1.02% | 1.02% | 1.02% | 1.02% | 1.02% | 1.71% |
| Profit Before Interest and Taxes | 7.30% | 11.81% | 15.16% | 15.71% | 16.67% | 2.01% |
| Main Ratios | ||||||
| Current | 4.66 | 3.97 | 3.75 | 4.06 | 4.31 | 2.22 |
| Quick | 2.08 | 2.05 | 1.89 | 2.13 | 2.37 | 0.67 |
| Total Debt to Total Assets | 85.91% | 79.06% | 68.97% | 57.64% | 46.31% | 56.39% |
| Pre-tax Return on Net Worth | 53.78% | 100.73% | 107.38% | 85.18% | 73.24% | 4.50% |
| Pre-tax Return on Assets | 7.58% | 21.09% | 33.32% | 36.08% | 39.32% | 10.32% |
| Additional Ratios | Year 1 | Year 2 | Year 3 | Year 4 | Year 5 | |
| Net Profit Margin | 2.88% | 6.67% | 9.48% | 10.12% | 11.04% | n.a |
| Return on Equity | 37.64% | 70.51% | 75.17% | 59.63% | 51.27% | n.a |
| Activity Ratios | ||||||
| Inventory Turnover | 2.38 | 3.07 | 3.36 | 3.14 | 3.12 | n.a |
| Accounts Payable Turnover | 8.72 | 8.11 | 8.11 | 8.11 | 8.11 | n.a |
| Payment Days | 40 | 39 | 41 | 44 | 44 | n.a |
| Total Asset Turnover | 1.84 | 2.21 | 2.46 | 2.50 | 2.49 | n.a |
| Debt Ratios | ||||||
| Debt to Net Worth | 6.09 | 3.78 | 2.22 | 1.36 | 0.86 | n.a |
| Current Liab. to Liab. | 0.19 | 0.26 | 0.34 | 0.40 | 0.50 | n.a |
| Liquidity Ratios | ||||||
| Net Working Capital | $473,121 | $510,424 | $585,232 | $667,214 | $760,700 | n.a |
| Interest Coverage | 2.29 | 5.20 | 9.38 | 12.58 | 18.64 | n.a |
| Additional Ratios | ||||||
| Assets to Sales | 0.54 | 0.45 | 0.41 | 0.40 | 0.40 | n.a |
| Current Debt/Total Assets | 16% | 21% | 24% | 23% | 23% | n.a |
| Acid Test | 2.08 | 2.05 | 1.89 | 2.13 | 2.37 | n.a |
| Sales/Net Worth | 13.09 | 10.56 | 7.93 | 5.89 | 4.64 | n.a |
| Dividend Payout | 0.50 | 0.50 | 0.50 | 0.50 | 0.50 | n.a |
8.9 Long-term Plan
The long term plan is to develop a steady retail hardware business in the downtown Wilusa market. As discussed, there is currently no competition. They key will be to establish a solid business to discourage any competition from coming into the market or creating a level of loyalty that will not be fazed by competition.
After two solid years of performance and establishment of Hisarlik Hardware, there are two areas of potential expansion. First, look for opportunities in the current market. What businesses can be combined logically with what has been established that will deliver additional bottom line profit. Secondly, a second location will be developed in a new part of Wilusa. An area that will deliver a similar characteristic to the first store that appears to be headed down the road of success.
Appendix
| Sales Forecast | |||||||||||||
| Month 1 | Month 2 | Month 3 | Month 4 | Month 5 | Month 6 | Month 7 | Month 8 | Month 9 | Month 10 | Month 11 | Month 12 | ||
| Sales | |||||||||||||
| Monthly Net Sales | 0% | $91,241 | $99,041 | $106,241 | $121,759 | $122,972 | $125,793 | $122,579 | $127,490 | $137,524 | $152,076 | $105,152 | $98,634 |
| Rental | 0% | $2,845 | $2,845 | $2,845 | $3,048 | $3,210 | $3,454 | $3,292 | $3,413 | $3,820 | $4,429 | $2,966 | $2,763 |
| Other | 0% | $2,007 | $2,007 | $2,007 | $2,151 | $2,265 | $2,437 | $2,323 | $2,409 | $2,696 | $3,126 | $2,093 | $1,950 |
| Total Sales | $96,093 | $103,893 | $111,093 | $126,958 | $128,447 | $131,684 | $128,194 | $133,312 | $144,040 | $159,631 | $110,211 | $103,347 | |
| Direct Cost of Sales | Month 1 | Month 2 | Month 3 | Month 4 | Month 5 | Month 6 | Month 7 | Month 8 | Month 9 | Month 10 | Month 11 | Month 12 | |
| Cost of Goods Sold | $52,920 | $57,444 | $61,620 | $70,620 | $71,324 | $72,960 | $69,936 | $75,104 | $79,764 | $88,204 | $60,988 | $57,208 | |
| Other | $0 | $0 | $0 | $0 | $0 | $0 | $0 | $0 | $0 | $0 | $0 | $0 | |
| Subtotal Direct Cost of Sales | $52,920 | $57,444 | $61,620 | $70,620 | $71,324 | $72,960 | $69,936 | $75,104 | $79,764 | $88,204 | $60,988 | $57,208 | |
| Personnel Plan | |||||||||||||
| Month 1 | Month 2 | Month 3 | Month 4 | Month 5 | Month 6 | Month 7 | Month 8 | Month 9 | Month 10 | Month 11 | Month 12 | ||
| President (Hector Priamson) | 0% | $4,583 | $4,583 | $4,583 | $4,583 | $4,583 | $4,583 | $4,583 | $4,583 | $4,583 | $4,583 | $4,583 | $4,587 |
| General Manager (Penthesilea Thracian) | 0% | $3,333 | $3,333 | $3,333 | $3,333 | $3,333 | $3,333 | $3,333 | $3,333 | $3,333 | $3,333 | $3,333 | $3,337 |
| Asst. Gen. Manager (Glaucus Serpadon) | 0% | $2,916 | $2,916 | $2,916 | $2,916 | $2,916 | $2,916 | $2,916 | $2,916 | $2,916 | $2,916 | $2,916 | $2,924 |
| Cashiers | 0% | $2,323 | $2,323 | $2,323 | $2,323 | $2,323 | $2,323 | $2,323 | $2,323 | $2,323 | $2,323 | $2,323 | $2,323 |
| Specialists | 0% | $7,529 | $7,529 | $7,529 | $7,529 | $7,529 | $7,529 | $7,529 | $7,529 | $7,529 | $7,529 | $7,529 | $7,529 |
| Other | 0% | $0 | $0 | $0 | $0 | $0 | $0 | $0 | $0 | $0 | $0 | $0 | $0 |
| Total People | 17 | 17 | 17 | 17 | 17 | 17 | 17 | 17 | 17 | 17 | 17 | 17 | |
| Total Payroll | $20,684 | $20,684 | $20,684 | $20,684 | $20,684 | $20,684 | $20,684 | $20,684 | $20,684 | $20,684 | $20,684 | $20,700 | |
| General Assumptions | |||||||||||||
| Month 1 | Month 2 | Month 3 | Month 4 | Month 5 | Month 6 | Month 7 | Month 8 | Month 9 | Month 10 | Month 11 | Month 12 | ||
| Plan Month | 1 | 2 | 3 | 4 | 5 | 6 | 7 | 8 | 9 | 10 | 11 | 12 | |
| Current Interest Rate | 8.00% | 8.00% | 8.00% | 8.00% | 8.00% | 8.00% | 8.00% | 8.00% | 8.00% | 8.00% | 8.00% | 8.00% | |
| Long-term Interest Rate | 8.00% | 8.00% | 8.00% | 8.00% | 8.00% | 8.00% | 8.00% | 8.00% | 8.00% | 8.00% | 8.00% | 8.00% | |
| Tax Rate | 30.00% | 30.00% | 30.00% | 30.00% | 30.00% | 30.00% | 30.00% | 30.00% | 30.00% | 30.00% | 30.00% | 30.00% | |
| Other | 0 | 0 | 0 | 0 | 0 | 0 | 0 | 0 | 0 | 0 | 0 | 0 | |
| Pro Forma Profit and Loss | |||||||||||||
| Month 1 | Month 2 | Month 3 | Month 4 | Month 5 | Month 6 | Month 7 | Month 8 | Month 9 | Month 10 | Month 11 | Month 12 | ||
| Sales | $96,093 | $103,893 | $111,093 | $126,958 | $128,447 | $131,684 | $128,194 | $133,312 | $144,040 | $159,631 | $110,211 | $103,347 | |
| Direct Cost of Sales | $52,920 | $57,444 | $61,620 | $70,620 | $71,324 | $72,960 | $69,936 | $75,104 | $79,764 | $88,204 | $60,988 | $57,208 | |
| Other Costs of Goods | $0 | $0 | $0 | $0 | $0 | $0 | $0 | $0 | $0 | $0 | $0 | $0 | |
| Total Cost of Sales | $52,920 | $57,444 | $61,620 | $70,620 | $71,324 | $72,960 | $69,936 | $75,104 | $79,764 | $88,204 | $60,988 | $57,208 | |
| Gross Margin | $43,173 | $46,449 | $49,473 | $56,338 | $57,123 | $58,724 | $58,258 | $58,208 | $64,276 | $71,427 | $49,223 | $46,139 | |
| Gross Margin % | 44.93% | 44.71% | 44.53% | 44.38% | 44.47% | 44.59% | 45.45% | 43.66% | 44.62% | 44.75% | 44.66% | 44.65% | |
| Expenses | |||||||||||||
| Payroll | $20,684 | $20,684 | $20,684 | $20,684 | $20,684 | $20,684 | $20,684 | $20,684 | $20,684 | $20,684 | $20,684 | $20,700 | |
| Account Name | $0 | $0 | $0 | $0 | $0 | $0 | $0 | $0 | $0 | $0 | $0 | $0 | |
| Depreciation | 4% | $4,002 | $4,002 | $4,002 | $4,002 | $4,002 | $4,002 | $4,002 | $4,002 | $4,002 | $4,002 | $4,002 | $4,002 |
| Advertising Expense-Circulars | 3% | $2,783 | $293 | $293 | $2,783 | $293 | $293 | $1,953 | $293 | $2,783 | $2,783 | $293 | $293 |
| Advertising Expense-Newspapers | 0% | $221 | $239 | $256 | $292 | $295 | $303 | $290 | $311 | $331 | $367 | $253 | $238 |
| Advertising Expense-Yellow Pages | 0% | $217 | $217 | $217 | $217 | $217 | $217 | $217 | $217 | $217 | $217 | $217 | $217 |
| Advertising Expense-National | 1% | $500 | $540 | $578 | $660 | $668 | $685 | $656 | $704 | $749 | $830 | $573 | $537 |
| Lease | 10% | $9,553 | $9,553 | $9,553 | $9,553 | $9,553 | $9,553 | $9,553 | $9,553 | $9,553 | $9,553 | $9,553 | $9,553 |
| Utilities | 1% | $750 | $750 | $750 | $750 | $750 | $750 | $750 | $750 | $750 | $750 | $750 | $750 |
| Telephone | 0% | $288 | $312 | $333 | $381 | $385 | $395 | $379 | $406 | $432 | $479 | $331 | $310 |
| Accounting and Legal | 1% | $532 | $532 | $532 | $532 | $532 | $532 | $532 | $532 | $532 | $532 | $532 | $532 |
| Store and Office Supplies | 1% | $961 | $1,039 | $1,111 | $1,270 | $1,284 | $1,317 | $1,262 | $1,353 | $1,440 | $1,596 | $1,102 | $1,033 |
| Insurance | 1% | $836 | $836 | $836 | $836 | $836 | $836 | $836 | $836 | $836 | $836 | $836 | $836 |
| Delivery Vehicle Expense | 1% | $500 | $500 | $500 | $500 | $500 | $500 | $500 | $500 | $500 | $500 | $500 | $500 |
| Payroll Taxes | 9% | $1,860 | $1,860 | $1,860 | $1,860 | $1,860 | $1,860 | $1,860 | $1,860 | $1,860 | $1,860 | $1,860 | $1,860 |
| Employee Benefits | 1% | $1,369 | $1,369 | $1,369 | $1,369 | $1,369 | $1,369 | $1,369 | $1,369 | $1,369 | $1,369 | $1,369 | $1,369 |
| State Property Tax Expense | 0% | $0 | $0 | $0 | $2,500 | $0 | $0 | $0 | $0 | $0 | $0 | $0 | $0 |
| Travel | 1% | $1,437 | $0 | $0 | $0 | $0 | $0 | $0 | $1,434 | $0 | $0 | $0 | $0 |
| Other | 1% | $1,379 | $1,379 | $1,379 | $1,379 | $1,379 | $1,379 | $1,379 | $1,379 | $1,379 | $1,379 | $1,379 | $1,379 |
| Total Operating Expenses | $47,872 | $44,105 | $44,252 | $49,568 | $44,608 | $44,675 | $46,222 | $46,183 | $47,418 | $47,737 | $44,234 | $44,110 | |
| Profit Before Interest and Taxes | ($4,699) | $2,344 | $5,221 | $6,770 | $12,515 | $14,049 | $12,036 | $12,025 | $16,858 | $23,689 | $4,988 | $2,030 | |
| EBITDA | ($697) | $6,346 | $9,223 | $10,772 | $16,517 | $18,051 | $16,038 | $16,027 | $20,860 | $27,691 | $8,990 | $6,031 | |
| Interest Expense | $4,131 | $4,095 | $4,059 | $4,023 | $3,986 | $3,949 | $3,912 | $3,874 | $3,837 | $3,799 | $3,761 | $3,722 | |
| Taxes Incurred | ($2,649) | ($525) | $349 | $824 | $2,559 | $3,030 | $2,437 | $2,445 | $3,906 | $5,967 | $368 | ($508) | |
| Other Income | |||||||||||||
| Interest Income | $0 | $0 | $0 | $0 | $0 | $0 | $0 | $0 | $0 | $0 | $0 | $0 | |
| Other Income Account Name | $0 | $0 | $0 | $0 | $0 | $0 | $0 | $0 | $0 | $0 | $0 | $0 | |
| Total Other Income | $0 | $0 | $0 | $0 | $0 | $0 | $0 | $0 | $0 | $0 | $0 | $0 | |
| Other Expense | |||||||||||||
| Account Name | $0 | $0 | $0 | $0 | $0 | $0 | $0 | $0 | $0 | $0 | $0 | $0 | |
| Other Expense Account Name | $0 | $0 | $0 | $0 | $0 | $0 | $0 | $0 | $0 | $0 | $0 | $0 | |
| Total Other Expense | $0 | $0 | $0 | $0 | $0 | $0 | $0 | $0 | $0 | $0 | $0 | $0 | |
| Net Other Income | $0 | $0 | $0 | $0 | $0 | $0 | $0 | $0 | $0 | $0 | $0 | $0 | |
| Net Profit | ($6,181) | ($1,225) | $813 | $1,923 | $5,970 | $7,070 | $5,687 | $5,705 | $9,115 | $13,923 | $859 | ($1,185) | |
| Net Profit/Sales | -6.43% | -1.18% | 0.73% | 1.51% | 4.65% | 5.37% | 4.44% | 4.28% | 6.33% | 8.72% | 0.78% | -1.15% | |
| Pro Forma Cash Flow | |||||||||||||
| Month 1 | Month 2 | Month 3 | Month 4 | Month 5 | Month 6 | Month 7 | Month 8 | Month 9 | Month 10 | Month 11 | Month 12 | ||
| Cash Received | |||||||||||||
| Cash from Operations | |||||||||||||
| Cash Sales | $96,093 | $103,893 | $111,093 | $126,958 | $128,447 | $131,684 | $128,194 | $133,312 | $144,040 | $159,631 | $110,211 | $103,347 | |
| Subtotal Cash from Operations | $96,093 | $103,893 | $111,093 | $126,958 | $128,447 | $131,684 | $128,194 | $133,312 | $144,040 | $159,631 | $110,211 | $103,347 | |
| Additional Cash Received | |||||||||||||
| Non Operating (Other) Income | $0 | $0 | $0 | $0 | $0 | $0 | $0 | $0 | $0 | $0 | $0 | $0 | |
| Sales Tax, VAT, HST/GST Received | 0.00% | $0 | $0 | $0 | $0 | $0 | $0 | $0 | $0 | $0 | $0 | $0 | $0 |
| New Current Borrowing | $0 | $0 | $0 | $0 | $0 | $0 | $0 | $0 | $0 | $0 | $0 | $0 | |
| New Other Liabilities (interest-free) | $0 | $0 | $0 | $0 | $0 | $0 | $0 | $0 | $0 | $0 | $0 | $0 | |
| New Long-term Liabilities | $0 | $0 | $0 | $0 | $0 | $0 | $0 | $0 | $0 | $0 | $0 | $0 | |
| Sales of Other Current Assets | $0 | $0 | $0 | $0 | $0 | $0 | $0 | $0 | $0 | $0 | $0 | $0 | |
| Sales of Long-term Assets | $0 | $0 | $0 | $0 | $0 | $0 | $0 | $0 | $0 | $0 | $0 | $0 | |
| New Investment Received | $0 | $0 | $0 | $0 | $0 | $0 | $0 | $0 | $0 | $0 | $0 | $0 | |
| Subtotal Cash Received | $96,093 | $103,893 | $111,093 | $126,958 | $128,447 | $131,684 | $128,194 | $133,312 | $144,040 | $159,631 | $110,211 | $103,347 | |
| Expenditures | Month 1 | Month 2 | Month 3 | Month 4 | Month 5 | Month 6 | Month 7 | Month 8 | Month 9 | Month 10 | Month 11 | Month 12 | |
| Expenditures from Operations | |||||||||||||
| Cash Spending | $20,684 | $20,684 | $20,684 | $20,684 | $20,684 | $20,684 | $20,684 | $20,684 | $20,684 | $20,684 | $20,684 | $20,700 | |
| Bill Payments | $0 | $41,380 | $79,105 | $88,519 | $92,797 | $94,318 | $104,264 | $98,138 | $101,208 | $111,491 | $99,990 | $87,632 | |
| Subtotal Spent on Operations | $20,684 | $62,064 | $99,789 | $109,203 | $113,481 | $115,002 | $124,948 | $118,822 | $121,892 | $132,175 | $120,674 | $108,332 | |
| Additional Cash Spent | |||||||||||||
| Non Operating (Other) Expense | $0 | $0 | $0 | $0 | $0 | $0 | $0 | $0 | $0 | $0 | $0 | $0 | |
| Sales Tax, VAT, HST/GST Paid Out | $0 | $0 | $0 | $0 | $0 | $0 | $0 | $0 | $0 | $0 | $0 | $0 | |
| Principal Repayment of Current Borrowing | $0 | $0 | $0 | $0 | $0 | $0 | $0 | $0 | $0 | $0 | $0 | $0 | |
| Other Liabilities Principal Repayment | $0 | $0 | $0 | $0 | $0 | $0 | $0 | $0 | $0 | $0 | $0 | $0 | |
| Long-term Liabilities Principal Repayment | $5,352 | $5,387 | $5,423 | $5,459 | $5,496 | $5,533 | $5,569 | $5,607 | $5,644 | $5,682 | $5,719 | $5,758 | |
| Purchase Other Current Assets | $0 | $0 | $0 | $0 | $0 | $0 | $0 | $0 | $0 | $0 | $0 | $0 | |
| Purchase Long-term Assets | $0 | $0 | $0 | $0 | $0 | $0 | $0 | $0 | $0 | $0 | $0 | $0 | |
| Dividends | $0 | $0 | $0 | $0 | $0 | $0 | $0 | $0 | $0 | $21,311 | $0 | $0 | |
| Subtotal Cash Spent | $26,036 | $67,451 | $105,212 | $114,662 | $118,977 | $120,535 | $130,517 | $124,429 | $127,536 | $159,168 | $126,393 | $114,090 | |
| Net Cash Flow | $70,057 | $36,442 | $5,881 | $12,296 | $9,470 | $11,149 | ($2,323) | $8,883 | $16,504 | $463 | ($16,182) | ($10,743) | |
| Cash Balance | $166,221 | $202,663 | $208,543 | $220,840 | $230,310 | $241,459 | $239,136 | $248,020 | $264,524 | $264,987 | $248,805 | $238,062 | |
| Pro Forma Balance Sheet | |||||||||||||
| Month 1 | Month 2 | Month 3 | Month 4 | Month 5 | Month 6 | Month 7 | Month 8 | Month 9 | Month 10 | Month 11 | Month 12 | ||
| Assets | Starting Balances | ||||||||||||
| Current Assets | |||||||||||||
| Cash | $96,164 | $166,221 | $202,663 | $208,543 | $220,840 | $230,310 | $241,459 | $239,136 | $248,020 | $264,524 | $264,987 | $248,805 | $238,062 |
| Inventory | $344,000 | $344,000 | $344,000 | $354,000 | $344,000 | $344,000 | $354,000 | $344,000 | $354,000 | $354,000 | $324,000 | $324,000 | $334,000 |
| Other Current Assets | $30,400 | $30,400 | $30,400 | $30,400 | $30,400 | $30,400 | $30,400 | $30,400 | $30,400 | $30,400 | $30,400 | $30,400 | $30,400 |
| Total Current Assets | $470,564 | $540,621 | $577,063 | $592,943 | $595,240 | $604,710 | $625,859 | $613,536 | $632,420 | $648,924 | $619,387 | $603,205 | $602,462 |
| Long-term Assets | |||||||||||||
| Long-term Assets | $246,104 | $246,104 | $246,104 | $246,104 | $246,104 | $246,104 | $246,104 | $246,104 | $246,104 | $246,104 | $246,104 | $246,104 | $246,104 |
| Accumulated Depreciation | $0 | $4,002 | $8,004 | $12,005 | $16,007 | $20,009 | $24,011 | $28,012 | $32,014 | $36,016 | $40,018 | $44,019 | $48,021 |
| Total Long-term Assets | $246,104 | $242,102 | $238,101 | $234,099 | $230,097 | $226,095 | $222,094 | $218,092 | $214,090 | $210,088 | $206,087 | $202,085 | $198,083 |
| Total Assets | $716,668 | $782,723 | $815,163 | $827,042 | $825,337 | $830,805 | $847,953 | $831,628 | $846,510 | $859,012 | $825,474 | $805,290 | $800,545 |
| Liabilities and Capital | Month 1 | Month 2 | Month 3 | Month 4 | Month 5 | Month 6 | Month 7 | Month 8 | Month 9 | Month 10 | Month 11 | Month 12 | |
| Current Liabilities | |||||||||||||
| Accounts Payable | $0 | $77,588 | $116,640 | $133,129 | $134,959 | $139,954 | $155,564 | $139,121 | $153,904 | $162,936 | $142,467 | $127,143 | $129,341 |
| Current Borrowing | $0 | $0 | $0 | $0 | $0 | $0 | $0 | $0 | $0 | $0 | $0 | $0 | $0 |
| Other Current Liabilities | $0 | $0 | $0 | $0 | $0 | $0 | $0 | $0 | $0 | $0 | $0 | $0 | $0 |
| Subtotal Current Liabilities | $0 | $77,588 | $116,640 | $133,129 | $134,959 | $139,954 | $155,564 | $139,121 | $153,904 | $162,936 | $142,467 | $127,143 | $129,341 |
| Long-term Liabilities | $625,000 | $619,648 | $614,261 | $608,838 | $603,379 | $597,883 | $592,350 | $586,781 | $581,174 | $575,530 | $569,848 | $564,129 | $558,371 |
| Total Liabilities | $625,000 | $697,236 | $730,901 | $741,967 | $738,338 | $737,837 | $747,914 | $725,902 | $735,078 | $738,466 | $712,315 | $691,272 | $687,712 |
| Paid-in Capital | $175,000 | $175,000 | $175,000 | $175,000 | $175,000 | $175,000 | $175,000 | $175,000 | $175,000 | $175,000 | $175,000 | $175,000 | $175,000 |
| Retained Earnings | ($83,332) | ($83,332) | ($83,332) | ($83,332) | ($83,332) | ($83,332) | ($83,332) | ($83,332) | ($83,332) | ($83,332) | ($104,643) | ($104,643) | ($104,643) |
| Earnings | $0 | ($6,181) | ($7,406) | ($6,593) | ($4,670) | $1,301 | $8,371 | $14,058 | $19,763 | $28,878 | $42,802 | $43,661 | $42,476 |
| Total Capital | $91,668 | $85,487 | $84,262 | $85,075 | $86,998 | $92,969 | $100,039 | $105,726 | $111,431 | $120,546 | $113,159 | $114,018 | $112,833 |
| Total Liabilities and Capital | $716,668 | $782,723 | $815,163 | $827,042 | $825,337 | $830,805 | $847,953 | $831,628 | $846,510 | $859,012 | $825,474 | $805,290 | $800,545 |
| Net Worth | $91,668 | $85,487 | $84,262 | $85,075 | $86,998 | $92,969 | $100,039 | $105,726 | $111,431 | $120,546 | $113,159 | $114,018 | $112,833 |
| Long-term | ||||||||||
| Year 1 | Year 2 | Year 3 | Year 4 | Year 5 | Year 6 | Year 7 | Year 8 | Year 9 | Year 10 | |
| Sales | $1,476,903 | $1,840,977 | $2,214,233 | $2,343,370 | $2,484,097 | $0 | $0 | $0 | $0 | $0 |
| Cost of Sales | $818,091 | $1,019,293 | $1,223,152 | $1,284,310 | $1,348,525 | $0 | $0 | $0 | $0 | $0 |
| Gross Margin | $658,812 | $821,683 | $991,081 | $1,059,061 | $1,135,572 | $0 | $0 | $0 | $0 | $0 |
| Gross Margin % | 44.61% | 44.63% | 44.76% | 45.19% | 45.71% | 0.00% | 0.00% | 0.00% | 0.00% | 0.00% |
| Operating Expenses | $550,984 | $604,353 | $655,497 | $690,957 | $721,579 | $0 | $0 | $0 | $0 | $0 |
| Operating Income | $107,828 | $217,330 | $335,584 | $368,104 | $413,992 | $0 | $0 | $0 | $0 | $0 |
| Net Income | $42,476 | $122,883 | $209,869 | $237,191 | $274,249 | $0 | $0 | $0 | $0 | $0 |
| Current Assets | $602,462 | $682,229 | $797,693 | $885,094 | $990,379 | $0 | $0 | $0 | $0 | $0 |
| Long-term Assets | $198,083 | $150,062 | $102,041 | $54,020 | $5,999 | $0 | $0 | $0 | $0 | $0 |
| Current Liabilities | $129,341 | $171,805 | $212,461 | $217,880 | $229,679 | $0 | $0 | $0 | $0 | $0 |
| Long-term Liabilities | $558,371 | $486,212 | $408,064 | $323,430 | $231,771 | $0 | $0 | $0 | $0 | $0 |
| Equity | $112,833 | $174,274 | $279,209 | $397,804 | $534,928 | $0 | $0 | $0 | $0 | $0 |


