
HandyMan Stan
Executive Summary
HandyMan Stan is a start-up organization offering residents of Duluth, Minnesota a complete handyman service. By developing the reputation as a qualified, reasonably priced and trusted service provider, HandyMan Stan will quickly generate market penetration and develop a solid foundation of repeat customers.
The Market
HandyMan Stan’s target market has been segmented into: home owners and property managers. There are 24,090 potential customers in the home owner segment. This group has a 5% annual growth rate. There are 1,243 potential customers in the property manager segment. This group is growing at a 4% annual growth rate.
Services
As a handyman, Stan will offer a wide range of home repair services. The services are generally fairly minor tasks, if the problem becomes major a contractor is best suited to solve the difficulty. HandyMan Stan will offer the value-added feature to pre-screen a contractor when Stan is unable to perform the repair. This will develop a trust bond with the customer so that when a more minor issue comes up the customer is more likely to call Stan due to his honesty displayed earlier. Stan offers fix-it services for: plumbing, electrical, fences, windows, decks/patios, painting, weather proofing, floors.
Competitive Edge
HandyMan Stan will differentiate from the competition by offering: low price and low minimum charge. Stan is charging a reasonable $30 per hour in an effort to encourage people to hire him for tasks that they would otherwise try themselves of just ignore until it became more of a problem. The second element of the competitive edge is Stan’s low one hour minimum. This compares favorably with the other industry competitors who often have two to three hour minimums. This edge also creates an incentive for the customer to call for Stan’s assistance earlier than they would with comparable service providers.
1.1 Mission
HandyMan Stan’s mission is to provide knowledgeable, convenient, and reasonably-priced handyman service to the Duluth, Minnesota community. HandyMan Stan will provide every customer with an honest day’s work and will fix anything that is not done right.
1.2 Keys to Success
- Treat every customer as if they were the most important customer the business has.
- Honestly evaluate the needed skills for a job, passing it onto a contractor if it is too difficult as opposed to taking on a job that cannot be completed perfectly.
- Work hard, guarantee all work and promote 100% customer satisfaction, if this is done profitability will fall into place.
1.3 Objectives
- Develop the business into full-time employment within 12 months.
- Generate steady revenue per year by the end of year two.
- Create over 20% of business from repeat customers.
Company Summary
HandyMan Stan has been formed as a Minnesota Limited Liability Company (LLC) by Stan Roberts. Stan will be the sole employee and owner of the company. The company will incur certain start-up costs, primarily tools, detailed in the Start-up Summary section.
2.1 Start-up Summary
HandyMan Stan will incur start-up costs associated with the beginning of the business. The following table details the start-up costs as well as indicated the needed capital for initial operations. Stan will be using his personal tools for jobs but will need to purchase the following additional equipment/tools:
- Assorted plumbing tools including: slip wrenches, snakes, teflon tape, and assorted caps, nuts, and bolts.
- Electrical tools including: electrical gauge meters, wire cutters, various wires and wire caps, and soldering iron.
- Painting material including: paint brushes, paint roller, pneumatic paint sprayer, air compressor, sand papers, spackle tools and masking tape.
- Pressure washer.
- Various general tools.
- Assorted power tools (drill, saw, sander, Dremel).
- Assorted nails, bolts, screws, and fixtures.
- Laptop with portable printer for mobile invoice printing and submission.
- Mobile phone.

| Start-up | |
| Requirements | |
| Start-up Expenses | |
| Legal | $500 |
| Accountant | $500 |
| Brochures | $250 |
| Insurance | $250 |
| Total Start-up Expenses | $1,500 |
| Start-up Assets | |
| Cash Required | $20,500 |
| Other Current Assets | $0 |
| Long-term Assets | $8,000 |
| Total Assets | $28,500 |
| Total Requirements | $30,000 |
| Start-up Funding | |
| Start-up Expenses to Fund | $1,500 |
| Start-up Assets to Fund | $28,500 |
| Total Funding Required | $30,000 |
| Assets | |
| Non-cash Assets from Start-up | $8,000 |
| Cash Requirements from Start-up | $20,500 |
| Additional Cash Raised | $0 |
| Cash Balance on Starting Date | $20,500 |
| Total Assets | $28,500 |
| Liabilities and Capital | |
| Liabilities | |
| Current Borrowing | $0 |
| Long-term Liabilities | $30,000 |
| Accounts Payable (Outstanding Bills) | $0 |
| Other Current Liabilities (interest-free) | $0 |
| Total Liabilities | $30,000 |
| Capital | |
| Planned Investment | |
| Investor 1 | $0 |
| Other | $0 |
| Additional Investment Requirement | $0 |
| Total Planned Investment | $0 |
| Loss at Start-up (Start-up Expenses) | ($1,500) |
| Total Capital | ($1,500) |
| Total Capital and Liabilities | $28,500 |
| Total Funding | $30,000 |
2.2 Company Ownership
Stan Roberts is the founder and owner of HandyMan Stan. The company will remain a one-man operation for the foreseeable future.
Services
HandyMan Stan offers the community of Duluth the finest home repair and maintenance for home owners and property managers. All services start at just $30 per hour plus parts. HandyMan Stan will give every customer at least one hour of work at their property.
All work is “handyman” work, for larger jobs that require a contractor, HandyMan Stan will pre-screen a service provider free for the customer.
By providing only handyman services, HandyMan Stan will always attempt to repair the problem first, replacement is only an option if the item cannot be repaired. This differs from a contractor philosophy which is generally to replace everything first.
Repairing items is far less expensive for the consumer. HandyMan Stan offers a one year guarantee for all of their work, if something goes wrong, HandyMan Stan will make it right. The goal is to not have any unsatisfied customers.
Offered services include:
| Minor plumbing | Leaky faucets, repair/replace fixtures, sprinkler repair, minor drain problems, garbage disposal install, install ice maker lines. |
| Minor electrical | Ceiling fan repair and install, electrical plugs and switches, vanity lights, motion lights, cable and phone line installation. |
| Fence repair | Metal and wood fence repair and install, electric dog fences, gate and latch install. |
| Window, wall and door repairs | Small hole repair, door installation, window maintenance and repair. |
| Decks and patios | Deck repair and maintenance, chemical cleaning, pressure washing, wood replacement, handrail installation. |
| Painting | Interior and exterior (short of an entire exterior of a house). |
| Weather proofing | Weather stripping, caulking. |
| Flooring |
Carpet and hard wood repair. |
Market Analysis Summary
HandyMan Stan has identified two distinct market segments, home owners and property managers. These are the most attractive customer segments as they are the customers who often have small repairs that are too small for a contractor but too complicated for the owner to perform themselves.
The handyman industry competes with the contractor industry for home repair jobs. Handymen are typically used for small items, contractors are typically called in for more extensive projects.
Customers will often call whatever service provider they are familiar with, regardless of the appropriateness. For this reason, word of mouth referrals will be very important. Potential customers will ask neighbors/friends and other property managers for recommendations on handyman service providers. HandyMan Stan will capitalize on word of mouth marketing by going the extra mile to keep customers satisfied. Exemplary service will result in new and repeat business.
4.1 Market Segmentation
The market has been segmented into two distinct customer groups:
Home owners
- The value of the homes ranges generally between $150,000 – $650,00.
- 47% of home owners attempt to make small repairs themselves, often starting the repair and realizing that they do not have the skills to complete it. The remaining 53% do not attempt to repair it, they call a professional from the start.
- 62% have owned their home for more than two years.
- 73% wait until several small problems accumulate before they call a handyman. This behavior can be explained by not wanting to incur a large upfront charge just to have someone fix one thing.
Property managers

- Manage between three – 20 units.
- Typically do not have their own in-house repair man in an effort to reduce overhead expenses.
- The range of monthly rental costs of their units is $350-$675.

| Market Analysis | |||||||
| Year 1 | Year 2 | Year 3 | Year 4 | Year 5 | |||
| Potential Customers | Growth | CAGR | |||||
| Home owners | 5% | 24,090 | 25,295 | 26,560 | 27,888 | 29,282 | 5.00% |
| Property managers | 4% | 1,234 | 1,283 | 1,334 | 1,387 | 1,442 | 3.97% |
| Total | 4.95% | 25,324 | 26,578 | 27,894 | 29,275 | 30,724 | 4.95% |
4.2 Target Market Segment Strategy
The two customer segments, home owners and property managers have been targeted because they are the most likely consumer of handyman services.
Unless the home owner is particularly crafty, he/she does not have the skills, time or desire to tackle most jobs. Their preference is to hire someone and have them take care of it.
The property manager are also likely consumers because they are managing a group rental property which needs periodic maintenance. Property managers with less than 20 units rarely have on-site maintenance personnel, it is less expensive to hire someone as needed.
It is rare that the property manager would have any maintenance skills themselves and those that do usually do not have the time in the day to perform the repair.
It should be noted that the majority of business will be coming from residents and rental property from within the Duluth city limits. As you venture farther out of town into the country people tend to have more free time and more fix it skills and are therefore more likely to try to repair things themselves.
4.3 Service Business Analysis
Handymen operate within the general home repair industry. This industry encompass both handymen as well as general contractors. The distinction between the two is as follows: handymen can fix most minor problems, items that are not to extensively damaged nor do they require expensive special tools.
Contractors are most useful for jobs that are very technical in nature, extensive in the repair, or require very specialized tools. A handyman is typically far more of a generalist, he can handle a wider range of repairs whereas a contractor has a smaller realm of expertise.
4.3.1 Competition and Buying Patterns
HandyMan Stan will receive competition from several sources. The most well-known competitors are detailed below:
Handymen
- Jack Of All Trades: This is a handyman company that employs six different workers as handymen. This is a large company (for handymen) with a far less intimate customer experience. If a customer used this service on four different occassions, they are likely to receive four different people on the service calls.
- Fix-It-Up: This is a one man outfit that specializes in plumbing and electrical problems. Painting and patios are not serviced. In speaking with several customers regarding their experience with this service, their impressions have been mixed.
Contractors (General)
- Duluth Contractors: This is a full-service general contractor. The organization is large with 17 employees. This company does a mixture of commercial and residential work. This company has a eight hour minimum.
- Red Rock Contractors: This is a small sized contractor of six employees. They concentrate on residential jobs and have a smaller minimum of four hour projects.
The buying patterns of consumers are largely based on who they know. Either they know a handyman or contractor whom they call or they will inquire with friends or neighbors as to who they recommend. They will often stay with that person unless they are unhappy with the service.
Stan plans to capitalize on word of mouth referrals, achieved by ensuring every customer has their expectations exceeded.
It is reasonable to expect that some of the larger contracting companies would be able to offer a better hourly rate due to economies of scale. This does not turn out to be the case since most of the large contractors perform a wider range of specialized services, necessitating many more tools and skilled workers, increasing overhead and therefore there billable rate.
Strategy and Implementation Summary
HandyMan Stan’s strategy for quickly gaining market share will be leveraging the competitive edge of reasonable hourly rates and a small, one hour minimum, encouraging more frequent service trips.
The marketing strategy has been designed to raise awareness of HandyMan Stan services among a community of people where there has already been a trust relationship established among the community. This supports the idea that HandyMan Stan’s business will be built on word of mouth referrals. Lastly, the sales strategy will emphasize the wide repertoire of qualified skills, encouraging current customers to use HandyMan Stan for a wider range of repairs.
5.1 Competitive Edge
HandyMan Stan’s competitive edge is the offering of reasonable prices and a one hour minimum, encouraging customers to call HandyMan Stan whenever a problem arises. A one hour ($30) service call is reasonable (not excessively high) but long enough so that several small items can be repaired in one visit.
90% of competing handymen have a two hour minimum creating a barrier for the customer to not call because the problem is too small to warrant two hours of paid work. HandyMan Stan’s one hour minimum develops a pattern of behavior for the customer to call anytime that they have small repairs.
This competitive edge also applies to property managers (especially managers who operate lower income property, typically less than $600 per month) who often balk at calling a handyman until there is a list of different problems.
5.2 Marketing Strategy
HandyMan Stan will employ a marketing strategy that seeks to develop awareness regarding HandyMan Stan’s expertise, high level of trust, and reasonable rates among a community of people. This will be accomplished by placing advertisements in organizational newsletters such as the Lions Club, religious organizations, and other social and sport associations.
These organizations will be targeted with the advertisements because once HandyMan Stan has satisfied several different customers within an organization, there is an increased likelihood that the organizational members will talk among themselves, sharing their good experience with HandyMan Stan among their colleagues.
This is a likely scenario because in this industry it is very common for friends and neighbors to ask friends for trusted service providers. When a person does not know a specific service provider, they will often act upon a recommendation from a friend who had a positive experience with one. These social, religious, or sport-based organizations tend to be quite social and often share their trials and tribulations regarding service providers.
5.3 Sales Strategy
The sales strategy will be designed to convert a current customer from using just one or two of HandyMan Stan’s skills to employing Stan for a wide variety repairs. This will be accomplished several ways. First, Stan will complete each repair with a level of professionalism which is unexpected for a handyman.
Providing this aura of professionalism will help create a very positive impression for Stan’s services. Additionally, Stan will always be on the look out for problem areas within the home and offer a solution that he believes will be attractive to the customer.
The key to generating increased tickets from an individual customer is based on the ability for Stan to showcase qualified skills, reasonable prices, and a trustworthy nature, enough so that the customer feels comfortable for Stan to be in the home even when they are not there. While this strategy should assist the business in increasing individual ticket prices, it will at the same time develop a vocal following for his services which will increase word of mouth referrals.
5.3.1 Sales Forecast
The sales forecast has been developed in a conservative manner to increase the likelihood of achieving the sales goals. The forecast (detailed in the following table) breaks down sales based on the activity that HandyMan Stan will perform.
Needed parts will be billed additionally, there are certain “consumables” such as nails, caulk, and etc., that Stan will be using that are included in the $30 hourly fee. These consumables are captured in the direct costs of goods as a percentage of the overall service charge. The different services have different percentages assigned to each type of service.
While Stan performs a wide range of jobs, he bills out at the same hourly rate. The competition typically bills out electrical work at a higher rate, and painting at a lower rate. Stan has chosen a single hourly rate to encourages customers to use him for multiple repairs on the same visit.
While he may not get as much painting work as he could because his rate is above the market rate, the variances in the long run average out and it creates an incentive for the customer to call Stan and throw a wide range of projects to him while he is at the project site.

| Sales Forecast | |||
| Year 1 | Year 2 | Year 3 | |
| Sales | |||
| Plumbing | $4,250 | $12,500 | $16,550 |
| Electrical | $3,698 | $10,875 | $14,399 |
| Fences | $782 | $2,875 | $3,807 |
| Windows | $1,360 | $4,000 | $5,296 |
| Decks | $945 | $4,500 | $5,958 |
| Paint | $2,508 | $7,375 | $9,765 |
| Weather proofing | $1,403 | $4,125 | $5,462 |
| Parts | $850 | $2,500 | $3,310 |
| Floors | $1,615 | $4,750 | $6,289 |
| Total Sales | $17,410 | $53,500 | $70,834 |
| Direct Cost of Sales | Year 1 | Year 2 | Year 3 |
| Plumbing | $298 | $875 | $1,159 |
| Electrical | $185 | $544 | $720 |
| Fences | $23 | $86 | $114 |
| Windows | $109 | $320 | $424 |
| Decks | $38 | $180 | $238 |
| Paint | $226 | $664 | $879 |
| Weather proofing | $84 | $248 | $328 |
| Parts | $680 | $2,000 | $2,648 |
| Floors | $65 | $190 | $252 |
| Subtotal Direct Cost of Sales | $1,707 | $5,106 | $6,761 |
5.4 Milestones
HandyMan Stan has identified several specific milestones which will function as goals for the organization. The milestones will provide a target for achievement as well as a mechanism for tracking progress. The following table will provide a timeframe for each milestone.
| Milestones | |||||
| Milestone | Start Date | End Date | Budget | Manager | Department |
| Business plan completion | 1/1/2004 | 2/15/2004 | $0 | Stan | Marketing |
| First customer | 2/15/2004 | 3/15/2004 | $0 | Stan | Department |
| Full time work threshold | 3/15/2004 | 6/30/2005 | $0 | Stan | Department |
| Revenues exceeding $75,000 | 3/15/2004 | 7/15/2005 | $0 | Stan | Department |
| Totals | $0 | ||||
Web Plan Summary
HandyMan Stan’s website will serve as a basic catalog of offered services that will be provided. In addition to a listing of the different skills that Stan possess, a list of testimonials and referrals will be on the site. Stan believes that this will be quite effective at swaying unsure people who have never heard about HandyMan Stan. More in depth inquires will be directed to Stan’s phone number.
6.1 Website Marketing Strategy
The marketing strategy will employ two distinct mechanisms:
- Search engine submission: This will be most useful to people who are unfamiliar with HandyMan Stan but are looking for a local handyman. There will also be searches from customers who may know about HandyMan Stan but are seeking additional information.
- URL on all printed material: For every printed piece of material that Stan offers, the site’s Web address will be listed, encouraging a visit to the site.
6.2 Development Requirements
The site will be developed by a friend under a barter agreement. Because the value of the development services will be less than $600, it will not have to be listed as a payout of 1099 income for tax purposes.
Management Summary
Stan Roberts is the founder and sole employee of HandyMan Stan. Stan began as a “fixer” out of high school when he secured a job with a general contractor. Because he did not have any formal contractor/construction experience he was relegated as a helping hand, assisting in a wide range of capacities.
Over ten years Stan became quite proficient in a wide range of activities, becoming a journeymen plumber and electrician as well as developing a strong repertoire of general fixing skills.
Stan enrolled in business courses at the local community college at night. Stan spent two years taking classes, developing his business skills. Once he was completed with the course he began to feel more comfortable with the idea of starting a new business.
7.1 Personnel Plan
HandyMan Stan is a one man business. Stan will perform all of the handyman activities. Additionally, Stan will be responsible for accounting issues which will be accomplished using Quicken. With a laptop computer and portable printer, Stan will be able to create, print, submit and collect invoices on site immediately following the completed project.
| Personnel Plan | |||
| Year 1 | Year 2 | Year 3 | |
| Stan | $20,000 | $24,000 | $30,000 |
| Other | $0 | $0 | $0 |
| Total People | 1 | 1 | 1 |
| Total Payroll | $20,000 | $24,000 | $30,000 |
Financial Plan
The following sections will outline important financial information.
8.1 Important Assumptions
The following table details important Financial Assumptions.
| General Assumptions | |||
| Year 1 | Year 2 | Year 3 | |
| Plan Month | 1 | 2 | 3 |
| Current Interest Rate | 10.00% | 10.00% | 10.00% |
| Long-term Interest Rate | 10.00% | 10.00% | 10.00% |
| Tax Rate | 30.00% | 30.00% | 30.00% |
| Other | 0 | 0 | 0 |
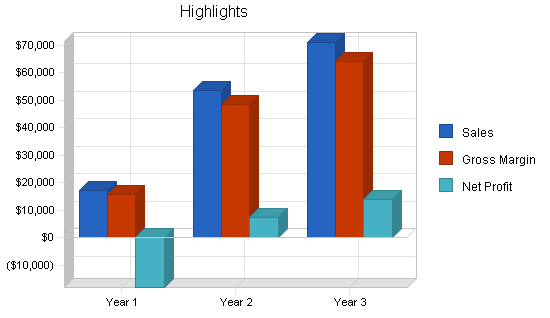
8.2 Projected Profit and Loss
The following table and charts will indicate Projected Profit and Loss.


| Pro Forma Profit and Loss | |||
| Year 1 | Year 2 | Year 3 | |
| Sales | $17,410 | $53,500 | $70,834 |
| Direct Cost of Sales | $1,707 | $5,106 | $6,761 |
| Other Costs of Sales | $0 | $0 | $0 |
| Total Cost of Sales | $1,707 | $5,106 | $6,761 |
| Gross Margin | $15,703 | $48,394 | $64,073 |
| Gross Margin % | 90.20% | 90.46% | 90.46% |
| Expenses | |||
| Payroll | $20,000 | $24,000 | $30,000 |
| Sales and Marketing and Other Expenses | $1,800 | $1,800 | $1,800 |
| Depreciation | $1,596 | $1,596 | $1,596 |
| License fees (electrical & plumbing) | $360 | $360 | $360 |
| Insurance | $2,400 | $2,400 | $2,400 |
| Payroll Taxes | $3,000 | $3,600 | $4,500 |
| Gas/other incidentals | $1,800 | $1,800 | $1,800 |
| Total Operating Expenses | $30,956 | $35,556 | $42,456 |
| Profit Before Interest and Taxes | ($15,253) | $12,838 | $21,617 |
| EBITDA | ($13,657) | $14,434 | $23,213 |
| Interest Expense | $2,740 | $2,279 | $1,808 |
| Taxes Incurred | $0 | $3,168 | $5,943 |
| Net Profit | ($17,994) | $7,391 | $13,866 |
| Net Profit/Sales | -103.36% | 13.82% | 19.58% |
8.3 Break-even Analysis
The Break-even Analysis indicates what will be needed in monthly revenue to reach the break-even point.

| Break-even Analysis | |
| Monthly Revenue Break-even | $2,860 |
| Assumptions: | |
| Average Percent Variable Cost | 10% |
| Estimated Monthly Fixed Cost | $2,580 |
8.4 Projected Cash Flow
The following table and chart will indicate Projected Cash Flow.

| Pro Forma Cash Flow | |||
| Year 1 | Year 2 | Year 3 | |
| Cash Received | |||
| Cash from Operations | |||
| Cash Sales | $17,410 | $53,500 | $70,834 |
| Subtotal Cash from Operations | $17,410 | $53,500 | $70,834 |
| Additional Cash Received | |||
| Sales Tax, VAT, HST/GST Received | $0 | $0 | $0 |
| New Current Borrowing | $0 | $0 | $0 |
| New Other Liabilities (interest-free) | $0 | $0 | $0 |
| New Long-term Liabilities | $0 | $0 | $0 |
| Sales of Other Current Assets | $0 | $0 | $0 |
| Sales of Long-term Assets | $0 | $0 | $0 |
| New Investment Received | $0 | $0 | $0 |
| Subtotal Cash Received | $17,410 | $53,500 | $70,834 |
| Expenditures | Year 1 | Year 2 | Year 3 |
| Expenditures from Operations | |||
| Cash Spending | $20,000 | $24,000 | $30,000 |
| Bill Payments | $12,484 | $20,150 | $24,972 |
| Subtotal Spent on Operations | $32,484 | $44,150 | $54,972 |
| Additional Cash Spent | |||
| Sales Tax, VAT, HST/GST Paid Out | $0 | $0 | $0 |
| Principal Repayment of Current Borrowing | $0 | $0 | $0 |
| Other Liabilities Principal Repayment | $0 | $0 | $0 |
| Long-term Liabilities Principal Repayment | $4,868 | $4,688 | $4,727 |
| Purchase Other Current Assets | $0 | $0 | $0 |
| Purchase Long-term Assets | $0 | $0 | $0 |
| Dividends | $0 | $0 | $0 |
| Subtotal Cash Spent | $37,352 | $48,838 | $59,699 |
| Net Cash Flow | ($19,943) | $4,662 | $11,135 |
| Cash Balance | $557 | $5,220 | $16,354 |
8.5 Projected Balance Sheet
The following table will indicate the Projected Balance Sheet.
| Pro Forma Balance Sheet | |||
| Year 1 | Year 2 | Year 3 | |
| Assets | |||
| Current Assets | |||
| Cash | $557 | $5,220 | $16,354 |
| Other Current Assets | $0 | $0 | $0 |
| Total Current Assets | $557 | $5,220 | $16,354 |
| Long-term Assets | |||
| Long-term Assets | $8,000 | $8,000 | $8,000 |
| Accumulated Depreciation | $1,596 | $3,192 | $4,788 |
| Total Long-term Assets | $6,404 | $4,808 | $3,212 |
| Total Assets | $6,961 | $10,028 | $19,566 |
| Liabilities and Capital | Year 1 | Year 2 | Year 3 |
| Current Liabilities | |||
| Accounts Payable | $1,323 | $1,686 | $2,085 |
| Current Borrowing | $0 | $0 | $0 |
| Other Current Liabilities | $0 | $0 | $0 |
| Subtotal Current Liabilities | $1,323 | $1,686 | $2,085 |
| Long-term Liabilities | $25,132 | $20,444 | $15,717 |
| Total Liabilities | $26,455 | $22,130 | $17,802 |
| Paid-in Capital | $0 | $0 | $0 |
| Retained Earnings | ($1,500) | ($19,494) | ($12,102) |
| Earnings | ($17,994) | $7,391 | $13,866 |
| Total Capital | ($19,494) | ($12,102) | $1,764 |
| Total Liabilities and Capital | $6,961 | $10,028 | $19,566 |
| Net Worth | ($19,494) | ($12,102) | $1,764 |
8.6 Business Ratios
The following table indicates Business Ratios specific to HandyMan Stan as well as industry ratios for the Personal and Household Goods Repair and Maintenance industry, NAICS code 811490.
| Ratio Analysis | ||||
| Year 1 | Year 2 | Year 3 | Industry Profile | |
| Sales Growth | 0.00% | 207.30% | 32.40% | 9.27% |
| Percent of Total Assets | ||||
| Other Current Assets | 0.00% | 0.00% | 0.00% | 27.35% |
| Total Current Assets | 8.00% | 52.05% | 83.58% | 66.95% |
| Long-term Assets | 92.00% | 47.95% | 16.42% | 33.05% |
| Total Assets | 100.00% | 100.00% | 100.00% | 100.00% |
| Current Liabilities | 19.00% | 16.81% | 10.66% | 22.05% |
| Long-term Liabilities | 361.03% | 203.88% | 80.33% | 8.56% |
| Total Liabilities | 380.03% | 220.69% | 90.98% | 30.61% |
| Net Worth | -280.03% | -120.69% | 9.02% | 69.39% |
| Percent of Sales | ||||
| Sales | 100.00% | 100.00% | 100.00% | 100.00% |
| Gross Margin | 90.20% | 90.46% | 90.46% | 18.28% |
| Selling, General & Administrative Expenses | 193.55% | 76.64% | 70.88% | 5.96% |
| Advertising Expenses | 0.00% | 0.00% | 0.00% | 0.65% |
| Profit Before Interest and Taxes | -87.62% | 24.00% | 30.52% | 67.63% |
| Main Ratios | ||||
| Current | 0.42 | 3.10 | 7.84 | 2.41 |
| Quick | 0.42 | 3.10 | 7.84 | 1.20 |
| Total Debt to Total Assets | 380.03% | 220.69% | 90.98% | 34.25% |
| Pre-tax Return on Net Worth | 92.31% | -87.25% | 1122.93% | 244.58% |
| Pre-tax Return on Assets | -258.49% | 105.30% | 101.24% | 371.96% |
| Additional Ratios | Year 1 | Year 2 | Year 3 | |
| Net Profit Margin | -103.36% | 13.82% | 19.58% | n.a |
| Return on Equity | 0.00% | 0.00% | 786.05% | n.a |
| Activity Ratios | ||||
| Accounts Payable Turnover | 10.44 | 12.17 | 12.17 | n.a |
| Payment Days | 27 | 27 | 27 | n.a |
| Total Asset Turnover | 2.50 | 5.34 | 3.62 | n.a |
| Debt Ratios | ||||
| Debt to Net Worth | 0.00 | 0.00 | 10.09 | n.a |
| Current Liab. to Liab. | 0.05 | 0.08 | 0.12 | n.a |
| Liquidity Ratios | ||||
| Net Working Capital | ($766) | $3,534 | $14,269 | n.a |
| Interest Coverage | -5.57 | 5.63 | 11.96 | n.a |
| Additional Ratios | ||||
| Assets to Sales | 0.40 | 0.19 | 0.28 | n.a |
| Current Debt/Total Assets | 19% | 17% | 11% | n.a |
| Acid Test | 0.42 | 3.10 | 7.84 | n.a |
| Sales/Net Worth | 0.00 | 0.00 | 40.15 | n.a |
| Dividend Payout | 0.00 | 0.00 | 0.00 | n.a |
Appendix
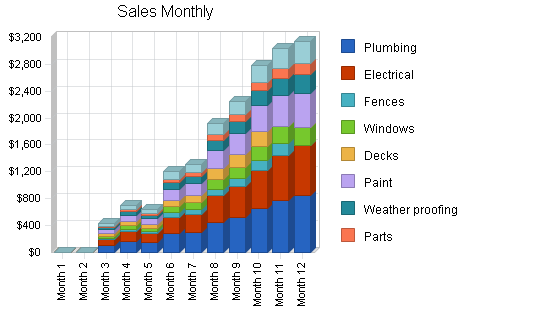
| Sales Forecast | |||||||||||||
| Month 1 | Month 2 | Month 3 | Month 4 | Month 5 | Month 6 | Month 7 | Month 8 | Month 9 | Month 10 | Month 11 | Month 12 | ||
| Sales | |||||||||||||
| Plumbing | 0% | $0 | $0 | $100 | $165 | $150 | $280 | $305 | $450 | $525 | $650 | $775 | $850 |
| Electrical | 0% | $0 | $0 | $87 | $144 | $131 | $244 | $265 | $392 | $457 | $566 | $674 | $740 |
| Fences | 0% | $0 | $0 | $23 | $38 | $35 | $64 | $70 | $104 | $121 | $150 | $178 | $0 |
| Windows | 0% | $0 | $0 | $32 | $53 | $48 | $90 | $98 | $144 | $168 | $208 | $248 | $272 |
| Decks | 0% | $0 | $0 | $36 | $59 | $54 | $101 | $110 | $162 | $189 | $234 | $0 | $0 |
| Paint | 0% | $0 | $0 | $59 | $97 | $89 | $165 | $180 | $266 | $310 | $384 | $457 | $502 |
| Weather proofing | 0% | $0 | $0 | $33 | $54 | $50 | $92 | $101 | $149 | $173 | $215 | $256 | $281 |
| Parts | 0% | $0 | $0 | $20 | $33 | $30 | $56 | $61 | $90 | $105 | $130 | $155 | $170 |
| Floors | 0% | $0 | $0 | $38 | $63 | $57 | $106 | $116 | $171 | $200 | $247 | $295 | $323 |
| Total Sales | $0 | $0 | $428 | $706 | $642 | $1,198 | $1,305 | $1,926 | $2,247 | $2,782 | $3,038 | $3,137 | |
| Direct Cost of Sales | Month 1 | Month 2 | Month 3 | Month 4 | Month 5 | Month 6 | Month 7 | Month 8 | Month 9 | Month 10 | Month 11 | Month 12 | |
| Plumbing | $0 | $0 | $7 | $12 | $11 | $20 | $21 | $32 | $37 | $46 | $54 | $60 | |
| Electrical | $0 | $0 | $4 | $7 | $7 | $12 | $13 | $20 | $23 | $28 | $34 | $37 | |
| Fences | $0 | $0 | $1 | $1 | $1 | $2 | $2 | $3 | $4 | $4 | $5 | $0 | |
| Windows | $0 | $0 | $3 | $4 | $4 | $7 | $8 | $12 | $13 | $17 | $20 | $22 | |
| Decks | $0 | $0 | $1 | $2 | $2 | $4 | $4 | $6 | $8 | $9 | $0 | $0 | |
| Paint | $0 | $0 | $5 | $9 | $8 | $15 | $16 | $24 | $28 | $35 | $41 | $45 | |
| Weather proofing | $0 | $0 | $2 | $3 | $3 | $6 | $6 | $9 | $10 | $13 | $15 | $17 | |
| Parts | $0 | $0 | $16 | $26 | $24 | $45 | $49 | $72 | $84 | $104 | $124 | $136 | |
| Floors | $0 | $0 | $2 | $3 | $2 | $4 | $5 | $7 | $8 | $10 | $12 | $13 | |
| Subtotal Direct Cost of Sales | $0 | $0 | $41 | $67 | $61 | $114 | $125 | $184 | $214 | $266 | $305 | $329 | |
| Personnel Plan | |||||||||||||
| Month 1 | Month 2 | Month 3 | Month 4 | Month 5 | Month 6 | Month 7 | Month 8 | Month 9 | Month 10 | Month 11 | Month 12 | ||
| Stan | 0% | $0 | $0 | $2,000 | $2,000 | $2,000 | $2,000 | $2,000 | $2,000 | $2,000 | $2,000 | $2,000 | $2,000 |
| Other | 0% | $0 | $0 | $0 | $0 | $0 | $0 | $0 | $0 | $0 | $0 | $0 | $0 |
| Total People | 1 | 1 | 1 | 1 | 1 | 1 | 1 | 1 | 1 | 1 | 1 | 1 | |
| Total Payroll | $0 | $0 | $2,000 | $2,000 | $2,000 | $2,000 | $2,000 | $2,000 | $2,000 | $2,000 | $2,000 | $2,000 | |
| General Assumptions | |||||||||||||
| Month 1 | Month 2 | Month 3 | Month 4 | Month 5 | Month 6 | Month 7 | Month 8 | Month 9 | Month 10 | Month 11 | Month 12 | ||
| Plan Month | 1 | 2 | 3 | 4 | 5 | 6 | 7 | 8 | 9 | 10 | 11 | 12 | |
| Current Interest Rate | 10.00% | 10.00% | 10.00% | 10.00% | 10.00% | 10.00% | 10.00% | 10.00% | 10.00% | 10.00% | 10.00% | 10.00% | |
| Long-term Interest Rate | 10.00% | 10.00% | 10.00% | 10.00% | 10.00% | 10.00% | 10.00% | 10.00% | 10.00% | 10.00% | 10.00% | 10.00% | |
| Tax Rate | 30.00% | 30.00% | 30.00% | 30.00% | 30.00% | 30.00% | 30.00% | 30.00% | 30.00% | 30.00% | 30.00% | 30.00% | |
| Other | 0 | 0 | 0 | 0 | 0 | 0 | 0 | 0 | 0 | 0 | 0 | 0 | |
| Pro Forma Profit and Loss | |||||||||||||
| Month 1 | Month 2 | Month 3 | Month 4 | Month 5 | Month 6 | Month 7 | Month 8 | Month 9 | Month 10 | Month 11 | Month 12 | ||
| Sales | $0 | $0 | $428 | $706 | $642 | $1,198 | $1,305 | $1,926 | $2,247 | $2,782 | $3,038 | $3,137 | |
| Direct Cost of Sales | $0 | $0 | $41 | $67 | $61 | $114 | $125 | $184 | $214 | $266 | $305 | $329 | |
| Other Costs of Sales | $0 | $0 | $0 | $0 | $0 | $0 | $0 | $0 | $0 | $0 | $0 | $0 | |
| Total Cost of Sales | $0 | $0 | $41 | $67 | $61 | $114 | $125 | $184 | $214 | $266 | $305 | $329 | |
| Gross Margin | $0 | $0 | $387 | $639 | $581 | $1,084 | $1,181 | $1,742 | $2,033 | $2,516 | $2,733 | $2,807 | |
| Gross Margin % | 0.00% | 0.00% | 90.46% | 90.46% | 90.46% | 90.46% | 90.46% | 90.46% | 90.46% | 90.46% | 89.95% | 89.51% | |
| Expenses | |||||||||||||
| Payroll | $0 | $0 | $2,000 | $2,000 | $2,000 | $2,000 | $2,000 | $2,000 | $2,000 | $2,000 | $2,000 | $2,000 | |
| Sales and Marketing and Other Expenses | $150 | $150 | $150 | $150 | $150 | $150 | $150 | $150 | $150 | $150 | $150 | $150 | |
| Depreciation | $133 | $133 | $133 | $133 | $133 | $133 | $133 | $133 | $133 | $133 | $133 | $133 | |
| License fees (electrical & plumbing) | $30 | $30 | $30 | $30 | $30 | $30 | $30 | $30 | $30 | $30 | $30 | $30 | |
| Insurance | $200 | $200 | $200 | $200 | $200 | $200 | $200 | $200 | $200 | $200 | $200 | $200 | |
| Payroll Taxes | 15% | $0 | $0 | $300 | $300 | $300 | $300 | $300 | $300 | $300 | $300 | $300 | $300 |
| Gas/other incidentals | $150 | $150 | $150 | $150 | $150 | $150 | $150 | $150 | $150 | $150 | $150 | $150 | |
| Total Operating Expenses | $663 | $663 | $2,963 | $2,963 | $2,963 | $2,963 | $2,963 | $2,963 | $2,963 | $2,963 | $2,963 | $2,963 | |
| Profit Before Interest and Taxes | ($663) | ($663) | ($2,576) | ($2,324) | ($2,382) | ($1,879) | ($1,782) | ($1,221) | ($930) | ($447) | ($230) | ($156) | |
| EBITDA | ($530) | ($530) | ($2,443) | ($2,191) | ($2,249) | ($1,746) | ($1,649) | ($1,088) | ($797) | ($314) | ($97) | ($23) | |
| Interest Expense | $247 | $244 | $240 | $237 | $234 | $230 | $227 | $223 | $220 | $216 | $213 | $209 | |
| Taxes Incurred | $0 | $0 | $0 | $0 | $0 | $0 | $0 | $0 | $0 | $0 | $0 | $0 | |
| Net Profit | ($910) | ($907) | ($2,816) | ($2,561) | ($2,616) | ($2,109) | ($2,009) | ($1,444) | ($1,150) | ($663) | ($443) | ($365) | |
| Net Profit/Sales | 0.00% | 0.00% | -657.96% | -362.66% | -407.46% | -176.00% | -153.90% | -74.99% | -51.20% | -23.83% | -14.60% | -11.64% | |
| Pro Forma Cash Flow | |||||||||||||
| Month 1 | Month 2 | Month 3 | Month 4 | Month 5 | Month 6 | Month 7 | Month 8 | Month 9 | Month 10 | Month 11 | Month 12 | ||
| Cash Received | |||||||||||||
| Cash from Operations | |||||||||||||
| Cash Sales | $0 | $0 | $428 | $706 | $642 | $1,198 | $1,305 | $1,926 | $2,247 | $2,782 | $3,038 | $3,137 | |
| Subtotal Cash from Operations | $0 | $0 | $428 | $706 | $642 | $1,198 | $1,305 | $1,926 | $2,247 | $2,782 | $3,038 | $3,137 | |
| Additional Cash Received | |||||||||||||
| Sales Tax, VAT, HST/GST Received | 0.00% | $0 | $0 | $0 | $0 | $0 | $0 | $0 | $0 | $0 | $0 | $0 | $0 |
| New Current Borrowing | $0 | $0 | $0 | $0 | $0 | $0 | $0 | $0 | $0 | $0 | $0 | $0 | |
| New Other Liabilities (interest-free) | $0 | $0 | $0 | $0 | $0 | $0 | $0 | $0 | $0 | $0 | $0 | $0 | |
| New Long-term Liabilities | $0 | $0 | $0 | $0 | $0 | $0 | $0 | $0 | $0 | $0 | $0 | $0 | |
| Sales of Other Current Assets | $0 | $0 | $0 | $0 | $0 | $0 | $0 | $0 | $0 | $0 | $0 | $0 | |
| Sales of Long-term Assets | $0 | $0 | $0 | $0 | $0 | $0 | $0 | $0 | $0 | $0 | $0 | $0 | |
| New Investment Received | $0 | $0 | $0 | $0 | $0 | $0 | $0 | $0 | $0 | $0 | $0 | $0 | |
| Subtotal Cash Received | $0 | $0 | $428 | $706 | $642 | $1,198 | $1,305 | $1,926 | $2,247 | $2,782 | $3,038 | $3,137 | |
| Expenditures | Month 1 | Month 2 | Month 3 | Month 4 | Month 5 | Month 6 | Month 7 | Month 8 | Month 9 | Month 10 | Month 11 | Month 12 | |
| Expenditures from Operations | |||||||||||||
| Cash Spending | $0 | $0 | $2,000 | $2,000 | $2,000 | $2,000 | $2,000 | $2,000 | $2,000 | $2,000 | $2,000 | $2,000 | |
| Bill Payments | $26 | $777 | $785 | $1,112 | $1,134 | $1,127 | $1,175 | $1,183 | $1,238 | $1,266 | $1,313 | $1,349 | |
| Subtotal Spent on Operations | $26 | $777 | $2,785 | $3,112 | $3,134 | $3,127 | $3,175 | $3,183 | $3,238 | $3,266 | $3,313 | $3,349 | |
| Additional Cash Spent | |||||||||||||
| Sales Tax, VAT, HST/GST Paid Out | $0 | $0 | $0 | $0 | $0 | $0 | $0 | $0 | $0 | $0 | $0 | $0 | |
| Principal Repayment of Current Borrowing | $0 | $0 | $0 | $0 | $0 | $0 | $0 | $0 | $0 | $0 | $0 | $0 | |
| Other Liabilities Principal Repayment | $0 | $0 | $0 | $0 | $0 | $0 | $0 | $0 | $0 | $0 | $0 | $0 | |
| Long-term Liabilities Principal Repayment | $387 | $391 | $394 | $397 | $400 | $404 | $407 | $411 | $414 | $417 | $421 | $424 | |
| Purchase Other Current Assets | $0 | $0 | $0 | $0 | $0 | $0 | $0 | $0 | $0 | $0 | $0 | $0 | |
| Purchase Long-term Assets | $0 | $0 | $0 | $0 | $0 | $0 | $0 | $0 | $0 | $0 | $0 | $0 | |
| Dividends | $0 | $0 | $0 | $0 | $0 | $0 | $0 | $0 | $0 | $0 | $0 | $0 | |
| Subtotal Cash Spent | $413 | $1,167 | $3,179 | $3,509 | $3,534 | $3,530 | $3,582 | $3,594 | $3,652 | $3,683 | $3,734 | $3,774 | |
| Net Cash Flow | ($413) | ($1,167) | ($2,751) | ($2,803) | ($2,892) | ($2,332) | ($2,277) | ($1,668) | ($1,405) | ($901) | ($696) | ($637) | |
| Cash Balance | $20,087 | $18,919 | $16,169 | $13,366 | $10,473 | $8,141 | $5,865 | $4,197 | $2,792 | $1,890 | $1,194 | $557 | |
| Pro Forma Balance Sheet | |||||||||||||
| Month 1 | Month 2 | Month 3 | Month 4 | Month 5 | Month 6 | Month 7 | Month 8 | Month 9 | Month 10 | Month 11 | Month 12 | ||
| Assets | Starting Balances | ||||||||||||
| Current Assets | |||||||||||||
| Cash | $20,500 | $20,087 | $18,919 | $16,169 | $13,366 | $10,473 | $8,141 | $5,865 | $4,197 | $2,792 | $1,890 | $1,194 | $557 |
| Other Current Assets | $0 | $0 | $0 | $0 | $0 | $0 | $0 | $0 | $0 | $0 | $0 | $0 | $0 |
| Total Current Assets | $20,500 | $20,087 | $18,919 | $16,169 | $13,366 | $10,473 | $8,141 | $5,865 | $4,197 | $2,792 | $1,890 | $1,194 | $557 |
| Long-term Assets | |||||||||||||
| Long-term Assets | $8,000 | $8,000 | $8,000 | $8,000 | $8,000 | $8,000 | $8,000 | $8,000 | $8,000 | $8,000 | $8,000 | $8,000 | $8,000 |
| Accumulated Depreciation | $0 | $133 | $266 | $399 | $532 | $665 | $798 | $931 | $1,064 | $1,197 | $1,330 | $1,463 | $1,596 |
| Total Long-term Assets | $8,000 | $7,867 | $7,734 | $7,601 | $7,468 | $7,335 | $7,202 | $7,069 | $6,936 | $6,803 | $6,670 | $6,537 | $6,404 |
| Total Assets | $28,500 | $27,954 | $26,653 | $23,770 | $20,834 | $17,808 | $15,343 | $12,934 | $11,133 | $9,595 | $8,560 | $7,731 | $6,961 |
| Liabilities and Capital | Month 1 | Month 2 | Month 3 | Month 4 | Month 5 | Month 6 | Month 7 | Month 8 | Month 9 | Month 10 | Month 11 | Month 12 | |
| Current Liabilities | |||||||||||||
| Accounts Payable | $0 | $751 | $748 | $1,074 | $1,097 | $1,087 | $1,135 | $1,142 | $1,196 | $1,222 | $1,268 | $1,303 | $1,323 |
| Current Borrowing | $0 | $0 | $0 | $0 | $0 | $0 | $0 | $0 | $0 | $0 | $0 | $0 | $0 |
| Other Current Liabilities | $0 | $0 | $0 | $0 | $0 | $0 | $0 | $0 | $0 | $0 | $0 | $0 | $0 |
| Subtotal Current Liabilities | $0 | $751 | $748 | $1,074 | $1,097 | $1,087 | $1,135 | $1,142 | $1,196 | $1,222 | $1,268 | $1,303 | $1,323 |
| Long-term Liabilities | $30,000 | $29,613 | $29,222 | $28,828 | $28,431 | $28,030 | $27,627 | $27,219 | $26,809 | $26,395 | $25,977 | $25,556 | $25,132 |
| Total Liabilities | $30,000 | $30,363 | $29,970 | $29,902 | $29,527 | $29,118 | $28,762 | $28,361 | $28,005 | $27,617 | $27,246 | $26,860 | $26,455 |
| Paid-in Capital | $0 | $0 | $0 | $0 | $0 | $0 | $0 | $0 | $0 | $0 | $0 | $0 | $0 |
| Retained Earnings | ($1,500) | ($1,500) | ($1,500) | ($1,500) | ($1,500) | ($1,500) | ($1,500) | ($1,500) | ($1,500) | ($1,500) | ($1,500) | ($1,500) | ($1,500) |
| Earnings | $0 | ($910) | ($1,816) | ($4,632) | ($7,193) | ($9,809) | ($11,919) | ($13,928) | ($15,372) | ($16,522) | ($17,185) | ($17,629) | ($17,994) |
| Total Capital | ($1,500) | ($2,410) | ($3,316) | ($6,132) | ($8,693) | ($11,309) | ($13,419) | ($15,428) | ($16,872) | ($18,022) | ($18,685) | ($19,129) | ($19,494) |
| Total Liabilities and Capital | $28,500 | $27,954 | $26,653 | $23,770 | $20,834 | $17,808 | $15,343 | $12,934 | $11,133 | $9,595 | $8,560 | $7,731 | $6,961 |
| Net Worth | ($1,500) | ($2,410) | ($3,316) | ($6,132) | ($8,693) | ($11,309) | ($13,419) | ($15,428) | ($16,872) | ($18,022) | ($18,685) | ($19,129) | ($19,494) |


