
Herr Haar
Executive Summary
Herr Haar is a full service salon dedicated to providing quality services as well as taking care of the whole person. Herr Haar will be superior to other salons in Anytown because of its unique approach to taking care of the client. With the most innovative advancements in hair replacement and other salon services, Herr Haar will stand out from the rest. Currently, no other business in Anytown provides an adequate solution to hair loss problems. Herr Haar’s experienced cosmetologists are committed to filling this niche.
Herr Haar has been up and running since May 2003, but the limitations of the current location make it necessary to move. To achieve our objectives, Herr Haar is seeking a $4,000 short-term (10 month) loan. The talent and determination of the owner, with 27 years of experience, is sure to make Herr Haar a continued success.
Over the past six months, Herr Haar has seen hair service sales of almost $47,000, or more than $7,800/month. In the new facility, where we can accommodate a larger clientele, we expect those hair services sales to increase to roughly $10,600/month, a fairly conservative increase. We are also opening new revenue streams with the introduction of a massage room, booth rental from other stylists who will lease space in our new facility, and increased direct sales of products we have formerly recommended, for a total 2004 sales goal of $244,000. These forecasts are based on performance of similar salons in the area, and on our research with other stylists and massage therapists here in Anytown.
In the past, hair replacement has carried a stigma for many men. Herr Haar’s professionalism and integration of hair replacement into the broader range of hair, skin, and body care will redefine this service in the Anytown area as a necessary luxury for the busy, successful man. To feel and perform your best, you must look your best – and Herr Haar is the first step.

1.1 Objectives
Herr Haar is more than just a full service salon providing excellent hair care and quality products, in a peaceful, relaxed atmosphere. Herr Haar will also provide a friendly work environment, respecting diversity, creativity, and hard work.
1.2 Mission
Our mission is to provide skilled services, through talented cosmetologists, that give our customers the dignity and self respect needed to be successful in the world today. We are also committed to offering a range of complementary services for hair styling and bodycare in the same location, to give our customers the convenience of a single location for all their hair and bodycare needs.
1.3 Keys to Success
- Location – Provides easy access for clients as well as greater visibility to potential clients.
- Advertising – will get our name and the concept of Herr Haar out to the public.
- Unique – Herr Haar is like no other in providing quality hair care and addressing more complicated hair care issues in private consultation.
- Reputation – The owners and stylists have great reputations with existing clientele
- Discreet – Our new, more visible location is paired with a range of hair and bodycare services, so when a client comes in, passersby cannot assume he is seeking hair replacement.
- Customer Satisfaction! – this is the most important factor in whether a one-time customer becomes a repeat customer and recommends us to friends.
The time is right for a salon that provides the skill and knowledge to take care of everyday hair care needs and hair loss problems. The diligence of the owner, along with the earnest desire of every skilled cosmetologist working with Herr Haar to constantly improve their knowledge, gives this business great potential.
Company Summary
Herr Haar will provide a wide range of hair care services, products, wigs, and hairpieces. We will only offer top quality hair and skin services and beauty products. Herr Haar is moving to a new location on a main road at ground level, which is ideal for this kind of business. What will set Herr Haar apart from any competition is our commitment to continued education, providing the latest hair care and replacement techniques, along with other related services, at a convenient location.
2.1 Company Ownership
Herr Haar is an S-Corporation, established in 2003 by Jane Whigg, who owns the majority of the business. Joan Whigg, her daughter, holds less than 15% of the business.
- Jane has been a cosmetologist for 27 years, with years of experience in hair extensions and other hair care needs, and has been trained in the latest hair replacement systems.
- Joan has been working successfully with a modest clientele for three years, after receiving training in the latest hair replacement systems, such as Great Lengths and Le Metric. Joan will continue to take several more classes that will help her specialize in specific hair loss syndromes and corrective color techniques.
2.2 Company History
Herr Haar was started in May, 2003. Although this may seem a fairly short existence, Herr Haar has done fairly well in the past six months, as the following table and chart show, garnering hair services revenue of roughly $7,800 per month. Herr Haar has done well in spite of a declining economy and a location with poor visibility and small square footage.
We do not do sales on credit, and have a good asset base of almost $6,000, in the form of inventory and equipment, which will move with us to the new building. We currently have $4,365 in liabilities, in the form of $3,500 of Accounts Payable (for recent inventory shipments and utilities) and a no-interest loan for $1,350 from another family member. Accounts Payable are paid on 30 day terms, on time. The outstanding loan will be repaid gradually over the course of the next two years, according to our agreement with the lender (see the Cash Flow table for details).
The future shows much promise, and the new location will afford Herr Haar greater access to the public.
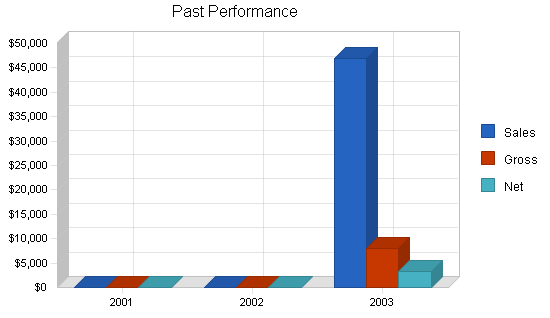
| Past Performance | |||
| 2001 | 2002 | 2003 | |
| Sales | $0 | $0 | $46,896 |
| Gross Margin | $0 | $0 | $8,000 |
| Gross Margin % | 0.00% | 0.00% | 17.06% |
| Operating Expenses | $0 | $0 | $10,112 |
| Inventory Turnover | 0.00 | 0.00 | 30.91 |
| Balance Sheet | |||
| 2001 | 2002 | 2003 | |
| Current Assets | |||
| Cash | $0 | $0 | $1,031 |
| Inventory | $0 | $0 | $1,519 |
| Other Current Assets | $0 | $0 | $1,675 |
| Total Current Assets | $0 | $0 | $4,225 |
| Long-term Assets | |||
| Long-term Assets | $0 | $0 | $1,800 |
| Accumulated Depreciation | $0 | $0 | $126 |
| Total Long-term Assets | $0 | $0 | $1,674 |
| Total Assets | $0 | $0 | $5,899 |
| Current Liabilities | |||
| Accounts Payable | $0 | $0 | $3,500 |
| Current Borrowing | $0 | $0 | $0 |
| Other Current Liabilities (interest free) | $0 | $0 | $1,135 |
| Total Current Liabilities | $0 | $0 | $4,635 |
| Long-term Liabilities | $0 | $0 | $0 |
| Total Liabilities | $0 | $0 | $4,635 |
| Paid-in Capital | $0 | $0 | $0 |
| Retained Earnings | $0 | $0 | ($2,049) |
| Earnings | $0 | $0 | $3,313 |
| Total Capital | $0 | $0 | $1,264 |
| Total Capital and Liabilities | $0 | $0 | $5,899 |
| Other Inputs | |||
| Payment Days | 0 | 0 | 0 |
Products and Services
Herr Haar realizes that good hair starts from within, so Herr Haar will provide not only hair care and replacements for all types of hair, but also the finest hair products and vitamins, taking care of both inside and out. Herr Haar will also provide day spa services, such as massages and facials, and assistance in management of care received.
Hair replacement
The owners will provide all of the hair replacement services and some of the facials. Hair replacement services offered include Great Lengths and Le Metric, as well as more traditional methods, including wigs and smaller hairpieces.
Other Hair Styling and Skin Services
The facility also includes four extra beauty booths, which we will rent out to other cosmetologists for 6 month contracts. We have already negotiated terms for three of the booths with exceptional local cosmetologists. These professionals will provide standard styling services, such as haircuts, coloring, and styling.

Massages
In addition, the facility contains a separate room which will be used for massages, aromatherapy, and craniosacral therapy. We have hired two part-time Licensed Massage Therapists with 8 and 5 years of experience in spa settings, respectively, to provide these services.
Market Analysis Summary
Hair Replacement Market
The hair replacement industry earns more than $1 billion/year in the United States alone. Millions of hair-loss sufferers are reduced to trying quack remedies they see on TV because there are no professional hair replacement services in their area. When presented with real treatments that work, many clients are amazed, having given up on really receiving help.
Herr Haar is committed to helping hair loss sufferers of both genders in the Anytown area reclaim their looks, their self-respect, and their dignity by providing professional services that will remedy their problems.
Salon and Beauty Spa Market
Herr Haar’s expanded product and service offerings will also place it in the even larger spa and beauty salon industry. In 2001, according to the U.S. Census, beauty salons reached revenue of $20.8 billion within the United States.
A typical full-service hair and salon business offers most of the following services:
- Hair: haircuts, trims and styling; highlights/foils & weaving; hair & scalp treatments; relaxers, perms; colors; shampoo and conditioning; curling, reconstructing, permanent waving.
- Nails: manicures, pedicures, polish, sculptured nails, nail repair, hand conditioning treatments.
- Skin Care: Facials, body waxing, massage.
- Sale of professional hair/beauty products: Many salon businesses also offer a wide range of hair and beauty products in order to provide everything a customer needs in one convenient location.
Herr Haar will not offer manicures or pedicures in the next two years, although we will consider expanding our services to include these if customer demand and cash flows warrant it. There are three nail salons within 10 minutes of Herr Haar, so competition is high.
4.1 Market Segmentation
According to the U.S. Census, in 2000, Anytown had an overall population of 360,890. Of these, the majority are caucasian (80%), and roughly half were married couples, with or without children. 60% of Anytown population owned their own house, and the median household income was $45,081. The local economy is based heavily on tourism, although it has recently gained a strong foothold in the electronics, high-technology, and manufacturing industries. Anytown has seen a strong population growth over the last 25 years.
Herr Haar will target customers with an average to above-average income level ($50,000 to $150,000 household incomes), seeking hair replacement and hair, skin, and bodycare services. Although our clients need different services, their underlying needs are much the same: to be treated with respect and dignity; to feel good about their appearance; and to be pampered now and then.
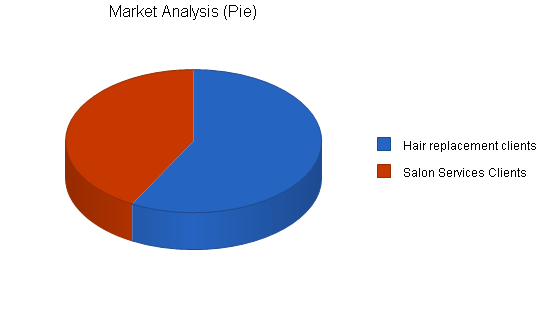
Hair replacement clients
About 50% of the general population will suffer some hair loss by the age of 50; many expect and tolerate this. However, for some people, especially women, hair loss is a dramatic and traumatic event. When hair loss accompanies a major illness, such as cancer, it is even more devastating. The numbers in the following table reflect potential hair replacement clients within 1 hour’s drive of our location.
- Cancer patients: Anytown has a world-renowned cancer center, and is just one hour from the University of Colorado’s cancer treatment center in Aurora. We will advertise our presence more visibly to doctors, therapists, and patients at these centers, to let them know how we can help patients maintain a sense of normalcy during the stress of cancer treatment.
- Female hair loss: Over 25 million American women suffer the effects of female hair loss, and many have no idea what causes it or how to treat it. By integrating hair replacement services into the context of a traditional “salon,” we hope to turn what could be a stigmatizing experience into just another day at the beauty parlor.
- Male pattern baldness: Once considered just a fact of life, male pattern baldness is now being viewed as a treatable disease. Men are also paying more attention to their personal grooming, and professional men are willing to pay higher prices for the luxury of a salon atmosphere and the reassurance of using professionally-trained cosmetologists. We will market to this target segment with the promise of a better, more attractive appearance.
Salon clients (hair styling, skin care, and body work)
Going to the beauty salon has been a female tradition for the last 100 years, whether for a haircut, styling before a big event, or a simple indulgence. The growing interest in professional hair and skin care among men has expanded our client base greatly. The following table includes potential clients within Anytown.
| Market Analysis | |||||||
| 2004 | 2005 | 2006 | 2007 | 2008 | |||
| Potential Customers | Growth | CAGR | |||||
| Hair replacement clients | 3% | 275,000 | 283,250 | 291,748 | 300,500 | 309,515 | 3.00% |
| Salon Services Clients | 5% | 200,000 | 210,000 | 220,500 | 231,525 | 243,101 | 5.00% |
| Total | 3.86% | 475,000 | 493,250 | 512,248 | 532,025 | 552,616 | 3.86% |
4.2 Target Market Segment Strategy
Our target market segments are fairly broad, in part because our services appeal to such a wide range of people. We are focusing on a slightly upscale target market, who can afford our salon services on a regular basis and not just as an occasional treat, because satisfied repeat customers are the backbone of the salon industry.
For the hair replacement services, we are targeting three different groups: cancer patients, women with hair loss, and men with male-pattern baldness. Although we have listed these together in the market analysis table, we will use slightly different marketing tactics with each group. Many of these customers will come to us only a few times, especially if their hair loss is temporary (post-natal hair loss and cancer patients, especially). Others will remain loyal customers for years, coming in for repeat treatments or new wigs. In both cases, our marketing efforts need to establish our reputation as legitimate, skilled professionals who can solve their hair loss problems.
4.3 Service Business Analysis
The beauty spa and salon industry is decentralized, and contains numerous small businesses and franchises. As a more upscale salon, and especially as one with a significant focus on male beauty needs, Herr Haar does not fit the “chain” model. Similar businesses gain initial clientele through print and media advertising, but maintain and expand their clientele by consistently satisfying their customers, generating not only repeat business, but word of mouth referrals. Many people will switch salons if a friend or relative is getting consistently good haircuts and expressing satisfaction with the services of a particular salon.
Most similar salons are owner operated, with additional hairstyling or station employees, or with independently contracted stylists who work on commission. (Herr Haar uses a mix of these two models.)
The hair replacement industry is split between large, international chains offering drugs, dyes, and other products, and smaller local businesses specializing in customized treatment, including surgery. We clearly fit into the latter category, and buy some of our products from the national chains.
4.3.1 Competition and Buying Patterns
Hair replacement
In Anytown, there really is no serious competition for hair replacement. There are a few salons that offer some forms of extensions, but not with the years of experience available at Herr Haar.
Beauty Salon
We commonly hear complaints from Anytown residents that there are few salons that take care of the whole person with the services Herr Haar will offer. Clients have also expressed the wish for a salon that is not only professional looking, but also has the skill to back up the salon.
Potential clients seeking a good salon experience are looking for good quality, professional, clean and luxurious atmosphere, and skilled staff. Among our target market, they are quite willing to pay more for such elements. In fact, the price premium gives our service the feeling of being an affordable luxury, like gourmet coffee, which enhances our customers’ identities as upscale, trendy people.
The most important factor, hands down, for the success of a salon is satisfied customers. Word of mouth is our biggest way of building clientele.
Strategy and Implementation Summary
Our primary focus on the next year is to incorporate our existing services into a full-scale salon concept, so that hair replacement is seen as just one more hair service option. We will leverage our skills and reputation and our highly visible new location to increase our client base with more extensive marketing campaigns on the benefits of hair replacement.
We will continue to provide great service, and will track our sales and marketing goals as we go. We will work with our independent stylists to ensure a consistent level of quality and customer service at Herr Haar. We will train them in some of the cosmetic forms of hair replacement treatment, such as extensions, so as to incorporate some of that business into the “salon” portion of the business, further de-stigmatizing it.
5.1 Competitive Edge
Herr Haar will be a place to enjoy a relaxed atmosphere, where the whole person is taken care of. Unlike a typical salon, we will provide not only basic hair care and products for hair health, but also hair replacements, massage, and assistance in maintaining care greatly.
Although our primary focus is on male clients seeking hair styling and/or hair replacement therapies, two of our contracted stylists are coming from very upscale boutiques and will bring with them a significant female clientele.
Our competitive edges are:
- Skilled and experienced staff
- Help for all hair types (thick, thinning, balding, and anything in between)
- Full-scale salon, not just hair care
- New location, with high visibility
- Existing client base of owners and stylists
5.2 Marketing Strategy
Herr Haar’s new location will provide easier access and greater visibility than allowed by our present space. The surrounding area is growing rapidly, and Herr Haar will be able to reach its target market, as well as increasing walk-ins. There is an increasing trend among well-off couples for both to use the same spa or salon, although not necessarily at the same time. We will use our services for each gender to “pull in” spouses and partners seeking quality hair, skin and body care.
One of the best ways to market Herr Haar is to satisfy clients. When a client leaves our business with a new look, he or she is broadcasting our name and quality to the public. Many of our clients will be referrals from existing clients.
On the other hand, for hair replacement systems, it has been our experience that clients do not talk about hair care problems, existing, or other additions because they look so natural that they don’t want anyone to know that it is not their hair. Therefore, our strategy has been to use the yellow page ads and television, to inform people that there is a place where they can go and take care of hair loss problems, in a convenient and private place. We will be adding some new, targeted marketing strategies to supplement our existing ones.
We will target our three different hair replacement groups directly: we will liase with doctors and therapists at the Anytown Cancer Treatment Center, and the University of Colorado Cancer Center; we will distribute pamphlets and flyers to local OB/GYNs and midwives about our services for post-natal female hair loss, and send mailings to all primary care doctors in Anytown who treat women; and for clients with male-pattern baldness,we will place ads in the local paper next to men’s clothing advertisements and in the weekly women’s fashion insert, on the theory that their wives may show them the ads.
5.3 Sales Strategy
Herr Haar provides the highest quality replacement services such as Great Lengths, and Le Metric, while the stylists are committed to continual education in the field of hair replacement as well as basic hair care. Herr Haar will also provide products that were used on the client, and will encourage the person to continue using the products to aid in maintaining the services local. Our sales strategy relies on continuously high quality, prompt service in a pleasant atmosphere, where clients are treated as people, not heads of hair.
We will offer every client complimentary coffee or tea while they wait. All of our staff will be trained to be discreet and compassionate toward our clients with hair replacement needs; none of our verbal communications in front of other clients will let on whether someone has had hair replacement treatments. The owners will also make themselves available by appointment for non-standard times, if a hair replacement client cannot come in during regular hours, or wants a consultation when no other clients are around.
We will also offer special discounts and promotions to build the client base in our new location, including 10% discounts when clients refer new customers.
5.3.1 Sales Forecast
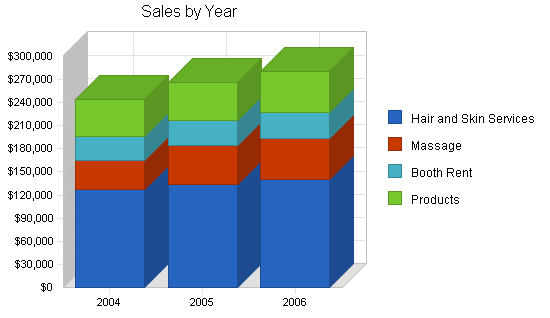
The sales forecast table shows our expectations for the next three years. The attached appendix shows the monthly growth.
The first category, hair and skin services, includes revenue generated by the owners’ work (hair replacement and some of the facials). We also collect all massage revenues, and absorb all direct costs for products used in these services and laundering of massage table coverings.
We do not collect the revenue from our affiliates’ services (the other four stylists), but instead receive a monthly booth rental, listed below, which covers shared costs of using the receptionist, the payment system and the utilities, and a modest profit.

| Sales Forecast | |||
| 2004 | 2005 | 2006 | |
| Sales | |||
| Hair and Skin Services | $127,337 | $133,704 | $140,389 |
| Massage | $38,150 | $50,139 | $52,646 |
| Booth Rent | $31,200 | $32,760 | $34,398 |
| Products | $47,751 | $50,139 | $52,646 |
| Total Sales | $244,438 | $266,742 | $280,079 |
| Direct Cost of Sales | 2004 | 2005 | 2006 |
| Hair Services | $31,834 | $33,426 | $35,097 |
| Massage | $763 | $1,003 | $1,053 |
| Products | $23,876 | $25,069 | $26,323 |
| Subtotal Direct Cost of Sales | $56,473 | $59,498 | $62,473 |
Management Summary
Jane Whigg: Owner. Jane has been a cosmetologist for 27 years. Jane has ample experience at managing a successful salon, having run three salons in the past. She has owned and operated Herr Haar for the last six months. Jane has the drive, determination, skill, and excellent people skills to give clients just what they need to make this business a true success.
Joan Whigg: Co-owner. Joan has been a cosmetologist for three years. Joan is a highly talented beautician with the drive to increase her knowledge and be a true asset to the company. Joan is knowledgeable in many areas of the business, therefore making herself useful in all avenues of the business.
6.1 Personnel Plan
The personnel plan calls for a receptionist who will greet customers and receive payments for services and perhaps a little bookkeeping. There will also be two cosmetologists on payroll (the owners) as well as the two part-time massage therapists. The other four stylists will be independent sole proprietors who rent booths from us.
| Personnel Plan | |||
| 2004 | 2005 | 2006 | |
| Receptionist | $15,360 | $18,000 | $20,000 |
| Massage Therapists | $22,675 | $25,069 | $26,323 |
| Cosmetologist (Phyllis) | $30,720 | $50,139 | $52,646 |
| Cosmetologist (Phoebe) | $38,400 | $41,000 | $43,000 |
| Total People | 6 | 6 | 6 |
| Total Payroll | $107,155 | $134,208 | $141,969 |
Financial Plan
Herr Haar is expecting growth of at least 5% each year and we anticipate the increase to continue as new clients come to the salon. Our financial plan for the next three years includes several new revenue streams from massage therapy and booth rental from affiliated stylists. The projections for the first year are therefore much different from the starting balances for our last year, even considering that the past performance included only six months of data. The major accompanying expense is a much higher personnel payroll, as well as higher rent for the new location, to accommodate all these people.
Our advertising expenses will be higher than those of similar businesses, because after only six months in business, we are still a “start-up,” and because our new location and services will be unknown to many in the community without heavy advertising. We will work hard to keep costs down and to use word-of-mouth as much as possible to build our business.
Herr Haar is seeking financing to achieve the goal of becoming a great hair clinic which focuses on the total wellness of clients. We will use this money to renovate the new space, so that we can build our clientele base, increase revenues, maintain a positive cash flow, and steadily increase the net worth of the business with good management.
7.1 Important Assumptions
The following table shows important financials assumptions for our plan, including a projected interest rate for the short-term loan we are seeking. We are also assuming:
- No serious disability on the part of either owner which prevents her from working
- No new direct competition for hair replacement services in Anytown in the next three years
- No sudden changes in licensing or technology which would make our services obsolete
| General Assumptions | |||
| 2004 | 2005 | 2006 | |
| Plan Month | 1 | 2 | 3 |
| Current Interest Rate | 10.00% | 10.00% | 10.00% |
| Long-term Interest Rate | 10.00% | 10.00% | 10.00% |
| Tax Rate | 30.00% | 30.00% | 30.00% |
| Other | 0 | 0 | 0 |
7.2 Break-even Analysis
For our break-even analysis, we assume running costs which include full payroll, rent, utilities, and an estimation of other running costs. Payroll alone, at our present rate, is only $8,930/month. We will reach our break-even point at the new location in March.

| Break-even Analysis | |
| Monthly Revenue Break-even | $17,601 |
| Assumptions: | |
| Average Percent Variable Cost | 23% |
| Estimated Monthly Fixed Cost | $13,535 |
7.3 Projected Profit and Loss
We expect net profit to reach $17,795 at the end of the next fiscal year. We will take on a smaller net profit in years two and three in order to increase the salaries of our workers as the salon becomes busier. Happy employees make for good customer experiences, which generates increased revenues.


| Pro Forma Profit and Loss | |||
| 2004 | 2005 | 2006 | |
| Sales | $244,438 | $266,742 | $280,079 |
| Direct Cost of Sales | $56,473 | $59,498 | $62,473 |
| Other Costs of Goods | $0 | $0 | $0 |
| Total Cost of Sales | $56,473 | $59,498 | $62,473 |
| Gross Margin | $187,965 | $207,244 | $217,606 |
| Gross Margin % | 76.90% | 77.69% | 77.69% |
| Expenses | |||
| Payroll | $107,155 | $134,208 | $141,969 |
| Marketing/Promotion | $5,400 | $5,400 | $5,400 |
| Depreciation | $204 | $220 | $220 |
| Rent | $21,000 | $21,000 | $21,000 |
| Utilities | $4,488 | $4,488 | $4,488 |
| Insurance | $996 | $996 | $996 |
| Payroll Taxes | $16,073 | $20,131 | $0 |
| Merchant Account Fees | $1,800 | $2,000 | $2,000 |
| Moving Expenses | $2,300 | $0 | $0 |
| Redecorating New Location | $3,000 | $0 | $0 |
| Total Operating Expenses | $162,416 | $188,444 | $176,073 |
| Profit Before Interest and Taxes | $25,549 | $18,800 | $41,533 |
| EBITDA | $25,753 | $19,020 | $41,753 |
| Interest Expense | $128 | $0 | $0 |
| Taxes Incurred | $7,626 | $5,640 | $12,460 |
| Net Profit | $17,795 | $13,160 | $29,073 |
| Net Profit/Sales | 7.28% | 4.93% | 10.38% |
7.4 Projected Cash Flow
Herr Haar expects to manage cash flow conservatively over the next three years. The business will generate more than enough cash flow to cover all of its expenses, and we will pace growth slowly.
In addition to showing repayment of the loan, the Cash Flow table, below, shows the purchase of new current assets in January. We will purchase a water- and energy-efficient washing machine and dryer in the first month to clean towels and drapes from hair services and massage.

| Pro Forma Cash Flow | |||
| 2004 | 2005 | 2006 | |
| Cash Received | |||
| Cash from Operations | |||
| Cash Sales | $244,438 | $266,742 | $280,079 |
| Subtotal Cash from Operations | $244,438 | $266,742 | $280,079 |
| Additional Cash Received | |||
| Sales Tax, VAT, HST/GST Received | $0 | $0 | $0 |
| New Current Borrowing | $4,000 | $0 | $0 |
| New Other Liabilities (interest-free) | $0 | $0 | $0 |
| New Long-term Liabilities | $0 | $0 | $0 |
| Sales of Other Current Assets | $0 | $0 | $0 |
| Sales of Long-term Assets | $0 | $0 | $0 |
| New Investment Received | $0 | $0 | $0 |
| Subtotal Cash Received | $248,438 | $266,742 | $280,079 |
| Expenditures | 2004 | 2005 | 2006 |
| Expenditures from Operations | |||
| Cash Spending | $107,155 | $134,208 | $141,969 |
| Bill Payments | $115,270 | $121,706 | $109,986 |
| Subtotal Spent on Operations | $222,425 | $255,915 | $251,955 |
| Additional Cash Spent | |||
| Sales Tax, VAT, HST/GST Paid Out | $0 | $0 | $0 |
| Principal Repayment of Current Borrowing | $4,000 | $0 | $0 |
| Other Liabilities Principal Repayment | $600 | $535 | $0 |
| Long-term Liabilities Principal Repayment | $0 | $0 | $0 |
| Purchase Other Current Assets | $1,400 | $0 | $0 |
| Purchase Long-term Assets | $0 | $0 | $0 |
| Dividends | $0 | $0 | $0 |
| Subtotal Cash Spent | $228,425 | $256,450 | $251,955 |
| Net Cash Flow | $20,013 | $10,292 | $28,124 |
| Cash Balance | $21,044 | $31,337 | $59,461 |
7.5 Projected Balance Sheet
The Balance Sheet shows our projected steady increase in net worth. With no accounts receivable, our cash sales go immediately into our assets. We also expect a steady increase in retained earnings.
| Pro Forma Balance Sheet | |||
| 2004 | 2005 | 2006 | |
| Assets | |||
| Current Assets | |||
| Cash | $21,044 | $31,337 | $59,461 |
| Inventory | $6,053 | $6,377 | $6,696 |
| Other Current Assets | $3,075 | $3,075 | $3,075 |
| Total Current Assets | $30,172 | $40,789 | $69,232 |
| Long-term Assets | |||
| Long-term Assets | $1,800 | $1,800 | $1,800 |
| Accumulated Depreciation | $330 | $550 | $770 |
| Total Long-term Assets | $1,470 | $1,250 | $1,030 |
| Total Assets | $31,642 | $42,039 | $70,262 |
| Liabilities and Capital | 2004 | 2005 | 2006 |
| Current Liabilities | |||
| Accounts Payable | $12,049 | $9,820 | $8,970 |
| Current Borrowing | $0 | $0 | $0 |
| Other Current Liabilities | $535 | $0 | $0 |
| Subtotal Current Liabilities | $12,584 | $9,820 | $8,970 |
| Long-term Liabilities | $0 | $0 | $0 |
| Total Liabilities | $12,584 | $9,820 | $8,970 |
| Paid-in Capital | $0 | $0 | $0 |
| Retained Earnings | $1,264 | $19,059 | $32,219 |
| Earnings | $17,795 | $13,160 | $29,073 |
| Total Capital | $19,059 | $32,219 | $61,292 |
| Total Liabilities and Capital | $31,642 | $42,039 | $70,262 |
| Net Worth | $19,059 | $32,219 | $61,292 |
7.6 Business Ratios
Business ratios for the years of this plan are shown below. Industry profile ratios based on the Standard Industrial Classification (SIC) Index code 7231, Cosmetologist and personal hygiene salon, are shown for comparison.
Our huge sales growth in the first year is, as stated before, due to a radical change in the revenue structure of the business in the new location. Although our asset base is smaller than many similar businesses, partly because we are leasing a location, our debt to asset ratio is quite good compared to the industry standard.
| Ratio Analysis | ||||
| 2004 | 2005 | 2006 | Industry Profile | |
| Sales Growth | 421.24% | 9.12% | 5.00% | 0.43% |
| Percent of Total Assets | ||||
| Inventory | 19.13% | 15.17% | 9.53% | 5.02% |
| Other Current Assets | 9.72% | 7.31% | 4.38% | 40.05% |
| Total Current Assets | 95.35% | 97.03% | 98.53% | 57.62% |
| Long-term Assets | 4.65% | 2.97% | 1.47% | 42.38% |
| Total Assets | 100.00% | 100.00% | 100.00% | 100.00% |
| Current Liabilities | 39.77% | 23.36% | 12.77% | 24.84% |
| Long-term Liabilities | 0.00% | 0.00% | 0.00% | 21.36% |
| Total Liabilities | 39.77% | 23.36% | 12.77% | 46.20% |
| Net Worth | 60.23% | 76.64% | 87.23% | 53.80% |
| Percent of Sales | ||||
| Sales | 100.00% | 100.00% | 100.00% | 100.00% |
| Gross Margin | 76.90% | 77.69% | 77.69% | 100.00% |
| Selling, General & Administrative Expenses | 52.01% | 52.44% | 52.44% | 74.37% |
| Advertising Expenses | #NAME? | 0.08% | 0.08% | 1.51% |
| Profit Before Interest and Taxes | 10.45% | 7.05% | 14.83% | 3.37% |
| Main Ratios | ||||
| Current | 2.40 | 4.15 | 7.72 | 1.73 |
| Quick | 1.92 | 3.50 | 6.97 | 1.33 |
| Total Debt to Total Assets | 39.77% | 23.36% | 12.77% | 58.00% |
| Pre-tax Return on Net Worth | 133.38% | 58.35% | 67.76% | 7.63% |
| Pre-tax Return on Assets | 80.34% | 44.72% | 59.11% | 18.17% |
| Additional Ratios | 2004 | 2005 | 2006 | |
| Net Profit Margin | 7.28% | 4.93% | 10.38% | n.a |
| Return on Equity | 93.37% | 40.85% | 47.43% | n.a |
| Activity Ratios | ||||
| Inventory Turnover | 12.00 | 9.57 | 9.56 | n.a |
| Accounts Payable Turnover | 10.28 | 12.17 | 12.17 | n.a |
| Payment Days | 28 | 33 | 31 | n.a |
| Total Asset Turnover | 7.73 | 6.35 | 3.99 | n.a |
| Debt Ratios | ||||
| Debt to Net Worth | 0.66 | 0.30 | 0.15 | n.a |
| Current Liab. to Liab. | 1.00 | 1.00 | 1.00 | n.a |
| Liquidity Ratios | ||||
| Net Working Capital | $17,589 | $30,969 | $60,262 | n.a |
| Interest Coverage | 199.08 | 0.00 | 0.00 | n.a |
| Additional Ratios | ||||
| Assets to Sales | 0.13 | 0.16 | 0.25 | n.a |
| Current Debt/Total Assets | 40% | 23% | 13% | n.a |
| Acid Test | 1.92 | 3.50 | 6.97 | n.a |
| Sales/Net Worth | 12.83 | 8.28 | 4.57 | n.a |
| Dividend Payout | 0.00 | 0.00 | 0.00 | n.a |
Appendix
| Sales Forecast | |||||||||||||
| Jan | Feb | Mar | Apr | May | Jun | Jul | Aug | Sep | Oct | Nov | Dec | ||
| Sales | |||||||||||||
| Hair and Skin Services | 0% | $8,000 | $8,400 | $8,820 | $9,261 | $9,724 | $10,210 | $10,721 | $11,257 | $11,820 | $12,411 | $13,031 | $13,683 |
| Massage | 0% | $3,000 | $3,060 | $3,120 | $3,120 | $3,120 | $3,150 | $3,180 | $3,210 | $3,270 | $3,270 | $3,320 | $3,330 |
| Booth Rent | 0% | $2,600 | $2,600 | $2,600 | $2,600 | $2,600 | $2,600 | $2,600 | $2,600 | $2,600 | $2,600 | $2,600 | $2,600 |
| Products | 0% | $3,000 | $3,150 | $3,308 | $3,473 | $3,647 | $3,829 | $4,020 | $4,221 | $4,432 | $4,654 | $4,887 | $5,131 |
| Total Sales | $16,600 | $17,210 | $17,848 | $18,454 | $19,091 | $19,789 | $20,521 | $21,288 | $22,122 | $22,935 | $23,838 | $24,744 | |
| Direct Cost of Sales | Jan | Feb | Mar | Apr | May | Jun | Jul | Aug | Sep | Oct | Nov | Dec | |
| Hair Services | $2,000 | $2,100 | $2,205 | $2,315 | $2,431 | $2,553 | $2,680 | $2,814 | $2,955 | $3,103 | $3,258 | $3,421 | |
| Massage | $60 | $61 | $62 | $62 | $62 | $63 | $64 | $64 | $65 | $65 | $66 | $67 | |
| Products | $1,500 | $1,575 | $1,654 | $1,736 | $1,823 | $1,914 | $2,010 | $2,111 | $2,216 | $2,327 | $2,443 | $2,566 | |
| Subtotal Direct Cost of Sales | $3,560 | $3,736 | $3,921 | $4,114 | $4,317 | $4,530 | $4,754 | $4,989 | $5,236 | $5,495 | $5,768 | $6,053 | |
| Personnel Plan | |||||||||||||
| Jan | Feb | Mar | Apr | May | Jun | Jul | Aug | Sep | Oct | Nov | Dec | ||
| Receptionist | 0% | $1,280 | $1,280 | $1,280 | $1,280 | $1,280 | $1,280 | $1,280 | $1,280 | $1,280 | $1,280 | $1,280 | $1,280 |
| Massage Therapists | 0% | $1,800 | $1,830 | $1,860 | $1,860 | $1,860 | $1,875 | $1,890 | $1,905 | $1,935 | $1,935 | $1,960 | $1,965 |
| Cosmetologist (Phyllis) | 0% | $2,560 | $2,560 | $2,560 | $2,560 | $2,560 | $2,560 | $2,560 | $2,560 | $2,560 | $2,560 | $2,560 | $2,560 |
| Cosmetologist (Phoebe) | 0% | $3,200 | $3,200 | $3,200 | $3,200 | $3,200 | $3,200 | $3,200 | $3,200 | $3,200 | $3,200 | $3,200 | $3,200 |
| Total People | 6 | 6 | 6 | 6 | 6 | 6 | 6 | 6 | 6 | 6 | 6 | 6 | |
| Total Payroll | $8,840 | $8,870 | $8,900 | $8,900 | $8,900 | $8,915 | $8,930 | $8,945 | $8,975 | $8,975 | $9,000 | $9,005 | |
| Pro Forma Profit and Loss | |||||||||||||
| Jan | Feb | Mar | Apr | May | Jun | Jul | Aug | Sep | Oct | Nov | Dec | ||
| Sales | $16,600 | $17,210 | $17,848 | $18,454 | $19,091 | $19,789 | $20,521 | $21,288 | $22,122 | $22,935 | $23,838 | $24,744 | |
| Direct Cost of Sales | $3,560 | $3,736 | $3,921 | $4,114 | $4,317 | $4,530 | $4,754 | $4,989 | $5,236 | $5,495 | $5,768 | $6,053 | |
| Other Costs of Goods | $0 | $0 | $0 | $0 | $0 | $0 | $0 | $0 | $0 | $0 | $0 | $0 | |
| Total Cost of Sales | $3,560 | $3,736 | $3,921 | $4,114 | $4,317 | $4,530 | $4,754 | $4,989 | $5,236 | $5,495 | $5,768 | $6,053 | |
| Gross Margin | $13,040 | $13,474 | $13,926 | $14,340 | $14,774 | $15,259 | $15,767 | $16,299 | $16,886 | $17,440 | $18,070 | $18,691 | |
| Gross Margin % | 78.55% | 78.29% | 78.03% | 77.71% | 77.39% | 77.11% | 76.83% | 76.56% | 76.33% | 76.04% | 75.81% | 75.54% | |
| Expenses | |||||||||||||
| Payroll | $8,840 | $8,870 | $8,900 | $8,900 | $8,900 | $8,915 | $8,930 | $8,945 | $8,975 | $8,975 | $9,000 | $9,005 | |
| Marketing/Promotion | $0 | $900 | $0 | $900 | $0 | $900 | $0 | $900 | $0 | $900 | $0 | $900 | |
| Depreciation | $17 | $17 | $17 | $17 | $17 | $17 | $17 | $17 | $17 | $17 | $17 | $17 | |
| Rent | $1,750 | $1,750 | $1,750 | $1,750 | $1,750 | $1,750 | $1,750 | $1,750 | $1,750 | $1,750 | $1,750 | $1,750 | |
| Utilities | $374 | $374 | $374 | $374 | $374 | $374 | $374 | $374 | $374 | $374 | $374 | $374 | |
| Insurance | $83 | $83 | $83 | $83 | $83 | $83 | $83 | $83 | $83 | $83 | $83 | $83 | |
| Payroll Taxes | 15% | $1,326 | $1,331 | $1,335 | $1,335 | $1,335 | $1,337 | $1,340 | $1,342 | $1,346 | $1,346 | $1,350 | $1,351 |
| Merchant Account Fees | $150 | $150 | $150 | $150 | $150 | $150 | $150 | $150 | $150 | $150 | $150 | $150 | |
| Moving Expenses | 15% | $2,300 | $0 | $0 | $0 | $0 | $0 | $0 | $0 | $0 | $0 | $0 | $0 |
| Redecorating New Location | $3,000 | $0 | $0 | $0 | $0 | $0 | $0 | $0 | $0 | $0 | $0 | $0 | |
| Total Operating Expenses | $17,840 | $13,475 | $12,609 | $13,509 | $12,609 | $13,526 | $12,644 | $13,561 | $12,695 | $13,595 | $12,724 | $13,630 | |
| Profit Before Interest and Taxes | ($4,800) | ($1) | $1,317 | $831 | $2,165 | $1,733 | $3,124 | $2,738 | $4,190 | $3,844 | $5,346 | $5,061 | |
| EBITDA | ($4,783) | $16 | $1,334 | $848 | $2,182 | $1,750 | $3,141 | $2,755 | $4,207 | $3,861 | $5,363 | $5,078 | |
| Interest Expense | $23 | $23 | $20 | $18 | $15 | $12 | $9 | $6 | $3 | $0 | $0 | $0 | |
| Taxes Incurred | ($1,447) | ($7) | $389 | $244 | $645 | $516 | $934 | $820 | $1,256 | $1,153 | $1,604 | $1,518 | |
| Net Profit | ($3,376) | ($17) | $908 | $569 | $1,505 | $1,205 | $2,180 | $1,913 | $2,931 | $2,691 | $3,742 | $3,543 | |
| Net Profit/Sales | -20.34% | -0.10% | 5.09% | 3.08% | 7.88% | 6.09% | 10.63% | 8.98% | 13.25% | 11.73% | 15.70% | 14.32% | |
| Pro Forma Cash Flow | |||||||||||||
| Jan | Feb | Mar | Apr | May | Jun | Jul | Aug | Sep | Oct | Nov | Dec | ||
| Cash Received | |||||||||||||
| Cash from Operations | |||||||||||||
| Cash Sales | $16,600 | $17,210 | $17,848 | $18,454 | $19,091 | $19,789 | $20,521 | $21,288 | $22,122 | $22,935 | $23,838 | $24,744 | |
| Subtotal Cash from Operations | $16,600 | $17,210 | $17,848 | $18,454 | $19,091 | $19,789 | $20,521 | $21,288 | $22,122 | $22,935 | $23,838 | $24,744 | |
| Additional Cash Received | |||||||||||||
| Sales Tax, VAT, HST/GST Received | 0.00% | $0 | $0 | $0 | $0 | $0 | $0 | $0 | $0 | $0 | $0 | $0 | $0 |
| New Current Borrowing | $4,000 | $0 | $0 | $0 | $0 | $0 | $0 | $0 | $0 | $0 | $0 | $0 | |
| New Other Liabilities (interest-free) | $0 | $0 | $0 | $0 | $0 | $0 | $0 | $0 | $0 | $0 | $0 | $0 | |
| New Long-term Liabilities | $0 | $0 | $0 | $0 | $0 | $0 | $0 | $0 | $0 | $0 | $0 | $0 | |
| Sales of Other Current Assets | $0 | $0 | $0 | $0 | $0 | $0 | $0 | $0 | $0 | $0 | $0 | $0 | |
| Sales of Long-term Assets | $0 | $0 | $0 | $0 | $0 | $0 | $0 | $0 | $0 | $0 | $0 | $0 | |
| New Investment Received | $0 | $0 | $0 | $0 | $0 | $0 | $0 | $0 | $0 | $0 | $0 | $0 | |
| Subtotal Cash Received | $20,600 | $17,210 | $17,848 | $18,454 | $19,091 | $19,789 | $20,521 | $21,288 | $22,122 | $22,935 | $23,838 | $24,744 | |
| Expenditures | Jan | Feb | Mar | Apr | May | Jun | Jul | Aug | Sep | Oct | Nov | Dec | |
| Expenditures from Operations | |||||||||||||
| Cash Spending | $8,840 | $8,870 | $8,900 | $8,900 | $8,900 | $8,915 | $8,930 | $8,945 | $8,975 | $8,975 | $9,000 | $9,005 | |
| Bill Payments | $3,939 | $13,006 | $8,506 | $8,239 | $9,151 | $8,904 | $9,857 | $9,652 | $10,642 | $10,482 | $11,505 | $11,388 | |
| Subtotal Spent on Operations | $12,779 | $21,876 | $17,406 | $17,139 | $18,051 | $17,819 | $18,787 | $18,597 | $19,617 | $19,457 | $20,505 | $20,393 | |
| Additional Cash Spent | |||||||||||||
| Sales Tax, VAT, HST/GST Paid Out | $0 | $0 | $0 | $0 | $0 | $0 | $0 | $0 | $0 | $0 | $0 | $0 | |
| Principal Repayment of Current Borrowing | $0 | $0 | $500 | $500 | $500 | $500 | $500 | $500 | $500 | $500 | $0 | $0 | |
| Other Liabilities Principal Repayment | $0 | $0 | $0 | $0 | $0 | $0 | $100 | $100 | $100 | $100 | $100 | $100 | |
| Long-term Liabilities Principal Repayment | $0 | $0 | $0 | $0 | $0 | $0 | $0 | $0 | $0 | $0 | $0 | $0 | |
| Purchase Other Current Assets | $1,400 | $0 | $0 | $0 | $0 | $0 | $0 | $0 | $0 | $0 | $0 | $0 | |
| Purchase Long-term Assets | $0 | $0 | $0 | $0 | $0 | $0 | $0 | $0 | $0 | $0 | $0 | $0 | |
| Dividends | $0 | $0 | $0 | $0 | $0 | $0 | $0 | $0 | $0 | $0 | $0 | $0 | |
| Subtotal Cash Spent | $14,179 | $21,876 | $17,906 | $17,639 | $18,551 | $18,319 | $19,387 | $19,197 | $20,217 | $20,057 | $20,605 | $20,493 | |
| Net Cash Flow | $6,421 | ($4,666) | ($58) | $815 | $540 | $1,470 | $1,134 | $2,091 | $1,905 | $2,878 | $3,233 | $4,251 | |
| Cash Balance | $7,452 | $2,787 | $2,729 | $3,543 | $4,083 | $5,553 | $6,687 | $8,778 | $10,683 | $13,561 | $16,794 | $21,044 | |
| Pro Forma Balance Sheet | |||||||||||||
| Jan | Feb | Mar | Apr | May | Jun | Jul | Aug | Sep | Oct | Nov | Dec | ||
| Assets | Starting Balances | ||||||||||||
| Current Assets | |||||||||||||
| Cash | $1,031 | $7,452 | $2,787 | $2,729 | $3,543 | $4,083 | $5,553 | $6,687 | $8,778 | $10,683 | $13,561 | $16,794 | $21,044 |
| Inventory | $1,519 | $3,560 | $3,736 | $3,921 | $4,114 | $4,317 | $4,530 | $4,754 | $4,989 | $5,236 | $5,495 | $5,768 | $6,053 |
| Other Current Assets | $1,675 | $3,075 | $3,075 | $3,075 | $3,075 | $3,075 | $3,075 | $3,075 | $3,075 | $3,075 | $3,075 | $3,075 | $3,075 |
| Total Current Assets | $4,225 | $14,087 | $9,598 | $9,725 | $10,732 | $11,474 | $13,158 | $14,515 | $16,842 | $18,994 | $22,131 | $25,636 | $30,172 |
| Long-term Assets | |||||||||||||
| Long-term Assets | $1,800 | $1,800 | $1,800 | $1,800 | $1,800 | $1,800 | $1,800 | $1,800 | $1,800 | $1,800 | $1,800 | $1,800 | $1,800 |
| Accumulated Depreciation | $126 | $143 | $160 | $177 | $194 | $211 | $228 | $245 | $262 | $279 | $296 | $313 | $330 |
| Total Long-term Assets | $1,674 | $1,657 | $1,640 | $1,623 | $1,606 | $1,589 | $1,572 | $1,555 | $1,538 | $1,521 | $1,504 | $1,487 | $1,470 |
| Total Assets | $5,899 | $15,744 | $11,238 | $11,348 | $12,338 | $13,063 | $14,730 | $16,070 | $18,380 | $20,515 | $23,635 | $27,123 | $31,642 |
| Liabilities and Capital | Jan | Feb | Mar | Apr | May | Jun | Jul | Aug | Sep | Oct | Nov | Dec | |
| Current Liabilities | |||||||||||||
| Accounts Payable | $3,500 | $12,722 | $8,232 | $7,934 | $8,855 | $8,575 | $9,537 | $9,297 | $10,294 | $10,098 | $11,126 | $10,973 | $12,049 |
| Current Borrowing | $0 | $4,000 | $4,000 | $3,500 | $3,000 | $2,500 | $2,000 | $1,500 | $1,000 | $500 | $0 | $0 | $0 |
| Other Current Liabilities | $1,135 | $1,135 | $1,135 | $1,135 | $1,135 | $1,135 | $1,135 | $1,035 | $935 | $835 | $735 | $635 | $535 |
| Subtotal Current Liabilities | $4,635 | $17,857 | $13,367 | $12,569 | $12,990 | $12,210 | $12,672 | $11,832 | $12,229 | $11,433 | $11,861 | $11,608 | $12,584 |
| Long-term Liabilities | $0 | $0 | $0 | $0 | $0 | $0 | $0 | $0 | $0 | $0 | $0 | $0 | $0 |
| Total Liabilities | $4,635 | $17,857 | $13,367 | $12,569 | $12,990 | $12,210 | $12,672 | $11,832 | $12,229 | $11,433 | $11,861 | $11,608 | $12,584 |
| Paid-in Capital | $0 | $0 | $0 | $0 | $0 | $0 | $0 | $0 | $0 | $0 | $0 | $0 | $0 |
| Retained Earnings | ($2,049) | $1,264 | $1,264 | $1,264 | $1,264 | $1,264 | $1,264 | $1,264 | $1,264 | $1,264 | $1,264 | $1,264 | $1,264 |
| Earnings | $3,313 | ($3,376) | ($3,393) | ($2,485) | ($1,916) | ($411) | $794 | $2,974 | $4,887 | $7,818 | $10,509 | $14,252 | $17,795 |
| Total Capital | $1,264 | ($2,112) | ($2,129) | ($1,221) | ($652) | $853 | $2,058 | $4,238 | $6,151 | $9,082 | $11,773 | $15,516 | $19,059 |
| Total Liabilities and Capital | $5,899 | $15,744 | $11,238 | $11,348 | $12,338 | $13,063 | $14,730 | $16,070 | $18,380 | $20,515 | $23,635 | $27,123 | $31,642 |
| Net Worth | $1,264 | ($2,112) | ($2,129) | ($1,221) | ($652) | $853 | $2,058 | $4,238 | $6,151 | $9,082 | $11,773 | $15,516 | $19,059 |


