
Laser Dreams
Executive Summary
Laser Dreams specializes in laser hair removal, electrolysis and microdermabrasion. We are a professional facility, providing state-of-the-art technology and superior quality service. The needs of our patients are our highest priority.
We provide F.D.A approved, gentle and effective hair removal at a fraction of the cost and time of other permanent hair removal methods. We specialize in difficult cases. Unwanted hair can now be treated quickly and effectively using the latest generation lasers.
The lasers of choice are the GentleLASE™ Plus and Lightsheer Diode, which are both FDA approved for “PERMANENT HAIR REDUCTION.” Both lasers give remarkable results that our customers can enjoy with the speed of light. Because both machines have superior cooling devices, the surface of the skin is cooled while the active hair follicles are destroyed.
Laser Dreams is located downtown in the Millman Building. The facility is quickly accessible to the 6,000+ urban professionals that Laser Dreams considers potential customers. Downtown Monroe has experience tremendous growth over the past five years. Many companies and professionals have returned to the downtown area.
Our customers love convenience. They are constantly looking for ways to squeeze more time out of the day. Laser Dreams’ location makes it possible to visit the facility and be back at your job in less than 30 minutes.
Joe Jackson and Allison Fremont, co-owners of Laser Dreams, believe that the location is its competitive advantage. Joe and Allison have both managed laser hair removal centers. They have over ten years of experience between them. They believe that the location will bring in the customer but only excellent customer service is going to keep them there and generate referrals.
1.1 Objectives
The objectives of Laser Dreams are the following:
- Exceed 60% of daily appointment times being filled by the end of the first year of operation.
- Achieve 50% of new customers from referrals by the end of the first year of operation.
- Increase sales by 15% by the end of the second year of operation.
1.2 Mission
The mission of Laser Dreams is the following:
- Create a customer focused environment that promotes referrals.
- Promote the success of our clients in meeting their cosmetic goals.
Company Summary
Laser Dreams specializes in laser hair removal, electrolysis and microdermabrasion. We are a professional facility, providing state-of-the-art technology and superior quality service. We provide F.D.A approved, gentle and effective hair removal at a fraction of the cost and time of other permanent hair removal methods. The program will operate as a general partnership. Both Joe Jackson and Allison Fremont will manage the daily operation of Laser Dreams.
2.1 Company Ownership
Laser Dreams is co-owned by Joe Jackson and Allison Fremont.
2.2 Start-up Summary
The start-up expenses for the Laser Dreams is focused primarily on equipment and treatment rooms. Joe and Allison will each invest $30,000. In addition, the facility will secure a $100,000 long-term loan.

| Start-up | |
| Requirements | |
| Start-up Expenses | |
| Legal | $1,000 |
| Stationery etc. | $100 |
| Brochures | $3,000 |
| Insurance | $1,000 |
| Rent | $3,000 |
| Expensed Equipment | $60,000 |
| Total Start-up Expenses | $68,100 |
| Start-up Assets | |
| Cash Required | $41,900 |
| Other Current Assets | $20,000 |
| Long-term Assets | $30,000 |
| Total Assets | $91,900 |
| Total Requirements | $160,000 |
| Start-up Funding | |
| Start-up Expenses to Fund | $68,100 |
| Start-up Assets to Fund | $91,900 |
| Total Funding Required | $160,000 |
| Assets | |
| Non-cash Assets from Start-up | $50,000 |
| Cash Requirements from Start-up | $41,900 |
| Additional Cash Raised | $0 |
| Cash Balance on Starting Date | $41,900 |
| Total Assets | $91,900 |
| Liabilities and Capital | |
| Liabilities | |
| Current Borrowing | $0 |
| Long-term Liabilities | $100,000 |
| Accounts Payable (Outstanding Bills) | $0 |
| Other Current Liabilities (interest-free) | $0 |
| Total Liabilities | $100,000 |
| Capital | |
| Planned Investment | |
| Investor 1 | $30,000 |
| Investor 2 | $30,000 |
| Additional Investment Requirement | $0 |
| Total Planned Investment | $60,000 |
| Loss at Start-up (Start-up Expenses) | ($68,100) |
| Total Capital | ($8,100) |
| Total Capital and Liabilities | $91,900 |
| Total Funding | $160,000 |
2.3 Company Locations and Facilities
Laser Dreams is located in downtown Monroe, in the Millman Building. The facility is quickly accessible to over 6,000 urban professionals that Laser Dreams considers potential customers.
Products and Services
Laser Dreams’ services and products are as follows:
Services
- Laser hair removal: A laser beam disables hair follicles. It is quick and total areas can be treated in a short time (five weeks) unlike electrolysis that takes months or years to permanently remove hair. One hour for larger areas: arms, back, and legs. Fifteen minutes for small areas: face, chin, lip, neck.
- Electrolysis: Thermolysis, Galvanic and the Blend are offered. Together with laser hair removal it offers a permanent solution to any hair left untreated by the laser, like gray, light blondes and some redheads.
- Waxing: Using only the finest waxes available (suitable for customer skin type) are used for temporary hair removal.
Products
- END-ZIT® : Welcome to the extraordinary world of END-ZIT® Blemish Drying Lotion and family of blemish control and oily skin care products! All products are dermatology tested and approved. By using the END-ZIT® Control Program of cleansing, toning, and treatment, you can eradicate those ghastly zits!
- END-ZIT® Blemish Drying Lotion: An extraordinary, medicated, skin-tone tinted drying lotion formula designed to conceal, while it heals and dries unsightly pimples. Amazingly, most blemish breakouts simply disappear after just a day or two of use.
Market Analysis Summary
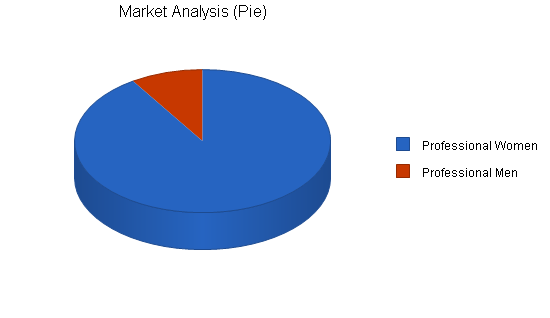
Downtown Monroe has emerged from the recent recession to regain its position as the heart of the city. The growth has been fueled by the increased employment in the city’s high-technology companies. This has attracted a type of professional that is the target customer for Laser Dreams: professional women, ages 21-45.
Another target group are professional men who want excess hair removed. Joe and Allison are aware that these men may be uncomfortable visiting the facility so a side entrance has been setup with a small waiting room to accommodate any customer who wants privacy.
4.1 Market Segmentation
Laser Dreams will focus on two customer groups:
- Urban professional women, ages 21-45;
- Urban professional men, ages 21-35.
| Market Analysis | |||||||
| Year 1 | Year 2 | Year 3 | Year 4 | Year 5 | |||
| Potential Customers | Growth | CAGR | |||||
| Professional Women | 15% | 10,000 | 11,500 | 13,225 | 15,209 | 17,490 | 15.00% |
| Professional Men | 5% | 1,000 | 1,050 | 1,103 | 1,158 | 1,216 | 5.01% |
| Total | 14.19% | 11,000 | 12,550 | 14,328 | 16,367 | 18,706 | 14.19% |
Strategy and Implementation Summary
Laser Dreams will market through the numerous downtown fitness clubs, beauty salons, tanning salons and boutiques. Laser Dreams will offer the first treatment free.
5.1 Competitive Edge
The competitive advantage of Laser Dreams is location. Once we get them in, our advantage is the customer-focused environment we create. We know that each customer is a potential lead to another ten customers.
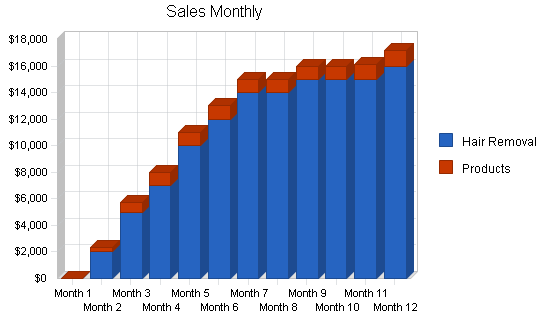
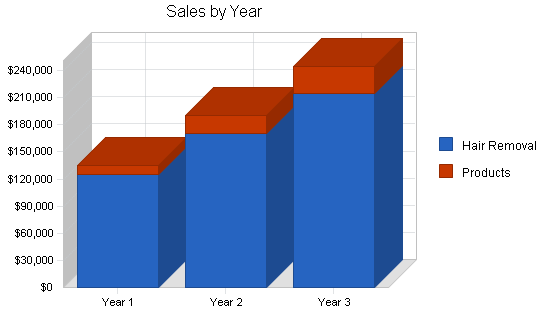
5.2 Sales Forecast
Laser Dreams anticipates that sales will be slow for the first and second month of operation, due to our “first treatment free” promotion. After that point, sales will increase as satisfied customers refer their friends. The following is the sales forecast for three years.
| Sales Forecast | |||
| Year 1 | Year 2 | Year 3 | |
| Sales | |||
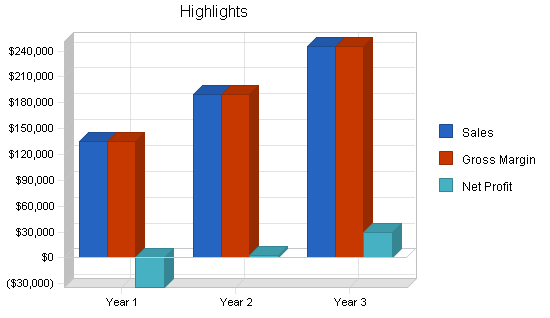
| Hair Removal | $125,000 | $170,000 | $215,000 |
| Products | $10,300 | $20,000 | $30,000 |
| Total Sales | $135,300 | $190,000 | $245,000 |
| Direct Cost of Sales | Year 1 | Year 2 | Year 3 |
| Hair Removal | $0 | $0 | $0 |
| Products | $0 | $0 | $0 |
| Subtotal Direct Cost of Sales | $0 | $0 | $0 |
Personnel Plan
Joe Jackson has been the manager of both the BareAll Laser Center (two years) and the Laser Works (three years). His customer service skills are excellent. With both the BareAll and Laser Works, customer traffic increased by 15% each year.
Allison Fremont set up and managed the laser hair removal section of Maximum Beauty Salon for five years. She supervised another registered electrologist and managed customer relations. Under her leadership, sales grew by 10% each year.

Both Joe and Allison have the following certification and association memberships:
Registered Electrologists (R.E.)
Certified Clinical Electrologists (C.C.E.)
Society of Clinical and Medical Electrologists (S.C.M.E.)
Laser Dreams’ personnel will be the following:
- Joe Jackson;
- Allison Fremont;
- Receptionist/clerk (1).
| Personnel Plan | |||
| Year 1 | Year 2 | Year 3 | |
| Joe Jackson | $36,000 | $40,000 | $45,000 |
| Allison Fremont | $36,000 | $40,000 | $45,000 |
| Receptionist/Clerk | $21,600 | $25,000 | $28,000 |
| Total People | 3 | 3 | 3 |
| Total Payroll | $93,600 | $105,000 | $118,000 |
Financial Plan
The following is the financial plan for Laser Dreams.
7.1 Break-even Analysis
The monthly break-even point is approximately $13,300.

| Break-even Analysis | |
| Monthly Revenue Break-even | $13,329 |
| Assumptions: | |
| Average Percent Variable Cost | 0% |
| Estimated Monthly Fixed Cost | $13,329 |
7.2 Projected Cash Flow
The following table and chart highlights the projected cash flow for three years.

| Pro Forma Cash Flow | |||
| Year 1 | Year 2 | Year 3 | |
| Cash Received | |||
| Cash from Operations | |||
| Cash Sales | $135,300 | $190,000 | $245,000 |
| Subtotal Cash from Operations | $135,300 | $190,000 | $245,000 |
| Additional Cash Received | |||
| Sales Tax, VAT, HST/GST Received | $0 | $0 | $0 |
| New Current Borrowing | $0 | $0 | $0 |
| New Other Liabilities (interest-free) | $0 | $0 | $0 |
| New Long-term Liabilities | $0 | $0 | $0 |
| Sales of Other Current Assets | $0 | $0 | $0 |
| Sales of Long-term Assets | $0 | $0 | $0 |
| New Investment Received | $0 | $0 | $0 |
| Subtotal Cash Received | $135,300 | $190,000 | $245,000 |
| Expenditures | Year 1 | Year 2 | Year 3 |
| Expenditures from Operations | |||
| Cash Spending | $93,600 | $105,000 | $118,000 |
| Bill Payments | $62,348 | $72,440 | $87,565 |
| Subtotal Spent on Operations | $155,948 | $177,440 | $205,565 |
| Additional Cash Spent | |||
| Sales Tax, VAT, HST/GST Paid Out | $0 | $0 | $0 |
| Principal Repayment of Current Borrowing | $0 | $0 | $0 |
| Other Liabilities Principal Repayment | $0 | $0 | $0 |
| Long-term Liabilities Principal Repayment | $5,160 | $5,160 | $5,160 |
| Purchase Other Current Assets | $0 | $0 | $0 |
| Purchase Long-term Assets | $0 | $0 | $0 |
| Dividends | $0 | $0 | $0 |
| Subtotal Cash Spent | $161,108 | $182,600 | $210,725 |
| Net Cash Flow | ($25,808) | $7,400 | $34,275 |
| Cash Balance | $16,092 | $23,492 | $57,767 |
7.3 Projected Profit and Loss
The following table and charts highlight the projected profit and loss for three years.


| Pro Forma Profit and Loss | |||
| Year 1 | Year 2 | Year 3 | |
| Sales | $135,300 | $190,000 | $245,000 |
| Direct Cost of Sales | $0 | $0 | $0 |
| Other Production Expenses | $0 | $0 | $0 |
| Total Cost of Sales | $0 | $0 | $0 |
| Gross Margin | $135,300 | $190,000 | $245,000 |
| Gross Margin % | 100.00% | 100.00% | 100.00% |
| Expenses | |||
| Payroll | $93,600 | $105,000 | $118,000 |
| Sales and Marketing and Other Expenses | $6,000 | $8,000 | $10,000 |
| Depreciation | $8,568 | $8,568 | $8,568 |
| Leased Equipment | $0 | $0 | $0 |
| Utilities | $3,300 | $3,300 | $3,300 |
| Insurance | $2,400 | $2,400 | $2,400 |
| Rent | $36,000 | $36,000 | $36,000 |
| Payroll Taxes | $10,080 | $13,050 | $15,750 |
| Other | $0 | $0 | $0 |
| Total Operating Expenses | $159,948 | $176,318 | $194,018 |
| Profit Before Interest and Taxes | ($24,648) | $13,682 | $50,982 |
| EBITDA | ($16,080) | $22,250 | $59,550 |
| Interest Expense | $9,721 | $9,226 | $8,710 |
| Taxes Incurred | $0 | $1,337 | $12,682 |
| Net Profit | ($34,369) | $3,119 | $29,590 |
| Net Profit/Sales | -25.40% | 1.64% | 12.08% |
7.4 Projected Balance Sheet
The following table highlights the projected balance sheet for three years.
| Pro Forma Balance Sheet | |||
| Year 1 | Year 2 | Year 3 | |
| Assets | |||
| Current Assets | |||
| Cash | $16,092 | $23,492 | $57,767 |
| Other Current Assets | $20,000 | $20,000 | $20,000 |
| Total Current Assets | $36,092 | $43,492 | $77,767 |
| Long-term Assets | |||
| Long-term Assets | $30,000 | $30,000 | $30,000 |
| Accumulated Depreciation | $8,568 | $17,136 | $25,704 |
| Total Long-term Assets | $21,432 | $12,864 | $4,296 |
| Total Assets | $57,524 | $56,356 | $82,063 |
| Liabilities and Capital | Year 1 | Year 2 | Year 3 |
| Current Liabilities | |||
| Accounts Payable | $5,153 | $6,026 | $7,302 |
| Current Borrowing | $0 | $0 | $0 |
| Other Current Liabilities | $0 | $0 | $0 |
| Subtotal Current Liabilities | $5,153 | $6,026 | $7,302 |
| Long-term Liabilities | $94,840 | $89,680 | $84,520 |
| Total Liabilities | $99,993 | $95,706 | $91,822 |
| Paid-in Capital | $60,000 | $60,000 | $60,000 |
| Retained Earnings | ($68,100) | ($102,469) | ($99,349) |
| Earnings | ($34,369) | $3,119 | $29,590 |
| Total Capital | ($42,469) | ($39,349) | ($9,759) |
| Total Liabilities and Capital | $57,524 | $56,356 | $82,063 |
| Net Worth | ($42,468) | ($39,349) | ($9,759) |
7.5 Business Ratios
Business ratios for the years of this plan are shown below. Industry profile ratios based on the Standard Industrial Classification (SIC) code 7231, Beauty Shops, are shown for comparison.
| Ratio Analysis | ||||
| Year 1 | Year 2 | Year 3 | Industry Profile | |
| Sales Growth | 0.00% | 40.43% | 28.95% | 7.50% |
| Percent of Total Assets | ||||
| Other Current Assets | 34.77% | 35.49% | 24.37% | 36.10% |
| Total Current Assets | 62.74% | 77.17% | 94.77% | 52.40% |
| Long-term Assets | 37.26% | 22.83% | 5.23% | 47.60% |
| Total Assets | 100.00% | 100.00% | 100.00% | 100.00% |
| Current Liabilities | 8.96% | 10.69% | 8.90% | 31.90% |
| Long-term Liabilities | 164.87% | 159.13% | 102.99% | 26.80% |
| Total Liabilities | 173.83% | 169.82% | 111.89% | 58.70% |
| Net Worth | -73.83% | -69.82% | -11.89% | 41.30% |
| Percent of Sales | ||||
| Sales | 100.00% | 100.00% | 100.00% | 100.00% |
| Gross Margin | 100.00% | 100.00% | 100.00% | 0.00% |
| Selling, General & Administrative Expenses | 105.89% | 91.73% | 84.21% | 73.40% |
| Advertising Expenses | 4.43% | 4.21% | 4.08% | 2.50% |
| Profit Before Interest and Taxes | -18.22% | 7.20% | 20.81% | 3.20% |
| Main Ratios | ||||
| Current | 7.00 | 7.22 | 10.65 | 1.79 |
| Quick | 7.00 | 7.22 | 10.65 | 1.34 |
| Total Debt to Total Assets | 173.83% | 169.82% | 111.89% | 58.70% |
| Pre-tax Return on Net Worth | 80.93% | -11.32% | -433.16% | 5.20% |
| Pre-tax Return on Assets | -59.75% | 7.91% | 51.51% | 12.50% |
| Additional Ratios | Year 1 | Year 2 | Year 3 | |
| Net Profit Margin | -25.40% | 1.64% | 12.08% | n.a |
| Return on Equity | 0.00% | 0.00% | 0.00% | n.a |
| Activity Ratios | ||||
| Accounts Payable Turnover | 13.10 | 12.17 | 12.17 | n.a |
| Payment Days | 27 | 28 | 27 | n.a |
| Total Asset Turnover | 2.35 | 3.37 | 2.99 | n.a |
| Debt Ratios | ||||
| Debt to Net Worth | 0.00 | 0.00 | 0.00 | n.a |
| Current Liab. to Liab. | 0.05 | 0.06 | 0.08 | n.a |
| Liquidity Ratios | ||||
| Net Working Capital | $30,940 | $37,467 | $70,465 | n.a |
| Interest Coverage | -2.54 | 1.48 | 5.85 | n.a |
| Additional Ratios | ||||
| Assets to Sales | 0.43 | 0.30 | 0.33 | n.a |
| Current Debt/Total Assets | 9% | 11% | 9% | n.a |
| Acid Test | 7.00 | 7.22 | 10.65 | n.a |
| Sales/Net Worth | 0.00 | 0.00 | 0.00 | n.a |
| Dividend Payout | 0.00 | 0.00 | 0.00 | n.a |
Appendix
| Sales Forecast | |||||||||||||
| Month 1 | Month 2 | Month 3 | Month 4 | Month 5 | Month 6 | Month 7 | Month 8 | Month 9 | Month 10 | Month 11 | Month 12 | ||
| Sales | |||||||||||||
| Hair Removal | 0% | $0 | $2,000 | $5,000 | $7,000 | $10,000 | $12,000 | $14,000 | $14,000 | $15,000 | $15,000 | $15,000 | $16,000 |
| Products | 0% | $0 | $300 | $700 | $1,000 | $1,000 | $1,000 | $1,000 | $1,000 | $1,000 | $1,000 | $1,100 | $1,200 |
| Total Sales | $0 | $2,300 | $5,700 | $8,000 | $11,000 | $13,000 | $15,000 | $15,000 | $16,000 | $16,000 | $16,100 | $17,200 | |
| Direct Cost of Sales | Month 1 | Month 2 | Month 3 | Month 4 | Month 5 | Month 6 | Month 7 | Month 8 | Month 9 | Month 10 | Month 11 | Month 12 | |
| Hair Removal | $0 | $0 | $0 | $0 | $0 | $0 | $0 | $0 | $0 | $0 | $0 | $0 | |
| Products | $0 | $0 | $0 | $0 | $0 | $0 | $0 | $0 | $0 | $0 | $0 | $0 | |
| Subtotal Direct Cost of Sales | $0 | $0 | $0 | $0 | $0 | $0 | $0 | $0 | $0 | $0 | $0 | $0 | |
| Personnel Plan | |||||||||||||
| Month 1 | Month 2 | Month 3 | Month 4 | Month 5 | Month 6 | Month 7 | Month 8 | Month 9 | Month 10 | Month 11 | Month 12 | ||
| Joe Jackson | 0% | $3,000 | $3,000 | $3,000 | $3,000 | $3,000 | $3,000 | $3,000 | $3,000 | $3,000 | $3,000 | $3,000 | $3,000 |
| Allison Fremont | 0% | $3,000 | $3,000 | $3,000 | $3,000 | $3,000 | $3,000 | $3,000 | $3,000 | $3,000 | $3,000 | $3,000 | $3,000 |
| Receptionist/Clerk | 0% | $1,800 | $1,800 | $1,800 | $1,800 | $1,800 | $1,800 | $1,800 | $1,800 | $1,800 | $1,800 | $1,800 | $1,800 |
| Total People | 3 | 3 | 3 | 3 | 3 | 3 | 3 | 3 | 3 | 3 | 3 | 3 | |
| Total Payroll | $7,800 | $7,800 | $7,800 | $7,800 | $7,800 | $7,800 | $7,800 | $7,800 | $7,800 | $7,800 | $7,800 | $7,800 | |
| General Assumptions | |||||||||||||
| Month 1 | Month 2 | Month 3 | Month 4 | Month 5 | Month 6 | Month 7 | Month 8 | Month 9 | Month 10 | Month 11 | Month 12 | ||
| Plan Month | 1 | 2 | 3 | 4 | 5 | 6 | 7 | 8 | 9 | 10 | 11 | 12 | |
| Current Interest Rate | 10.00% | 10.00% | 10.00% | 10.00% | 10.00% | 10.00% | 10.00% | 10.00% | 10.00% | 10.00% | 10.00% | 10.00% | |
| Long-term Interest Rate | 10.00% | 10.00% | 10.00% | 10.00% | 10.00% | 10.00% | 10.00% | 10.00% | 10.00% | 10.00% | 10.00% | 10.00% | |
| Tax Rate | 30.00% | 30.00% | 30.00% | 30.00% | 30.00% | 30.00% | 30.00% | 30.00% | 30.00% | 30.00% | 30.00% | 30.00% | |
| Other | 0 | 0 | 0 | 0 | 0 | 0 | 0 | 0 | 0 | 0 | 0 | 0 | |
| Pro Forma Profit and Loss | |||||||||||||
| Month 1 | Month 2 | Month 3 | Month 4 | Month 5 | Month 6 | Month 7 | Month 8 | Month 9 | Month 10 | Month 11 | Month 12 | ||
| Sales | $0 | $2,300 | $5,700 | $8,000 | $11,000 | $13,000 | $15,000 | $15,000 | $16,000 | $16,000 | $16,100 | $17,200 | |
| Direct Cost of Sales | $0 | $0 | $0 | $0 | $0 | $0 | $0 | $0 | $0 | $0 | $0 | $0 | |
| Other Production Expenses | $0 | $0 | $0 | $0 | $0 | $0 | $0 | $0 | $0 | $0 | $0 | $0 | |
| Total Cost of Sales | $0 | $0 | $0 | $0 | $0 | $0 | $0 | $0 | $0 | $0 | $0 | $0 | |
| Gross Margin | $0 | $2,300 | $5,700 | $8,000 | $11,000 | $13,000 | $15,000 | $15,000 | $16,000 | $16,000 | $16,100 | $17,200 | |
| Gross Margin % | 0.00% | 100.00% | 100.00% | 100.00% | 100.00% | 100.00% | 100.00% | 100.00% | 100.00% | 100.00% | 100.00% | 100.00% | |
| Expenses | |||||||||||||
| Payroll | $7,800 | $7,800 | $7,800 | $7,800 | $7,800 | $7,800 | $7,800 | $7,800 | $7,800 | $7,800 | $7,800 | $7,800 | |
| Sales and Marketing and Other Expenses | $500 | $500 | $500 | $500 | $500 | $500 | $500 | $500 | $500 | $500 | $500 | $500 | |
| Depreciation | $714 | $714 | $714 | $714 | $714 | $714 | $714 | $714 | $714 | $714 | $714 | $714 | |
| Leased Equipment | $0 | $0 | $0 | $0 | $0 | $0 | $0 | $0 | $0 | $0 | $0 | $0 | |
| Utilities | $300 | $300 | $300 | $300 | $300 | $300 | $300 | $300 | $300 | $300 | $300 | $0 | |
| Insurance | $200 | $200 | $200 | $200 | $200 | $200 | $200 | $200 | $200 | $200 | $200 | $200 | |
| Rent | $3,000 | $3,000 | $3,000 | $3,000 | $3,000 | $3,000 | $3,000 | $3,000 | $3,000 | $3,000 | $3,000 | $3,000 | |
| Payroll Taxes | 15% | $840 | $840 | $840 | $840 | $840 | $840 | $840 | $840 | $840 | $840 | $840 | $840 |
| Other | $0 | $0 | $0 | $0 | $0 | $0 | $0 | $0 | $0 | $0 | $0 | $0 | |
| Total Operating Expenses | $13,354 | $13,354 | $13,354 | $13,354 | $13,354 | $13,354 | $13,354 | $13,354 | $13,354 | $13,354 | $13,354 | $13,054 | |
| Profit Before Interest and Taxes | ($13,354) | ($11,054) | ($7,654) | ($5,354) | ($2,354) | ($354) | $1,646 | $1,646 | $2,646 | $2,646 | $2,746 | $4,146 | |
| EBITDA | ($12,640) | ($10,340) | ($6,940) | ($4,640) | ($1,640) | $360 | $2,360 | $2,360 | $3,360 | $3,360 | $3,460 | $4,860 | |
| Interest Expense | $830 | $826 | $823 | $819 | $815 | $812 | $808 | $805 | $801 | $798 | $794 | $790 | |
| Taxes Incurred | $0 | $0 | $0 | $0 | $0 | $0 | $0 | $0 | $0 | $0 | $0 | $0 | |
| Net Profit | ($14,184) | ($11,880) | ($8,477) | ($6,173) | ($3,169) | ($1,166) | $838 | $841 | $1,845 | $1,849 | $1,952 | $3,356 | |
| Net Profit/Sales | 0.00% | -516.53% | -148.71% | -77.16% | -28.81% | -8.97% | 5.59% | 5.61% | 11.53% | 11.55% | 12.12% | 19.51% | |
| Pro Forma Cash Flow | |||||||||||||
| Month 1 | Month 2 | Month 3 | Month 4 | Month 5 | Month 6 | Month 7 | Month 8 | Month 9 | Month 10 | Month 11 | Month 12 | ||
| Cash Received | |||||||||||||
| Cash from Operations | |||||||||||||
| Cash Sales | $0 | $2,300 | $5,700 | $8,000 | $11,000 | $13,000 | $15,000 | $15,000 | $16,000 | $16,000 | $16,100 | $17,200 | |
| Subtotal Cash from Operations | $0 | $2,300 | $5,700 | $8,000 | $11,000 | $13,000 | $15,000 | $15,000 | $16,000 | $16,000 | $16,100 | $17,200 | |
| Additional Cash Received | |||||||||||||
| Sales Tax, VAT, HST/GST Received | 0.00% | $0 | $0 | $0 | $0 | $0 | $0 | $0 | $0 | $0 | $0 | $0 | $0 |
| New Current Borrowing | $0 | $0 | $0 | $0 | $0 | $0 | $0 | $0 | $0 | $0 | $0 | $0 | |
| New Other Liabilities (interest-free) | $0 | $0 | $0 | $0 | $0 | $0 | $0 | $0 | $0 | $0 | $0 | $0 | |
| New Long-term Liabilities | $0 | $0 | $0 | $0 | $0 | $0 | $0 | $0 | $0 | $0 | $0 | $0 | |
| Sales of Other Current Assets | $0 | $0 | $0 | $0 | $0 | $0 | $0 | $0 | $0 | $0 | $0 | $0 | |
| Sales of Long-term Assets | $0 | $0 | $0 | $0 | $0 | $0 | $0 | $0 | $0 | $0 | $0 | $0 | |
| New Investment Received | $0 | $0 | $0 | $0 | $0 | $0 | $0 | $0 | $0 | $0 | $0 | $0 | |
| Subtotal Cash Received | $0 | $2,300 | $5,700 | $8,000 | $11,000 | $13,000 | $15,000 | $15,000 | $16,000 | $16,000 | $16,100 | $17,200 | |
| Expenditures | Month 1 | Month 2 | Month 3 | Month 4 | Month 5 | Month 6 | Month 7 | Month 8 | Month 9 | Month 10 | Month 11 | Month 12 | |
| Expenditures from Operations | |||||||||||||
| Cash Spending | $7,800 | $7,800 | $7,800 | $7,800 | $7,800 | $7,800 | $7,800 | $7,800 | $7,800 | $7,800 | $7,800 | $7,800 | |
| Bill Payments | $189 | $5,670 | $5,666 | $5,662 | $5,659 | $5,655 | $5,652 | $5,648 | $5,645 | $5,641 | $5,637 | $5,624 | |
| Subtotal Spent on Operations | $7,989 | $13,470 | $13,466 | $13,462 | $13,459 | $13,455 | $13,452 | $13,448 | $13,445 | $13,441 | $13,437 | $13,424 | |
| Additional Cash Spent | |||||||||||||
| Sales Tax, VAT, HST/GST Paid Out | $0 | $0 | $0 | $0 | $0 | $0 | $0 | $0 | $0 | $0 | $0 | $0 | |
| Principal Repayment of Current Borrowing | $0 | $0 | $0 | $0 | $0 | $0 | $0 | $0 | $0 | $0 | $0 | $0 | |
| Other Liabilities Principal Repayment | $0 | $0 | $0 | $0 | $0 | $0 | $0 | $0 | $0 | $0 | $0 | $0 | |
| Long-term Liabilities Principal Repayment | $430 | $430 | $430 | $430 | $430 | $430 | $430 | $430 | $430 | $430 | $430 | $430 | |
| Purchase Other Current Assets | $0 | $0 | $0 | $0 | $0 | $0 | $0 | $0 | $0 | $0 | $0 | $0 | |
| Purchase Long-term Assets | $0 | $0 | $0 | $0 | $0 | $0 | $0 | $0 | $0 | $0 | $0 | $0 | |
| Dividends | $0 | $0 | $0 | $0 | $0 | $0 | $0 | $0 | $0 | $0 | $0 | $0 | |
| Subtotal Cash Spent | $8,419 | $13,900 | $13,896 | $13,892 | $13,889 | $13,885 | $13,882 | $13,878 | $13,875 | $13,871 | $13,867 | $13,854 | |
| Net Cash Flow | ($8,419) | ($11,600) | ($8,196) | ($5,892) | ($2,889) | ($885) | $1,118 | $1,122 | $2,125 | $2,129 | $2,233 | $3,346 | |
| Cash Balance | $33,481 | $21,881 | $13,685 | $7,793 | $4,904 | $4,019 | $5,137 | $6,259 | $8,384 | $10,513 | $12,746 | $16,092 | |
| Pro Forma Balance Sheet | |||||||||||||
| Month 1 | Month 2 | Month 3 | Month 4 | Month 5 | Month 6 | Month 7 | Month 8 | Month 9 | Month 10 | Month 11 | Month 12 | ||
| Assets | Starting Balances | ||||||||||||
| Current Assets | |||||||||||||
| Cash | $41,900 | $33,481 | $21,881 | $13,685 | $7,793 | $4,904 | $4,019 | $5,137 | $6,259 | $8,384 | $10,513 | $12,746 | $16,092 |
| Other Current Assets | $20,000 | $20,000 | $20,000 | $20,000 | $20,000 | $20,000 | $20,000 | $20,000 | $20,000 | $20,000 | $20,000 | $20,000 | $20,000 |
| Total Current Assets | $61,900 | $53,481 | $41,881 | $33,685 | $27,793 | $24,904 | $24,019 | $25,137 | $26,259 | $28,384 | $30,513 | $32,746 | $36,092 |
| Long-term Assets | |||||||||||||
| Long-term Assets | $30,000 | $30,000 | $30,000 | $30,000 | $30,000 | $30,000 | $30,000 | $30,000 | $30,000 | $30,000 | $30,000 | $30,000 | $30,000 |
| Accumulated Depreciation | $0 | $714 | $1,428 | $2,142 | $2,856 | $3,570 | $4,284 | $4,998 | $5,712 | $6,426 | $7,140 | $7,854 | $8,568 |
| Total Long-term Assets | $30,000 | $29,286 | $28,572 | $27,858 | $27,144 | $26,430 | $25,716 | $25,002 | $24,288 | $23,574 | $22,860 | $22,146 | $21,432 |
| Total Assets | $91,900 | $82,767 | $70,453 | $61,543 | $54,937 | $51,334 | $49,735 | $50,139 | $50,547 | $51,958 | $53,373 | $54,892 | $57,524 |
| Liabilities and Capital | Month 1 | Month 2 | Month 3 | Month 4 | Month 5 | Month 6 | Month 7 | Month 8 | Month 9 | Month 10 | Month 11 | Month 12 | |
| Current Liabilities | |||||||||||||
| Accounts Payable | $0 | $5,481 | $5,477 | $5,474 | $5,470 | $5,467 | $5,463 | $5,460 | $5,457 | $5,453 | $5,450 | $5,446 | $5,153 |
| Current Borrowing | $0 | $0 | $0 | $0 | $0 | $0 | $0 | $0 | $0 | $0 | $0 | $0 | $0 |
| Other Current Liabilities | $0 | $0 | $0 | $0 | $0 | $0 | $0 | $0 | $0 | $0 | $0 | $0 | $0 |
| Subtotal Current Liabilities | $0 | $5,481 | $5,477 | $5,474 | $5,470 | $5,467 | $5,463 | $5,460 | $5,457 | $5,453 | $5,450 | $5,446 | $5,153 |
| Long-term Liabilities | $100,000 | $99,570 | $99,140 | $98,710 | $98,280 | $97,850 | $97,420 | $96,990 | $96,560 | $96,130 | $95,700 | $95,270 | $94,840 |
| Total Liabilities | $100,000 | $105,051 | $104,617 | $104,184 | $103,750 | $103,317 | $102,883 | $102,450 | $102,017 | $101,583 | $101,150 | $100,716 | $99,993 |
| Paid-in Capital | $60,000 | $60,000 | $60,000 | $60,000 | $60,000 | $60,000 | $60,000 | $60,000 | $60,000 | $60,000 | $60,000 | $60,000 | $60,000 |
| Retained Earnings | ($68,100) | ($68,100) | ($68,100) | ($68,100) | ($68,100) | ($68,100) | ($68,100) | ($68,100) | ($68,100) | ($68,100) | ($68,100) | ($68,100) | ($68,100) |
| Earnings | $0 | ($14,184) | ($26,064) | ($34,541) | ($40,714) | ($43,883) | ($45,049) | ($44,211) | ($43,370) | ($41,525) | ($39,676) | ($37,724) | ($34,369) |
| Total Capital | ($8,100) | ($22,284) | ($34,164) | ($42,641) | ($48,814) | ($51,983) | ($53,149) | ($52,311) | ($51,470) | ($49,625) | ($47,776) | ($45,824) | ($42,469) |
| Total Liabilities and Capital | $91,900 | $82,767 | $70,453 | $61,543 | $54,937 | $51,334 | $49,735 | $50,139 | $50,547 | $51,958 | $53,373 | $54,892 | $57,524 |
| Net Worth | ($8,100) | ($22,284) | ($34,164) | ($42,641) | ($48,814) | ($51,983) | ($53,149) | ($52,311) | ($51,470) | ($49,625) | ($47,776) | ($45,824) | ($42,468) |

