
Gymnastics Jump-Start
Executive Summary
Gymnastics Jump-Start will serve children in the Detroit Metropolitan area. We will help them to become more disciplined and focused, and improve their overall health. Gymnastics Jump-Start is a private gym whose main focus is on gymnastics; however, various types of dance and total body conditioning are also taught. This gym will have Olympic gymnastic equipment for both boys and girls.
We start each student with the core elements of gymnastics, followed by total body conditioning and more difficult tricks. Creativity in teaching methods will set us apart from our competitors, using both repetition and variation. We believe that a child must have fun and truly enjoy what he or she is doing to learn successfully. Our teachers will be trained in more unique methods of teaching that produce the same, if not better, physical effect on the children, but provide a better mental effect. The gymnasium will be open for parent observation, but they will be asked to stay in a confined area as a safety precaution.
Gymnastics Jump-Start will be making a profit within the first year of business. After the completion of the first year we expect to have a fairly regular clientele base. As the number of children in our classes increases, we will add extra teachers. If growing classes mean hiring and training new teachers, then that’s what we will do. As current gymnastics teachers at other gyms, we have a very strong relationship with our customers and will do whatever we can to keep them coming back to us. Our class prices will be lower than our competitors but our business will still make an excellent profit.
Owners Wanda Bounce and Bea Flip have both been competitive gymnasts. We understand the way that private and public gyms are run since we have worked in both of them. With combined gymnastics coaching experience of over 25 years, we understand what our customers want and need. We understand how children learn best from the mistakes our teachers made when we competed in gymnastics. We understand that sometimes you have to throw the book out the window and do what works best to accomplish your set goal while teaching. We have found that there is definitely a market for private gyms in Oakland County. We know this simply by the fact that we both grew up in this county and were inconvenienced by driving long distances to get to a private gym to take lessons. We believe our gym will be successful due to the experience we have gained working at various gymnastics facilities in and around the Detroit Metropolitan area.
To fund the start-up costs for Gymnastics Jump-Start, the owners will each invest $25,000. In addition, we are seeking a seven-year loan of $36,600 to help cover the initial equipment purchases necessary to open a high-caliber private gymnasium. Details of the repayment can be found in the financial plan.
1.1 Keys to Success
Our main keys to success include:
- Maintaining a reputable and untarnished reputation in the community
- Competitive pricing
- Flexible hours
- Ample and secure parking
- Easy access
- Target high traffic areas for maximum public exposure
- Design facilities to curb overcrowding
- Seasoned management team
- Personalized relationships with customers
We can minimize certain risk factors by:
- Initial capitalization of the company to sustain operations through year one
- Low overhead through the use of multi-skilled employees and continual training
- Strong customer base through aggressive marketing
- Strong community ties and involvement
- Eliminate collection costs by establishing cash/credit/debit-card-only facilities
1.2 Mission
Gymnastics Jump-Start offers a place where people can learn gymnastics, meet new people, have fun and feel comfortable. We offer a varied gymnastics and conditioning program with price options for all levels of interest, but with greater emphasis on group classes. Our instructors have access to continual training with some of the area’s top professional coaches. This provides our students with up-to-date tricks and technique. Gymnastics Jump-Start welcomes a diversity of people and maintains a non-smoking and alcohol/drug free environment.
1.3 Objectives
The objectives of Gymnastics Jump-Start are the following:
- Exceed 60% class capacity by the end of the first year of operation.
- Acquire 300+ participants by the end of the first year of operation.
- Increase membership by 20% by the end of the second year of operation.
- Provide gymnastics training for students at all levels, from beginner to advanced.
- Provide continual training, benefits and incentives for staff to encourage a long-term commitment of employees.
Company Summary
Gymnastics Jump-Start, soon to be located in Bouncetown, Michigan, will provide the community with a comfortable, friendly environment in which to learn all levels of gymnastics. Gymnastics Jump-Start will offer private gymnastics instruction, group classes, birthday parties, sleepovers, drop-in clinics, cheerleading classes, and conditioning classes. Gymnastics, as a sport, has become increasingly popular worldwide due to the public’s exposure from the Summer Olympics. As a result, the gym can expect to expand numbers of children largely when the next Summer Olympics come around. We expect most of our customers to come from Oakland County where we are located, but we also expect some business from Macomb and Wayne County. Gymnastics Jump-Start will appeal mainly to the 1-18 year old age group, all types of abilities and backgrounds, and children looking for creative self expression, exercise and/or social opportunities through gymnastics.
2.1 Company Ownership
Gymnastics Jump-Start is a privately owned limited liability partnership with each of the principal officers holding an equal share in the company. Gymnastics Jump-Start is owned and operated by Wanda Bounce and Bea Flip.
2.2 Start-up Summary
The start-up expenses for Gymnastics Jump-Start are focused primarily on equipment and padded floor surfaces for the classes. We are buying $40,000 worth of equipment as long-term assets, and another $30,000 as expensed equipment which will need to be replaced every three-four years.

| Start-up | |
| Requirements | |
| Start-up Expenses | |
| Legal | $1,000 |
| Stationery etc. | $500 |
| Insurance | $1,000 |
| Rent | $2,000 |
| Computer | $100 |
| Gymnastics Equipment | $30,000 |
| Other | $2,000 |
| Total Start-up Expenses | $36,600 |
| Start-up Assets | |
| Cash Required | $10,000 |
| Other Current Assets | $0 |
| Long-term Assets | $40,000 |
| Total Assets | $50,000 |
| Total Requirements | $86,600 |
Services
Gymnastics Jump-Start is dedicated to bringing the fun and challenge of gymnastics to Oakland County at an affordable cost. We will offer private and group gymnastics classes for social through competitive level gymnasts. Gymnastics Jump-Start will offer its students a variety of instructional choices. By offering them several options, we can best serve their individual needs and financial limitations.
Private Lessons
This offer students the best value for their investment. With a private lesson,the students will work one-on-one with an instructor, receiving personalized instruction and immediate correction. In learning the best methods, one-on-one, both beginning and advanced students will find they progress faster and more easily. Private lessons must be arranged by the instructor who will teach the lesson. Price varies depending on instructor’s experience.
Parent & Tot
This 45 minute class is designed to enhance your child’s motor, listening, and social skills through fun gymnastics oriented activities (an adult is expected to actively participate with their child). This class is offered to children ages 16 months up to 3 years. The price is $75 for a 10 week session.
Preschool
This hour long class is the introduction to basic gymnastics skills with 5 levels to achieve. Activities include tumbling, low bar, floor beam, and motor skills. For 3 year olds there are 6 students per instructor. For 4 year olds through kindergarten there are 8 students per instructor. This class is offered to children ages 3 years old to kindergarten. The price is $100 for a 10 week session. We also offer advanced preschool which a child must get instructor approval to join. This class runs 90 minutes and is $128 (this is also a 10 week session).

Girls
This 90 minute class consists of basic, intermediate, and advanced gymnastics skills with 6 levels to achieve. Activities include vault, bars, beam, tumbling, trampoline and dance. There are 8 students per instructor. This class is offered to girls ages 1st grade to 12 years old. The price is $128 for a 10 week session.
Boys
This 90 minute class consists of basic, intermediate, and advanced gymnastics skills with 6 levels to achieve. Activities include single bar, rings, parallel bars, tumbling, vault, and trampoline. There are 8 students per instructor. This class is offered to boys ages 6 years old and up. The price is $128 for a 10 week session.
Tumbling
This 75 minute class is designed for boys and girls to learn basic through advanced tumbling skills and trampoline. Skills include handstands, cartwheels, round-offs, back handsprings, back tucks, etc. There are 8 students per instructor. This class is offered to all children ages 6 years old and up. The price is $115 for a 10 week session.
Cheernastics
This is a 60 minute tumbling class for cheer squads of 8 or more with an emphasis on back handsprings. The cheer coach will need to contact our office to set up the day and time for their squad. The price will vary depending on the number of girls in the squad. Cheer squads of all ages are welcome.
Cheer
This 60 minute class is for individuals interested in learning basic, intermediate, or advanced cheer techniques. Class includes training for flexibility, jumps, and stunts. This class is offered to a variety of ages. The class is $100 for a 10 week session.
Adult Gymnastics
This 75 minute class is designed for anyone interested in learning or relearning basic to intermediate tumbling skills. There are 8 students per instructor. This class is $115 for a 10 week session.
Birthday Parties
This is an excellent way to celebrate a child’s birthday. The first 60 minutes include games, trampolines, and fun gymnastics activities. The final 30 minutes are for refreshments, food, and gifts provided by the parents. We provide the party room, decorations, and clean up. Birthday parties have a maximum limit of 20 children and cost $150.
Field trips
This is designed to introduce a group to basic gymnastics skills. This is 60 minutes long. The price will vary depending on the size of the group.
Market Analysis Summary
Gymnastics Jump-Start is a business that has become necessary in today’s fast-paced world. People are always on the go these days and don’t tend to take care of themselves anymore. America has a large rate of obesity in not only adults but also children. Being overweight can cause many health issues as well as social issues for children. An overweight child will reach an age when they start to feel very unsure in themselves. Everybody goes through a stage like this, but this could be more intense to an overweight child. Also, there is an increase in the number of children with diabetes. Diabetes is occurring more and more in America’s overweight children. Children need to stay active these days, especially with all of technologies advancements. Now children can just sit around the house and watch TV and DVD’s or they can play games on anything from the computer to Playstation® to Xbox®. Children are not active as much when they can sit around their house and entertain themselves as opposed to going outside and play baseball or soccer. There is no doubt that there is room and need in the market for a private gymnastics gym.
4.1 Market Segmentation
Gymnastics Jump-Start has determined that its potential customers will mainly come from children 18 years old and under in Oakland County. The majority of customers will come from Oakland County, however when completing the market analysis table I added in Macomb and Wayne County. I expect these counties will make up less then 30% of our customers.

| Market Analysis | |||||||
| Year 1 | Year 2 | Year 3 | Year 4 | Year 5 | |||
| Potential Customers | Growth | CAGR | |||||
| local children ages 18 and under | 1% | 304,383 | 307,427 | 310,501 | 313,606 | 316,742 | 1.00% |
| Wayne and Macomb Counties children ages 18 and under | 1% | 764,219 | 771,861 | 779,580 | 787,376 | 795,250 | 1.00% |
| Total | 1.00% | 1,068,602 | 1,079,288 | 1,090,081 | 1,100,982 | 1,111,992 | 1.00% |
4.2 Service Business Analysis
The reason I decided that I wanted to open Gymnastics Jump-Start in Oakland County is that there are no real private gyms in the area. On the opposite side of Oakland County from Bouncetown there is one private gym, but I wanted to create a more centralized business. In this industry there are two options: public gyms and private gyms. The public gyms are the city recreation centers and facilities like the YMCA’s and YWCA’s. As I stated before, there is only really one other private gym close in the general area. Most recreation centers or cities do have some sort of a gymnastics program, but this could simply mean that it is as basic as a preschool program.
4.2.1 Competition and Buying Patterns
The public programs tend to be cheaper, but the equipment tends to be not as ‘top of the line’ as the private gyms. These public centers can only train children until they reach a certain point; then they must go to a private gym for training on advanced skills and equipment. In my experience I have found that private gyms have better trained staff and better quality equipment. I have come to that conclusion by both teaching and training in a public and private gym. The public gyms are cheaper but the training the children receive isn’t as good.
If a child is really serious about becoming a competitive gymnast they should attend private gym. The private gyms are more expensive but the classes are smaller and the skill level taught is higher. If a child is just doing gymnastics for fun and is not serious to compete then a public gym is fine. Having a child in gymnastics for them to gain from the social aspect is a great idea. In a private gym the child will also be exposed to the social aspect. There would be no reason to pay the expensive price of a private gym when the child could benefit the same from a public gym socially if that is the main desire.
4.3 Target Market Segment Strategy
Gymnastics Jump-Start is located in Oakland County, which by default means that most of our customers are coming from Oakland County. We also expect children from close surrounding counties like Macomb and Wayne. We do not expect anyone from other Counties to attend classes with us because the distance is too far for many people to travel for gymnastics classes. We will target children 18 years old and under in Oakland, Macomb, and Wayne County. The reason for targeting this age group is that any age after 18 most gymnasts stop competing or practicing regularly. Gymnastics is very rough on the body, by the age of 18 if you have not gotten injured your are normally burned out and lose interest in high level gymnastics. Now this isn’t always the case and I make gymnastics sound bad by saying that, but it’s the truth. Even with that being the case, there is still a large number of children who would like to make gymnastics part of their youth.
Strategy and Implementation Summary
Gymnastics Jump-Start will succeed by offering its clients’ children a safe, fun environment to learn gymnastics with close personalized attention from trained teachers. The goals of the gym are two-fold:
- To help parents feel good about the environment in which they have placed their children and the physical and social benefits gained there.
- To make it a safe, educational, and fun experience for the child.
5.1 Competitive Edge
Gymnastics Jump-Start’ competitive advantage will be our focus on low-level competitive gymnastics. This will allow the teachers to focus their attention on the less advanced children and classes. We will build strong classes that teach the basics. If children are not taught the basics correctly in gymnastics, they will advance to higher levels sloppy with their skills. We would like to focus our programs on the beginning classes, unlike most private gyms, which are mostly high-level competitive. In these private gym the beginning classes tend to be pushed around on the different apparatus for the convenience of the competitive gymnasts. A high level competitive gym will train girls that are much more advanced; such girls could be advanced as Olympic hopefuls.
We would also like to build strong relationships with the children and their families. That may seem like a hard thing to accomplish, but when you teach the same children for multiple sessions and years you would be surprised at how much you will learn about them. Most of this information will just be volunteered by the parents after or before classes when they just come up and talk with myself or one of the other teachers. If strong relationships are built the parents will be less likely to take their child out of our gym and send them to another for any reason.
5.2 Marketing Strategy
Our customers can come from ages 16 months to 18 years old, male and female, all races, every income level and can be local residents or connected county residents. That is why our marketing plan started at the construction phase, by keeping in mind that if it looks fun, people will come. Thus the main factor to our success is simply that a child can enjoy themselves at our gym while participating in gymnastics which will stimulate their mind and body. Public relations is a vital part of our management team, by assuring that customer satisfaction is provided and gathering information from the public about the types of classes that are most desired. This can provide our company with the means to stay in touch with the community and be ready to meet their desires.
5.3 Sales Strategy
Gymnastics Jump-Start will make a significant profit through the excellent teaching and care of children. Even though Gymnastics Jump-Start charges less than other private gyms, the company will see profit within the first year due to beneficial word-of-mouth advertising. Gymnastics Jump-Start also expects to take customers from the private gym and the public recreation center at which both Wanda Bounce and Bea Flip currently work. The company expects to double its’ clientele every six months, for the first 18 months.
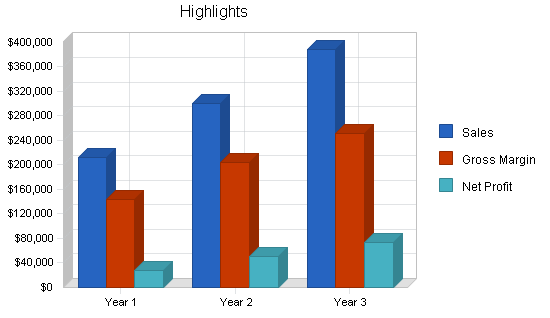
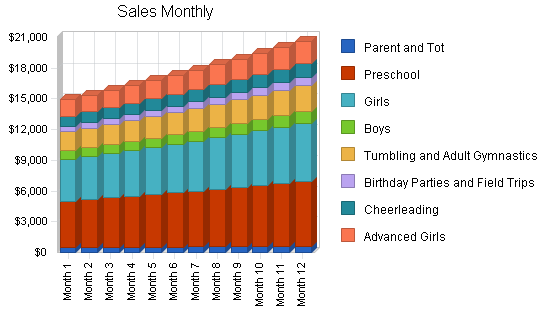
5.3.1 Sales Forecast
This sales forecast is based on the numbers of sales made by a private gym for which I work. It is assumed that for the first 3 years, our business will consistently grow in number of students. The first year in the sales forecast is based on half the current clientele of the private gym for which I currently work. I believe our numbers, given time, will exceed those of this private gym. I see no reason why this data would not be accurate.
Our cost of sales includes the hourly wages paid to teachers besides the owners. These amounts are based on rates negotiated with potential teachers, which vary depending on the number of children attending each session. These costs also take into account the teaching hours put in by the owners – an individual teacher is actually receiving 40-50% of the class fee, but Bea and Wanda will teach many of these classes for a small, flat salary. We also have a receptionist, but her salary is separate from the teachers. These salaries are listed separately, in the Personnel table.
The sales forecast table below shows that in 2008 our projected sales will be $211,603 and the direct cost of sales will be $64,809.

| Sales Forecast | |||
| Year 1 | Year 2 | Year 3 | |
| Sales | |||
| Parent and Tot | $6,386 | $8,818 | $11,250 |
| Preschool | $64,829 | $89,515 | $114,200 |
| Girls | $58,131 | $80,266 | $102,400 |
| Boys | $11,637 | $16,059 | $20,480 |
| Tumbling and Adult Gymnastics | $26,113 | $36,057 | $46,000 |
| Birthday Parties and Field Trips | $7,806 | $10,778 | $13,750 |
| Cheerleading | $14,192 | $19,596 | $25,000 |
| Advanced Girls | $22,509 | $39,255 | $56,000 |
| Total Sales | $211,603 | $300,344 | $389,080 |
| Direct Cost of Sales | Year 1 | Year 2 | Year 3 |
| Preschool gymnastics teachers | $21,365 | $29,500 | $50,180 |
| Beginner girls, boy, and tumbling teachers | $28,764 | $39,715 | $50,664 |
| Advanced girls teachers | $14,680 | $23,540 | $32,400 |
| Subtotal Direct Cost of Sales | $64,809 | $92,755 | $133,244 |
5.4 Milestones
The Milestones table is specific in detail, allowing for the smooth flow of functions that are necessary to set up the gym on schedule for the Grand Opening. Each function is scheduled for the proper execution and time needed to complete each task. Each manager has specific duties assigned specifically to her area of expertise.

| Milestones | |||||
| Milestone | Start Date | End Date | Budget | Manager | Department |
| Legal | 1/5/2008 | 1/7/2008 | $1,000 | Both | Department |
| Class schedule planning | 1/5/2008 | 3/15/2008 | $0 | Wanda | Department |
| File for city permit | 3/15/2008 | 3/17/2008 | $200 | Wanda | Department |
| Equipment purchase and delivery | 3/20/2008 | 3/28/2008 | $70,000 | Both | Department |
| Equipment set-up | 3/28/2008 | 3/31/2008 | $0 | Both | Department |
| Negotiate lease | 1/8/2008 | 5/1/2008 | $0 | Both | Department |
| Train staff | 4/1/2008 | 5/1/2008 | $4,000 | Bea | Department |
| Registry for classes | 4/1/2008 | 5/1/2008 | $0 | Bea | Department |
| Grand opening | 5/1/2008 | 5/1/2008 | $2,000 | Both | Department |
| Totals | $77,200 | ||||
Management Summary
The two principals, Wanda Bounce and Bea Flip, have impeccable credentials in this industry. This will benefit Gymnastics Jump-Start in two ways:
- Clients will be brought from previous employers
- The experience each has will attract new clients
Bea Flip has extensive experience in sales and marketing within the private and public gymnastics industry. Wanda Bounce has extensive experience in the area of management, finance and administration, also in the private and public gymnastics industry.
6.1 Personnel Plan
Bea Flip will teach full-time (20 classes/week), as well as filling her managerial duties. Wanda Bounce will teach 5-6 classes per week and handle the main managerial, administrative, and accounting functions, in coordination with our receptionist. Both of the owners will take a reduced salary in the first year.
The majority of our personnel costs are listed in the Sales Forecast, under Direct Cost of Sales. Teachers are paid hourly wages based on the number of students attending each session, at a percentage rate. Gymnastics Jump-Start expects to make gradual investments in gymnastic teachers over the next three years, always keeping in mind the number of children in need of care at the center. These numbers may fluctuate depending on the number of children in classes and the number of teachers that can teach multiple classes in a week.
| Personnel Plan | |||
| Year 1 | Year 2 | Year 3 | |
| Receptionist | $17,280 | $20,000 | $21,120 |
| Wanda Bounce | $12,000 | $24,000 | $30,000 |
| Bea Flip | $12,000 | $24,000 | $30,000 |
| Total People | 8 | 9 | 9 |
| Total Payroll | $41,280 | $68,000 | $81,120 |
Financial Plan
The following sections will outline the Financial Plan of Gymnastics Jump-Start.
7.1 Start-up Funding
Total start-up expenses and assets required will be funded as shown in the Start-up Funding table, below. Wanda Bounce will invest $25,000. Bea Flip will invest $25,000. In addition, gym will secure a $36,600 long-term loan (7 years at 10% interest).
| Start-up Funding | |
| Start-up Expenses to Fund | $36,600 |
| Start-up Assets to Fund | $50,000 |
| Total Funding Required | $86,600 |
| Assets | |
| Non-cash Assets from Start-up | $40,000 |
| Cash Requirements from Start-up | $10,000 |
| Additional Cash Raised | $0 |
| Cash Balance on Starting Date | $10,000 |
| Total Assets | $50,000 |
| Liabilities and Capital | |
| Liabilities | |
| Current Borrowing | $0 |
| Long-term Liabilities | $36,600 |
| Accounts Payable (Outstanding Bills) | $0 |
| Other Current Liabilities (interest-free) | $0 |
| Total Liabilities | $36,600 |
| Capital | |
| Planned Investment | |
| Owner 1 | $25,000 |
| Owner 2 | $25,000 |
| Additional Investment Requirement | $0 |
| Total Planned Investment | $50,000 |
| Loss at Start-up (Start-up Expenses) | ($36,600) |
| Total Capital | $13,400 |
| Total Capital and Liabilities | $50,000 |
| Total Funding | $86,600 |
7.2 Important Assumptions
- We are assuming steady growth from the 3 counties we service.
- We are assuming adequate funding to sustain us during start-up.
- We are assuming that the popularity of gymnastics does not decrease.
- We are assuming that there will be no other private gyms starting up in close proximity to us.
7.3 Break-even Analysis
Table 7.3 summarizes the break-even analysis. The Break-even Analysis is based on the average of the first-year figures for total sales, and by operating expenses. Our variable costs are relatively low and our main operating costs are salaries for teachers.

| Break-even Analysis | |
| Monthly Revenue Break-even | $11,973 |
| Assumptions: | |
| Average Percent Variable Cost | 31% |
| Estimated Monthly Fixed Cost | $8,306 |
7.4 Projected Profit and Loss
As the Profit and Loss table shows, the company expects to continue its steady growth in profitability over the next three years of operations. Aside from payroll, Rent and Insurance are our largest expenses. The rent for the studio we have chosen is reasonable for the square footage, which will allow us to conduct multiple classes (or classes and birthday parties) at the same time. Insurance demands when dealing with young children and physical activity are high, but the owners’ prior experience will keep these costs affordable.
Payroll taxes are based on wages and salaries for all employees, including hourly teachers (shown here as direct cost of sales).


| Pro Forma Profit and Loss | |||
| Year 1 | Year 2 | Year 3 | |
| Sales | $211,603 | $300,344 | $389,080 |
| Direct Cost of Sales | $64,809 | $92,755 | $133,244 |
| Other Costs of Sales | $3,360 | $3,840 | $4,320 |
| Total Cost of Sales | $68,169 | $96,595 | $137,564 |
| Gross Margin | $143,434 | $203,749 | $251,516 |
| Gross Margin % | 67.78% | 67.84% | 64.64% |
| Expenses | |||
| Payroll | $41,280 | $68,000 | $81,120 |
| Marketing/Promotion | $5,000 | $5,000 | $5,000 |
| Depreciation | $4,000 | $4,000 | $4,000 |
| Rent | $24,000 | $24,000 | $24,000 |
| Utilities | $3,600 | $3,700 | $3,800 |
| Insurance | $19,992 | $21,992 | $22,992 |
| Payroll Taxes | $0 | $0 | $0 |
| Other | $1,800 | $2,100 | $2,500 |
| Total Operating Expenses | $99,672 | $128,792 | $143,412 |
| Profit Before Interest and Taxes | $43,762 | $74,957 | $108,104 |
| EBITDA | $47,762 | $78,957 | $112,104 |
| Interest Expense | $3,377 | $2,876 | $2,353 |
| Taxes Incurred | $12,116 | $21,624 | $31,725 |
| Net Profit | $28,270 | $50,457 | $74,026 |
| Net Profit/Sales | 13.36% | 16.80% | 19.03% |
7.5 Projected Cash Flow
The cash flow projection shows that provisions for ongoing expenses are adequate to meet the needs of the company as the business generates sufficient cash flow to support operations. The table shows the planned repayment of our long-term loan over seven years.

| Pro Forma Cash Flow | |||
| Year 1 | Year 2 | Year 3 | |
| Cash Received | |||
| Cash from Operations | |||
| Cash Sales | $158,702 | $225,258 | $291,810 |
| Cash from Receivables | $42,899 | $70,891 | $93,076 |
| Subtotal Cash from Operations | $201,601 | $296,149 | $384,886 |
| Additional Cash Received | |||
| Sales Tax, VAT, HST/GST Received | $0 | $0 | $0 |
| New Current Borrowing | $0 | $0 | $0 |
| New Other Liabilities (interest-free) | $0 | $0 | $0 |
| New Long-term Liabilities | $0 | $0 | $0 |
| Sales of Other Current Assets | $0 | $0 | $0 |
| Sales of Long-term Assets | $0 | $0 | $0 |
| New Investment Received | $0 | $0 | $0 |
| Subtotal Cash Received | $201,601 | $296,149 | $384,886 |
| Expenditures | Year 1 | Year 2 | Year 3 |
| Expenditures from Operations | |||
| Cash Spending | $41,280 | $68,000 | $81,120 |
| Bill Payments | $125,633 | $175,686 | $225,656 |
| Subtotal Spent on Operations | $166,913 | $243,686 | $306,776 |
| Additional Cash Spent | |||
| Sales Tax, VAT, HST/GST Paid Out | $0 | $0 | $0 |
| Principal Repayment of Current Borrowing | $0 | $0 | $0 |
| Other Liabilities Principal Repayment | $0 | $0 | $0 |
| Long-term Liabilities Principal Repayment | $5,230 | $5,230 | $5,230 |
| Purchase Other Current Assets | $2,000 | $0 | $0 |
| Purchase Long-term Assets | $0 | $0 | $0 |
| Dividends | $0 | $0 | $0 |
| Subtotal Cash Spent | $174,143 | $248,916 | $312,006 |
| Net Cash Flow | $27,458 | $47,233 | $72,879 |
| Cash Balance | $37,458 | $84,691 | $157,570 |
7.6 Projected Balance Sheet
The following table presents the Balance Sheet for Gymnastics Jump-Start. Our cash, retained earnings, and net worth will increase steadily as we establish a stable, returning customer base.
| Pro Forma Balance Sheet | |||
| Year 1 | Year 2 | Year 3 | |
| Assets | |||
| Current Assets | |||
| Cash | $37,458 | $84,691 | $157,570 |
| Accounts Receivable | $10,002 | $14,197 | $18,391 |
| Other Current Assets | $2,000 | $2,000 | $2,000 |
| Total Current Assets | $49,460 | $100,888 | $177,962 |
| Long-term Assets | |||
| Long-term Assets | $40,000 | $40,000 | $40,000 |
| Accumulated Depreciation | $4,000 | $8,000 | $12,000 |
| Total Long-term Assets | $36,000 | $32,000 | $28,000 |
| Total Assets | $85,460 | $132,888 | $205,962 |
| Liabilities and Capital | Year 1 | Year 2 | Year 3 |
| Current Liabilities | |||
| Accounts Payable | $12,420 | $14,621 | $18,899 |
| Current Borrowing | $0 | $0 | $0 |
| Other Current Liabilities | $0 | $0 | $0 |
| Subtotal Current Liabilities | $12,420 | $14,621 | $18,899 |
| Long-term Liabilities | $31,370 | $26,140 | $20,910 |
| Total Liabilities | $43,791 | $40,761 | $39,809 |
| Paid-in Capital | $50,000 | $50,000 | $50,000 |
| Retained Earnings | ($36,600) | ($8,330) | $42,127 |
| Earnings | $28,270 | $50,457 | $74,026 |
| Total Capital | $41,670 | $92,127 | $166,153 |
| Total Liabilities and Capital | $85,460 | $132,888 | $205,962 |
| Net Worth | $41,670 | $92,127 | $166,153 |
7.7 Business Ratios
The following table outlines some of the more important ratios from the Gymnastic instruction industry. The final column, Industry Profile, details specific ratios based on the industry as it is classified by the Standard Industry Classification (SIC) code, 7999.1109.
| Ratio Analysis | ||||
| Year 1 | Year 2 | Year 3 | Industry Profile | |
| Sales Growth | 0.00% | 41.94% | 29.54% | 4.94% |
| Percent of Total Assets | ||||
| Accounts Receivable | 11.70% | 10.68% | 8.93% | 5.13% |
| Other Current Assets | 2.34% | 1.51% | 0.97% | 36.35% |
| Total Current Assets | 57.88% | 75.92% | 86.41% | 43.63% |
| Long-term Assets | 42.12% | 24.08% | 13.59% | 56.37% |
| Total Assets | 100.00% | 100.00% | 100.00% | 100.00% |
| Current Liabilities | 14.53% | 11.00% | 9.18% | 21.68% |
| Long-term Liabilities | 36.71% | 19.67% | 10.15% | 31.17% |
| Total Liabilities | 51.24% | 30.67% | 19.33% | 52.85% |
| Net Worth | 48.76% | 69.33% | 80.67% | 47.15% |
| Percent of Sales | ||||
| Sales | 100.00% | 100.00% | 100.00% | 100.00% |
| Gross Margin | 67.78% | 67.84% | 64.64% | 100.00% |
| Selling, General & Administrative Expenses | 54.42% | 51.04% | 45.62% | 76.74% |
| Advertising Expenses | 0.00% | 0.00% | 0.00% | 2.84% |
| Profit Before Interest and Taxes | 20.68% | 24.96% | 27.78% | 2.11% |
| Main Ratios | ||||
| Current | 3.98 | 6.90 | 9.42 | 1.05 |
| Quick | 3.98 | 6.90 | 9.42 | 0.69 |
| Total Debt to Total Assets | 51.24% | 30.67% | 19.33% | 62.49% |
| Pre-tax Return on Net Worth | 96.92% | 78.24% | 63.65% | 2.98% |
| Pre-tax Return on Assets | 47.26% | 54.24% | 51.35% | 7.95% |
| Additional Ratios | Year 1 | Year 2 | Year 3 | |
| Net Profit Margin | 13.36% | 16.80% | 19.03% | n.a |
| Return on Equity | 67.84% | 54.77% | 44.55% | n.a |
| Activity Ratios | ||||
| Accounts Receivable Turnover | 5.29 | 5.29 | 5.29 | n.a |
| Collection Days | 57 | 59 | 61 | n.a |
| Accounts Payable Turnover | 11.12 | 12.17 | 12.17 | n.a |
| Payment Days | 27 | 28 | 27 | n.a |
| Total Asset Turnover | 2.48 | 2.26 | 1.89 | n.a |
| Debt Ratios | ||||
| Debt to Net Worth | 1.05 | 0.44 | 0.24 | n.a |
| Current Liab. to Liab. | 0.28 | 0.36 | 0.47 | n.a |
| Liquidity Ratios | ||||
| Net Working Capital | $37,040 | $86,267 | $159,063 | n.a |
| Interest Coverage | 12.96 | 26.07 | 45.95 | n.a |
| Additional Ratios | ||||
| Assets to Sales | 0.40 | 0.44 | 0.53 | n.a |
| Current Debt/Total Assets | 15% | 11% | 9% | n.a |
| Acid Test | 3.18 | 5.93 | 8.44 | n.a |
| Sales/Net Worth | 5.08 | 3.26 | 2.34 | n.a |
| Dividend Payout | 0.00 | 0.00 | 0.00 | n.a |
Appendix
| Sales Forecast | |||||||||||||
| Month 1 | Month 2 | Month 3 | Month 4 | Month 5 | Month 6 | Month 7 | Month 8 | Month 9 | Month 10 | Month 11 | Month 12 | ||
| Sales | |||||||||||||
| Parent and Tot | 0% | $450 | $464 | $477 | $492 | $506 | $522 | $537 | $553 | $570 | $587 | $605 | $623 |
| Preschool | 0% | $4,568 | $4,705 | $4,846 | $4,992 | $5,141 | $5,296 | $5,454 | $5,618 | $5,787 | $5,960 | $6,139 | $6,323 |
| Girls | 0% | $4,096 | $4,219 | $4,345 | $4,476 | $4,610 | $4,748 | $4,891 | $5,038 | $5,189 | $5,344 | $5,505 | $5,670 |
| Boys | 0% | $820 | $845 | $870 | $896 | $923 | $951 | $979 | $1,008 | $1,039 | $1,070 | $1,102 | $1,135 |
| Tumbling and Adult Gymnastics | 0% | $1,840 | $1,895 | $1,952 | $2,011 | $2,071 | $2,133 | $2,197 | $2,263 | $2,331 | $2,401 | $2,473 | $2,547 |
| Birthday Parties and Field Trips | 0% | $550 | $567 | $583 | $601 | $619 | $638 | $657 | $676 | $697 | $718 | $739 | $761 |
| Cheerleading | 0% | $1,000 | $1,030 | $1,061 | $1,093 | $1,126 | $1,159 | $1,194 | $1,230 | $1,267 | $1,305 | $1,344 | $1,384 |
| Advanced Girls | 0% | $1,586 | $1,634 | $1,683 | $1,733 | $1,785 | $1,839 | $1,894 | $1,951 | $2,009 | $2,069 | $2,131 | $2,195 |
| Total Sales | $14,910 | $15,357 | $15,818 | $16,293 | $16,781 | $17,285 | $17,803 | $18,337 | $18,888 | $19,454 | $20,038 | $20,639 | |
| Direct Cost of Sales | Month 1 | Month 2 | Month 3 | Month 4 | Month 5 | Month 6 | Month 7 | Month 8 | Month 9 | Month 10 | Month 11 | Month 12 | |
| Preschool gymnastics teachers | 30% | $1,505 | $1,551 | $1,597 | $1,645 | $1,694 | $1,745 | $1,798 | $1,851 | $1,907 | $1,964 | $2,023 | $2,084 |
| Beginner girls, boy, and tumbling teachers | 30% | $2,027 | $2,088 | $2,150 | $2,215 | $2,281 | $2,350 | $2,420 | $2,493 | $2,567 | $2,645 | $2,724 | $2,806 |
| Advanced girls teachers | 40% | $1,034 | $1,065 | $1,097 | $1,130 | $1,164 | $1,199 | $1,235 | $1,272 | $1,310 | $1,350 | $1,390 | $1,432 |
| Subtotal Direct Cost of Sales | $4,567 | $4,704 | $4,845 | $4,990 | $5,140 | $5,294 | $5,453 | $5,616 | $5,785 | $5,958 | $6,137 | $6,321 | |
| Personnel Plan | |||||||||||||
| Month 1 | Month 2 | Month 3 | Month 4 | Month 5 | Month 6 | Month 7 | Month 8 | Month 9 | Month 10 | Month 11 | Month 12 | ||
| Receptionist | 0% | $1,440 | $1,440 | $1,440 | $1,440 | $1,440 | $1,440 | $1,440 | $1,440 | $1,440 | $1,440 | $1,440 | $1,440 |
| Wanda Bounce | 0% | $1,000 | $1,000 | $1,000 | $1,000 | $1,000 | $1,000 | $1,000 | $1,000 | $1,000 | $1,000 | $1,000 | $1,000 |
| Bea Flip | 0% | $1,000 | $1,000 | $1,000 | $1,000 | $1,000 | $1,000 | $1,000 | $1,000 | $1,000 | $1,000 | $1,000 | $1,000 |
| Total People | 8 | 8 | 8 | 8 | 8 | 8 | 8 | 8 | 8 | 8 | 8 | 8 | |
| Total Payroll | $3,440 | $3,440 | $3,440 | $3,440 | $3,440 | $3,440 | $3,440 | $3,440 | $3,440 | $3,440 | $3,440 | $3,440 | |
| Pro Forma Profit and Loss | |||||||||||||
| Month 1 | Month 2 | Month 3 | Month 4 | Month 5 | Month 6 | Month 7 | Month 8 | Month 9 | Month 10 | Month 11 | Month 12 | ||
| Sales | $14,910 | $15,357 | $15,818 | $16,293 | $16,781 | $17,285 | $17,803 | $18,337 | $18,888 | $19,454 | $20,038 | $20,639 | |
| Direct Cost of Sales | $4,567 | $4,704 | $4,845 | $4,990 | $5,140 | $5,294 | $5,453 | $5,616 | $5,785 | $5,958 | $6,137 | $6,321 | |
| Other Costs of Sales | $280 | $280 | $280 | $280 | $280 | $280 | $280 | $280 | $280 | $280 | $280 | $280 | |
| Total Cost of Sales | $4,847 | $4,984 | $5,125 | $5,270 | $5,420 | $5,574 | $5,733 | $5,896 | $6,065 | $6,238 | $6,417 | $6,601 | |
| Gross Margin | $10,063 | $10,374 | $10,693 | $11,023 | $11,362 | $11,711 | $12,071 | $12,441 | $12,823 | $13,216 | $13,621 | $14,038 | |
| Gross Margin % | 67.49% | 67.55% | 67.60% | 67.65% | 67.70% | 67.75% | 67.80% | 67.85% | 67.89% | 67.93% | 67.97% | 68.02% | |
| Expenses | |||||||||||||
| Payroll | $3,440 | $3,440 | $3,440 | $3,440 | $3,440 | $3,440 | $3,440 | $3,440 | $3,440 | $3,440 | $3,440 | $3,440 | |
| Marketing/Promotion | $2,000 | $200 | $200 | $200 | $700 | $200 | $200 | $200 | $200 | $500 | $200 | $200 | |
| Depreciation | $333 | $333 | $333 | $333 | $333 | $333 | $333 | $333 | $333 | $333 | $333 | $337 | |
| Rent | $2,000 | $2,000 | $2,000 | $2,000 | $2,000 | $2,000 | $2,000 | $2,000 | $2,000 | $2,000 | $2,000 | $2,000 | |
| Utilities | $250 | $250 | $250 | $250 | $250 | $250 | $400 | $400 | $400 | $400 | $250 | $250 | |
| Insurance | $1,666 | $1,666 | $1,666 | $1,666 | $1,666 | $1,666 | $1,666 | $1,666 | $1,666 | $1,666 | $1,666 | $1,666 | |
| Payroll Taxes | 15% | $0 | $0 | $0 | $0 | $0 | $0 | $0 | $0 | $0 | $0 | $0 | $0 |
| Other | $150 | $150 | $150 | $150 | $150 | $150 | $150 | $150 | $150 | $150 | $150 | $150 | |
| Total Operating Expenses | $9,839 | $8,039 | $8,039 | $8,039 | $8,539 | $8,039 | $8,189 | $8,189 | $8,189 | $8,489 | $8,039 | $8,043 | |
| Profit Before Interest and Taxes | $224 | $2,335 | $2,654 | $2,984 | $2,823 | $3,672 | $3,882 | $4,252 | $4,634 | $4,727 | $5,582 | $5,995 | |
| EBITDA | $557 | $2,668 | $2,987 | $3,317 | $3,156 | $4,005 | $4,215 | $4,585 | $4,967 | $5,060 | $5,915 | $6,332 | |
| Interest Expense | $301 | $298 | $294 | $290 | $287 | $283 | $280 | $276 | $272 | $269 | $265 | $261 | |
| Taxes Incurred | ($23) | $611 | $708 | $808 | $761 | $1,017 | $1,081 | $1,193 | $1,308 | $1,337 | $1,595 | $1,720 | |
| Net Profit | ($54) | $1,426 | $1,652 | $1,885 | $1,775 | $2,372 | $2,521 | $2,783 | $3,053 | $3,121 | $3,722 | $4,013 | |
| Net Profit/Sales | -0.36% | 9.28% | 10.44% | 11.57% | 10.58% | 13.72% | 14.16% | 15.18% | 16.16% | 16.04% | 18.57% | 19.45% | |
| Pro Forma Cash Flow | |||||||||||||
| Month 1 | Month 2 | Month 3 | Month 4 | Month 5 | Month 6 | Month 7 | Month 8 | Month 9 | Month 10 | Month 11 | Month 12 | ||
| Cash Received | |||||||||||||
| Cash from Operations | |||||||||||||
| Cash Sales | $11,183 | $11,518 | $11,864 | $12,219 | $12,586 | $12,964 | $13,352 | $13,753 | $14,166 | $14,591 | $15,028 | $15,479 | |
| Cash from Receivables | $0 | $124 | $3,731 | $3,843 | $3,958 | $4,077 | $4,200 | $4,326 | $4,455 | $4,589 | $4,727 | $4,868 | |
| Subtotal Cash from Operations | $11,183 | $11,642 | $15,595 | $16,063 | $16,544 | $17,041 | $17,552 | $18,079 | $18,621 | $19,180 | $19,755 | $20,348 | |
| Additional Cash Received | |||||||||||||
| Sales Tax, VAT, HST/GST Received | 0.00% | $0 | $0 | $0 | $0 | $0 | $0 | $0 | $0 | $0 | $0 | $0 | $0 |
| New Current Borrowing | $0 | $0 | $0 | $0 | $0 | $0 | $0 | $0 | $0 | $0 | $0 | $0 | |
| New Other Liabilities (interest-free) | $0 | $0 | $0 | $0 | $0 | $0 | $0 | $0 | $0 | $0 | $0 | $0 | |
| New Long-term Liabilities | $0 | $0 | $0 | $0 | $0 | $0 | $0 | $0 | $0 | $0 | $0 | $0 | |
| Sales of Other Current Assets | $0 | $0 | $0 | $0 | $0 | $0 | $0 | $0 | $0 | $0 | $0 | $0 | |
| Sales of Long-term Assets | $0 | $0 | $0 | $0 | $0 | $0 | $0 | $0 | $0 | $0 | $0 | $0 | |
| New Investment Received | $0 | $0 | $0 | $0 | $0 | $0 | $0 | $0 | $0 | $0 | $0 | $0 | |
| Subtotal Cash Received | $11,183 | $11,642 | $15,595 | $16,063 | $16,544 | $17,041 | $17,552 | $18,079 | $18,621 | $19,180 | $19,755 | $20,348 | |
| Expenditures | Month 1 | Month 2 | Month 3 | Month 4 | Month 5 | Month 6 | Month 7 | Month 8 | Month 9 | Month 10 | Month 11 | Month 12 | |
| Expenditures from Operations | |||||||||||||
| Cash Spending | $3,440 | $3,440 | $3,440 | $3,440 | $3,440 | $3,440 | $3,440 | $3,440 | $3,440 | $3,440 | $3,440 | $3,440 | |
| Bill Payments | $373 | $11,156 | $10,166 | $10,401 | $10,654 | $11,230 | $11,152 | $11,518 | $11,790 | $12,078 | $12,560 | $12,553 | |
| Subtotal Spent on Operations | $3,813 | $14,596 | $13,606 | $13,841 | $14,094 | $14,670 | $14,592 | $14,958 | $15,230 | $15,518 | $16,000 | $15,993 | |
| Additional Cash Spent | |||||||||||||
| Sales Tax, VAT, HST/GST Paid Out | $0 | $0 | $0 | $0 | $0 | $0 | $0 | $0 | $0 | $0 | $0 | $0 | |
| Principal Repayment of Current Borrowing | $0 | $0 | $0 | $0 | $0 | $0 | $0 | $0 | $0 | $0 | $0 | $0 | |
| Other Liabilities Principal Repayment | $0 | $0 | $0 | $0 | $0 | $0 | $0 | $0 | $0 | $0 | $0 | $0 | |
| Long-term Liabilities Principal Repayment | $436 | $436 | $436 | $436 | $436 | $436 | $436 | $436 | $436 | $436 | $436 | $437 | |
| Purchase Other Current Assets | $0 | $0 | $2,000 | $0 | $0 | $0 | $0 | $0 | $0 | $0 | $0 | $0 | |
| Purchase Long-term Assets | $0 | $0 | $0 | $0 | $0 | $0 | $0 | $0 | $0 | $0 | $0 | $0 | |
| Dividends | $0 | $0 | $0 | $0 | $0 | $0 | $0 | $0 | $0 | $0 | $0 | $0 | |
| Subtotal Cash Spent | $4,249 | $15,032 | $16,042 | $14,277 | $14,530 | $15,106 | $15,028 | $15,394 | $15,666 | $15,954 | $16,436 | $16,430 | |
| Net Cash Flow | $6,934 | ($3,390) | ($447) | $1,786 | $2,014 | $1,935 | $2,524 | $2,685 | $2,955 | $3,226 | $3,319 | $3,917 | |
| Cash Balance | $16,934 | $13,544 | $13,097 | $14,883 | $16,897 | $18,832 | $21,356 | $24,041 | $26,996 | $30,221 | $33,541 | $37,458 | |
| Pro Forma Balance Sheet | |||||||||||||
| Month 1 | Month 2 | Month 3 | Month 4 | Month 5 | Month 6 | Month 7 | Month 8 | Month 9 | Month 10 | Month 11 | Month 12 | ||
| Assets | Starting Balances | ||||||||||||
| Current Assets | |||||||||||||
| Cash | $10,000 | $16,934 | $13,544 | $13,097 | $14,883 | $16,897 | $18,832 | $21,356 | $24,041 | $26,996 | $30,221 | $33,541 | $37,458 |
| Accounts Receivable | $0 | $3,728 | $7,443 | $7,666 | $7,896 | $8,133 | $8,377 | $8,628 | $8,887 | $9,153 | $9,428 | $9,711 | $10,002 |
| Other Current Assets | $0 | $0 | $0 | $2,000 | $2,000 | $2,000 | $2,000 | $2,000 | $2,000 | $2,000 | $2,000 | $2,000 | $2,000 |
| Total Current Assets | $10,000 | $20,661 | $20,986 | $22,762 | $24,778 | $27,030 | $29,208 | $31,984 | $34,928 | $38,149 | $41,649 | $45,252 | $49,460 |
| Long-term Assets | |||||||||||||
| Long-term Assets | $40,000 | $40,000 | $40,000 | $40,000 | $40,000 | $40,000 | $40,000 | $40,000 | $40,000 | $40,000 | $40,000 | $40,000 | $40,000 |
| Accumulated Depreciation | $0 | $333 | $666 | $999 | $1,332 | $1,665 | $1,998 | $2,331 | $2,664 | $2,997 | $3,330 | $3,663 | $4,000 |
| Total Long-term Assets | $40,000 | $39,667 | $39,334 | $39,001 | $38,668 | $38,335 | $38,002 | $37,669 | $37,336 | $37,003 | $36,670 | $36,337 | $36,000 |
| Total Assets | $50,000 | $60,328 | $60,320 | $61,763 | $63,446 | $65,365 | $67,210 | $69,653 | $72,264 | $75,152 | $78,319 | $81,589 | $85,460 |
| Liabilities and Capital | Month 1 | Month 2 | Month 3 | Month 4 | Month 5 | Month 6 | Month 7 | Month 8 | Month 9 | Month 10 | Month 11 | Month 12 | |
| Current Liabilities | |||||||||||||
| Accounts Payable | $0 | $10,818 | $9,820 | $10,046 | $10,280 | $10,859 | $10,768 | $11,125 | $11,388 | $11,660 | $12,142 | $12,125 | $12,420 |
| Current Borrowing | $0 | $0 | $0 | $0 | $0 | $0 | $0 | $0 | $0 | $0 | $0 | $0 | $0 |
| Other Current Liabilities | $0 | $0 | $0 | $0 | $0 | $0 | $0 | $0 | $0 | $0 | $0 | $0 | $0 |
| Subtotal Current Liabilities | $0 | $10,818 | $9,820 | $10,046 | $10,280 | $10,859 | $10,768 | $11,125 | $11,388 | $11,660 | $12,142 | $12,125 | $12,420 |
| Long-term Liabilities | $36,600 | $36,164 | $35,729 | $35,293 | $34,857 | $34,421 | $33,986 | $33,550 | $33,114 | $32,679 | $32,243 | $31,807 | $31,370 |
| Total Liabilities | $36,600 | $46,982 | $45,548 | $45,339 | $45,137 | $45,280 | $44,754 | $44,675 | $44,503 | $44,338 | $44,385 | $43,932 | $43,791 |
| Paid-in Capital | $50,000 | $50,000 | $50,000 | $50,000 | $50,000 | $50,000 | $50,000 | $50,000 | $50,000 | $50,000 | $50,000 | $50,000 | $50,000 |
| Retained Earnings | ($36,600) | ($36,600) | ($36,600) | ($36,600) | ($36,600) | ($36,600) | ($36,600) | ($36,600) | ($36,600) | ($36,600) | ($36,600) | ($36,600) | ($36,600) |
| Earnings | $0 | ($54) | $1,372 | $3,024 | $4,909 | $6,684 | $9,056 | $11,578 | $14,361 | $17,414 | $20,535 | $24,256 | $28,270 |
| Total Capital | $13,400 | $13,346 | $14,772 | $16,424 | $18,309 | $20,084 | $22,456 | $24,978 | $27,761 | $30,814 | $33,935 | $37,656 | $41,670 |
| Total Liabilities and Capital | $50,000 | $60,328 | $60,320 | $61,763 | $63,446 | $65,365 | $67,210 | $69,653 | $72,264 | $75,152 | $78,319 | $81,589 | $85,460 |
| Net Worth | $13,400 | $13,346 | $14,772 | $16,424 | $18,309 | $20,084 | $22,456 | $24,978 | $27,761 | $30,814 | $33,935 | $37,656 | $41,670 |

