
Durango Gravel
Executive Summary
Durango Gravel, Inc. produces and sells types and grades of gravel to public and private customers in the Four Corners Region, concentrating on the area around Durango, Colorado. In just five months of operation, we operated at a profit, recording $250,000 in sales and selling almost 49,000 tons of gravel products.
Our goal for this year is to penetrate the asphalt market, with its high profitability and limited competition. By adding an asphalt plant, and meeting our minimum goals of 45,500 tons of asphalt, we plan to sell over 191,000 tons of gravel products to municipalities, contractors and end-users, with sales of over $2,696,000 and net profits of $854,000.
We have experienced significant success penetrating the local market by offering superior products and customer service.
Our keys to continued success are:
- Expanding into the asphalt market.
- Establishing and maintaining working relationships with major institutional users.
- Exploiting the coming void in gravel supplies to establish a market niche.
- Developing a net profit margin above 30%.
- Effectively communicating to our existing and potential customers, through targeted efforts, our position as a differentiated provider of the highest-quality gravel and asphalt products.
1.1 Objectives
The objectives of Durango Gravel, Inc. for the coming year:
ASPHALT
- Establish strategic working relationships with the major asphalt users in the area.
- Develop initial sales of 45.5K tons of asphalt, resulting in first-year sales of $1,638,000.
- Increase Sales over a three-year period to 77K tons per year.
GRAVEL
- Continue to develop strategic working relationships with the 10-15 major institutional users.
- Hit target gravel sales levels of 145.5K tons of both road base and screened rock, resulting in gravel sales of $1,064,000.
- Continue to exploit the weaknesses inherent in the major area competitors to increase our presence in the local market area.
1.2 Mission
Durango Gravel, Inc. serves municipalities, construction companies and individual users by providing superior-quality products manufactured to the highest standards at competitive prices.
Our principals have a history of valuing relationships with their customers. We communicate our commitment to quality and customer appreciation through outstanding product quality, personal service and efficient delivery. Our commitment to our customers is reflected through honest and responsible business practices.
1.3 Keys to Success
The keys to success for Durango Gravel, Inc.:
- Establishing and maintaining working relationships and contractual agreements with municipality and business sector clients.
- Increasing our facility to maximum production within the next three years.
- Continuing our position as a customer-service-oriented company with competitive pricing.
- Increasing our profit margins and decreasing our production costs.
- Developing a presence in the asphalt market with area users.
Company Summary
Durango Gravel manufactures numerous types of gravel products from base rock. These products are 3/4″ and 3″ ABC, 3/8″, 1/2″, 3/4″ 1-11/2″ screened and washed rock, 1″-3″ cobble, and 4″-6″ cobble. In addition, we provide, pre-washed sand, fill dirt, topsoil, bedding materials and crusher fines, along with various sizes of boulders. These products are sold to municipalities, business entities and end users in the Four Corners Region, with a concentration around Durango, Colorado.
The pit site has been the location of Durango, a locally owned gravel pit, for over 15 years. We have greatly expanded the base of customers in the last six months.
2.1 Company Ownership
Durango Gravel, Inc. is incorporated as a “S” Corporation under the laws of Colorado, and Colorado laws shall govern and take precedence.
Two classes of stock shares have been issued as follows:
1000 Class “A” Stock Shares – Voting Rights Only – No Dividend Rights
Justin McCarty – 510 Shares
Chad Hughes – 490 Shares
1000 Class “B” Stock Shares – Dividend Shares Only – No Voting Rights
Justin McCarty – 450 Shares
Chad Hughes – 450 Shares
Not Issued – 100 Shares
Net profits are distributed in the form of dividends on a basis which shall be determined from time to time. Corporate officers are as follows:
Justin McCarty: president, treasurer, chief executive officer and chief financial officer. Justin McCarty designs and directs the overall corporate strategy.
Chad Hughes: vice president, secretary, chief operating officer and chief financial officer. Chad Hughes directs the day-to-day operations of the corporation.
At the end of each year, a meeting of the directors decides the management responsibilities for the following year.
2.2 Company History
Durango Gravel, Inc. was formed in June, 2000. The principals of the corporation are as follows:
Justin McCarty, Bayfield, Colorado – Owner of an excavating, landscaping, trucking and road grading business, Mr. McCarty has extensive experience in all phases of gravel and rock hauling, production and industry practices. Mr. McCarty oversees operations of the corporation, and additionally, is a major consumer of plant products. He also will be a consumer of asphalt products.
Chad Hughes, Durango, Colorado – Educated in natural resources management, and with extensive customer-service experience, Mr. Hughes focuses on developing public accounts and day-to-day operations.
In June, 2000 the corporation entered into a five-year lease agreement with Durango Gravel, a locally-owned gravel pit, giving the mineral rights for a five-year period, renewable for additional five-year periods. With no advertising, marketing or crushing operations, the pit had been selling approximately 24,000 tons of gravel per year. In addition, options were obtained on a number of other parcels suitable for gravel pits.
The corporation invested approximately $700,000 in crushing and production equipment, and began operations on July 24, 2000. In the five months of operation in year 2000, sales of 47,000 tons of material were recorded, mostly in road base material, with an average of 9,000 tons per month.
Our goal of penetrating the local market and taking advantage of the niche available was met, with a number of the major area contractors utilizing our products. Our customer service policies have met with near universal praise and acceptance. We are developing a reputation as an honest, customer-service oriented company with superior products.
We have made substantial inroads into the institutional market, receiving gravel awards from municipalities, county, state and institutional entities. We had an operating profit for year 2000, despite an unanticipated additional $40,000 in equipment maintenance costs. We are poised to make more major inroads in the local market, with the spring and summer season for higher-profit screened rock fast approaching.
| Past Performance | |||
| 1998 | 1999 | 2000 | |
| Sales | $0 | $0 | $250,065 |
| Gross Margin | $0 | $0 | $250,065 |
| Gross Margin % | 0.00% | 0.00% | 100.00% |
| Operating Expenses | $0 | $0 | $244,981 |
| Collection Period (days) | 0 | 0 | 64 |
| Inventory Turnover | 0.00 | 0.00 | 1.00 |
| Balance Sheet | |||
| 1998 | 1999 | 2000 | |
| Current Assets | |||
| Cash | $0 | $0 | $1,379 |
| Accounts Receivable | $0 | $0 | $83,354 |
| Inventory | $0 | $0 | $657,640 |
| Other Current Assets | $0 | $0 | $0 |
| Total Current Assets | $0 | $0 | $742,373 |
| Long-term Assets | |||
| Long-term Assets | $0 | $0 | $1,056,350 |
| Accumulated Depreciation | $0 | $0 | $0 |
| Total Long-term Assets | $0 | $0 | $1,056,350 |
| Total Assets | $0 | $0 | $1,798,723 |
| Current Liabilities | |||
| Accounts Payable | $0 | $0 | $18,888 |
| Current Borrowing | $0 | $0 | $0 |
| Other Current Liabilities (interest free) | $0 | $0 | $10,835 |
| Total Current Liabilities | $0 | $0 | $29,723 |
| Long-term Liabilities | $0 | $0 | $673,936 |
| Total Liabilities | $0 | $0 | $703,659 |
| Paid-in Capital | $0 | $0 | $1,084,896 |
| Retained Earnings | $0 | $0 | $5,084 |
| Earnings | $0 | $0 | $5,084 |
| Total Capital | $0 | $0 | $1,095,064 |
| Total Capital and Liabilities | $0 | $0 | $1,798,723 |
| Other Inputs | |||
| Payment Days | 0 | 0 | 60 |
| Sales on Credit | $0 | $0 | $237,000 |
| Receivables Turnover | 0.00 | 0.00 | 2.84 |
2.3 Company Locations and Facilities
Our pit is located in Durango, Colorado, the hub of the southwest Colorado Region and the major city in La Plata County. The gravel pit has a primary and secondary crusher, generator, a number of loaders and excavators, and an electronic scale.
Our scale is located approximately 1/4 mile from the highway – the shortest distance of any pit in the area. The pit has a reserve of approximately 6,000,000 tons, by far the most in the area. There are approximately 60 acres, a 150 sq. ft. scale house, tool trailer and pit office. We are planning to add an additional 980 sq. ft. office this Spring.
Our corporate office is in Bayfield, Colorado – approximately 1 acre with 1,500 sq. ft. building, a 250 sq. ft. office, fence and storage area.

Products and Services
Durango Gravel Inc. deals exclusively in providing gravel and gravel-related products, including but not limited to the following:
- 3/4″ ABC
- 3″ ABC
- 3/8″ screened and washed rock
- 1/2″ screened and washed rock
- 3/4″ screened and washed rock
- 1-11/2″ screened and washed rock
- 1″-3″ cobble
- 4″-6″ cobble
- Pre-washed sand
- Fill dirt
- Topsoil
- Bedding materials
- Crusher fines
- Boulders–various sizes
The company provides consulting and products. Customers can either provide their own trucks for products, or the company will deliver for a fee. Our standard average delivery fee is $65.00, with maximum related expenses of $40.00. The only product costs will be associated with production. Company trucks delivered 416% of the loads in year 2000. Trucking was subcontracted to independent trucking companies, including Justin McCarty Trucking and Excavation.
In addition, we plan to provide SX grade asphalt.
3.1 Product and Service Description
Royalty Costs are $2.00/Ton. Manufacturing Costs are budgeted at $1.15/ton (a high figure). Starred items have no manufacturing costs.
| Asphalt | Roads and driveways, $20.90/ton | Used by everyone |
| 3″ ABC – 3/4″ ABC | Base material for roads, driveways and site fill | Used by everyone |
| 3/8″ Screened and Washed Rock (Pea Gravel) | Driveway and walkway topping, winter snow maintenance | Used by everyone |
| 1/2″ Screened and Washed Rock | Asphalt base | Used by everyone |
| 3/4″ Screened and Washed Rock | Driveways, walkways, pipe bedding, french drains | Used by everyone |
| 1-11/2″ Screened and Washed Rock | French drains and driveways | Used by everyone |
| 1″-3″ Cobble | Decoration and fill | Used by everyone |
| 4″-6″ Cobble | Decoration and large fill | Preferred by landscaping contractors |
| Pre-Washed Sand* | Pipe bedding, fill, horse arenas | Used by everyone |
| Fill Dirt* | Used by everyone | |
| Topsoil* | Landscaping | |
| Bedding Material* | ||
| Boulders* various sizes | Landscaping – wall construction |
3.2 Competitive Comparison
Within our niche we have two significant competitors, Oldcastle (Four Corners) and LaFarge, which are both multi-national corporations headquartered outside the United States. While these are both well-run companies, the local perception is that the money they earn goes directly overseas to their headquarters, as opposed to reinvesting their profits in the local economy. In addition, many of their policies are set at the corporate level, resulting in less customer-service orientation then is the norm for this region. A number of general contractors have started to utilize our products because of our ownership and policies.
There is one other significant competitor, C & J Gravel. Their reserves are limited, and offer a limited product line. A number of their major users have started to utilize our products. We expect more in the next year.
The way we compete is on the fact that we offer a larger selection of products, superior quality, and better customer service in terms of information on our product line. We compete on our road base products in terms of price and availability, with fast delivery.
3.3 Sales Literature
This year we will be producing a company catalog, which would include asphalt products for targeted customers.
3.4 Fulfillment
We produce almost all of our product line at our site, with effectively no need to outsource any materials.
3.5 Technology
The technology for the production of gravel, gravel-related products and asphalt is well established. We have developed effective and revolutionary marketing techniques for: convenient and time-saving loading of client trucks, and saving our institutional customers substantial amounts on their trucking expenses.
3.6 Future Products and Services
Our major addition this year will be asphalt, of which there is only one area producer at present. A number of contractors have expressed interest in using our asphalt.
Our long-range plan includes the opening of a second pit, in order to compete with producers in the more remote county areas.
Market Analysis Summary
Asphalt products are required for road and driveway construction. There are a significant number of roads and driveways which need to be paved each year. There is at present only one area source for asphalt. The high prices charged are a reflection of their monopoly. Thus, there is a significant niche to be filled.
Gravel and rock-related products are a necessary ingredient to road building in the area. There are a significantly large percentage of roads which need to be re-graveled each year. In addition, there is a significant percentage of the population who have “retired” to the area, and are engaged in remodeling and making their new homes more accessible.
Also, the previously-described “window of opportunity” and the vulnerability of competitors to a customer-oriented operation are significant. The average end-user is more concerned with customer service than with price.
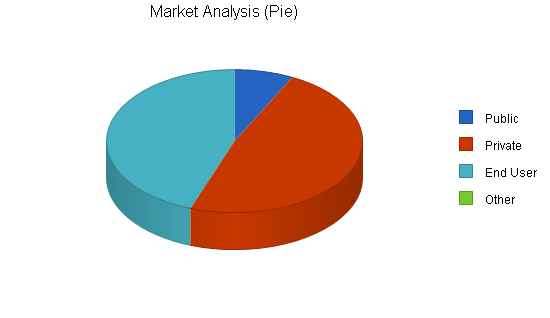
4.1 Market Segmentation
The major customer groups for Durango Gravel, Inc. are:
Municipalities, Schools and State Agencies. There are 12 municipalities in the immediate area who are using, or have needs for, our products and are in our target market. They are able to utilize our products and the quantities we could manufacture. As of this date, five are using us as one of their sources.
Larger Construction Companies. Many of the larger construction companies bid on state, county, city and large private construction projects, We have bid on their gravel products and received 12 awards in the past six months. We plan to bid on their asphalt needs as well this year.
Construction and Private Companies. The area is filled with smaller contractors who either purchase concrete, gravel and asphalt products directly, or arrange for them for a fee. Many of the smaller contractors are not compensated to a significant degree, and have been eager to utilize a company such as ours.
| Market Analysis | |||||||
| 2001 | 2002 | 2003 | 2004 | 2005 | |||
| Potential Customers | Growth | CAGR | |||||
| Public | 15% | 10 | 12 | 14 | 16 | 18 | 15.83% |
| Private | 15% | 65 | 75 | 86 | 99 | 114 | 15.08% |
| End User | 20% | 60 | 72 | 86 | 103 | 124 | 19.90% |
| Other | 0% | 0 | 0 | 0 | 0 | 0 | 0.00% |
| Total | 17.35% | 135 | 159 | 186 | 218 | 256 | 17.35% |
4.2 Target Market Segment Strategy
The population of the Four Corners Area has increased dramatically in the last 10 years and is still increasing, creating a greater demand for houses and roads. A large percentage of this increase is attributed to both retirees, and those with substantial incomes who have purchased a second home. Many people belonging to these groups have come from areas where good customer service is expected, and had been unhappy with the quality of customer service available before we began operations.
4.2.1 Market Needs
We understand that our target market needs more than just asphalt and gravel products. This need has grown out of increased population growth, the influx of a segmented customer base with significant disposable income, and the lack of change of our competitors to increased customer service requirements.
4.2.2 Market Trends
The market for asphalt, gravel and gravel-related products has grown at a steady rate for the past seven years, and shows no signs of abating. There are trends toward both more institutional and private road development and more private end-user interest in quality and customer service.
4.2.3 Market Growth
According to the three major suppliers in the region, as well as the La Plata Area Chamber of Commerce, the market in construction products has grown at 12% per year for the past three years, and is projected to increase. More important is the increased need for road-related products. With an almost 45% population increase in the county in the last 10 years, it is estimated that over 35% of existing county roads will require maintenance in the next four years. In addition, the extensive winters in the region are particularly difficult on gravel roads. After two mild winters, this winter of normal snow will result in an increase in road maintenance.
4.3 Service Business Analysis
The last decade has shown a consolidation of suppliers by nationwide corporations. In numerous instances, these companies have policies which are set on a national level and are not “user-friendly” or responsive to the particular needs of this region.
The area asphalt market has but one producer at present, with predictable non-competitive pricing and customer service policies.
4.3.1 Competition and Buying Patterns
The Durango area is a region where “Word-of-Mouth” endorsements are unusually important. Most private end-user customers seem to choose their provider based on quick delivery, friendliness and customer service. Business and construction-related users choose based on the establishment of a mutually beneficial and trustworthy relationship.
4.3.2 Main Competitors
Oldcastle (Four Corners Materials)
Strengths – long-term relationships, 30 years in business, long-term employees, decent quality.
Weaknesses – product, price and credit flexibility, foreign ownership, product reserves, travel and loading time, monopolistic practices in regards to asphalt.
C & J
Strengths – established, local ownership.
Weaknesses – limited products, limited reserves, location.
4.3.3 Business Participants
The main sales volume in this area is now concentrated in the following companies:
Asphalt: Oldcastle (Four Corners Materials).
Gravel (Durango): Oldcastle (Four Corners Materials), Durango Gravel, Inc., C & J, Sandco.
(Outlying Areas): LaFarge, Gosney & Sons, Hocker.
All of these other companies compete with similar limited products and unchanging company policies. Products are similar, costs are important, but customer service and perception of honesty is critical. Our company has increased its participation in the local gravel market by 400% in just five months.
Strategy and Implementation Summary
Durango Gravel, Inc.’s strategy is as follows:
- Add an asphalt plant as quickly as possible to penetrate the asphalt market.
- Continue to expand gravel sales.
- Continue our uniquely designed service for those customers with their own delivery trucks.
- Continue the establishment of long-term, mutually-beneficial relationships with commercial accounts.
- Continue our revolutionary program to cut delivery costs for municipalities and industry end-users.
- Aggressively market our “Consumer-Oriented” focus.
We intend to maximize product sales through aggressive marketing, penetrate the asphalt market, and increase our targeted marketing efforts.
5.1 Strategy Pyramid
Our main strategy at Durango Gravel, Inc. is to position ourselves at the top of the quality scale, featuring our combination of fine quality products and the best customer service in the region.
We are committed to communicating our “Quality” position to the market. Programs are mainly those listed in the Milestones Table, including the continued acquisition of public-sector accounts.
5.2 Value Proposition
We offer our target customer, who cares about personal service, as well as product quality, a vendor who acts as a strategic ally, with the highest quality asphalt and gravel products at a premium price that reflects the value of reassurance that systems will work.
5.3 Marketing Strategy
The marketing strategy is the core of the main strategy, and is multi-faceted:
- Penetrate the asphalt market.
- Emphasize personal service and support.
- Foster a long-term relationship business.
- Focus on the public-sector, major contractor and high-end homeowner as key target markets.
- Induce more companies to utilize our revolutionary delivery and loading strategies.
5.3.1 Pricing Strategy
With regard to products carried by our competitors, our pricing strategy will be to either match their prices, or to be marginally lower. We expect that our superior service will be a major factor.
5.4 Competitive Edge
Our competitive edge is our quality product, location, emphasis on customer service, and our long-term availability of products.
5.5 Sales Strategy
We need to sell our company, not just the products. We have to sell our service and support.
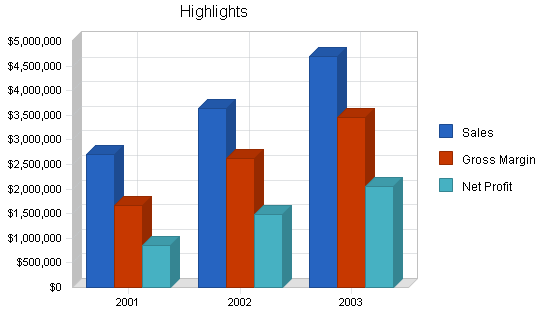
The Yearly Total Sales chart summarizes our ambitious sales forecast. We expect sales to increase from $250,000 last year to approximately $2.7 million next year. The marketing strategy is the core of the main strategy, and is multi-faceted.

5.5.1 Sales Forecast
Sales forecasts are based on the following information:
- The acquisition of an asphalt plant, in place by April, 2001.
- A minimum 45.5K ton asphalt sales in year one.
- Our gravel sales total reflects 45.5K tons “sold” to our asphalt plant.

| Sales Forecast | |||
| 2001 | 2002 | 2003 | |
| Unit Sales | |||
| Asphalt | 45,500 | 61,000 | 77,000 |
| Crusher Fines – for Asphalt | 18,200 | 24,400 | 30,800 |
| 3/4 in. ABC – for Asphalt | 18,200 | 24,400 | 30,800 |
| 1/2 in. Screened Rock – for Asphalt | 9,100 | 12,200 | 15,400 |
| 3 in. ABC | 23,800 | 25,000 | 26,500 |
| 3/4 in. ABC | 31,200 | 33,000 | 35,000 |
| Other Screened Rock | 10,000 | 11,000 | 12,500 |
| Sand | 10,500 | 12,500 | 15,000 |
| Cobble | 6,100 | 6,500 | 7,000 |
| Boulders | 2,100 | 2,300 | 2,500 |
| Topsoil | 6,500 | 7,000 | 7,500 |
| Other Dirt Products | 10,000 | 11,000 | 12,000 |
| Total Unit Sales | 191,200 | 230,300 | 272,000 |
| Unit Prices | 2001 | 2002 | 2003 |
| Asphalt | $36.00 | $38.00 | $40.00 |
| Crusher Fines – for Asphalt | $10.50 | $11.25 | $12.00 |
| 3/4 in. ABC – for Asphalt | $5.50 | $5.75 | $6.00 |
| 1/2 in. Screened Rock – for Asphalt | $8.00 | $8.40 | $8.75 |
| 3 in. ABC | $4.50 | $4.65 | $4.90 |
| 3/4 in. ABC | $5.50 | $5.75 | $5.90 |
| Other Screened Rock | $9.00 | $9.50 | $10.00 |
| Sand | $10.00 | $11.00 | $12.00 |
| Cobble | $13.00 | $14.00 | $15.00 |
| Boulders | $9.00 | $9.50 | $10.00 |
| Topsoil | $15.00 | $15.50 | $16.00 |
| Other Dirt Products | $2.50 | $2.65 | $2.80 |
| Sales | |||
| Asphalt | $1,638,000 | $2,318,000 | $3,080,000 |
| Crusher Fines – for Asphalt | $191,100 | $274,500 | $369,600 |
| 3/4 in. ABC – for Asphalt | $100,100 | $140,300 | $184,800 |
| 1/2 in. Screened Rock – for Asphalt | $72,800 | $102,480 | $134,750 |
| 3 in. ABC | $107,100 | $116,250 | $129,850 |
| 3/4 in. ABC | $171,600 | $189,750 | $206,500 |
| Other Screened Rock | $90,000 | $104,500 | $125,000 |
| Sand | $105,000 | $137,500 | $180,000 |
| Cobble | $79,300 | $91,000 | $105,000 |
| Boulders | $18,900 | $21,850 | $25,000 |
| Topsoil | $97,500 | $108,500 | $120,000 |
| Other Dirt Products | $25,000 | $29,150 | $33,600 |
| Total Sales | $2,696,400 | $3,633,780 | $4,694,100 |
| Direct Unit Costs | 2001 | 2002 | 2003 |
| Asphalt | $0.00 | $0.00 | $0.00 |
| Crusher Fines – for Asphalt | $5.50 | $5.50 | $5.50 |
| 3/4 in. ABC – for Asphalt | $10.50 | $10.50 | $10.50 |
| 1/2 in. Screened Rock – for Asphalt | $8.00 | $8.00 | $8.00 |
| 3 in. ABC | $0.00 | $0.00 | $0.00 |
| 3/4 in. ABC | $0.00 | $0.00 | $0.00 |
| Other Screened Rock | $0.00 | $0.00 | $0.00 |
| Sand | $0.00 | $0.00 | $0.00 |
| Cobble | $0.00 | $0.00 | $0.00 |
| Boulders | $0.00 | $0.00 | $0.00 |
| Topsoil | $0.00 | $0.00 | $0.00 |
| Other Dirt Products | $0.00 | $0.00 | $0.00 |
| Direct Cost of Sales | |||
| Asphalt | $0 | $0 | $0 |
| Crusher Fines – for Asphalt | $100,100 | $134,200 | $169,400 |
| 3/4 in. ABC – for Asphalt | $191,100 | $256,200 | $323,400 |
| 1/2 in. Screened Rock – for Asphalt | $72,800 | $97,600 | $123,200 |
| 3 in. ABC | $0 | $0 | $0 |
| 3/4 in. ABC | $0 | $0 | $0 |
| Other Screened Rock | $0 | $0 | $0 |
| Sand | $0 | $0 | $0 |
| Cobble | $0 | $0 | $0 |
| Boulders | $0 | $0 | $0 |
| Topsoil | $0 | $0 | $0 |
| Other Dirt Products | $0 | $0 | $0 |
| Subtotal Direct Cost of Sales | $364,000 | $488,000 | $616,000 |
5.6 Milestones
The accompanying table lists important program milestones, with dates and managers in charge, and budgets for each. The milestone schedule indicates our emphasis on planning for implementation.
| Milestones | |||||
| Milestone | Start Date | End Date | Budget | Manager | Department |
| Asphalt Plant | 1/1/2001 | 4/1/2001 | $500 | McCarty | Admin. |
| State Gravel Awards | 1/1/2001 | 5/1/2001 | $0 | Mazur | Admin. |
| County Asphalt Awards | 1/1/2001 | 6/1/2001 | $0 | Hughes | S & M |
| Add Five Major Contractors to Customers | 1/1/2001 | 7/1/2001 | $500 | McCarty | Admin. |
| Reputation and Name Recognition | 1/1/2001 | 12/31/2001 | $1,000 | Mazur | Admin. |
| Totals | $2,000 | ||||
Management Summary
Our management philosophy is based on responsibility and mutual respect. At present, including our trucking and excavating personnel, we number 11. We expect to grow to 17 with the addition of the asphalt plant, and to 20 by next year.
6.1 Organizational Structure
The team includes 11 employees, under our president. Our main management divisions are sales and marketing, production, delivery, and administration. Service is handled by all divisions, with direction from administration.
6.2 Management Team
Justin McCarty, Bayfield, Colorado – President, owner of an excavating, landscaping, trucking and road grading business, Mr. McCarty has extensive experience in all phases of gravel and rock hauling, production and industry practices. Mr. McCarty oversees operations of the corporation, and additionally, is a major consumer of plant products. He also will be a consumer of asphalt products.
Chad Hughes, Durango, Colorado – Vice-president, sales and marketing, educated in natural resources management, and with extensive customer-service experience, Mr. Hughes focuses on developing public accounts.
Gary Small, Mancos, Colorado – Production, Mr. Small has many years of crusher and asphalt-related experience.
Baylin Berg, Durango Colorado – Delivery, Mr. Berg has been instrumental in developing a revolutionary delivery plan to save money for our customers, as well as increase revenues for our trucking division.
Bill Mazur, Durango, Colorado – Administration, Bill is responsible for the day-to-day company operation, as well as coordinating all the departments.
6.3 Personnel Plan
The following table shows the Personnel Plan for Durango Gravel.
| Personnel Plan | |||
| 2001 | 2002 | 2003 | |
| Production Personnel | |||
| Production Manager | $26,300 | $27,500 | $28,800 |
| Crusher 1 | $24,000 | $25,000 | $26,000 |
| Crusher 2 | $21,600 | $22,000 | $22,500 |
| Crusher 3 | $21,600 | $22,000 | $22,500 |
| Asphalt 1 | $12,600 | $17,000 | $18,000 |
| Asphalt 2 | $12,600 | $17,000 | $18,000 |
| Asphalt 3 | $9,000 | $17,000 | $18,000 |
| Asphalt Loader | $12,600 | $22,700 | $24,000 |
| Loader | $21,600 | $22,700 | $24,000 |
| Subtotal | $161,900 | $192,900 | $201,800 |
| Sales and Marketing Personnel | |||
| Sales/Marketing 1 | $21,000 | $23,000 | $25,000 |
| Other | $0 | $0 | $0 |
| Subtotal | $21,000 | $23,000 | $25,000 |
| General and Administrative Personnel | |||
| Administrator | $28,000 | $32,000 | $37,000 |
| Other | $0 | $0 | $0 |
| Subtotal | $28,000 | $32,000 | $37,000 |
| Other Personnel | |||
| Name or title | $0 | $0 | $0 |
| Other | $0 | $0 | $0 |
| Subtotal | $0 | $0 | $0 |
| Total People | 9 | 12 | 15 |
| Total Payroll | $210,900 | $247,900 | $263,800 |
Financial Plan
The most important element in the financial plan is the critical need for improving several of the key factors that impact cash flow:
- We plan to finance our growth through a combination of long-term debt and cash flow. Purchase of the new asphalt plant and related equipment will require debt financing.
- Additional technology and equipment will be financed with cash flow.
- Inventory turnover is not a critical element to ensure profitability.
7.1 Important Assumptions
The financial plan depends on important assumptions, most of which are shown in the following table. The key underlying assumptions are:
- We assume a slow-growth economy, without major recession.
- We assume, of course, that there are no unforeseen changes in technology to make products immediately obsolete.
- We assume access to equity capital and financing sufficient to maintain our financial plan as shown in the tables.
| General Assumptions | |||
| 2001 | 2002 | 2003 | |
| Plan Month | 1 | 2 | 3 |
| Current Interest Rate | 13.00% | 13.00% | 13.00% |
| Long-term Interest Rate | 10.00% | 10.00% | 10.00% |
| Tax Rate | 25.00% | 25.00% | 25.00% |
| Other | 0 | 0 | 0 |
7.2 Key Financial Indicators
The most important factor to Durango Gravel, Inc.’s anticipated growth is the procurement of necessary financing for our asphalt plant. The following chart shows projected changes in key financial indicators:
- Sales
- Gross Margin
- Operating Expenses
- Collection Days
- Inventory Turnover

7.3 Break-even Analysis
The following table and chart describe our estimated monthly break-even point. Based on our estimated sales and expenses, our monthly break-even point is shown below.

| Break-even Analysis | |
| Monthly Units Break-even | 3,170 |
| Monthly Revenue Break-even | $44,704 |
| Assumptions: | |
| Average Per-Unit Revenue | $14.10 |
| Average Per-Unit Variable Cost | $1.90 |
| Estimated Monthly Fixed Cost | $38,670 |
7.4 Projected Profit and Loss
We expect to close year 2001 with excellent sales and very respectable profits.


| Pro Forma Profit and Loss | |||
| 2001 | 2002 | 2003 | |
| Sales | $2,696,400 | $3,633,780 | $4,694,100 |
| Direct Cost of Sales | $364,000 | $488,000 | $616,000 |
| Production Payroll | $161,900 | $192,900 | $201,800 |
| Asphalt Plant Maintenance | $226,590 | $303,780 | $383,460 |
| Asphalt By-Product Additives | $273,000 | $36,600 | $46,200 |
| Other | $0 | $0 | $0 |
| Total Cost of Sales | $1,025,490 | $1,021,280 | $1,247,460 |
| Gross Margin | $1,670,910 | $2,612,500 | $3,446,640 |
| Gross Margin % | 61.97% | 71.89% | 73.42% |
| Operating Expenses | |||
| Sales and Marketing Expenses | |||
| Sales and Marketing Payroll | $21,000 | $23,000 | $25,000 |
| Advertising/Promotion | $6,000 | $6,600 | $7,200 |
| Travel | $1,200 | $1,500 | $1,800 |
| Miscellaneous | $2,400 | $3,000 | $3,600 |
| Total Sales and Marketing Expenses | $30,600 | $34,100 | $37,600 |
| Sales and Marketing % | 1.13% | 0.94% | 0.80% |
| General and Administrative Expenses | |||
| General and Administrative Payroll | $28,000 | $32,000 | $37,000 |
| Sales and Marketing and Other Expenses | $0 | $0 | $0 |
| Depreciation | $18,000 | $24,000 | $30,000 |
| Leased Equipment | $124,800 | $145,000 | $145,000 |
| Equipment Expense | $18,000 | $21,000 | $25,000 |
| Equipment Fuel | $21,600 | $33,500 | $48,000 |
| Utilities | $9,000 | $12,000 | $15,000 |
| Insurance | $21,600 | $24,000 | $30,000 |
| Office Expense | $4,800 | $6,000 | $6,500 |
| Miscellaneous | $36,000 | $42,000 | $48,000 |
| Pit Lease | $120,000 | $150,000 | $180,000 |
| Payroll Taxes | $31,635 | $37,185 | $39,570 |
| Other General and Administrative Expenses | $0 | $0 | $0 |
| Total General and Administrative Expenses | $433,435 | $526,685 | $604,070 |
| General and Administrative % | 16.07% | 14.49% | 12.87% |
| Other Expenses: | |||
| Other Payroll | $0 | $0 | $0 |
| Consultants | $0 | $0 | $0 |
| Contract/Consultants | $0 | $0 | $0 |
| Total Other Expenses | $0 | $0 | $0 |
| Other % | 0.00% | 0.00% | 0.00% |
| Total Operating Expenses | $464,035 | $560,785 | $641,670 |
| Profit Before Interest and Taxes | $1,206,875 | $2,051,715 | $2,804,970 |
| EBITDA | $1,224,875 | $2,075,715 | $2,834,970 |
| Interest Expense | $68,669 | $61,994 | $58,394 |
| Taxes Incurred | $284,552 | $497,430 | $686,644 |
| Net Profit | $853,655 | $1,492,291 | $2,059,932 |
| Net Profit/Sales | 31.66% | 41.07% | 43.88% |
7.5 Projected Cash Flow
The cash flow depends on assumptions for inventory turnover, payment days, and accounts receivable management. Our projected 60-day collection days is critical, and it is also reasonable. We need $110,000 in new financing (current borrowing and additional investment) in March to get through a cash flow dip as we build up for mid-year sales.

| Pro Forma Cash Flow | |||
| 2001 | 2002 | 2003 | |
| Cash Received | |||
| Cash from Operations | |||
| Cash Sales | $134,820 | $181,689 | $234,705 |
| Cash from Receivables | $2,589,881 | $3,432,952 | $4,437,746 |
| Subtotal Cash from Operations | $2,724,701 | $3,614,641 | $4,672,451 |
| Additional Cash Received | |||
| Sales Tax, VAT, HST/GST Received | $0 | $0 | $0 |
| New Current Borrowing | $60,000 | $0 | $0 |
| New Other Liabilities (interest-free) | $0 | $0 | $0 |
| New Long-term Liabilities | $0 | $0 | $0 |
| Sales of Other Current Assets | $0 | $0 | $0 |
| Sales of Long-term Assets | $0 | $0 | $0 |
| New Investment Received | $50,000 | $0 | $0 |
| Subtotal Cash Received | $2,834,701 | $3,614,641 | $4,672,451 |
| Expenditures | 2001 | 2002 | 2003 |
| Expenditures from Operations | |||
| Cash Spending | $210,900 | $247,900 | $263,800 |
| Bill Payments | $1,238,771 | $1,545,801 | $2,301,964 |
| Subtotal Spent on Operations | $1,449,671 | $1,793,701 | $2,565,764 |
| Additional Cash Spent | |||
| Sales Tax, VAT, HST/GST Paid Out | $0 | $0 | $0 |
| Principal Repayment of Current Borrowing | $60,000 | $0 | $0 |
| Other Liabilities Principal Repayment | $0 | $0 | $0 |
| Long-term Liabilities Principal Repayment | $36,000 | $36,000 | $36,000 |
| Purchase Other Current Assets | $0 | $0 | $0 |
| Purchase Long-term Assets | $0 | $0 | $0 |
| Dividends | $0 | $0 | $0 |
| Subtotal Cash Spent | $1,545,671 | $1,829,701 | $2,601,764 |
| Net Cash Flow | $1,289,031 | $1,784,941 | $2,070,688 |
| Cash Balance | $1,290,410 | $3,075,351 | $5,146,039 |
7.6 Projected Balance Sheet
The Projected Balance Sheet is quite positive. We do not project any real trouble meeting our debt obligations–as long as we can achieve our specific objectives.
| Pro Forma Balance Sheet | |||
| 2001 | 2002 | 2003 | |
| Assets | |||
| Current Assets | |||
| Cash | $1,290,410 | $3,075,351 | $5,146,039 |
| Accounts Receivable | $55,052 | $74,191 | $95,840 |
| Inventory | $293,640 | $75,636 | $95,475 |
| Other Current Assets | $0 | $0 | $0 |
| Total Current Assets | $1,639,102 | $3,225,178 | $5,337,353 |
| Long-term Assets | |||
| Long-term Assets | $1,056,350 | $1,056,350 | $1,056,350 |
| Accumulated Depreciation | $18,000 | $42,000 | $72,000 |
| Total Long-term Assets | $1,038,350 | $1,014,350 | $984,350 |
| Total Assets | $2,677,452 | $4,239,528 | $6,321,703 |
| Liabilities and Capital | 2001 | 2002 | 2003 |
| Current Liabilities | |||
| Accounts Payable | $29,963 | $135,747 | $193,990 |
| Current Borrowing | $0 | $0 | $0 |
| Other Current Liabilities | $10,835 | $10,835 | $10,835 |
| Subtotal Current Liabilities | $40,798 | $146,582 | $204,825 |
| Long-term Liabilities | $637,936 | $601,936 | $565,936 |
| Total Liabilities | $678,734 | $748,518 | $770,761 |
| Paid-in Capital | $1,134,896 | $1,134,896 | $1,134,896 |
| Retained Earnings | $10,168 | $863,823 | $2,356,114 |
| Earnings | $853,655 | $1,492,291 | $2,059,932 |
| Total Capital | $1,998,719 | $3,491,010 | $5,550,942 |
| Total Liabilities and Capital | $2,677,452 | $4,239,528 | $6,321,703 |
| Net Worth | $1,998,719 | $3,491,010 | $5,550,942 |
7.7 Business Ratios
The table follows with our main business ratios. We do intend to improve gross margin and collection days. Industry profile ratios based on the Standard Industrial Classification (SIC) code 1442, Construction Sand and Gravel, are shown for comparison.
| Ratio Analysis | ||||
| 2001 | 2002 | 2003 | Industry Profile | |
| Sales Growth | 978.28% | 34.76% | 29.18% | 11.10% |
| Percent of Total Assets | ||||
| Accounts Receivable | 2.06% | 1.75% | 1.52% | 14.30% |
| Inventory | 10.97% | 1.78% | 1.51% | 6.70% |
| Other Current Assets | 0.00% | 0.00% | 0.00% | 32.60% |
| Total Current Assets | 61.22% | 76.07% | 84.43% | 53.60% |
| Long-term Assets | 38.78% | 23.93% | 15.57% | 46.40% |
| Total Assets | 100.00% | 100.00% | 100.00% | 100.00% |
| Current Liabilities | 1.52% | 3.46% | 3.24% | 31.90% |
| Long-term Liabilities | 23.83% | 14.20% | 8.95% | 26.20% |
| Total Liabilities | 25.35% | 17.66% | 12.19% | 58.10% |
| Net Worth | 74.65% | 82.34% | 87.81% | 41.90% |
| Percent of Sales | ||||
| Sales | 100.00% | 100.00% | 100.00% | 100.00% |
| Gross Margin | 61.97% | 71.89% | 73.42% | 39.10% |
| Selling, General & Administrative Expenses | 30.36% | 30.94% | 29.69% | 19.60% |
| Advertising Expenses | 0.22% | 0.18% | 0.15% | 0.10% |
| Profit Before Interest and Taxes | 44.76% | 56.46% | 59.76% | 3.70% |
| Main Ratios | ||||
| Current | 40.18 | 22.00 | 26.06 | 1.68 |
| Quick | 32.98 | 21.49 | 25.59 | 1.22 |
| Total Debt to Total Assets | 25.35% | 17.66% | 12.19% | 58.10% |
| Pre-tax Return on Net Worth | 56.95% | 57.00% | 49.48% | 3.70% |
| Pre-tax Return on Assets | 42.51% | 46.93% | 43.45% | 8.80% |
| Additional Ratios | 2001 | 2002 | 2003 | |
| Net Profit Margin | 31.66% | 41.07% | 43.88% | n.a |
| Return on Equity | 42.71% | 42.75% | 37.11% | n.a |
| Activity Ratios | ||||
| Accounts Receivable Turnover | 46.53 | 46.53 | 46.53 | n.a |
| Collection Days | 60 | 7 | 7 | n.a |
| Inventory Turnover | 0.77 | 2.64 | 7.20 | n.a |
| Accounts Payable Turnover | 41.71 | 12.17 | 12.17 | n.a |
| Payment Days | 28 | 18 | 25 | n.a |
| Total Asset Turnover | 1.01 | 0.86 | 0.74 | n.a |
| Debt Ratios | ||||
| Debt to Net Worth | 0.34 | 0.21 | 0.14 | n.a |
| Current Liab. to Liab. | 0.06 | 0.20 | 0.27 | n.a |
| Liquidity Ratios | ||||
| Net Working Capital | $1,598,305 | $3,078,596 | $5,132,528 | n.a |
| Interest Coverage | 17.58 | 33.10 | 48.04 | n.a |
| Additional Ratios | ||||
| Assets to Sales | 0.99 | 1.17 | 1.35 | n.a |
| Current Debt/Total Assets | 2% | 3% | 3% | n.a |
| Acid Test | 31.63 | 20.98 | 25.12 | n.a |
| Sales/Net Worth | 1.35 | 1.04 | 0.85 | n.a |
| Dividend Payout | 0.00 | 0.00 | 0.00 | n.a |
Appendix
| Sales Forecast | |||||||||||||
| Jan | Feb | Mar | Apr | May | Jun | Jul | Aug | Sep | Oct | Nov | Dec | ||
| Unit Sales | |||||||||||||
| Asphalt | 0% | 0 | 0 | 0 | 4,000 | 6,000 | 9,000 | 9,000 | 9,000 | 4,500 | 4,000 | 0 | 0 |
| Crusher Fines – for Asphalt | 0% | 0 | 0 | 0 | 1,600 | 2,400 | 3,600 | 3,600 | 3,600 | 1,800 | 1,600 | 0 | 0 |
| 3/4 in. ABC – for Asphalt | 0% | 0 | 0 | 0 | 1,600 | 2,400 | 3,600 | 3,600 | 3,600 | 1,800 | 1,600 | 0 | 0 |
| 1/2 in. Screened Rock – for Asphalt | 0% | 0 | 0 | 0 | 800 | 1,200 | 1,800 | 1,800 | 1,800 | 900 | 800 | 0 | 0 |
| 3 in. ABC | 0% | 1,000 | 1,300 | 1,500 | 2,000 | 2,000 | 2,500 | 3,500 | 3,000 | 2,500 | 2,000 | 1,500 | 1,000 |
| 3/4 in. ABC | 0% | 1,200 | 1,600 | 2,000 | 2,600 | 2,800 | 3,500 | 4,500 | 3,800 | 3,000 | 2,700 | 2,000 | 1,500 |
| Other Screened Rock | 0% | 300 | 500 | 700 | 800 | 800 | 1,000 | 1,000 | 1,500 | 1,300 | 1,100 | 500 | 500 |
| Sand | 0% | 100 | 300 | 500 | 1,000 | 1,000 | 1,500 | 1,500 | 2,000 | 1,500 | 500 | 300 | 300 |
| Cobble | 0% | 100 | 100 | 500 | 1,000 | 1,500 | 1,000 | 500 | 500 | 300 | 200 | 200 | 200 |
| Boulders | 0% | 50 | 100 | 150 | 200 | 250 | 250 | 250 | 250 | 250 | 200 | 100 | 50 |
| Topsoil | 0% | 0 | 0 | 200 | 700 | 1,000 | 1,500 | 1,500 | 500 | 500 | 300 | 200 | 100 |
| Other Dirt Products | 0% | 300 | 500 | 700 | 800 | 800 | 1,000 | 1,000 | 1,500 | 1,300 | 1,100 | 500 | 500 |
| Total Unit Sales | 3,050 | 4,400 | 6,250 | 17,100 | 22,150 | 30,250 | 31,750 | 31,050 | 19,650 | 16,100 | 5,300 | 4,150 | |
| Unit Prices | Jan | Feb | Mar | Apr | May | Jun | Jul | Aug | Sep | Oct | Nov | Dec | |
| Asphalt | $36.00 | $36.00 | $36.00 | $36.00 | $36.00 | $36.00 | $36.00 | $36.00 | $36.00 | $36.00 | $36.00 | $36.00 | |
| Crusher Fines – for Asphalt | $10.50 | $10.50 | $10.50 | $10.50 | $10.50 | $10.50 | $10.50 | $10.50 | $10.50 | $10.50 | $10.50 | $10.50 | |
| 3/4 in. ABC – for Asphalt | $5.50 | $5.50 | $5.50 | $5.50 | $5.50 | $5.50 | $5.50 | $5.50 | $5.50 | $5.50 | $5.50 | $5.50 | |
| 1/2 in. Screened Rock – for Asphalt | $8.00 | $8.00 | $8.00 | $8.00 | $8.00 | $8.00 | $8.00 | $8.00 | $8.00 | $8.00 | $8.00 | $8.00 | |
| 3 in. ABC | $4.50 | $4.50 | $4.50 | $4.50 | $4.50 | $4.50 | $4.50 | $4.50 | $4.50 | $4.50 | $4.50 | $4.50 | |
| 3/4 in. ABC | $5.50 | $5.50 | $5.50 | $5.50 | $5.50 | $5.50 | $5.50 | $5.50 | $5.50 | $5.50 | $5.50 | $5.50 | |
| Other Screened Rock | $9.00 | $9.00 | $9.00 | $9.00 | $9.00 | $9.00 | $9.00 | $9.00 | $9.00 | $9.00 | $9.00 | $9.00 | |
| Sand | $10.00 | $10.00 | $10.00 | $10.00 | $10.00 | $10.00 | $10.00 | $10.00 | $10.00 | $10.00 | $10.00 | $10.00 | |
| Cobble | $13.00 | $13.00 | $13.00 | $13.00 | $13.00 | $13.00 | $13.00 | $13.00 | $13.00 | $13.00 | $13.00 | $13.00 | |
| Boulders | $9.00 | $9.00 | $9.00 | $9.00 | $9.00 | $9.00 | $9.00 | $9.00 | $9.00 | $9.00 | $9.00 | $9.00 | |
| Topsoil | $15.00 | $15.00 | $15.00 | $15.00 | $15.00 | $15.00 | $15.00 | $15.00 | $15.00 | $15.00 | $15.00 | $15.00 | |
| Other Dirt Products | $2.50 | $2.50 | $2.50 | $2.50 | $2.50 | $2.50 | $2.50 | $2.50 | $2.50 | $2.50 | $2.50 | $2.50 | |
| Sales | |||||||||||||
| Asphalt | $0 | $0 | $0 | $144,000 | $216,000 | $324,000 | $324,000 | $324,000 | $162,000 | $144,000 | $0 | $0 | |
| Crusher Fines – for Asphalt | $0 | $0 | $0 | $16,800 | $25,200 | $37,800 | $37,800 | $37,800 | $18,900 | $16,800 | $0 | $0 | |
| 3/4 in. ABC – for Asphalt | $0 | $0 | $0 | $8,800 | $13,200 | $19,800 | $19,800 | $19,800 | $9,900 | $8,800 | $0 | $0 | |
| 1/2 in. Screened Rock – for Asphalt | $0 | $0 | $0 | $6,400 | $9,600 | $14,400 | $14,400 | $14,400 | $7,200 | $6,400 | $0 | $0 | |
| 3 in. ABC | $4,500 | $5,850 | $6,750 | $9,000 | $9,000 | $11,250 | $15,750 | $13,500 | $11,250 | $9,000 | $6,750 | $4,500 | |
| 3/4 in. ABC | $6,600 | $8,800 | $11,000 | $14,300 | $15,400 | $19,250 | $24,750 | $20,900 | $16,500 | $14,850 | $11,000 | $8,250 | |
| Other Screened Rock | $2,700 | $4,500 | $6,300 | $7,200 | $7,200 | $9,000 | $9,000 | $13,500 | $11,700 | $9,900 | $4,500 | $4,500 | |
| Sand | $1,000 | $3,000 | $5,000 | $10,000 | $10,000 | $15,000 | $15,000 | $20,000 | $15,000 | $5,000 | $3,000 | $3,000 | |
| Cobble | $1,300 | $1,300 | $6,500 | $13,000 | $19,500 | $13,000 | $6,500 | $6,500 | $3,900 | $2,600 | $2,600 | $2,600 | |
| Boulders | $450 | $900 | $1,350 | $1,800 | $2,250 | $2,250 | $2,250 | $2,250 | $2,250 | $1,800 | $900 | $450 | |
| Topsoil | $0 | $0 | $3,000 | $10,500 | $15,000 | $22,500 | $22,500 | $7,500 | $7,500 | $4,500 | $3,000 | $1,500 | |
| Other Dirt Products | $750 | $1,250 | $1,750 | $2,000 | $2,000 | $2,500 | $2,500 | $3,750 | $3,250 | $2,750 | $1,250 | $1,250 | |
| Total Sales | $17,300 | $25,600 | $41,650 | $243,800 | $344,350 | $490,750 | $494,250 | $483,900 | $269,350 | $226,400 | $33,000 | $26,050 | |
| Direct Unit Costs | Jan | Feb | Mar | Apr | May | Jun | Jul | Aug | Sep | Oct | Nov | Dec | |
| Asphalt | 0.00% | $0.00 | $0.00 | $0.00 | $0.00 | $0.00 | $0.00 | $0.00 | $0.00 | $0.00 | $0.00 | $0.00 | $0.00 |
| Crusher Fines – for Asphalt | 0.00% | $5.50 | $5.50 | $5.50 | $5.50 | $5.50 | $5.50 | $5.50 | $5.50 | $5.50 | $5.50 | $5.50 | $5.50 |
| 3/4 in. ABC – for Asphalt | 0.00% | $10.50 | $10.50 | $10.50 | $10.50 | $10.50 | $10.50 | $10.50 | $10.50 | $10.50 | $10.50 | $10.50 | $10.50 |
| 1/2 in. Screened Rock – for Asphalt | 0.00% | $8.00 | $8.00 | $8.00 | $8.00 | $8.00 | $8.00 | $8.00 | $8.00 | $8.00 | $8.00 | $8.00 | $8.00 |
| 3 in. ABC | 0.00% | $0.00 | $0.00 | $0.00 | $0.00 | $0.00 | $0.00 | $0.00 | $0.00 | $0.00 | $0.00 | $0.00 | $0.00 |
| 3/4 in. ABC | 0.00% | $0.00 | $0.00 | $0.00 | $0.00 | $0.00 | $0.00 | $0.00 | $0.00 | $0.00 | $0.00 | $0.00 | $0.00 |
| Other Screened Rock | 0.00% | $0.00 | $0.00 | $0.00 | $0.00 | $0.00 | $0.00 | $0.00 | $0.00 | $0.00 | $0.00 | $0.00 | $0.00 |
| Sand | 0.00% | $0.00 | $0.00 | $0.00 | $0.00 | $0.00 | $0.00 | $0.00 | $0.00 | $0.00 | $0.00 | $0.00 | $0.00 |
| Cobble | 0.00% | $0.00 | $0.00 | $0.00 | $0.00 | $0.00 | $0.00 | $0.00 | $0.00 | $0.00 | $0.00 | $0.00 | $0.00 |
| Boulders | 0.00% | $0.00 | $0.00 | $0.00 | $0.00 | $0.00 | $0.00 | $0.00 | $0.00 | $0.00 | $0.00 | $0.00 | $0.00 |
| Topsoil | 0.00% | $0.00 | $0.00 | $0.00 | $0.00 | $0.00 | $0.00 | $0.00 | $0.00 | $0.00 | $0.00 | $0.00 | $0.00 |
| Other Dirt Products | 0.00% | $0.00 | $0.00 | $0.00 | $0.00 | $0.00 | $0.00 | $0.00 | $0.00 | $0.00 | $0.00 | $0.00 | $0.00 |
| Direct Cost of Sales | |||||||||||||
| Asphalt | $0 | $0 | $0 | $0 | $0 | $0 | $0 | $0 | $0 | $0 | $0 | $0 | |
| Crusher Fines – for Asphalt | $0 | $0 | $0 | $8,800 | $13,200 | $19,800 | $19,800 | $19,800 | $9,900 | $8,800 | $0 | $0 | |
| 3/4 in. ABC – for Asphalt | $0 | $0 | $0 | $16,800 | $25,200 | $37,800 | $37,800 | $37,800 | $18,900 | $16,800 | $0 | $0 | |
| 1/2 in. Screened Rock – for Asphalt | $0 | $0 | $0 | $6,400 | $9,600 | $14,400 | $14,400 | $14,400 | $7,200 | $6,400 | $0 | $0 | |
| 3 in. ABC | $0 | $0 | $0 | $0 | $0 | $0 | $0 | $0 | $0 | $0 | $0 | $0 | |
| 3/4 in. ABC | $0 | $0 | $0 | $0 | $0 | $0 | $0 | $0 | $0 | $0 | $0 | $0 | |
| Other Screened Rock | $0 | $0 | $0 | $0 | $0 | $0 | $0 | $0 | $0 | $0 | $0 | $0 | |
| Sand | $0 | $0 | $0 | $0 | $0 | $0 | $0 | $0 | $0 | $0 | $0 | $0 | |
| Cobble | $0 | $0 | $0 | $0 | $0 | $0 | $0 | $0 | $0 | $0 | $0 | $0 | |
| Boulders | $0 | $0 | $0 | $0 | $0 | $0 | $0 | $0 | $0 | $0 | $0 | $0 | |
| Topsoil | $0 | $0 | $0 | $0 | $0 | $0 | $0 | $0 | $0 | $0 | $0 | $0 | |
| Other Dirt Products | $0 | $0 | $0 | $0 | $0 | $0 | $0 | $0 | $0 | $0 | $0 | $0 | |
| Subtotal Direct Cost of Sales | $0 | $0 | $0 | $32,000 | $48,000 | $72,000 | $72,000 | $72,000 | $36,000 | $32,000 | $0 | $0 | |
| Personnel Plan | |||||||||||||
| Jan | Feb | Mar | Apr | May | Jun | Jul | Aug | Sep | Oct | Nov | Dec | ||
| Production Personnel | |||||||||||||
| Production Manager | $1,800 | $2,000 | $2,000 | $2,100 | $2,300 | $2,300 | $2,300 | $2,300 | $2,300 | $2,300 | $2,300 | $2,300 | |
| Crusher 1 | $2,000 | $2,000 | $2,000 | $2,000 | $2,000 | $2,000 | $2,000 | $2,000 | $2,000 | $2,000 | $2,000 | $2,000 | |
| Crusher 2 | $1,800 | $1,800 | $1,800 | $1,800 | $1,800 | $1,800 | $1,800 | $1,800 | $1,800 | $1,800 | $1,800 | $1,800 | |
| Crusher 3 | $1,800 | $1,800 | $1,800 | $1,800 | $1,800 | $1,800 | $1,800 | $1,800 | $1,800 | $1,800 | $1,800 | $1,800 | |
| Asphalt 1 | $0 | $0 | $0 | $1,800 | $1,800 | $1,800 | $1,800 | $1,800 | $1,800 | $1,800 | $0 | $0 | |
| Asphalt 2 | $0 | $0 | $0 | $1,800 | $1,800 | $1,800 | $1,800 | $1,800 | $1,800 | $1,800 | $0 | $0 | |
| Asphalt 3 | $0 | $0 | $0 | $0 | $1,800 | $1,800 | $1,800 | $1,800 | $1,800 | $0 | $0 | $0 | |
| Asphalt Loader | $0 | $0 | $0 | $1,800 | $1,800 | $1,800 | $1,800 | $1,800 | $1,800 | $1,800 | $0 | $0 | |
| Loader | $1,800 | $1,800 | $1,800 | $1,800 | $1,800 | $1,800 | $1,800 | $1,800 | $1,800 | $1,800 | $1,800 | $1,800 | |
| Subtotal | $9,200 | $9,400 | $9,400 | $14,900 | $16,900 | $16,900 | $16,900 | $16,900 | $16,900 | $15,100 | $9,700 | $9,700 | |
| Sales and Marketing Personnel | |||||||||||||
| Sales/Marketing 1 | $0 | $0 | $2,100 | $2,100 | $2,100 | $2,100 | $2,100 | $2,100 | $2,100 | $2,100 | $2,100 | $2,100 | |
| Other | $0 | $0 | $0 | $0 | $0 | $0 | $0 | $0 | $0 | $0 | $0 | $0 | |
| Subtotal | $0 | $0 | $2,100 | $2,100 | $2,100 | $2,100 | $2,100 | $2,100 | $2,100 | $2,100 | $2,100 | $2,100 | |
| General and Administrative Personnel | |||||||||||||
| Administrator | $2,000 | $2,000 | $2,500 | $2,000 | $2,000 | $2,500 | $2,500 | $2,500 | $2,500 | $2,500 | $2,500 | $2,500 | |
| Other | $0 | $0 | $0 | $0 | $0 | $0 | $0 | $0 | $0 | $0 | $0 | $0 | |
| Subtotal | $2,000 | $2,000 | $2,500 | $2,000 | $2,000 | $2,500 | $2,500 | $2,500 | $2,500 | $2,500 | $2,500 | $2,500 | |
| Other Personnel | |||||||||||||
| Name or title | $0 | $0 | $0 | $0 | $0 | $0 | $0 | $0 | $0 | $0 | $0 | $0 | |
| Other | $0 | $0 | $0 | $0 | $0 | $0 | $0 | $0 | $0 | $0 | $0 | $0 | |
| Subtotal | $0 | $0 | $0 | $0 | $0 | $0 | $0 | $0 | $0 | $0 | $0 | $0 | |
| Total People | 6 | 6 | 7 | 10 | 11 | 11 | 11 | 11 | 11 | 10 | 9 | 9 | |
| Total Payroll | $11,200 | $11,400 | $14,000 | $19,000 | $21,000 | $21,500 | $21,500 | $21,500 | $21,500 | $19,700 | $14,300 | $14,300 | |
| General Assumptions | ||||||||||||
| Jan | Feb | Mar | Apr | May | Jun | Jul | Aug | Sep | Oct | Nov | Dec | |
| Plan Month | 1 | 2 | 3 | 4 | 5 | 6 | 7 | 8 | 9 | 10 | 11 | 12 |
| Current Interest Rate | 13.00% | 13.00% | 13.00% | 13.00% | 13.00% | 13.00% | 13.00% | 13.00% | 13.00% | 13.00% | 13.00% | 13.00% |
| Long-term Interest Rate | 10.00% | 10.00% | 10.00% | 10.00% | 10.00% | 10.00% | 10.00% | 10.00% | 10.00% | 10.00% | 10.00% | 10.00% |
| Tax Rate | 25.00% | 25.00% | 25.00% | 25.00% | 25.00% | 25.00% | 25.00% | 25.00% | 25.00% | 25.00% | 25.00% | 25.00% |
| Other | 0 | 0 | 0 | 0 | 0 | 0 | 0 | 0 | 0 | 0 | 0 | 0 |
| Pro Forma Profit and Loss | |||||||||||||
| Jan | Feb | Mar | Apr | May | Jun | Jul | Aug | Sep | Oct | Nov | Dec | ||
| Sales | $17,300 | $25,600 | $41,650 | $243,800 | $344,350 | $490,750 | $494,250 | $483,900 | $269,350 | $226,400 | $33,000 | $26,050 | |
| Direct Cost of Sales | $0 | $0 | $0 | $32,000 | $48,000 | $72,000 | $72,000 | $72,000 | $36,000 | $32,000 | $0 | $0 | |
| Production Payroll | $9,200 | $9,400 | $9,400 | $14,900 | $16,900 | $16,900 | $16,900 | $16,900 | $16,900 | $15,100 | $9,700 | $9,700 | |
| Asphalt Plant Maintenance | $0 | $0 | $0 | $19,920 | $29,880 | $44,820 | $44,820 | $44,820 | $22,410 | $19,920 | $0 | $0 | |
| Asphalt By-Product Additives | $0 | $0 | $0 | $24,000 | $36,000 | $54,000 | $54,000 | $54,000 | $27,000 | $24,000 | $0 | $0 | |
| Other | $0 | $0 | $0 | $0 | $0 | $0 | $0 | $0 | $0 | $0 | $0 | $0 | |
| Total Cost of Sales | $9,200 | $9,400 | $9,400 | $90,820 | $130,780 | $187,720 | $187,720 | $187,720 | $102,310 | $91,020 | $9,700 | $9,700 | |
| Gross Margin | $8,100 | $16,200 | $32,250 | $152,980 | $213,570 | $303,030 | $306,530 | $296,180 | $167,040 | $135,380 | $23,300 | $16,350 | |
| Gross Margin % | 46.82% | 63.28% | 77.43% | 62.75% | 62.02% | 61.75% | 62.02% | 61.21% | 62.02% | 59.80% | 70.61% | 62.76% | |
| Operating Expenses | |||||||||||||
| Sales and Marketing Expenses | |||||||||||||
| Sales and Marketing Payroll | $0 | $0 | $2,100 | $2,100 | $2,100 | $2,100 | $2,100 | $2,100 | $2,100 | $2,100 | $2,100 | $2,100 | |
| Advertising/Promotion | $500 | $500 | $500 | $500 | $500 | $500 | $500 | $500 | $500 | $500 | $500 | $500 | |
| Travel | $100 | $100 | $100 | $100 | $100 | $100 | $100 | $100 | $100 | $100 | $100 | $100 | |
| Miscellaneous | $200 | $200 | $200 | $200 | $200 | $200 | $200 | $200 | $200 | $200 | $200 | $200 | |
| Total Sales and Marketing Expenses | $800 | $800 | $2,900 | $2,900 | $2,900 | $2,900 | $2,900 | $2,900 | $2,900 | $2,900 | $2,900 | $2,900 | |
| Sales and Marketing % | 4.62% | 3.13% | 6.96% | 1.19% | 0.84% | 0.59% | 0.59% | 0.60% | 1.08% | 1.28% | 8.79% | 11.13% | |
| General and Administrative Expenses | |||||||||||||
| General and Administrative Payroll | $2,000 | $2,000 | $2,500 | $2,000 | $2,000 | $2,500 | $2,500 | $2,500 | $2,500 | $2,500 | $2,500 | $2,500 | |
| Sales and Marketing and Other Expenses | $0 | $0 | $0 | $0 | $0 | $0 | $0 | $0 | $0 | $0 | $0 | $0 | |
| Depreciation | $1,500 | $1,500 | $1,500 | $1,500 | $1,500 | $1,500 | $1,500 | $1,500 | $1,500 | $1,500 | $1,500 | $1,500 | |
| Leased Equipment | $10,400 | $10,400 | $10,400 | $10,400 | $10,400 | $10,400 | $10,400 | $10,400 | $10,400 | $10,400 | $10,400 | $10,400 | |
| Equipment Expense | $1,500 | $1,500 | $1,500 | $1,500 | $1,500 | $1,500 | $1,500 | $1,500 | $1,500 | $1,500 | $1,500 | $1,500 | |
| Equipment Fuel | $1,800 | $1,800 | $1,800 | $1,800 | $1,800 | $1,800 | $1,800 | $1,800 | $1,800 | $1,800 | $1,800 | $1,800 | |
| Utilities | $750 | $750 | $750 | $750 | $750 | $750 | $750 | $750 | $750 | $750 | $750 | $750 | |
| Insurance | $1,800 | $1,800 | $1,800 | $1,800 | $1,800 | $1,800 | $1,800 | $1,800 | $1,800 | $1,800 | $1,800 | $1,800 | |
| Office Expense | $400 | $400 | $400 | $400 | $400 | $400 | $400 | $400 | $400 | $400 | $400 | $400 | |
| Miscellaneous | $3,000 | $3,000 | $3,000 | $3,000 | $3,000 | $3,000 | $3,000 | $3,000 | $3,000 | $3,000 | $3,000 | $3,000 | |
| Pit Lease | $10,000 | $10,000 | $10,000 | $10,000 | $10,000 | $10,000 | $10,000 | $10,000 | $10,000 | $10,000 | $10,000 | $10,000 | |
| Payroll Taxes | 15% | $1,680 | $1,710 | $2,100 | $2,850 | $3,150 | $3,225 | $3,225 | $3,225 | $3,225 | $2,955 | $2,145 | $2,145 |
| Other General and Administrative Expenses | $0 | $0 | $0 | $0 | $0 | $0 | $0 | $0 | $0 | $0 | $0 | $0 | |
| Total General and Administrative Expenses | $34,830 | $34,860 | $35,750 | $36,000 | $36,300 | $36,875 | $36,875 | $36,875 | $36,875 | $36,605 | $35,795 | $35,795 | |
| General and Administrative % | 201.33% | 136.17% | 85.83% | 14.77% | 10.54% | 7.51% | 7.46% | 7.62% | 13.69% | 16.17% | 108.47% | 137.41% | |
| Other Expenses: | |||||||||||||
| Other Payroll | $0 | $0 | $0 | $0 | $0 | $0 | $0 | $0 | $0 | $0 | $0 | $0 | |
| Consultants | $0 | $0 | $0 | $0 | $0 | $0 | $0 | $0 | $0 | $0 | $0 | $0 | |
| Contract/Consultants | $0 | $0 | $0 | $0 | $0 | $0 | $0 | $0 | $0 | $0 | $0 | $0 | |
| Total Other Expenses | $0 | $0 | $0 | $0 | $0 | $0 | $0 | $0 | $0 | $0 | $0 | $0 | |
| Other % | 0.00% | 0.00% | 0.00% | 0.00% | 0.00% | 0.00% | 0.00% | 0.00% | 0.00% | 0.00% | 0.00% | 0.00% | |
| Total Operating Expenses | $35,630 | $35,660 | $38,650 | $38,900 | $39,200 | $39,775 | $39,775 | $39,775 | $39,775 | $39,505 | $38,695 | $38,695 | |
| Profit Before Interest and Taxes | ($27,530) | ($19,460) | ($6,400) | $114,080 | $174,370 | $263,255 | $266,755 | $256,405 | $127,265 | $95,875 | ($15,395) | ($22,345) | |
| EBITDA | ($26,030) | ($17,960) | ($4,900) | $115,580 | $175,870 | $264,755 | $268,255 | $257,905 | $128,765 | $97,375 | ($13,895) | ($20,845) | |
| Interest Expense | $5,616 | $5,616 | $6,191 | $6,191 | $6,191 | $5,791 | $5,791 | $5,791 | $5,391 | $5,391 | $5,391 | $5,316 | |
| Taxes Incurred | ($8,287) | ($6,269) | ($3,148) | $26,972 | $42,045 | $64,366 | $65,241 | $62,653 | $30,468 | $22,621 | ($5,197) | ($6,915) | |
| Net Profit | ($24,860) | ($18,807) | ($9,443) | $80,917 | $126,134 | $193,098 | $195,723 | $187,960 | $91,405 | $67,863 | ($15,590) | ($20,746) | |
| Net Profit/Sales | -143.70% | -73.47% | -22.67% | 33.19% | 36.63% | 39.35% | 39.60% | 38.84% | 33.94% | 29.97% | -47.24% | -79.64% | |
| Pro Forma Cash Flow | |||||||||||||
| Jan | Feb | Mar | Apr | May | Jun | Jul | Aug | Sep | Oct | Nov | Dec | ||
| Cash Received | |||||||||||||
| Cash from Operations | |||||||||||||
| Cash Sales | $865 | $1,280 | $2,083 | $12,190 | $17,218 | $24,538 | $24,713 | $24,195 | $13,468 | $11,320 | $1,650 | $1,303 | |
| Cash from Receivables | $41,677 | $42,225 | $16,698 | $24,828 | $45,969 | $234,794 | $331,769 | $466,323 | $469,210 | $452,911 | $254,522 | $208,956 | |
| Subtotal Cash from Operations | $42,542 | $43,505 | $18,780 | $37,018 | $63,186 | $259,332 | $356,481 | $490,518 | $482,677 | $464,231 | $256,172 | $210,258 | |
| Additional Cash Received | |||||||||||||
| Sales Tax, VAT, HST/GST Received | 0.00% | $0 | $0 | $0 | $0 | $0 | $0 | $0 | $0 | $0 | $0 | $0 | $0 |
| New Current Borrowing | $0 | $0 | $60,000 | $0 | $0 | $0 | $0 | $0 | $0 | $0 | $0 | $0 | |
| New Other Liabilities (interest-free) | $0 | $0 | $0 | $0 | $0 | $0 | $0 | $0 | $0 | $0 | $0 | $0 | |
| New Long-term Liabilities | $0 | $0 | $0 | $0 | $0 | $0 | $0 | $0 | $0 | $0 | $0 | $0 | |
| Sales of Other Current Assets | $0 | $0 | $0 | $0 | $0 | $0 | $0 | $0 | $0 | $0 | $0 | $0 | |
| Sales of Long-term Assets | $0 | $0 | $0 | $0 | $0 | $0 | $0 | $0 | $0 | $0 | $0 | $0 | |
| New Investment Received | $0 | $0 | $0 | $0 | $50,000 | $0 | $0 | $0 | $0 | $0 | $0 | $0 | |
| Subtotal Cash Received | $42,542 | $43,505 | $78,780 | $37,018 | $113,186 | $259,332 | $356,481 | $490,518 | $482,677 | $464,231 | $256,172 | $210,258 | |
| Expenditures | Jan | Feb | Mar | Apr | May | Jun | Jul | Aug | Sep | Oct | Nov | Dec | |
| Expenditures from Operations | |||||||||||||
| Cash Spending | $11,200 | $11,400 | $14,000 | $19,000 | $21,000 | $21,500 | $21,500 | $21,500 | $21,500 | $19,700 | $14,300 | $14,300 | |
| Bill Payments | $19,870 | $29,528 | $31,643 | $38,086 | $111,628 | $149,547 | $202,681 | $203,441 | $198,206 | $118,491 | $102,919 | $32,730 | |
| Subtotal Spent on Operations | $31,070 | $40,928 | $45,643 | $57,086 | $132,628 | $171,047 | $224,181 | $224,941 | $219,706 | $138,191 | $117,219 | $47,030 | |
| Additional Cash Spent | |||||||||||||
| Sales Tax, VAT, HST/GST Paid Out | $0 | $0 | $0 | $0 | $0 | $0 | $0 | $0 | $0 | $0 | $0 | $0 | |
| Principal Repayment of Current Borrowing | $0 | $0 | $0 | $0 | $0 | $30,000 | $0 | $0 | $30,000 | $0 | $0 | $0 | |
| Other Liabilities Principal Repayment | $0 | $0 | $0 | $0 | $0 | $0 | $0 | $0 | $0 | $0 | $0 | $0 | |
| Long-term Liabilities Principal Repayment | $0 | $0 | $9,000 | $0 | $0 | $9,000 | $0 | $0 | $9,000 | $0 | $0 | $9,000 | |
| Purchase Other Current Assets | $0 | $0 | $0 | $0 | $0 | $0 | $0 | $0 | $0 | $0 | $0 | $0 | |
| Purchase Long-term Assets | $0 | $0 | $0 | $0 | $0 | $0 | $0 | $0 | $0 | $0 | $0 | $0 | |
| Dividends | $0 | $0 | $0 | $0 | $0 | $0 | $0 | $0 | $0 | $0 | $0 | $0 | |
| Subtotal Cash Spent | $31,070 | $40,928 | $54,643 | $57,086 | $132,628 | $210,047 | $224,181 | $224,941 | $258,706 | $138,191 | $117,219 | $56,030 | |
| Net Cash Flow | $11,472 | $2,577 | $24,137 | ($20,068) | ($19,441) | $49,285 | $132,300 | $265,577 | $223,971 | $326,040 | $138,954 | $154,228 | |
| Cash Balance | $12,851 | $15,428 | $39,565 | $19,497 | $56 | $49,340 | $181,640 | $447,217 | $671,188 | $997,228 | $1,136,182 | $1,290,410 | |
| Pro Forma Balance Sheet | |||||||||||||
| Jan | Feb | Mar | Apr | May | Jun | Jul | Aug | Sep | Oct | Nov | Dec | ||
| Assets | Starting Balances | ||||||||||||
| Current Assets | |||||||||||||
| Cash | $1,379 | $12,851 | $15,428 | $39,565 | $19,497 | $56 | $49,340 | $181,640 | $447,217 | $671,188 | $997,228 | $1,136,182 | $1,290,410 |
| Accounts Receivable | $83,354 | $58,112 | $40,207 | $63,077 | $269,859 | $551,022 | $782,441 | $920,210 | $913,591 | $700,264 | $462,433 | $239,261 | $55,052 |
| Inventory | $657,640 | $657,640 | $657,640 | $657,640 | $625,640 | $577,640 | $505,640 | $433,640 | $361,640 | $325,640 | $293,640 | $293,640 | $293,640 |
| Other Current Assets | $0 | $0 | $0 | $0 | $0 | $0 | $0 | $0 | $0 | $0 | $0 | $0 | $0 |
| Total Current Assets | $742,373 | $728,603 | $713,275 | $760,282 | $914,996 | $1,128,718 | $1,337,421 | $1,535,489 | $1,722,449 | $1,697,092 | $1,753,301 | $1,669,082 | $1,639,102 |
| Long-term Assets | |||||||||||||
| Long-term Assets | $1,056,350 | $1,056,350 | $1,056,350 | $1,056,350 | $1,056,350 | $1,056,350 | $1,056,350 | $1,056,350 | $1,056,350 | $1,056,350 | $1,056,350 | $1,056,350 | $1,056,350 |
| Accumulated Depreciation | $0 | $1,500 | $3,000 | $4,500 | $6,000 | $7,500 | $9,000 | $10,500 | $12,000 | $13,500 | $15,000 | $16,500 | $18,000 |
| Total Long-term Assets | $1,056,350 | $1,054,850 | $1,053,350 | $1,051,850 | $1,050,350 | $1,048,850 | $1,047,350 | $1,045,850 | $1,044,350 | $1,042,850 | $1,041,350 | $1,039,850 | $1,038,350 |
| Total Assets | $1,798,723 | $1,783,453 | $1,766,625 | $1,812,132 | $1,965,346 | $2,177,568 | $2,384,771 | $2,581,339 | $2,766,799 | $2,739,942 | $2,794,651 | $2,708,932 | $2,677,452 |
| Liabilities and Capital | Jan | Feb | Mar | Apr | May | Jun | Jul | Aug | Sep | Oct | Nov | Dec | |
| Current Liabilities | |||||||||||||
| Accounts Payable | $18,888 | $28,478 | $30,457 | $34,407 | $106,704 | $142,792 | $195,897 | $196,743 | $194,242 | $114,980 | $101,826 | $31,697 | $29,963 |
| Current Borrowing | $0 | $0 | $0 | $60,000 | $60,000 | $60,000 | $30,000 | $30,000 | $30,000 | $0 | $0 | $0 | $0 |
| Other Current Liabilities | $10,835 | $10,835 | $10,835 | $10,835 | $10,835 | $10,835 | $10,835 | $10,835 | $10,835 | $10,835 | $10,835 | $10,835 | $10,835 |
| Subtotal Current Liabilities | $29,723 | $39,313 | $41,292 | $105,242 | $177,539 | $213,627 | $236,732 | $237,578 | $235,077 | $125,815 | $112,661 | $42,532 | $40,798 |
| Long-term Liabilities | $673,936 | $673,936 | $673,936 | $664,936 | $664,936 | $664,936 | $655,936 | $655,936 | $655,936 | $646,936 | $646,936 | $646,936 | $637,936 |
| Total Liabilities | $703,659 | $713,249 | $715,228 | $770,178 | $842,475 | $878,563 | $892,668 | $893,514 | $891,013 | $772,751 | $759,597 | $689,468 | $678,734 |
| Paid-in Capital | $1,084,896 | $1,084,896 | $1,084,896 | $1,084,896 | $1,084,896 | $1,134,896 | $1,134,896 | $1,134,896 | $1,134,896 | $1,134,896 | $1,134,896 | $1,134,896 | $1,134,896 |
| Retained Earnings | $5,084 | $10,168 | $10,168 | $10,168 | $10,168 | $10,168 | $10,168 | $10,168 | $10,168 | $10,168 | $10,168 | $10,168 | $10,168 |
| Earnings | $5,084 | ($24,860) | ($43,667) | ($53,110) | $27,807 | $153,941 | $347,039 | $542,762 | $730,722 | $822,127 | $889,990 | $874,401 | $853,655 |
| Total Capital | $1,095,064 | $1,070,204 | $1,051,397 | $1,041,954 | $1,122,871 | $1,299,005 | $1,492,103 | $1,687,826 | $1,875,786 | $1,967,191 | $2,035,054 | $2,019,465 | $1,998,719 |
| Total Liabilities and Capital | $1,798,723 | $1,783,453 | $1,766,625 | $1,812,132 | $1,965,346 | $2,177,568 | $2,384,771 | $2,581,339 | $2,766,799 | $2,739,942 | $2,794,651 | $2,708,932 | $2,677,452 |
| Net Worth | $1,095,064 | $1,070,204 | $1,051,397 | $1,041,954 | $1,122,871 | $1,299,005 | $1,492,103 | $1,687,826 | $1,875,786 | $1,967,191 | $2,035,054 | $2,019,465 | $1,998,719 |

