
The Metolius Agency
Executive Summary
The Metolius Agency is a Eugene, Ore. based graphic design and visual communications firm. Metolius will be concentrating on corporate identity of established companies. The targeted customer is a small- to medium-size company that has been established for five to 15 years. The company has done well with the business so far, but they are in need of a new corporate identity to allow them to move to the next level.
Metolius will operate out of a small office in the downtown area. For months one through seven, Kiev Lartiste will be the sole employee. By month seven, Kiev will be hiring an assistant to help with design work as well as administrative details.
Metolius will offer companies a fresh perspective regarding corporate identity and visual communication. Kiev has a unique background where he has business skills and creative skills. Most firms come solely from creative backgrounds. While this is useful for the crafting of logos and other devices of visual communication, it lacks the intuitive business mindset that Kiev brings to the firm. This competitive edge allows Kiev to bring both an aesthetic design focus as well as a practical, quantitative mindset that adds value to the service offerings by creating solutions that have both creative elements combined with rational, business ideas. This is useful since the clients are more business oriented.
Metolius will grow their customer base by providing clients with well-priced projects due to reasonably low overhead, creative, practical designs that add more value than competing graphical art firms, and superior customer attention. The Metolius Agency will reach profitability by month nine and generate $27,347 in profits by year three.

1.1 Objectives
The objectives for the first three years of operation include:
- To develop a start-up graphics agency that will grow to profitability within year two.
- To create a company whose primary goal is to exceed customer’s expectations.
- To create a firm that provides the target customers with valuable services and provides the owner with a flexible, creative, fun, and profitable business opportunity.
1.2 Mission
The Metolius Agency’s mission is to provide the customer with creative and practical graphic design work and visual communication services. We exist to attract and maintain customers. When we adhere to this maxim, everything else will fall into place. Our services will exceed the expectations of our customers.
1.3 Keys to Success
The keys to success are:
- Professionalism
- Creativity
- Practical insight
- Enjoyment of the experience
Company Summary
The Metolius Agency is a start-up graphics firm that serves small- to medium-sized companies. The firm will be based in Eugene, Ore. and will operate from a small, downtown office.
2.1 Company Ownership
The Metolius Agency is a sole proprietorship owned and operated by Kiev Lartiste.
2.2 Start-up Summary
The Metolius Agency will incur the following start-up costs:
- Assorted office furniture including two filing cabinets, two work desks, a couch and two chairs for the waiting area, a round table with chairs, and assorted fixtures for the office.
- Two computers, each with 21″ monitors, graphic tablet, black and white laser printer, inkjet color printer, scanner, CD-RW, and the following software: Illustrator, Freehand, Quark, Photoshop, Font Management Utilities, Traffic Office Manager (a scheduling and billing software), and Microsoft Project.
- Development of the website which will include design time by Kiev and implementation from a University of Oregon computer science graduate student.
- A current library of requisite magazines and journals.
- A DSL connection.
- Assorted office supplies.
- Stationary and brochures.
- Legal fees regarding business formation, creation of standard client contracts, and other general advice.
Please note that the following items which are considered assets to be used for more than a year will be labeled long-term assets and will be depreciated using G.A.A.P. approved straight-line depreciation method.

| Start-up Funding | |
| Start-up Expenses to Fund | $1,000 |
| Start-up Assets to Fund | $42,000 |
| Total Funding Required | $43,000 |
| Assets | |
| Non-cash Assets from Start-up | $19,800 |
| Cash Requirements from Start-up | $22,200 |
| Additional Cash Raised | $0 |
| Cash Balance on Starting Date | $22,200 |
| Total Assets | $42,000 |
| Liabilities and Capital | |
| Liabilities | |
| Current Borrowing | $0 |
| Long-term Liabilities | $0 |
| Accounts Payable (Outstanding Bills) | $0 |
| Other Current Liabilities (interest-free) | $0 |
| Total Liabilities | $0 |
| Capital | |
| Planned Investment | |
| Kiev | $43,000 |
| Investor 2 | $0 |
| Other | $0 |
| Additional Investment Requirement | $0 |
| Total Planned Investment | $43,000 |
| Loss at Start-up (Start-up Expenses) | ($1,000) |
| Total Capital | $42,000 |
| Total Capital and Liabilities | $42,000 |
| Total Funding | $43,000 |
| Start-up | |
| Requirements | |
| Start-up Expenses | |
| Legal | $500 |
| Stationery etc. | $250 |
| Brochures | $250 |
| Other | $0 |
| Total Start-up Expenses | $1,000 |
| Start-up Assets | |
| Cash Required | $22,200 |
| Other Current Assets | $0 |
| Long-term Assets | $19,800 |
| Total Assets | $42,000 |
| Total Requirements | $43,000 |
Services
The Metolius Agency provides graphic design and visual communication services to established, primarily Eugene-based, companies. Some of the services offered are corporate identity, marquees, logos, branding, and packaging.
The pricing of the projects are typically estimated as a project-based cost. The project cost will be estimated by the approximate number of hours needed to complete the project. Generally, Kiev will be charging $75 an hour for his services.
The majority of services will be provided at The Metolius Agency’s office space. This office will be modern, practical, and sleek. This is very important because the office of a graphic designer is to a large degree a piece of their portfolio and reflects their work product. Therefore, a decent amount of money will be used to develop a proper appearing business office.
Market Analysis Summary
The Metolius Agency will be targeting small- to medium-sized companies. What these companies have in common is they have started as a small company with a good idea and have grown into a larger, more mature company that must now decide if they are going to maintain the current business strategy, or reinvigorate the company, employ professional service providers, and move to the next level.
4.1 Market Segmentation
The Metolius Agency has two distinct customer groups which they will concentrate on:
- Small-size companies: typically five to 15 employees
- Medium-size companies: 15 to 40 employees
These companies started with a valuable concept and leveraged their original grassroots visual communication elements. Now that they have matured into a larger company, they can no longer rely on the original grassroots corporate identity. These companies are in need of a professional firm like The Metolius Agency to expand their identify and take them to that same level as their competitors and be able to compete.

| Market Analysis | |||||||
| Year 1 | Year 2 | Year 3 | Year 4 | Year 5 | |||
| Potential Customers | Growth | CAGR | |||||
| Small companies | 8% | 234 | 253 | 273 | 295 | 319 | 8.05% |
| Medium companies | 7% | 145 | 155 | 166 | 178 | 190 | 6.99% |
| Total | 7.65% | 379 | 408 | 439 | 473 | 509 | 7.65% |
4.2 Target Market Segment Strategy
The market segments will be targeted in a number of different ways. It must be noted that graphics firms generate visibility and sales not through advertising, but through networking and client referrals. The methods used for the target market segment strategy will be:
- Networking. The networking will be based on leveraging Kiev’s personal and professional relationships that he has developed after spending years in the industry. Ways of networking include sending out notecards to all acquaintances announcing the opening of The Metolius Agency, periodically meeting with people to catch up–as well to continue to network which means to find out who this person knows within the target companies that Metolius will try to turn into customers.
- Client referral. A lot of business is derived through referrals. Some of the referrals will come through the Chamber of Commerce, some of the referrals will come from customers. Recognizing that referrals will be a good source of new customers, Kiev will be in constant contact with the Chamber. In addition to being in contact with them, Kiev will investigate the possibility of doing a small project pro bono for the Chamber. This will be done to let the Chamber view an example of The Metolius Agency’s work. It will also provide a reason for the Chamber to recommend The Metolius Agency. Kiev will work very hard to satisfy all of his customers. By making sure that he exceeds their expectations, he will increase the likelihood that he will receive referrals from satisfied customers.
- Targeted customer acquisition. This is the researching and strategic formulation to attract a chosen company to become a customer. Kiev will put together a list of 20-30 companies that would be excellent customers. Once these companies have been identified, Kiev will devise a strategy to target these companies as customers by initially determining what value Metolius can offer them. Eventually, the goal is to be able to meet with the decision maker of the company and present them with a portfolio of Kiev’s past work as well as the proposed value Kiev can offer them.
4.3 Service Business Analysis
The graphic design industry is fairly diverse with all types of service providers. There are large advertising agencies, freelance designers, and in-house firms that typically only serve the specific company.

Within the last seven to 10 years, there has been a trend in the industry for the general advertising agencies, that previously only worked with advertising, to act as a full-service agency that not only prepares advertisements, but also does a lot of the creative work in-house instead of outsourcing it. This trend toward full-service agencies has continued. To a large degree it is occurring due to higher profit margins for the service providers. The Metolius Agency will be bucking this trend and concentrating on their specific skill set.
4.3.1 Competition and Buying Patterns
The following are examples of the different types of competitors:
- Large advertising agencies: over the years these firms have increased their number of service offerings from selling media forms of advertising, to a full-service company that develops creative work in-house, working with companies to develop corporate identity, etc.
- Freelance designers: these competitors are similar to Kiev because they are typically a one-man operation, often operating out of their own home. Often the freelance designers are just getting into the business and are trying to get experience, or they have left a firm in search of a more flexible lifestyle. Some freelance designers are well experienced and can offer the same professional level of quality the large agencies offer.
- Kinko’s: while Kinko’s is not a true competitor, it is a substitute competitor that should be mentioned. Kinko’s stores do not have a true creative department, but for some of the larger accounts, it offers free creative services as a value-added feature to the larger customer. These services are typically provided by an employee who has introductory or intermediate skills using graphic design software such as Quark or Freehand, and in a small amount of time can generate creative images for the client. These services are typically not billed but used as a value-added benefit. While the price is quite good, the customer must recognize the fact that these services are not on par with a professional agency.
Strategy and Implementation Summary
The Metolius Agency’s marketing and sales strategy will utilize networking and referrals to develop visibility for the company. Prospective customers will be turned into qualified sales through a professional showing that displays Kiev’s portfolio of past work. The portfolio is key for making a positive impression regarding Kiev which illustrates his skill set and capacity as a creative designer.
5.1 Marketing Strategy
As noted previously in the target market segment strategy, The Metolius Agency will rely on three activities in their marketing efforts. These include:
- Networking: leveraging relationships to build more relationships within Eugene’s relatively intimate community.
- Client referral: by providing outstanding customer attention, current customers are more likely to become a long-term customer and are more likely to refer their friends.
- Targeted customer acquisition: the first step of this process is to target who the ideal customer is, determine how Metolius can offer them value, and then network to come into contact with the decision maker at that company.
5.2 Sales Strategy
The sales strategy will be to utilize Kiev’s portfolio of past work to qualify a sales lead. Using a portfolio is very common within the industry to show past examples of work. Kiev’s strategy will be the development of several different portfolios, each one customized to a specific type of work. By having different portfolios, Kiev is able to better illustrate his proficiency with that specific skill set. In addition to the use of the portfolio, Kiev will do research on the prospective company and their industry so that he has specific knowledge of the needs the company may have and solutions that he can offer.
5.2.1 Sales Forecast
The first month of operation will be used to get the office set up and ready for business. Some of the time will be working with the interior designers to create a modern looking office space.
Months two through four will be somewhat slow as Kiev is developing clients. He is forecasted to take on some smaller projects. By month five Metolius will have developed larger projects and will continue to grow steadily.

| Sales Forecast | |||
| Year 1 | Year 2 | Year 3 | |
| Sales | |||
| Small companies | $29,339 | $50,697 | $58,849 |
| Medium companies | $40,058 | $74,554 | $86,543 |
| Total Sales | $69,397 | $125,251 | $145,392 |
| Direct Cost of Sales | Year 1 | Year 2 | Year 3 |
| Small companies | $880 | $1,521 | $1,765 |
| Medium companies | $1,202 | $2,237 | $2,596 |
| Subtotal Direct Cost of Sales | $2,082 | $3,758 | $4,362 |
5.3 Milestones
The Metolius Agency will have several milestones early on:
- Business plan completion
- Office set up
- Establishment of the first major account
- Profitability
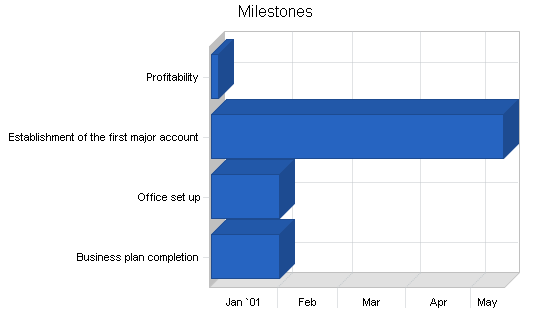
| Milestones | |||||
| Milestone | Start Date | End Date | Budget | Manager | Department |
| Business plan completion | 1/1/2001 | 2/1/2001 | $0 | ABC | Marketing |
| Office set up | 1/1/2001 | 2/1/2001 | $0 | ABC | Department |
| Establishment of the first major account | 1/1/2001 | 5/15/2001 | $0 | ABC | Department |
| Profitability | 1/1/2001 | 9/31/01 | $0 | ABC | Department |
| Totals | $0 | ||||
5.4 Competitive Edge
The Metolius Agency’s competitive edge is based on Kiev’s diverse background of business and creativity. Typically, most creative agencies are staffed by right-brain creative types. These people are extremely aesthetically oriented. While this is certainly an asset in the field of graphic design, it can be limiting because while their work might be extremely creative, it might not “hit home” with non-creative types which make up a large portion in the business world.
Kiev’s background is based both in aesthetics and business. While Kiev always had a creative streak that he would use, his education was business oriented. This competitive edge allows The Metolius Agency to offer similar creative services other firms can offer, but also provide a unique business perspective.
Web Plan Summary
The website will be used as a way to disseminate information regarding the firm, show past examples of work, provide the interested party will several ways of contacting The Metolius Agency. In today’s day and age, a website is almost a given, a standard source of information regarding the company.
6.1 Website Marketing Strategy
The marketing strategy for the website will be based on inclusion of the Internet address in all materials that The Metolius Agency releases, as well as submission to popular websites. Submission to search engines is an art in itself as different search engines work in different ways so a customized submission is most effective.
6.2 Development Requirements
A graduate student from the University of Oregon’s computer science department will be used for the development (writing the code, Kiev will be responsible for the creative work) of the website as well as the periodic maintenance of the site. A graduate student will be used because of their expertise and typical below market rate.
Management Summary
Kiev Lartiste received his Bachelor of Arts in graphic design and business administration from the University of Oregon. While pursuing his undergraduate degree, Kiev was able to take several different graduate level business courses which were more challenging for him. While pursuing the double degree, Kiev began to recognize just how unique his skills were. Most of his colleagues in the art department had artistic skills equal to Kiev, but had no business sense. Likewise, his colleagues in the business department were very business oriented but struggled with creativity.
Upon graduation, Kiev went to work for Wieden & Kennedy in Portland. This was a wonderful experience as Kiev was surrounded by very bright, creative people. Kiev was given small projects, usually components of larger projects. While this was a good experience, he was unable to leverage his business skills under these circumstances.
After three years Kiev moved to Eugene and took a position with (name omitted), a large full-service advertising agency. The firm gave Kiev more management responsibility for his projects. After the third year, Kiev felt confident enough to entertain the idea of going out on his own and opening his own firm. After market research and writing a business plan, Kiev gave notice and opened up The Metolius Agency.
7.1 Personnel Plan
Kiev will be the sole employee through month seven at which time he will hire an assistant to help out with design execution, as well as some of the administrative details.
| Personnel Plan | |||
| Year 1 | Year 2 | Year 3 | |
| Kiev | $42,000 | $42,000 | $42,000 |
| Assistant | $17,280 | $34,560 | $34,560 |
| Total People | 2 | 2 | 2 |
| Total Payroll | $59,280 | $76,560 | $76,560 |
Financial Plan
The following sections will outline important financial information.
8.1 Important Assumptions
The following table details important financial assumptions.
| General Assumptions | |||
| Year 1 | Year 2 | Year 3 | |
| Plan Month | 1 | 2 | 3 |
| Current Interest Rate | 10.00% | 10.00% | 10.00% |
| Long-term Interest Rate | 10.00% | 10.00% | 10.00% |
| Tax Rate | 30.00% | 30.00% | 30.00% |
| Other | 0 | 0 | 0 |
8.2 Break-even Analysis
The Break-even Analysis indicates that approximately $7,000 will be needed in monthly revenue to reach the break-even point.

| Break-even Analysis | |
| Monthly Revenue Break-even | $7,053 |
| Assumptions: | |
| Average Percent Variable Cost | 3% |
| Estimated Monthly Fixed Cost | $6,841 |
8.3 Projected Profit and Loss
The following table will indicate projected profit and loss.

| Pro Forma Profit and Loss | |||
| Year 1 | Year 2 | Year 3 | |
| Sales | $69,397 | $125,251 | $145,392 |
| Direct Cost of Sales | $2,082 | $3,758 | $4,362 |
| Other Production Expenses | $0 | $0 | $0 |
| Total Cost of Sales | $2,082 | $3,758 | $4,362 |
| Gross Margin | $67,316 | $121,493 | $141,030 |
| Gross Margin % | 97.00% | 97.00% | 97.00% |
| Expenses | |||
| Payroll | $59,280 | $76,560 | $76,560 |
| Sales and Marketing and Other Expenses | $2,820 | $2,820 | $2,820 |
| Depreciation | $2,400 | $2,400 | $2,400 |
| Website maintenance | $600 | $600 | $600 |
| Insurance | $900 | $900 | $900 |
| Rent | $7,200 | $7,200 | $7,200 |
| Payroll Taxes | $8,892 | $11,484 | $11,484 |
| Other | $0 | $0 | $0 |
| Total Operating Expenses | $82,092 | $101,964 | $101,964 |
| Profit Before Interest and Taxes | ($14,776) | $19,529 | $39,066 |
| EBITDA | ($12,376) | $21,929 | $41,466 |
| Interest Expense | $0 | $0 | $0 |
| Taxes Incurred | $0 | $5,859 | $11,720 |
| Net Profit | ($14,776) | $13,670 | $27,347 |
| Net Profit/Sales | -21.29% | 10.91% | 18.81% |
8.4 Projected Cash Flow
The following chart and table will indicate projected cash flow.

| Pro Forma Cash Flow | |||
| Year 1 | Year 2 | Year 3 | |
| Cash Received | |||
| Cash from Operations | |||
| Cash Sales | $69,397 | $125,251 | $145,392 |
| Subtotal Cash from Operations | $69,397 | $125,251 | $145,392 |
| Additional Cash Received | |||
| Sales Tax, VAT, HST/GST Received | $0 | $0 | $0 |
| New Current Borrowing | $0 | $0 | $0 |
| New Other Liabilities (interest-free) | $0 | $0 | $0 |
| New Long-term Liabilities | $0 | $0 | $0 |
| Sales of Other Current Assets | $0 | $0 | $0 |
| Sales of Long-term Assets | $0 | $0 | $0 |
| New Investment Received | $0 | $0 | $0 |
| Subtotal Cash Received | $69,397 | $125,251 | $145,392 |
| Expenditures | Year 1 | Year 2 | Year 3 |
| Expenditures from Operations | |||
| Cash Spending | $59,280 | $76,560 | $76,560 |
| Bill Payments | $20,322 | $32,111 | $38,554 |
| Subtotal Spent on Operations | $79,602 | $108,671 | $115,114 |
| Additional Cash Spent | |||
| Sales Tax, VAT, HST/GST Paid Out | $0 | $0 | $0 |
| Principal Repayment of Current Borrowing | $0 | $0 | $0 |
| Other Liabilities Principal Repayment | $0 | $0 | $0 |
| Long-term Liabilities Principal Repayment | $0 | $0 | $0 |
| Purchase Other Current Assets | $0 | $0 | $0 |
| Purchase Long-term Assets | $0 | $0 | $0 |
| Dividends | $0 | $0 | $0 |
| Subtotal Cash Spent | $79,602 | $108,671 | $115,114 |
| Net Cash Flow | ($10,205) | $16,580 | $30,278 |
| Cash Balance | $11,995 | $28,575 | $58,853 |
8.5 Projected Balance Sheet
The following table will indicate the projected balance sheet.
| Pro Forma Balance Sheet | |||
| Year 1 | Year 2 | Year 3 | |
| Assets | |||
| Current Assets | |||
| Cash | $11,995 | $28,575 | $58,853 |
| Other Current Assets | $0 | $0 | $0 |
| Total Current Assets | $11,995 | $28,575 | $58,853 |
| Long-term Assets | |||
| Long-term Assets | $19,800 | $19,800 | $19,800 |
| Accumulated Depreciation | $2,400 | $4,800 | $7,200 |
| Total Long-term Assets | $17,400 | $15,000 | $12,600 |
| Total Assets | $29,395 | $43,575 | $71,453 |
| Liabilities and Capital | Year 1 | Year 2 | Year 3 |
| Current Liabilities | |||
| Accounts Payable | $2,172 | $2,681 | $3,213 |
| Current Borrowing | $0 | $0 | $0 |
| Other Current Liabilities | $0 | $0 | $0 |
| Subtotal Current Liabilities | $2,172 | $2,681 | $3,213 |
| Long-term Liabilities | $0 | $0 | $0 |
| Total Liabilities | $2,172 | $2,681 | $3,213 |
| Paid-in Capital | $43,000 | $43,000 | $43,000 |
| Retained Earnings | ($1,000) | ($15,776) | ($2,106) |
| Earnings | ($14,776) | $13,670 | $27,347 |
| Total Capital | $27,224 | $40,894 | $68,240 |
| Total Liabilities and Capital | $29,395 | $43,575 | $71,453 |
| Net Worth | $27,224 | $40,894 | $68,240 |
8.6 Business Ratios
The following table compares standard business ratios with the Standard Industry Code #7336, Graphic Design Services.
| Ratio Analysis | ||||
| Year 1 | Year 2 | Year 3 | Industry Profile | |
| Sales Growth | 0.00% | 80.48% | 16.08% | 9.02% |
| Percent of Total Assets | ||||
| Other Current Assets | 0.00% | 0.00% | 0.00% | 52.57% |
| Total Current Assets | 40.81% | 65.58% | 82.37% | 76.45% |
| Long-term Assets | 59.19% | 34.42% | 17.63% | 23.55% |
| Total Assets | 100.00% | 100.00% | 100.00% | 100.00% |
| Current Liabilities | 7.39% | 6.15% | 4.50% | 34.45% |
| Long-term Liabilities | 0.00% | 0.00% | 0.00% | 23.62% |
| Total Liabilities | 7.39% | 6.15% | 4.50% | 58.07% |
| Net Worth | 92.61% | 93.85% | 95.50% | 41.93% |
| Percent of Sales | ||||
| Sales | 100.00% | 100.00% | 100.00% | 100.00% |
| Gross Margin | 97.00% | 97.00% | 97.00% | 100.00% |
| Selling, General & Administrative Expenses | 118.29% | 86.09% | 78.19% | 77.05% |
| Advertising Expenses | 1.47% | 0.81% | 0.70% | 1.42% |
| Profit Before Interest and Taxes | -21.29% | 15.59% | 26.87% | 0.83% |
| Main Ratios | ||||
| Current | 5.52 | 10.66 | 18.32 | 1.51 |
| Quick | 5.52 | 10.66 | 18.32 | 1.13 |
| Total Debt to Total Assets | 7.39% | 6.15% | 4.50% | 66.33% |
| Pre-tax Return on Net Worth | -54.28% | 47.76% | 57.25% | 2.06% |
| Pre-tax Return on Assets | -50.27% | 44.82% | 54.67% | 6.12% |
| Additional Ratios | Year 1 | Year 2 | Year 3 | |
| Net Profit Margin | -21.29% | 10.91% | 18.81% | n.a |
| Return on Equity | -54.28% | 33.43% | 40.07% | n.a |
| Activity Ratios | ||||
| Accounts Payable Turnover | 10.36 | 12.17 | 12.17 | n.a |
| Payment Days | 27 | 27 | 28 | n.a |
| Total Asset Turnover | 2.36 | 2.87 | 2.03 | n.a |
| Debt Ratios | ||||
| Debt to Net Worth | 0.08 | 0.07 | 0.05 | n.a |
| Current Liab. to Liab. | 1.00 | 1.00 | 1.00 | n.a |
| Liquidity Ratios | ||||
| Net Working Capital | $9,824 | $25,894 | $55,640 | n.a |
| Interest Coverage | 0.00 | 0.00 | 0.00 | n.a |
| Additional Ratios | ||||
| Assets to Sales | 0.42 | 0.35 | 0.49 | n.a |
| Current Debt/Total Assets | 7% | 6% | 4% | n.a |
| Acid Test | 5.52 | 10.66 | 18.32 | n.a |
| Sales/Net Worth | 2.55 | 3.06 | 2.13 | n.a |
| Dividend Payout | 0.00 | 0.00 | 0.00 | n.a |
Appendix
| Sales Forecast | |||||||||||||
| Month 1 | Month 2 | Month 3 | Month 4 | Month 5 | Month 6 | Month 7 | Month 8 | Month 9 | Month 10 | Month 11 | Month 12 | ||
| Sales | |||||||||||||
| Small companies | 0% | $0 | $600 | $1,500 | $1,360 | $1,820 | $2,296 | $2,811 | $3,240 | $3,558 | $3,769 | $3,936 | $4,450 |
| Medium companies | 0% | $0 | $0 | $0 | $2,000 | $2,676 | $3,376 | $4,134 | $4,765 | $5,232 | $5,543 | $5,788 | $6,544 |
| Total Sales | $0 | $600 | $1,500 | $3,360 | $4,496 | $5,672 | $6,945 | $8,005 | $8,790 | $9,312 | $9,724 | $10,994 | |
| Direct Cost of Sales | Month 1 | Month 2 | Month 3 | Month 4 | Month 5 | Month 6 | Month 7 | Month 8 | Month 9 | Month 10 | Month 11 | Month 12 | |
| Small companies | $0 | $18 | $45 | $41 | $55 | $69 | $84 | $97 | $107 | $113 | $118 | $133 | |
| Medium companies | $0 | $0 | $0 | $60 | $80 | $101 | $124 | $143 | $157 | $166 | $174 | $196 | |
| Subtotal Direct Cost of Sales | $0 | $18 | $45 | $101 | $135 | $170 | $208 | $240 | $264 | $279 | $292 | $330 | |
| Personnel Plan | |||||||||||||
| Month 1 | Month 2 | Month 3 | Month 4 | Month 5 | Month 6 | Month 7 | Month 8 | Month 9 | Month 10 | Month 11 | Month 12 | ||
| Kiev | 0% | $3,500 | $3,500 | $3,500 | $3,500 | $3,500 | $3,500 | $3,500 | $3,500 | $3,500 | $3,500 | $3,500 | $3,500 |
| Assistant | 0% | $0 | $0 | $0 | $0 | $0 | $0 | $2,880 | $2,880 | $2,880 | $2,880 | $2,880 | $2,880 |
| Total People | 1 | 1 | 1 | 1 | 1 | 1 | 2 | 2 | 2 | 2 | 2 | 2 | |
| Total Payroll | $3,500 | $3,500 | $3,500 | $3,500 | $3,500 | $3,500 | $6,380 | $6,380 | $6,380 | $6,380 | $6,380 | $6,380 | |
| General Assumptions | |||||||||||||
| Month 1 | Month 2 | Month 3 | Month 4 | Month 5 | Month 6 | Month 7 | Month 8 | Month 9 | Month 10 | Month 11 | Month 12 | ||
| Plan Month | 1 | 2 | 3 | 4 | 5 | 6 | 7 | 8 | 9 | 10 | 11 | 12 | |
| Current Interest Rate | 10.00% | 10.00% | 10.00% | 10.00% | 10.00% | 10.00% | 10.00% | 10.00% | 10.00% | 10.00% | 10.00% | 10.00% | |
| Long-term Interest Rate | 10.00% | 10.00% | 10.00% | 10.00% | 10.00% | 10.00% | 10.00% | 10.00% | 10.00% | 10.00% | 10.00% | 10.00% | |
| Tax Rate | 30.00% | 30.00% | 30.00% | 30.00% | 30.00% | 30.00% | 30.00% | 30.00% | 30.00% | 30.00% | 30.00% | 30.00% | |
| Other | 0 | 0 | 0 | 0 | 0 | 0 | 0 | 0 | 0 | 0 | 0 | 0 | |
| Pro Forma Profit and Loss | |||||||||||||
| Month 1 | Month 2 | Month 3 | Month 4 | Month 5 | Month 6 | Month 7 | Month 8 | Month 9 | Month 10 | Month 11 | Month 12 | ||
| Sales | $0 | $600 | $1,500 | $3,360 | $4,496 | $5,672 | $6,945 | $8,005 | $8,790 | $9,312 | $9,724 | $10,994 | |
| Direct Cost of Sales | $0 | $18 | $45 | $101 | $135 | $170 | $208 | $240 | $264 | $279 | $292 | $330 | |
| Other Production Expenses | $0 | $0 | $0 | $0 | $0 | $0 | $0 | $0 | $0 | $0 | $0 | $0 | |
| Total Cost of Sales | $0 | $18 | $45 | $101 | $135 | $170 | $208 | $240 | $264 | $279 | $292 | $330 | |
| Gross Margin | $0 | $582 | $1,455 | $3,259 | $4,361 | $5,502 | $6,737 | $7,765 | $8,526 | $9,033 | $9,432 | $10,664 | |
| Gross Margin % | 0.00% | 97.00% | 97.00% | 97.00% | 97.00% | 97.00% | 97.00% | 97.00% | 97.00% | 97.00% | 97.00% | 97.00% | |
| Expenses | |||||||||||||
| Payroll | $3,500 | $3,500 | $3,500 | $3,500 | $3,500 | $3,500 | $6,380 | $6,380 | $6,380 | $6,380 | $6,380 | $6,380 | |
| Sales and Marketing and Other Expenses | $235 | $235 | $235 | $235 | $235 | $235 | $235 | $235 | $235 | $235 | $235 | $235 | |
| Depreciation | $200 | $200 | $200 | $200 | $200 | $200 | $200 | $200 | $200 | $200 | $200 | $200 | |
| Website maintenance | $50 | $50 | $50 | $50 | $50 | $50 | $50 | $50 | $50 | $50 | $50 | $50 | |
| Insurance | $75 | $75 | $75 | $75 | $75 | $75 | $75 | $75 | $75 | $75 | $75 | $75 | |
| Rent | $600 | $600 | $600 | $600 | $600 | $600 | $600 | $600 | $600 | $600 | $600 | $600 | |
| Payroll Taxes | 15% | $525 | $525 | $525 | $525 | $525 | $525 | $957 | $957 | $957 | $957 | $957 | $957 |
| Other | $0 | $0 | $0 | $0 | $0 | $0 | $0 | $0 | $0 | $0 | $0 | $0 | |
| Total Operating Expenses | $5,185 | $5,185 | $5,185 | $5,185 | $5,185 | $5,185 | $8,497 | $8,497 | $8,497 | $8,497 | $8,497 | $8,497 | |
| Profit Before Interest and Taxes | ($5,185) | ($4,603) | ($3,730) | ($1,926) | ($824) | $317 | ($1,760) | ($732) | $29 | $536 | $935 | $2,167 | |
| EBITDA | ($4,985) | ($4,403) | ($3,530) | ($1,726) | ($624) | $517 | ($1,560) | ($532) | $229 | $736 | $1,135 | $2,367 | |
| Interest Expense | $0 | $0 | $0 | $0 | $0 | $0 | $0 | $0 | $0 | $0 | $0 | $0 | |
| Taxes Incurred | $0 | $0 | $0 | $0 | $0 | $0 | $0 | $0 | $0 | $0 | $0 | $0 | |
| Net Profit | ($5,185) | ($4,603) | ($3,730) | ($1,926) | ($824) | $317 | ($1,760) | ($732) | $29 | $536 | $935 | $2,167 | |
| Net Profit/Sales | 0.00% | -767.17% | -248.67% | -57.32% | -18.33% | 5.58% | -25.34% | -9.14% | 0.33% | 5.75% | 9.62% | 19.71% | |
| Pro Forma Cash Flow | |||||||||||||
| Month 1 | Month 2 | Month 3 | Month 4 | Month 5 | Month 6 | Month 7 | Month 8 | Month 9 | Month 10 | Month 11 | Month 12 | ||
| Cash Received | |||||||||||||
| Cash from Operations | |||||||||||||
| Cash Sales | $0 | $600 | $1,500 | $3,360 | $4,496 | $5,672 | $6,945 | $8,005 | $8,790 | $9,312 | $9,724 | $10,994 | |
| Subtotal Cash from Operations | $0 | $600 | $1,500 | $3,360 | $4,496 | $5,672 | $6,945 | $8,005 | $8,790 | $9,312 | $9,724 | $10,994 | |
| Additional Cash Received | |||||||||||||
| Sales Tax, VAT, HST/GST Received | 0.00% | $0 | $0 | $0 | $0 | $0 | $0 | $0 | $0 | $0 | $0 | $0 | $0 |
| New Current Borrowing | $0 | $0 | $0 | $0 | $0 | $0 | $0 | $0 | $0 | $0 | $0 | $0 | |
| New Other Liabilities (interest-free) | $0 | $0 | $0 | $0 | $0 | $0 | $0 | $0 | $0 | $0 | $0 | $0 | |
| New Long-term Liabilities | $0 | $0 | $0 | $0 | $0 | $0 | $0 | $0 | $0 | $0 | $0 | $0 | |
| Sales of Other Current Assets | $0 | $0 | $0 | $0 | $0 | $0 | $0 | $0 | $0 | $0 | $0 | $0 | |
| Sales of Long-term Assets | $0 | $0 | $0 | $0 | $0 | $0 | $0 | $0 | $0 | $0 | $0 | $0 | |
| New Investment Received | $0 | $0 | $0 | $0 | $0 | $0 | $0 | $0 | $0 | $0 | $0 | $0 | |
| Subtotal Cash Received | $0 | $600 | $1,500 | $3,360 | $4,496 | $5,672 | $6,945 | $8,005 | $8,790 | $9,312 | $9,724 | $10,994 | |
| Expenditures | Month 1 | Month 2 | Month 3 | Month 4 | Month 5 | Month 6 | Month 7 | Month 8 | Month 9 | Month 10 | Month 11 | Month 12 | |
| Expenditures from Operations | |||||||||||||
| Cash Spending | $3,500 | $3,500 | $3,500 | $3,500 | $3,500 | $3,500 | $6,380 | $6,380 | $6,380 | $6,380 | $6,380 | $6,380 | |
| Bill Payments | $50 | $1,486 | $1,504 | $1,532 | $1,587 | $1,621 | $1,671 | $2,126 | $2,158 | $2,181 | $2,197 | $2,210 | |
| Subtotal Spent on Operations | $3,550 | $4,986 | $5,004 | $5,032 | $5,087 | $5,121 | $8,051 | $8,506 | $8,538 | $8,561 | $8,577 | $8,590 | |
| Additional Cash Spent | |||||||||||||
| Sales Tax, VAT, HST/GST Paid Out | $0 | $0 | $0 | $0 | $0 | $0 | $0 | $0 | $0 | $0 | $0 | $0 | |
| Principal Repayment of Current Borrowing | $0 | $0 | $0 | $0 | $0 | $0 | $0 | $0 | $0 | $0 | $0 | $0 | |
| Other Liabilities Principal Repayment | $0 | $0 | $0 | $0 | $0 | $0 | $0 | $0 | $0 | $0 | $0 | $0 | |
| Long-term Liabilities Principal Repayment | $0 | $0 | $0 | $0 | $0 | $0 | $0 | $0 | $0 | $0 | $0 | $0 | |
| Purchase Other Current Assets | $0 | $0 | $0 | $0 | $0 | $0 | $0 | $0 | $0 | $0 | $0 | $0 | |
| Purchase Long-term Assets | $0 | $0 | $0 | $0 | $0 | $0 | $0 | $0 | $0 | $0 | $0 | $0 | |
| Dividends | $0 | $0 | $0 | $0 | $0 | $0 | $0 | $0 | $0 | $0 | $0 | $0 | |
| Subtotal Cash Spent | $3,550 | $4,986 | $5,004 | $5,032 | $5,087 | $5,121 | $8,051 | $8,506 | $8,538 | $8,561 | $8,577 | $8,590 | |
| Net Cash Flow | ($3,550) | ($4,386) | ($3,504) | ($1,672) | ($591) | $551 | ($1,106) | ($501) | $252 | $751 | $1,147 | $2,404 | |
| Cash Balance | $18,651 | $14,265 | $10,761 | $9,089 | $8,498 | $9,049 | $7,943 | $7,442 | $7,693 | $8,444 | $9,592 | $11,995 | |
| Pro Forma Balance Sheet | |||||||||||||
| Month 1 | Month 2 | Month 3 | Month 4 | Month 5 | Month 6 | Month 7 | Month 8 | Month 9 | Month 10 | Month 11 | Month 12 | ||
| Assets | Starting Balances | ||||||||||||
| Current Assets | |||||||||||||
| Cash | $22,200 | $18,651 | $14,265 | $10,761 | $9,089 | $8,498 | $9,049 | $7,943 | $7,442 | $7,693 | $8,444 | $9,592 | $11,995 |
| Other Current Assets | $0 | $0 | $0 | $0 | $0 | $0 | $0 | $0 | $0 | $0 | $0 | $0 | $0 |
| Total Current Assets | $22,200 | $18,651 | $14,265 | $10,761 | $9,089 | $8,498 | $9,049 | $7,943 | $7,442 | $7,693 | $8,444 | $9,592 | $11,995 |
| Long-term Assets | |||||||||||||
| Long-term Assets | $19,800 | $19,800 | $19,800 | $19,800 | $19,800 | $19,800 | $19,800 | $19,800 | $19,800 | $19,800 | $19,800 | $19,800 | $19,800 |
| Accumulated Depreciation | $0 | $200 | $400 | $600 | $800 | $1,000 | $1,200 | $1,400 | $1,600 | $1,800 | $2,000 | $2,200 | $2,400 |
| Total Long-term Assets | $19,800 | $19,600 | $19,400 | $19,200 | $19,000 | $18,800 | $18,600 | $18,400 | $18,200 | $18,000 | $17,800 | $17,600 | $17,400 |
| Total Assets | $42,000 | $38,251 | $33,665 | $29,961 | $28,089 | $27,298 | $27,649 | $26,343 | $25,642 | $25,693 | $26,244 | $27,192 | $29,395 |
| Liabilities and Capital | Month 1 | Month 2 | Month 3 | Month 4 | Month 5 | Month 6 | Month 7 | Month 8 | Month 9 | Month 10 | Month 11 | Month 12 | |
| Current Liabilities | |||||||||||||
| Accounts Payable | $0 | $1,436 | $1,453 | $1,479 | $1,533 | $1,566 | $1,600 | $2,055 | $2,085 | $2,108 | $2,123 | $2,135 | $2,172 |
| Current Borrowing | $0 | $0 | $0 | $0 | $0 | $0 | $0 | $0 | $0 | $0 | $0 | $0 | $0 |
| Other Current Liabilities | $0 | $0 | $0 | $0 | $0 | $0 | $0 | $0 | $0 | $0 | $0 | $0 | $0 |
| Subtotal Current Liabilities | $0 | $1,436 | $1,453 | $1,479 | $1,533 | $1,566 | $1,600 | $2,055 | $2,085 | $2,108 | $2,123 | $2,135 | $2,172 |
| Long-term Liabilities | $0 | $0 | $0 | $0 | $0 | $0 | $0 | $0 | $0 | $0 | $0 | $0 | $0 |
| Total Liabilities | $0 | $1,436 | $1,453 | $1,479 | $1,533 | $1,566 | $1,600 | $2,055 | $2,085 | $2,108 | $2,123 | $2,135 | $2,172 |
| Paid-in Capital | $43,000 | $43,000 | $43,000 | $43,000 | $43,000 | $43,000 | $43,000 | $43,000 | $43,000 | $43,000 | $43,000 | $43,000 | $43,000 |
| Retained Earnings | ($1,000) | ($1,000) | ($1,000) | ($1,000) | ($1,000) | ($1,000) | ($1,000) | ($1,000) | ($1,000) | ($1,000) | ($1,000) | ($1,000) | ($1,000) |
| Earnings | $0 | ($5,185) | ($9,788) | ($13,518) | ($15,444) | ($16,268) | ($15,951) | ($17,712) | ($18,444) | ($18,415) | ($17,879) | ($16,944) | ($14,776) |
| Total Capital | $42,000 | $36,815 | $32,212 | $28,482 | $26,556 | $25,732 | $26,049 | $24,288 | $23,556 | $23,585 | $24,121 | $25,056 | $27,224 |
| Total Liabilities and Capital | $42,000 | $38,251 | $33,665 | $29,961 | $28,089 | $27,298 | $27,649 | $26,343 | $25,642 | $25,693 | $26,244 | $27,192 | $29,395 |
| Net Worth | $42,000 | $36,815 | $32,212 | $28,482 | $26,556 | $25,732 | $26,049 | $24,288 | $23,556 | $23,585 | $24,121 | $25,056 | $27,224 |


