
ASTI - Advanced Science and Technology Institute
Executive Summary
The Advanced Science and Technology Institute (ASTI) supports research faculty and staff at **State University, University of AnyState, AnyState Health Sciences University and AnyCity State University in its management of new discoveries. This support includes the management of new discoveries having commercial applications, as well as the management of corporate research agreements leading to new discovery.
**(Editor’s Note: Names disguised for confidentiality.)
1.1 Keys to Success
- Building a strong support base with the private sector within State and the Northwest.
- Creating an effective network between researchers to facilitate cross-disciplinary contact.
- Raising the viability of ASTI as the one-stop resource for all transferable technology that is being developed on the campuses of State’s four largest universities.
1.2 Mission
The mission of the ASTI is to bring technologies from **State University, University of AnyState, AnyState Health Sciences University and AnyCity State University into public use; thereby providing economic development assistance to state and federal agencies and companies to benefit State constituents, providing service to the technology transfer staff of each institution by assisting in identifying, protecting, developing and transferring technology to the private sector and generating income. ASTI’s unique perspective is in its ability to link researchers from various institutions to create new technologies that can then be marketed to the private sector.
Historically, State has received less attention from companies that develop long-term relationships with the university research community. With SouthernState universities to the south and the University of AnyState to the north, State has had a difficult time reaching the level of viability necessary to draw the interest of companies outside the state.
It is a problem of economy of scale. Currently, State University, University of AnyState, AnyState Health Sciences University and AnyCity State University have 128 technologies available for licensing. One university in SouthernState, The University of Southern State (USS), has over 200 technologies available for licensing. In addition, USS has received $20 million in corporate research funding last year. This far exceeds the total for all corporate research funding for the four State schools ($3 million) during the same period. In State, the State Technology Center has secured $91 million in private funding for technology transfer from the University of State. It is critical that the four major universities in State pool its resources in order to be competitive in drawing corporate attention to the excellent researchers working within their institutions.
It is ASTI’s mission to create a resource for the private sector that rivals USC by providing an aggressive one-stop center for all the pivotal research that is occuring in State.
1.3 Objectives
- Establish a 42-member corporate research support council and increase corporate membership in ASTI’s Technology Development Council by 20% each year.
- Facilitate two new industry sponsored research agreements the first year and increase the number of agreements each year.
- Create new research linkages between the four campuses and develop new collaborative relationships between researchers.
- Develop a cross-disciplinary research database that will link researchers throughout the state.
Organization Summary
ASTI is a focused program that offers a powerful resource to researchers who are seeking corporate support for research and corporations seeking new technologies. The program also seeks linkages between the four campus researchers in developing new partnerships that will generate additional corporate interest.
2.1 Legal Entity
State University, University of AnyState, AnyState Health Sciences University, and AnyCity State University are all share holders in ASTI.
2.2 Start-up Summary
Start-up costs and initial financing are shown on the following table. Each institution will contribute $40,000 to ASTI’s operating budget.

| Start-up Funding | |
| Start-up Expenses to Fund | $5,800 |
| Start-up Assets to Fund | $154,200 |
| Total Funding Required | $160,000 |
| Assets | |
| Non-cash Assets from Start-up | $0 |
| Cash Requirements from Start-up | $154,200 |
| Additional Cash Raised | $0 |
| Cash Balance on Starting Date | $154,200 |
| Total Assets | $154,200 |
| Liabilities and Capital | |
| Liabilities | |
| Current Borrowing | $0 |
| Long-term Liabilities | $0 |
| Accounts Payable (Outstanding Bills) | $0 |
| Other Current Liabilities (interest-free) | $0 |
| Total Liabilities | $0 |
| Capital | |
| Planned Investment | |
| State University | $40,000 |
| University of State | $40,000 |
| AnyCity State University | $40,000 |
| AnyState Health Sciences University | $40,000 |
| Additional Investment Requirement | $0 |
| Total Planned Investment | $160,000 |
| Loss at Start-up (Start-up Expenses) | ($5,800) |
| Total Capital | $154,200 |
| Total Capital and Liabilities | $154,200 |
| Total Funding | $160,000 |
| Start-up | |
| Requirements | |
| Start-up Expenses | |
| Legal | $500 |
| Stationery etc. | $300 |
| Brochures | $4,000 |
| Consultants | $0 |
| Insurance | $0 |
| Rent | $1,000 |
| Research and Development | $0 |
| Expensed Equipment | $0 |
| Other | $0 |
| Total Start-up Expenses | $5,800 |
| Start-up Assets | |
| Cash Required | $154,200 |
| Other Current Assets | $0 |
| Long-term Assets | $0 |
| Total Assets | $154,200 |
| Total Requirements | $160,000 |
2.3 Program Location
ASTI will be located in AnyCity, AnyState. This is a good central location for a state-wide program. AnyCity State University is located in AnyCity. AnyState Health Sciences University and State University are located in NewTown 60 miles to the north. The University of State is located in OldTown which is 40 miles south of AnyCity.
Services
ASTI’s services include:
New Technology
Assist in identifying new invention disclosures for new discoveries and evaluation of these new discoveries to determine commercial potential. A research database will be created and maintained by ASTI in order to respond quickly to requests for information from the private sector, especially when it links researchers on multiple campuses. Companies will have a quick and accessible resource that will identify researchers that match their interest areas. ASTI will also assist in the establishment of new businesses to develop emerging technologies.
Research Collaborations
ASTI will actively seek cross-disciplinary collaboration opportunities between researchers on the four member campuses.
Technology Conferences
ASTI will sponsor two conferences in Portland each year focusing on the areas of Biotechnology, Material Science, Computer Science, and Medical Technology.
Newsletter and Promotional Publications
ASTI will produce a monthly newsletter and quarterly promotional publications directed toward the private sector which will focus on current research on the four campuses and researcher profiles. This material will also highlight researchers seeking corporate support.
Market Analysis Summary
The research enterprise at State University, University of AnyState, AnyState Health Sciences University and AnyCity State University is remarkably broad, deep and diverse, spanning activities in twenty-two academic colleges and more than 40 multidisciplinary programs, centers, programs, and institutes.
ASTI will first focus on creating the information base necessary to satisfy high-technology corporations that are currently prospecting for new technologies. These are mostly larger companies, but also include medium- to small-sized companies.
Our most important group of potential customers are the researchers in these companies. They do not want to waste their time or resources looking for a needle in a haystack. It is critical that they find ASTI an excellent tool in quickly identifying technologies and researchers that will lead to profitable products.
ASTI will provide a two-tier service that will correspond to a company’s membership in ASTI’s Technology Development Council. There will be both a full and associate membership option in the Technology Development Council. We anticipate that larger companies will select the full membership option because it will offer additional research services. An associate membership is tailored for the medium- to small-sized companies whose contacts will be less frequent.
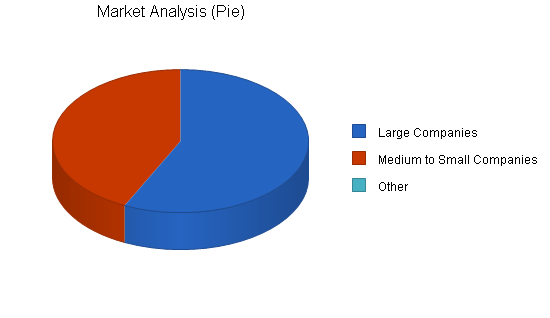
4.1 Market Segmentation
Larger Companies: It is critical to create major stakeholders in the development of a better delivery system for technology transfer. Currently, there are several large companies that have an ongoing relationship with researchers on the four major campuses. Recruiting these companies as full members of the Technology Development Council is an important first step in improving corporate interest in high-tech members in State. These companies will be responsive to ASTI’s ability to ferret out the research and researchers that they are interested in reviewing. ASTI will also facilitate any cross-disciplinary linkages that will lead to the pursuit of research that these companies are interested in. Involvement in the growth of ASTI will attract companies of simular size and stature.

Medium to Small Companies: These companies are critical to the growth of ASTI because they represent the state’s developing high-tech industries. Their focus in not only on a specific technology that is being developed at one of the member campuses but also on the graduate students that are working on the research. As associate members of the Technology Development Council, these companies will gain greater access to all the research opportunities that will meet their technology and staff needs.
| Market Analysis | |||||||
| Year 1 | Year 2 | Year 3 | Year 4 | Year 5 | |||
| Potential Customers | Growth | CAGR | |||||
| Large Companies | 20% | 20 | 24 | 29 | 35 | 42 | 20.38% |
| Medium to Small Companies | 20% | 15 | 18 | 22 | 26 | 31 | 19.90% |
| Other | 0% | 0 | 0 | 0 | 0 | 0 | 0.00% |
| Total | 20.17% | 35 | 42 | 51 | 61 | 73 | 20.17% |
4.2 Target Market Segment Strategy
As indicated by the previous table, we must first focus on all companies that have current relationships with researchers on the member campuses.
4.3 Service Providers Analysis
The private sector’s access to researchers at the member campuses range from excellent in selected disciplines, to completely chaotic and frustrating in most others areas.
ASTI’s goal is to assure access to all critical research through a streamlined process that leaves the company both satisfied with the results as well as the time invested in the search.
Strategy and Implementation Summary
The initial funding from the four member institutions will provide the foundation for launching ASTI. Its survival will depend on the program’s ability to grow a membership base to its Technology Development Council. The program will not survive if it is unable to meet its goal of increasing membership in the Council by 20% each year.
ASTI’s information products and services will add real value to the companies search for emerging technology. As stated before, our most important group of potential customers are the researchers in these companies. Their input into the kind of services they want will be critical to the evolution of ASTI. Our focus will be to add value in everything connected with ASTI.
5.1 Competitive Edge
ASTI’s competitive advantage is their comprehensive approach to providing unequalled access to researchers. ASTI’s focus is to support the companies in their successful pursuit of emerging technologies. The most critical component is the responsiveness of the program to company inquiries into selected research areas.
The best scenario is the company responding to research highlights provided by ASTI before initial inquires are made. ASTI will strive to open doors for companies so that long-term relationships will develop and companies will become members of the Technology Development Council.
The approach is decidedly sales-oriented in focus. This is a critical advantage when in competition with universities in SouthernState and NorthernState. Companies will find State research viable and easy to access.
Yet the key to ASTI’s success will be in how the program evolves in response to companies demands. ASTI’s Technology Development Council was a vehicle for that evolution. The Council will provide companies with the access to fine-tune services to improve the program’s ability to meet industry demands.
5.2 Marketing Strategy
ASTI’s marketing strategy will be to build the Technology Development Council as a base of support for technology transfer. The plan is to use existing members of the Council as lead contact for other companies. The best description of the strategy is the ever-widening ripples when a stone is thrown in a pond. The first step is to capture all the companies the are currently quite aware of the excellent researchers at the four member institutions. From that base, begin to recruit new companies that current members will invite into the Council.
Though it is possible that fresh contacts to ASTI, from inquiries about technology highlighted in promotional material, can lead to companies joining the Council, it will be the membership of the Council that will drive the success of the program.
5.3 Fundraising Strategy
The fund raising strategy will be the payment of annual membership fees in the Technology Development Council. A full membership will be $3,000 a year. An associate membership will be $1,000.
5.3.1 Funding Forecast
During the first year, ASTI will recruit 20 full members and 21 associate members to the Technology Development Council.

| Funding Forecast | |||
| Year 1 | Year 2 | Year 3 | |
| Funding | |||
| University Funding | $160,000 | $160,000 | $160,000 |
| Full Memberships | $90,000 | $75,000 | $93,000 |
| Associate Memberships | $36,000 | $26,000 | $32,000 |
| Total Funding | $286,000 | $261,000 | $285,000 |
| Direct Cost of Funding | Year 1 | Year 2 | Year 3 |
| University Funding | $0 | $0 | $0 |
| Full Memberships | $0 | $0 | $0 |
| Associate Memberships | $0 | $0 | $0 |
| Subtotal Cost of Funding | $0 | $0 | $0 |
5.4 Milestones
ASTI’s milestones are as follows:
-
Within the first six months of operation to assemble the Technology Development Council membership.
-
Publish the first ASTI monthly newsletter in December.
-
Stage high tech conferences in AnyCity during the month of March and September in 2002.
-
Achieve two new industry sponsored research agreements with researchers at the member institutions during the first year of operation.
| Milestones | |||||
| Milestone | Start Date | End Date | Budget | Manager | Department |
| Council Membership | 11/1/2001 | 5/1/2002 | $0 | ABC | Marketing |
| Newsletter | 12/1/2001 | 12/1/2001 | $1,000 | ABC | Marketing |
| First High-Tech Conference | 3/15/2002 | 3/17/2002 | $8,000 | ABC | Web |
| Second High-Tech Conference | 9/21/2002 | 9/23/2002 | $8,000 | ABC | Web |
| Two New Research Agreements | 11/1/2001 | 1/1/2001 | $0 | ABC | Department |
| Totals | $17,000 | ||||
Management Summary
ASTI’s director is John Doe. He is excited about the state’s vision of establishing a technology transfer consortium involving the state’s strongest corporate citizens. “These are ideas that many people have shared and promoted,” Doe said. “I’m hoping to work with units around the state to implement these and other ideas related to research agreements with industry.” Doe understands the need for State to strengthen connections with the private sector.
He joins ASTI from Pacific Northwest National Laboratory in MoneyCity, State, where he worked as technology transfer manager in the Environmental Technology Division. He has a Ph.D. in low-temperature geochemistry from The Johns Hopkins University in Baltimore, Md., and a post-doctoral fellow from Yale University.
He believes the technology transfer consortium is a natural mechanism to allow large and small enterprises to make use of the expertise at the member institutions and allow faculty to participate in entrepreneurial pursuits. “I will promote ideas such as an entrepreneurial sabbatical for faculty where they could pursue business start-ups and the universities will receive some benefit in return,” Doe said. “I’m excited about the opportunities and look forward to working with the Technology Development Council and promoting the critical research efforts occuring at the institutions that ASTI represents.”
6.1 Personnel Plan
ASTI’s director position is full-time. In addition, ASTI will also have three full-time employees; a research associate that will be responsible for research data collection, a communication associate who will be responsible for the program’s publications, and a full-time administrative assistant.
| Personnel Plan | |||
| Year 1 | Year 2 | Year 3 | |
| Director | $60,000 | $65,000 | $70,000 |
| Research Associate | $30,000 | $33,000 | $36,000 |
| Communication Associate | $30,000 | $33,000 | $36,000 |
| Administrative Assistant | $24,000 | $26,000 | $26,000 |
| Total People | 4 | 4 | 4 |
| Total Payroll | $144,000 | $157,000 | $168,000 |
Financial Plan
The following sections will outline important financial information.
7.1 Break-even Analysis
The following table shows what our break-even point will be to cover our montuhly costs.

| Break-even Analysis | |
| Monthly Revenue Break-even | $22,033 |
| Assumptions: | |
| Average Percent Variable Cost | 0% |
| Estimated Monthly Fixed Cost | $22,033 |
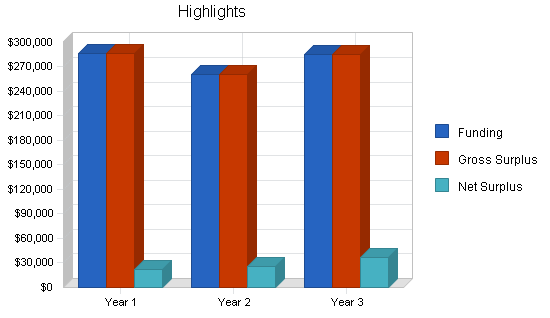
7.2 Projected Surplus or Deficit
The following table will indicate projected surplus and deficit.

| Surplus and Deficit | |||
| Year 1 | Year 2 | Year 3 | |
| Funding | $286,000 | $261,000 | $285,000 |
| Direct Cost | $0 | $0 | $0 |
| Other Production Expenses | $0 | $0 | $0 |
| Total Direct Cost | $0 | $0 | $0 |
| Gross Surplus | $286,000 | $261,000 | $285,000 |
| Gross Surplus % | 100.00% | 100.00% | 100.00% |
| Expenses | |||
| Payroll | $144,000 | $157,000 | $168,000 |
| Sales and Marketing and Other Expenses | $83,000 | $39,000 | $39,000 |
| Depreciation | $0 | $0 | $0 |
| Leased Equipment | $0 | $0 | $0 |
| Utilities | $2,000 | $2,000 | $2,000 |
| Insurance | $1,800 | $1,800 | $1,800 |
| Rent | $12,000 | $12,000 | $12,000 |
| Payroll Taxes | $21,600 | $23,550 | $25,200 |
| Other | $0 | $0 | $0 |
| Total Operating Expenses | $264,400 | $235,350 | $248,000 |
| Surplus Before Interest and Taxes | $21,600 | $25,650 | $37,000 |
| EBITDA | $21,600 | $25,650 | $37,000 |
| Interest Expense | $0 | $0 | $0 |
| Taxes Incurred | $0 | $0 | $0 |
| Net Surplus | $21,600 | $25,650 | $37,000 |
| Net Surplus/Funding | 7.55% | 9.83% | 12.98% |
7.3 Projected Cash Flow
The following table and chart illustrate the projected cash flow.

| Pro Forma Cash Flow | |||
| Year 1 | Year 2 | Year 3 | |
| Cash Received | |||
| Cash from Operations | |||
| Cash Funding | $286,000 | $261,000 | $285,000 |
| Subtotal Cash from Operations | $286,000 | $261,000 | $285,000 |
| Additional Cash Received | |||
| Sales Tax, VAT, HST/GST Received | $0 | $0 | $0 |
| New Current Borrowing | $0 | $0 | $0 |
| New Other Liabilities (interest-free) | $0 | $0 | $0 |
| New Long-term Liabilities | $0 | $0 | $0 |
| Sales of Other Current Assets | $0 | $0 | $0 |
| Sales of Long-term Assets | $0 | $0 | $0 |
| New Investment Received | $0 | $0 | $0 |
| Subtotal Cash Received | $286,000 | $261,000 | $285,000 |
| Expenditures | Year 1 | Year 2 | Year 3 |
| Expenditures from Operations | |||
| Cash Spending | $144,000 | $157,000 | $168,000 |
| Bill Payments | $110,701 | $81,609 | $79,864 |
| Subtotal Spent on Operations | $254,701 | $238,609 | $247,864 |
| Additional Cash Spent | |||
| Sales Tax, VAT, HST/GST Paid Out | $0 | $0 | $0 |
| Principal Repayment of Current Borrowing | $0 | $0 | $0 |
| Other Liabilities Principal Repayment | $0 | $0 | $0 |
| Long-term Liabilities Principal Repayment | $0 | $0 | $0 |
| Purchase Other Current Assets | $0 | $0 | $0 |
| Purchase Long-term Assets | $0 | $0 | $0 |
| Dividends | $0 | $0 | $0 |
| Subtotal Cash Spent | $254,701 | $238,609 | $247,864 |
| Net Cash Flow | $31,299 | $22,391 | $37,136 |
| Cash Balance | $185,499 | $207,890 | $245,025 |
7.4 Standard Ratios
The following table compares our standard ratios with the Standard Industry Code #8748, Other Management Consulting Services.
| Ratio Analysis | ||||
| Year 1 | Year 2 | Year 3 | Industry Profile | |
| Funding Growth | 0.00% | -8.74% | 9.20% | 7.29% |
| Percent of Total Assets | ||||
| Other Current Assets | 0.00% | 0.00% | 0.00% | 51.87% |
| Total Current Assets | 100.00% | 100.00% | 100.00% | 75.02% |
| Long-term Assets | 0.00% | 0.00% | 0.00% | 24.98% |
| Total Assets | 100.00% | 100.00% | 100.00% | 100.00% |
| Current Liabilities | 5.23% | 3.10% | 2.68% | 31.06% |
| Long-term Liabilities | 0.00% | 0.00% | 0.00% | 17.80% |
| Total Liabilities | 5.23% | 3.10% | 2.68% | 48.86% |
| Net Worth | 94.77% | 96.90% | 97.32% | 51.14% |
| Percent of Funding | ||||
| Funding | 100.00% | 100.00% | 100.00% | 100.00% |
| Gross Surplus | 100.00% | 100.00% | 100.00% | 100.00% |
| Selling, General & Administrative Expenses | 92.45% | 90.17% | 87.02% | 74.84% |
| Advertising Expenses | 10.49% | 11.49% | 10.53% | 1.60% |
| Surplus Before Interest and Taxes | 7.55% | 9.83% | 12.98% | 2.61% |
| Main Ratios | ||||
| Current | 19.13 | 32.28 | 37.26 | 1.80 |
| Quick | 19.13 | 32.28 | 37.26 | 1.49 |
| Total Debt to Total Assets | 5.23% | 3.10% | 2.68% | 58.30% |
| Pre-tax Return on Net Worth | 12.29% | 12.73% | 15.52% | 6.19% |
| Pre-tax Return on Assets | 11.64% | 12.34% | 15.10% | 14.83% |
| Additional Ratios | Year 1 | Year 2 | Year 3 | |
| Net Surplus Margin | 7.55% | 9.83% | 12.98% | n.a |
| Return on Equity | 12.29% | 12.73% | 15.52% | n.a |
| Activity Ratios | ||||
| Accounts Payable Turnover | 12.41 | 12.17 | 12.17 | n.a |
| Payment Days | 27 | 38 | 30 | n.a |
| Total Asset Turnover | 1.54 | 1.26 | 1.16 | n.a |
| Debt Ratios | ||||
| Debt to Net Worth | 0.06 | 0.03 | 0.03 | n.a |
| Current Liab. to Liab. | 1.00 | 1.00 | 1.00 | n.a |
| Liquidity Ratios | ||||
| Net Working Capital | $175,800 | $201,450 | $238,450 | n.a |
| Interest Coverage | 0.00 | 0.00 | 0.00 | n.a |
| Additional Ratios | ||||
| Assets to Funding | 0.65 | 0.80 | 0.86 | n.a |
| Current Debt/Total Assets | 5% | 3% | 3% | n.a |
| Acid Test | 19.13 | 32.28 | 37.26 | n.a |
| Funding/Net Worth | 1.63 | 1.30 | 1.20 | n.a |
| Dividend Payout | 0.00 | 0.00 | 0.00 | n.a |
Appendix
| Funding Forecast | |||||||||||||
| Month 1 | Month 2 | Month 3 | Month 4 | Month 5 | Month 6 | Month 7 | Month 8 | Month 9 | Month 10 | Month 11 | Month 12 | ||
| Funding | |||||||||||||
| University Funding | 0% | $160,000 | $0 | $0 | $0 | $0 | $0 | $0 | $0 | $0 | $0 | $0 | $0 |
| Full Memberships | 0% | $9,000 | $9,000 | $9,000 | $9,000 | $9,000 | $9,000 | $6,000 | $6,000 | $6,000 | $6,000 | $6,000 | $6,000 |
| Associate Memberships | 0% | $3,000 | $3,000 | $3,000 | $3,000 | $3,000 | $3,000 | $3,000 | $3,000 | $3,000 | $3,000 | $3,000 | $3,000 |
| Total Funding | $172,000 | $12,000 | $12,000 | $12,000 | $12,000 | $12,000 | $9,000 | $9,000 | $9,000 | $9,000 | $9,000 | $9,000 | |
| Direct Cost of Funding | Month 1 | Month 2 | Month 3 | Month 4 | Month 5 | Month 6 | Month 7 | Month 8 | Month 9 | Month 10 | Month 11 | Month 12 | |
| University Funding | $0 | $0 | $0 | $0 | $0 | $0 | $0 | $0 | $0 | $0 | $0 | $0 | |
| Full Memberships | $0 | $0 | $0 | $0 | $0 | $0 | $0 | $0 | $0 | $0 | $0 | $0 | |
| Associate Memberships | $0 | $0 | $0 | $0 | $0 | $0 | $0 | $0 | $0 | $0 | $0 | $0 | |
| Subtotal Cost of Funding | $0 | $0 | $0 | $0 | $0 | $0 | $0 | $0 | $0 | $0 | $0 | $0 | |
| Personnel Plan | |||||||||||||
| Month 1 | Month 2 | Month 3 | Month 4 | Month 5 | Month 6 | Month 7 | Month 8 | Month 9 | Month 10 | Month 11 | Month 12 | ||
| Director | 0% | $5,000 | $5,000 | $5,000 | $5,000 | $5,000 | $5,000 | $5,000 | $5,000 | $5,000 | $5,000 | $5,000 | $5,000 |
| Research Associate | 0% | $2,500 | $2,500 | $2,500 | $2,500 | $2,500 | $2,500 | $2,500 | $2,500 | $2,500 | $2,500 | $2,500 | $2,500 |
| Communication Associate | 0% | $2,500 | $2,500 | $2,500 | $2,500 | $2,500 | $2,500 | $2,500 | $2,500 | $2,500 | $2,500 | $2,500 | $2,500 |
| Administrative Assistant | 0% | $2,000 | $2,000 | $2,000 | $2,000 | $2,000 | $2,000 | $2,000 | $2,000 | $2,000 | $2,000 | $2,000 | $2,000 |
| Total People | 4 | 4 | 4 | 4 | 4 | 4 | 4 | 4 | 4 | 4 | 4 | 4 | |
| Total Payroll | $12,000 | $12,000 | $12,000 | $12,000 | $12,000 | $12,000 | $12,000 | $12,000 | $12,000 | $12,000 | $12,000 | $12,000 | |
| Surplus and Deficit | |||||||||||||
| Month 1 | Month 2 | Month 3 | Month 4 | Month 5 | Month 6 | Month 7 | Month 8 | Month 9 | Month 10 | Month 11 | Month 12 | ||
| Funding | $172,000 | $12,000 | $12,000 | $12,000 | $12,000 | $12,000 | $9,000 | $9,000 | $9,000 | $9,000 | $9,000 | $9,000 | |
| Direct Cost | $0 | $0 | $0 | $0 | $0 | $0 | $0 | $0 | $0 | $0 | $0 | $0 | |
| Other Production Expenses | $0 | $0 | $0 | $0 | $0 | $0 | $0 | $0 | $0 | $0 | $0 | $0 | |
| Total Direct Cost | $0 | $0 | $0 | $0 | $0 | $0 | $0 | $0 | $0 | $0 | $0 | $0 | |
| Gross Surplus | $172,000 | $12,000 | $12,000 | $12,000 | $12,000 | $12,000 | $9,000 | $9,000 | $9,000 | $9,000 | $9,000 | $9,000 | |
| Gross Surplus % | 100.00% | 100.00% | 100.00% | 100.00% | 100.00% | 100.00% | 100.00% | 100.00% | 100.00% | 100.00% | 100.00% | 100.00% | |
| Expenses | |||||||||||||
| Payroll | $12,000 | $12,000 | $12,000 | $12,000 | $12,000 | $12,000 | $12,000 | $12,000 | $12,000 | $12,000 | $12,000 | $12,000 | |
| Sales and Marketing and Other Expenses | $6,917 | $6,917 | $6,917 | $6,917 | $6,917 | $6,917 | $6,917 | $6,917 | $6,917 | $6,917 | $6,917 | $6,917 | |
| Depreciation | $0 | $0 | $0 | $0 | $0 | $0 | $0 | $0 | $0 | $0 | $0 | $0 | |
| Leased Equipment | $0 | $0 | $0 | $0 | $0 | $0 | $0 | $0 | $0 | $0 | $0 | $0 | |
| Utilities | $167 | $167 | $167 | $167 | $167 | $167 | $167 | $167 | $167 | $167 | $167 | $167 | |
| Insurance | $150 | $150 | $150 | $150 | $150 | $150 | $150 | $150 | $150 | $150 | $150 | $150 | |
| Rent | $1,000 | $1,000 | $1,000 | $1,000 | $1,000 | $1,000 | $1,000 | $1,000 | $1,000 | $1,000 | $1,000 | $1,000 | |
| Payroll Taxes | 15% | $1,800 | $1,800 | $1,800 | $1,800 | $1,800 | $1,800 | $1,800 | $1,800 | $1,800 | $1,800 | $1,800 | $1,800 |
| Other | $0 | $0 | $0 | $0 | $0 | $0 | $0 | $0 | $0 | $0 | $0 | $0 | |
| Total Operating Expenses | $22,033 | $22,033 | $22,033 | $22,033 | $22,033 | $22,033 | $22,033 | $22,033 | $22,033 | $22,033 | $22,033 | $22,033 | |
| Surplus Before Interest and Taxes | $149,967 | ($10,033) | ($10,033) | ($10,033) | ($10,033) | ($10,033) | ($13,033) | ($13,033) | ($13,033) | ($13,033) | ($13,033) | ($13,033) | |
| EBITDA | $149,967 | ($10,033) | ($10,033) | ($10,033) | ($10,033) | ($10,033) | ($13,033) | ($13,033) | ($13,033) | ($13,033) | ($13,033) | ($13,033) | |
| Interest Expense | $0 | $0 | $0 | $0 | $0 | $0 | $0 | $0 | $0 | $0 | $0 | $0 | |
| Taxes Incurred | $0 | $0 | $0 | $0 | $0 | $0 | $0 | $0 | $0 | $0 | $0 | $0 | |
| Net Surplus | $149,967 | ($10,033) | ($10,033) | ($10,033) | ($10,033) | ($10,033) | ($13,033) | ($13,033) | ($13,033) | ($13,033) | ($13,033) | ($13,033) | |
| Net Surplus/Funding | 87.19% | -83.61% | -83.61% | -83.61% | -83.61% | -83.61% | -144.81% | -144.81% | -144.81% | -144.81% | -144.81% | -144.81% | |
| Pro Forma Cash Flow | |||||||||||||
| Month 1 | Month 2 | Month 3 | Month 4 | Month 5 | Month 6 | Month 7 | Month 8 | Month 9 | Month 10 | Month 11 | Month 12 | ||
| Cash Received | |||||||||||||
| Cash from Operations | |||||||||||||
| Cash Funding | $172,000 | $12,000 | $12,000 | $12,000 | $12,000 | $12,000 | $9,000 | $9,000 | $9,000 | $9,000 | $9,000 | $9,000 | |
| Subtotal Cash from Operations | $172,000 | $12,000 | $12,000 | $12,000 | $12,000 | $12,000 | $9,000 | $9,000 | $9,000 | $9,000 | $9,000 | $9,000 | |
| Additional Cash Received | |||||||||||||
| Sales Tax, VAT, HST/GST Received | 0.00% | $0 | $0 | $0 | $0 | $0 | $0 | $0 | $0 | $0 | $0 | $0 | $0 |
| New Current Borrowing | $0 | $0 | $0 | $0 | $0 | $0 | $0 | $0 | $0 | $0 | $0 | $0 | |
| New Other Liabilities (interest-free) | $0 | $0 | $0 | $0 | $0 | $0 | $0 | $0 | $0 | $0 | $0 | $0 | |
| New Long-term Liabilities | $0 | $0 | $0 | $0 | $0 | $0 | $0 | $0 | $0 | $0 | $0 | $0 | |
| Sales of Other Current Assets | $0 | $0 | $0 | $0 | $0 | $0 | $0 | $0 | $0 | $0 | $0 | $0 | |
| Sales of Long-term Assets | $0 | $0 | $0 | $0 | $0 | $0 | $0 | $0 | $0 | $0 | $0 | $0 | |
| New Investment Received | $0 | $0 | $0 | $0 | $0 | $0 | $0 | $0 | $0 | $0 | $0 | $0 | |
| Subtotal Cash Received | $172,000 | $12,000 | $12,000 | $12,000 | $12,000 | $12,000 | $9,000 | $9,000 | $9,000 | $9,000 | $9,000 | $9,000 | |
| Expenditures | Month 1 | Month 2 | Month 3 | Month 4 | Month 5 | Month 6 | Month 7 | Month 8 | Month 9 | Month 10 | Month 11 | Month 12 | |
| Expenditures from Operations | |||||||||||||
| Cash Spending | $12,000 | $12,000 | $12,000 | $12,000 | $12,000 | $12,000 | $12,000 | $12,000 | $12,000 | $12,000 | $12,000 | $12,000 | |
| Bill Payments | $334 | $10,033 | $10,033 | $10,033 | $10,033 | $10,033 | $10,033 | $10,033 | $10,033 | $10,033 | $10,033 | $10,033 | |
| Subtotal Spent on Operations | $12,334 | $22,033 | $22,033 | $22,033 | $22,033 | $22,033 | $22,033 | $22,033 | $22,033 | $22,033 | $22,033 | $22,033 | |
| Additional Cash Spent | |||||||||||||
| Sales Tax, VAT, HST/GST Paid Out | $0 | $0 | $0 | $0 | $0 | $0 | $0 | $0 | $0 | $0 | $0 | $0 | |
| Principal Repayment of Current Borrowing | $0 | $0 | $0 | $0 | $0 | $0 | $0 | $0 | $0 | $0 | $0 | $0 | |
| Other Liabilities Principal Repayment | $0 | $0 | $0 | $0 | $0 | $0 | $0 | $0 | $0 | $0 | $0 | $0 | |
| Long-term Liabilities Principal Repayment | $0 | $0 | $0 | $0 | $0 | $0 | $0 | $0 | $0 | $0 | $0 | $0 | |
| Purchase Other Current Assets | $0 | $0 | $0 | $0 | $0 | $0 | $0 | $0 | $0 | $0 | $0 | $0 | |
| Purchase Long-term Assets | $0 | $0 | $0 | $0 | $0 | $0 | $0 | $0 | $0 | $0 | $0 | $0 | |
| Dividends | $0 | $0 | $0 | $0 | $0 | $0 | $0 | $0 | $0 | $0 | $0 | $0 | |
| Subtotal Cash Spent | $12,334 | $22,033 | $22,033 | $22,033 | $22,033 | $22,033 | $22,033 | $22,033 | $22,033 | $22,033 | $22,033 | $22,033 | |
| Net Cash Flow | $159,666 | ($10,033) | ($10,033) | ($10,033) | ($10,033) | ($10,033) | ($13,033) | ($13,033) | ($13,033) | ($13,033) | ($13,033) | ($13,033) | |
| Cash Balance | $313,866 | $303,832 | $293,799 | $283,766 | $273,732 | $263,699 | $250,666 | $237,632 | $224,599 | $211,566 | $198,532 | $185,499 | |
| Pro Forma Balance Sheet | |||||||||||||
| Month 1 | Month 2 | Month 3 | Month 4 | Month 5 | Month 6 | Month 7 | Month 8 | Month 9 | Month 10 | Month 11 | Month 12 | ||
| Assets | Starting Balances | ||||||||||||
| Current Assets | |||||||||||||
| Cash | $154,200 | $313,866 | $303,832 | $293,799 | $283,766 | $273,732 | $263,699 | $250,666 | $237,632 | $224,599 | $211,566 | $198,532 | $185,499 |
| Other Current Assets | $0 | $0 | $0 | $0 | $0 | $0 | $0 | $0 | $0 | $0 | $0 | $0 | $0 |
| Total Current Assets | $154,200 | $313,866 | $303,832 | $293,799 | $283,766 | $273,732 | $263,699 | $250,666 | $237,632 | $224,599 | $211,566 | $198,532 | $185,499 |
| Long-term Assets | |||||||||||||
| Long-term Assets | $0 | $0 | $0 | $0 | $0 | $0 | $0 | $0 | $0 | $0 | $0 | $0 | $0 |
| Accumulated Depreciation | $0 | $0 | $0 | $0 | $0 | $0 | $0 | $0 | $0 | $0 | $0 | $0 | $0 |
| Total Long-term Assets | $0 | $0 | $0 | $0 | $0 | $0 | $0 | $0 | $0 | $0 | $0 | $0 | $0 |
| Total Assets | $154,200 | $313,866 | $303,832 | $293,799 | $283,766 | $273,732 | $263,699 | $250,666 | $237,632 | $224,599 | $211,566 | $198,532 | $185,499 |
| Liabilities and Capital | Month 1 | Month 2 | Month 3 | Month 4 | Month 5 | Month 6 | Month 7 | Month 8 | Month 9 | Month 10 | Month 11 | Month 12 | |
| Current Liabilities | |||||||||||||
| Accounts Payable | $0 | $9,699 | $9,699 | $9,699 | $9,699 | $9,699 | $9,699 | $9,699 | $9,699 | $9,699 | $9,699 | $9,699 | $9,699 |
| Current Borrowing | $0 | $0 | $0 | $0 | $0 | $0 | $0 | $0 | $0 | $0 | $0 | $0 | $0 |
| Other Current Liabilities | $0 | $0 | $0 | $0 | $0 | $0 | $0 | $0 | $0 | $0 | $0 | $0 | $0 |
| Subtotal Current Liabilities | $0 | $9,699 | $9,699 | $9,699 | $9,699 | $9,699 | $9,699 | $9,699 | $9,699 | $9,699 | $9,699 | $9,699 | $9,699 |
| Long-term Liabilities | $0 | $0 | $0 | $0 | $0 | $0 | $0 | $0 | $0 | $0 | $0 | $0 | $0 |
| Total Liabilities | $0 | $9,699 | $9,699 | $9,699 | $9,699 | $9,699 | $9,699 | $9,699 | $9,699 | $9,699 | $9,699 | $9,699 | $9,699 |
| Paid-in Capital | $160,000 | $160,000 | $160,000 | $160,000 | $160,000 | $160,000 | $160,000 | $160,000 | $160,000 | $160,000 | $160,000 | $160,000 | $160,000 |
| Accumulated Surplus/Deficit | ($5,800) | ($5,800) | ($5,800) | ($5,800) | ($5,800) | ($5,800) | ($5,800) | ($5,800) | ($5,800) | ($5,800) | ($5,800) | ($5,800) | ($5,800) |
| Surplus/Deficit | $0 | $149,967 | $139,933 | $129,900 | $119,867 | $109,833 | $99,800 | $86,767 | $73,733 | $60,700 | $47,667 | $34,633 | $21,600 |
| Total Capital | $154,200 | $304,167 | $294,133 | $284,100 | $274,067 | $264,033 | $254,000 | $240,967 | $227,933 | $214,900 | $201,867 | $188,833 | $175,800 |
| Total Liabilities and Capital | $154,200 | $313,866 | $303,832 | $293,799 | $283,766 | $273,732 | $263,699 | $250,666 | $237,632 | $224,599 | $211,566 | $198,532 | $185,499 |
| Net Worth | $154,200 | $304,167 | $294,133 | $284,100 | $274,067 | $264,033 | $254,000 | $240,967 | $227,933 | $214,900 | $201,867 | $188,833 | $175,800 |


