
Greek Golf Training Center
Executive Summary
Greek Golf Training Centers will be a full-service sport complex situated in Athens. There are currently no other golf facilities like this one anywhere in or around Athens. This plan will be used to define the scope of our services, as well as a means of gaining the necessary investments to open the facility. It will also be used on a continual basis in the evaluation of Greek Golf Training Centers mission, goals, and objectives.
The key to success for Greek Golf Training Centers is the ability to market effectively, creating an unmatched “cool” atmosphere where people enjoy themselves, and hiring qualified and knowledgeable staff to aid in the running of our programs and leagues.
The Golf industry is a booming business that will dramatically be expanded in Greece within the next years. Greek Golf Training Centers is conservatively projecting a modest net profit in its first year of operation with this increasing steadily by the end of the third year.

1.1 Objectives
The main objectives for the Greek Golf Training Centers are:
- Sell 200 memberships in year one, 300 in year two and 400 by the end of year three.
- Organize and develop various teams, depending on level, business type, available time, etc., so as to fill them to capacity.
- Sponsor and/or support one event in year one, two in year two, four in year three.
- Show a net profit margin in the first year of operation.
1.2 Mission
The Greek Golf Training Centers is a single sport and fitness complex designed to be used by the residents of Athens and the surrounding areas.
It is our mission to provide the best programs, staff, and equipment to fully meet the various sport and fitness needs of our members, while generating a profit for the owners and investors.
Besides providing an excellent value to our customers, the Greek Golf Training Centers is determined to create an unmatched sporting atmosphere that will add to the enjoyment of every member and employee of the facility.
Dedicated to the community, the Greek Golf Training Centers strives to support and sponsor community events, as well as host them whenever possible. Our hope is that through the use of our facility, members’ enjoyment and appreciation for golf, fitness, and for life will be enhanced.
1.3 Keys to Success
- Marketing: We must make the Greek Golf Training Centers a distinguished name in Athens and creatively market our services to each of our market segments.
- Atmosphere of facility: By creating an unmatched “cool” atmosphere in the Greek Golf Training Centers through the use of first class equipment and targeting facilities, elegant and comfortable lobby, showers and changing rooms, floors, colors and decoration, people will want to frequent our facility often and recommend it to their colleagues and friends. Furthermore, our ability to retain members will be enhanced.
- Knowledgeable/qualified staff and management: By providing the users of the facility with knowledgeable and qualified staff who show genuine concern for the patrons, people will feel comfortable and confident that the Greek Golf Training Centers can meet all of their golf and fitness needs.
Company Summary
The Greek Golf Training Centers is a golf complex that will provide both members and casual users an opportunity to participate in a continuous golf training by getting expert help, without time limitations.
2.1 Company Ownership
The Greek Golf Training Centers will be a Limited Liability Corporation financed partially by direct owner investment and a long-term loan.
Dimitrios Vastarouchas and Helen Brasinika will own 25% of the company each.
The other two limited partners will own 40% and 10% respectively.
2.2 Start-up Summary
Our start-up costs are mostly equipment purchase, main building (which will be a wooden pre-fabricated building of good quality), training center construction, golf equipment for the retail store, stationery, legal costs, advertising, land rent and expenses associated with opening our first office. The start-up costs are to be financed by direct owner investment. The assumptions are shown in the following chart and table.

| Start-up Funding | |
| Start-up Expenses to Fund | $261,000 |
| Start-up Assets to Fund | $79,000 |
| Total Funding Required | $340,000 |
| Assets | |
| Non-cash Assets from Start-up | $65,000 |
| Cash Requirements from Start-up | $14,000 |
| Additional Cash Raised | $0 |
| Cash Balance on Starting Date | $14,000 |
| Total Assets | $79,000 |
| Liabilities and Capital | |
| Liabilities | |
| Current Borrowing | $0 |
| Long-term Liabilities | $140,000 |
| Accounts Payable (Outstanding Bills) | $0 |
| Other Current Liabilities (interest-free) | $0 |
| Total Liabilities | $140,000 |
| Capital | |
| Planned Investment | |
| Investor 1 | $160,000 |
| Investor 2 | $40,000 |
| Other | $0 |
| Additional Investment Requirement | $0 |
| Total Planned Investment | $200,000 |
| Loss at Start-up (Start-up Expenses) | ($261,000) |
| Total Capital | ($61,000) |
| Total Capital and Liabilities | $79,000 |
| Total Funding | $340,000 |
| Start-up | |
| Requirements | |
| Start-up Expenses | |
| Legal | $6,000 |
| Training center construction (pillars, nets etc) | $50,000 |
| Garden & parking | $5,000 |
| Training center equipment | $40,000 |
| Furniture | $30,000 |
| Licenses | $10,000 |
| Land purchase | $0 |
| Administration hardware, software & web | $20,000 |
| Golf equipment for selling | $40,000 |
| Advertising | $30,000 |
| Interior designer | $20,000 |
| Insurance | $10,000 |
| Total Start-up Expenses | $261,000 |
| Start-up Assets | |
| Cash Required | $14,000 |
| Other Current Assets | $0 |
| Long-term Assets | $65,000 |
| Total Assets | $79,000 |
| Total Requirements | $340,000 |
Products and Services
The Greek Golf Training Centers will be a golf complex that provides its users with the following services:
- Golf practice using unlimited number of balls and the best types of feeder. Simulation of various conditions that can be met in a golf course shall be done using sloped mats, tees, sand, targets for pitching and putting training aids.
- Training by professionals.
- Golf equipment shop.
- Lobby for relaxation and discussion with colleagues where brandy, cigars and refreshments will be available.
- Participation in events and activities.
Golf Training Facilities
The Greek Golf Training Centers will house a large training area (50 m x 100 m) at which, members could have continuous practice without interruptions.
The advantages shall be the semi-automatic feeding, the possibility to aim to different targets under various conditions, the independency of weather conditions (which is the basic current problem in open golf courses), the absence of time limitation (businessmen can not enjoy golf now since the open golf course training facilities in Athens close at 16:00), and the use of first class equipment.
Professional Training
Greek Golf Training Centers will offer professional training (private or group programs), performance analysis once a month for members (using pc, digital video etc), fitness programs, putting aids, and a library with necessary material such as video tapes, books and magazines.
Golf Equipment Shop
A golf equipment shop will be strategically placed in Greek Golf Training Centers to attract potential buyers. The shop will sell first class equipment and training aids.
Lobby and Other Facilities
Other features and services Greek Golf Training Centers will have include:
- Full service locker rooms for both men and women that will accommodate up to 40 lockers. Large shower areas, benches, sinks, and bathroom facilities will all be included as well.
- An administrative area housing various offices and waiting room will be located at the entrance. Card system will be used for members.
- A luxury lobby will be located on the main floor of the facility. Members will have the chance to enjoy brandy, english tea, fresh juices and smoke a cigar in a peaceful place, decorated in the english traditional style. A library will be located in lobby for members to use.
- Generally, the pre-fabricated complex shall be made of high-quality of wood.
Sponsorship
The nets which surround the training area can be used for advertisement and promotion of potential sponsors.
Events and Activities
A series of activities will be scheduled for the members. Through internal competitions awards shall be earned and teams formed to enjoy golf in Athens golf course. Also, in the future a golf team could be established.

Additionally, special events will be organized for children and schools in order to promote golf in younger generations.
Market Analysis Summary
The Greek Golf Training Centers will be the only golf complex of its kind in all Athens and surroundings (more than four million people). Some aspects of the facility will cater mainly to Athens golf course members but, generally will appeal to everyone in the area.
Because of the flexibility of time schedule, the independency of weather conditions, and in combination with the comfortable auto feeding system, our market segments vary from dedicated golfers to people who want to learn golf, have some stress relief leisure activities and socialize with other members.
In addition, Greek Golf Training Centers shall develop good relations with well known golf training schools worldwide in order to bring golf to youth, advise and urge them to continue for a professional career.
It should be emphasized that at the moment, people in Athens can enjoy golf only in Athens (Glyfada) Golf Course. There are 700 members, however the age average is higher than 55 years old. Moreover, the unique training facility in Athens is in very bad condition since there are not ball feeders, it is weather dependant, and most of all closes at 16:00. Consequently, businessmen, employees, doctors, lawyers, etc. do not have the chance to familiarize with golf.
4.1 Market Segmentation
Golfers
A market segment for Greek Golf Training Centers will be the existing golfers (700 members of Athens Golf Club). These people love golf and continuously try to improve their performance.
There are some highly skilled persons, while others are above 90′ (their score), however as it has been mentioned above most of them are older than 50 years. Provided that they can practice at any time and weather conditions, a part of them will join Greek Golf Training Centers. Nevertheless, due to their age average they are expected to have more leisure time which does not prevent them to use the existing facilities of Glyfada Golf Course.
Scientists
An important market segment for Greek Golf Training Centers will be the scientists. This market segment include employees such as doctors, lawyers, managers in private companies and public organizations, economists, etc. These people will be a target market for special promotions and periodic activities.
Businessmen
Another market segment for our facility will be those who shall combine business with entertainment. They will have a stress relief where they can enjoy a brandy and discuss in a comfortable place with their guests and/or colleagues.
Employees
This is a smaller, but important market segment for our facility. Although fees will be high for private employees, there will be some of them who will join our Center. Except the chance to learn golf, develop public relations, join teams to play golf in a course or arrange golf vacations.
University students
Another small market segment for Greek Golf Training Centers will be the students who are attracted due to golf’s uniqueness, its fitness programs and continuous exercise, competitions and other events.
Youth
This market segment will be our middle term growing market and maybe the most important in a few years.
In combination with golf promotion in Greece, co-operation with foreign well known golf schools and the proper attitude that will be developed, young people will form teams and take part in competitions, continue golf studies abroad and become professionals (at least a few of them). These people will be the Center’s flag and support it accordingly.
Housewives
Another small market segment is with the housewives. Golf is unknown to them, however, since they have plenty of time we estimate that a small number will be attracted. They can have some stress relief especially in the morning time.
Others
Tourists, foreigners who work in Greece, guests and etc. will join us, however, they do not like to be locked into long-term commitments but like the freedom to come and go when the opportunity presents itself. Moreover, we expect that segment to reach a peak value during the Olympic Games (Athens 2004).
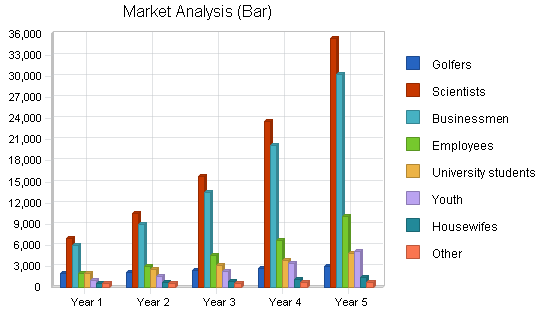
| Market Analysis | |||||||
| Year 1 | Year 2 | Year 3 | Year 4 | Year 5 | |||
| Potential Customers | Growth | CAGR | |||||
| Golfers | 10% | 2,000 | 2,200 | 2,420 | 2,662 | 2,928 | 10.00% |
| Scientists | 50% | 7,000 | 10,500 | 15,750 | 23,625 | 35,438 | 50.00% |
| Businessmen | 50% | 6,000 | 9,000 | 13,500 | 20,250 | 30,375 | 50.00% |
| Employees | 50% | 2,000 | 3,000 | 4,500 | 6,750 | 10,125 | 50.00% |
| University students | 25% | 2,000 | 2,500 | 3,125 | 3,906 | 4,883 | 25.00% |
| Youth | 50% | 1,000 | 1,500 | 2,250 | 3,375 | 5,063 | 50.00% |
| Housewifes | 30% | 500 | 650 | 845 | 1,099 | 1,429 | 30.02% |
| Other | 10% | 500 | 550 | 605 | 666 | 733 | 10.04% |
| Total | 44.27% | 21,000 | 29,900 | 42,995 | 62,333 | 90,974 | 44.27% |
4.2 Service Business Analysis
The golf business is a booming industry in Greece. At the moment there are a total of three golf courses, the Athens (Glyfada) Golf Club, Rhodes Island Golf Club, and Corfu Golf Club.
Another golf course in North Greece has already closed because grass was too dry and a small course operates in a hotel of Crete island. However, in last year many dramatic changes have taken place. Specifically, Fuji Bank started negotiations with Rhodes Island Club for further investments, the Crete’s Hotels Association has started a superior golf course’s construction in Crete and they plan to build more, and repairs have been started in the North Greece Golf Club.
In addition, the construction plans for the new golf course in Markopoulo have already been approved. Furthermore, a well-known entrepreneur in Greece has planned three golf courses in Peloponnisos area and the construction start day is expected soon. Generally, golf expansion in Greece will be very rapid within next years. It should be noted that Greece is one of the remaining (few) European countries at which golf has not been promoted yet. It should be also mentioned that sales of golf equipment in Greece are very low at the moment.
4.2.1 Competition and Buying Patterns
The competition of Greek Golf Training Centers in Athens and the surrounding areas includes Athens (Glyfada) Golf Club only. The others are located very far from the Greek capital. As it is mentioned above, the training facilities of Athens Golf Club are in a very bad condition. There are no automatic ball feeders for training, mats with slope, areas with sand, sloped areas, etc. Moreover, the training place is exposed to weather conditions. There are not targets for training.
In addition no one can practice after 16:00. Another point is that there is not lighting arrangement for night training. However, there are 700 members that enjoy golf games and they have long term memberships.
Potential members will usually compare the training facilities and find one that fits their specific needs, or has the amenities that he/she wants. Value is usually very important to these potential members as most people want to get the best value for their euro.
In terms of fees and total cost it should be noted that a member needs around 300 balls for practice. At present she or he has to pay 3 euro for 40 balls at Glyfada Golf Club therefore a total of 22.5 euro per practice day. If we assume 10 days per month then a cost of 225 euro results. In addition the member has to pay 1,300 euro per year (annual membership) and consequently 110 euro per month. Therefore, total cost will be 335 euro. In our case the monthly cost is 110 euro.
Another factor that will affect Greek Golf Training Center’s financial figures will be the opening of a franchise in competition. However, the capacity of the Greek Golf Training Center is limited to 500 members and can be retained even with the surrounding areas only. Therefore, that will not be a problem for the future. Furthermore, new programs, events and etc. will be developed on a continuous basis.
4.3 Target Market Segment Strategy
Due to the size, appearance and convenient location of our facility, many people will be attracted to Greek Golf Training Centers to see what we have to offer. However, we will not be content to just wait for customers to come to us. Instead, we will focus our marketing strategies on those market segments who match our offerings. The great thing about marketing Greek Golf Training Centers, is that each market segment relates, in certain ways, to all the others.
Our main objective with our early marketing strategy will be to get people into our facility and convince people that we can bring golf to Greece. Once people see what we have to offer, and feel the atmosphere that will be created, they will want to return and participate in the many activities and programs that will be available to them.
Some of the ways Greek Golf Training Centers will get people into the facility include:
- Offering tours to junior and senior high schools during the building and early completion of the facility.
- Having a large promotional event to open the facility that will be free to everyone.
- Hosting and/or supporting various community events that will attract many people who otherwise would not come.
- Mailing our free day passes to managers of shipping companies (they have relations with Asians who adore golf), businessmen, managers of big companies, etc.
- Provide special discounts for annual subscriptions.
- Free testing of golf equipment.
Following the opening of Greek Golf Training Centers, print and radio media will be used to promote both the facility and the equipment.
Strategy and Implementation Summary
Greek Golf Training Centers has a very large potential market. Because of the uniqueness of these facilities throughout Greece, we feel we will become the main golf representative quickly. This will be accomplished by actively and continuously promoting Greek Golf Training Centers through media as well as hosting and supporting various community events.
5.1 Competitive Edge
Greek Golf Training Centers’ competitive edge is three fold. First, Greek Golf Training Centers is the only golf complex that offers such kind of training facilities that will be available for the members. The second part of our competitive edge is the location, size, and appearance of the facility that will attract many people into the complex. Finally, the third part is our golf shop where the members can find first class equipment in the best prices in Greece and have the possibility to test them in actual conditions.
By maintaining our focus in our strategy, marketing, program development, and fulfillment, Greek Golf Training Centers will be known as the top golf training center in Athens. We should be aware however, that our competitive edge may be diluted if we become complacent in our program development and implementation. It will be important for Greek Golf Training Centers to keep up with the current trends in golf programs.
5.2 Marketing Strategy
The marketing strategy is the core of the main strategy:
- Emphasize service and support.
- Build a relationship business.
- Focus on golf equipment as the key target market.
5.3 Sales Strategy
Sales (membership and equipment) are based on the services and amenities provided by the facility. The “something for everyone” slogan fits perfectly with Greek Golf Training Centers. All of the users of our facility must feel they are getting the best possible value for their money. If there is a better value, for equal services, Greek Golf Training Centers will match or beat that value for customers.
Each person desiring a membership at Greek Golf Training Centers will be able to sit down with a representative and be notified of all their membership options. During this brief discussion, the person will be also informed of all of the services, programs and amenities Greek Golf Training Centers has to offer. It will be important to establish a relationship of trust with our members as membership preservation is an important aspect in our business.
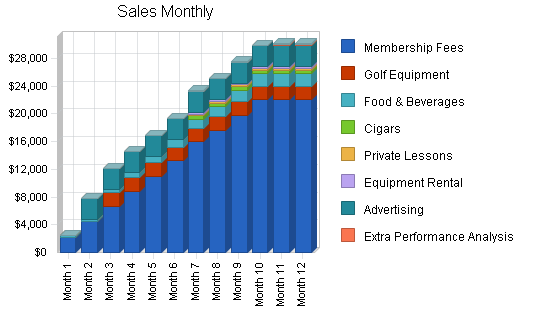
5.3.1 Sales Forecast
The basic assumption is that at the end of first year 200 members shall be registered. An enviable growth rate is expected for several years, up to 500 members. That will be the maximum number of members that can be accommodated by this center. Further expansion of the grounds shall be consider in future.
The first year members’ registration is considered incremental and of course at first months and summer period is expected to be low. It is also assumed that by next year the growth rate will be steady although the numbers are very pessimistic for safety reasons.
All sales items are related and proportional to memberships except the advertising. However, even this will increase if the popularity of the center does so.
Furthermore sales of equipment is also very pessimistic because golf is not very popular yet in Greece. However, one of the biggest courses in Europe will be ready in Crete island next year.
Generally, the center has been planned to accommodate 500 members, the maximum possible, which is a very realistic target since it will be the pioneer in a virgin market which is ready to make significant steps in future. It should be reminded that the economy of Greece shall be based on tourism after the olympic games of 2004 and the completion of the 3rd European Financing Framework since the heavy industry can not be significant in Greece. It is sure that will be promoted during the olympic games and that 500 members is negligible portion of 4,500,000 living in Athens.
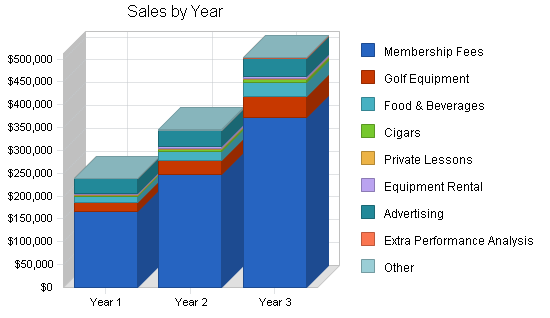
| Sales Forecast | |||
| Year 1 | Year 2 | Year 3 | |
| Sales | |||
| Membership Fees | $165,550 | $248,325 | $372,488 |
| Golf Equipment | $20,000 | $30,000 | $45,000 |
| Food & Beverages | $13,500 | $20,250 | $30,375 |
| Cigars | $3,000 | $4,500 | $6,750 |
| Private Lessons | $1,500 | $2,250 | $3,375 |
| Equipment Rental | $1,500 | $2,250 | $3,375 |
| Advertising | $33,000 | $36,300 | $39,930 |
| Extra Performance Analysis | $500 | $750 | $1,125 |
| Other | $600 | $900 | $1,350 |
| Total Sales | $239,150 | $345,525 | $503,768 |
| Direct Cost of Sales | Year 1 | Year 2 | Year 3 |
| Membership Fees | $8,275 | $12,420 | $18,625 |
| Golf Equipment | $15,000 | $22,500 | $33,750 |
| Food & Beverages | $2,700 | $4,050 | $6,075 |
| Cigars | $750 | $1,125 | $1,690 |
| Private Lessons | $1,140 | $1,800 | $2,700 |
| Equipment Rental | $0 | $0 | $0 |
| Advertising | $0 | $0 | $0 |
| Extra Performance Analysis | $0 | $0 | $0 |
| Other | $300 | $450 | $600 |
| Subtotal Direct Cost of Sales | $28,165 | $42,345 | $63,440 |
5.4 Milestones
The accompanying table lists important program milestones, with dates and managers in charge, and budgets for each. The milestone schedule indicates our emphasis on planning for implementation. The most important programs are the sales and marketing programs listed in detail in the previous topics.
What the table doesn’t show is the commitment behind it. Our business plan includes complete provisions for planned vs. actual analysis, and we will hold monthly follow-up meetings to discuss the variance and course corrections.
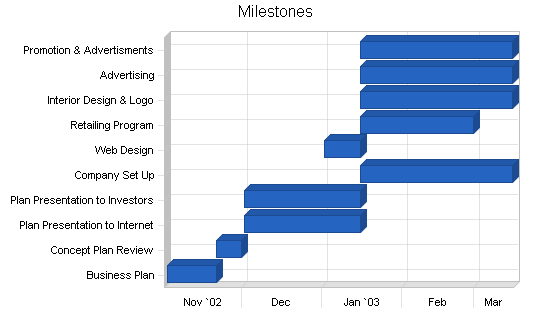
| Milestones | |||||
| Milestone | Start Date | End Date | Budget | Manager | Department |
| Business Plan | 11/1/2002 | 11/20/2002 | $0 | DV | Marketing |
| Concept Plan Review | 11/20/2002 | 11/30/2002 | $0 | HB | Marketing |
| Plan Presentation to Internet | 12/1/2002 | 1/15/2003 | $75 | DV | Web |
| Plan Presentation to Investors | 12/1/2002 | 1/15/2003 | $0 | DV | Finance |
| Company Set Up | 1/15/2003 | 3/15/2003 | $0 | HB | Accounting |
| Web Design | 1/1/2003 | 1/15/2003 | $0 | HB | Web |
| Retailing Program | 1/15/2003 | 2/28/2003 | $0 | DV | Sales |
| Interior Design & Logo | 1/15/2003 | 3/15/2003 | $20,000 | HB | Marketing |
| Advertising | 1/15/2003 | 3/15/2003 | $0 | HB | Marketing |
| Promotion & Advertisments | 1/15/2003 | 3/15/2003 | $30,000 | HB | Marketing |
| Totals | $50,075 | ||||
Web Plan Summary
The Greek Golf Training Centers’ website will be the virtual business card and portfolio for the company, as well as its online “home.”
It will showcase the Internet background of Greek Golf Training Centers products and services, as well as the portfolio of all the current activities.
The Greek Golf Training Centers’ website needs to be a simple, yet classy and well designed website that, at the same time, is in keeping with the latest trends in user interface design. A site that is too flashy, or tries to use too much of the latest Shockwave or Flash technology can be over done, and cause potential clients’ dissatisfaction. A golfers forum can also be accommodated in future.
The key to the website strategy will be combining a very well designed front end, with a back end capable of recording leads and proposal requests.
6.1 Website Marketing Strategy
More and more people have the desire to learn golf, but have less and less time for practice. In addition there is not any widely available information about golf needs. As an innovative training center we will have to address this problem. Formerly we used computers just to write reports and notes. Now we use as much of the Internet’s power and features as we can in order to promote golf efficiently in Greece and get people involved.
Our website network has four main strategies:
- A resource site devoted to brochures, activities, reviews and useful tips.
- A sales/rental site where customers can plan and book golf equipment or related training aids.
- A golfers forum that can be our future golf team supporting tool.
- Further information about golf studies at a professional level.
6.2 Development Requirements
The Greek Golf Training Centers website will be initially developed with few technical resources. A simple hosting provider, Hellas On-Line services, will host the site and provide the technical back end.
Greek Golf Training Centers will work with a contracted user interface designer to develop the simple, classy, Internet site. The user interface designer will work with a graphic artist to come up with the website logo, and the website graphics.
The maintenance of the site will be done by the Greek Golf Training Centers’ staff themselves. Greek Golf Training Centers can also look into pre-packaged solutions through Hellas On-Line hosting or equivalent.
Management Summary
The initial management team for Greek Golf Training Centers depends mainly on the general partners. Dimitrios Vastarouchas and Helen Brasinika will stay within their expertise in running the day to day operations of the facility such as scheduling, marketing, sales, and promotions, along with running and developing various programs and events. Back-up for the general partners will include staff members who will compensate for the founders lack of experience in each area. For example, qualified personnel will be hired for beverage, administration and equipment service. General help staff will be hired on a need basis as the users of the facility increase. There will also be a janitor hired for basic cleanliness and maintenance of the complex.
Greek Golf Training Centers will have a total of seven people in the first year of operation. It is projected that an additional two will be added each year for the next two years. The majority of the salaries are projected to raise a little each year for the first three years. This estimate may be conservative.
7.1 Personnel Plan
The Personnel Plan reflects the need to bolster our capabilities to match our positioning. Our total employment should increase up to seven the first year, and to 11 by the third year. Detailed monthly projections are included in the appendix.
| Personnel Plan | |||
| Year 1 | Year 2 | Year 3 | |
| Managing Director & consultant | $48,000 | $55,000 | $60,000 |
| Administration 1 – Part time | $11,200 | $11,760 | $12,348 |
| Administration 2 – Part time | $11,200 | $11,760 | $12,348 |
| Administration 3 – Part time | $0 | $0 | $11,907 |
| Janitor | $12,600 | $13,230 | $13,892 |
| Janitor assistant | $0 | $0 | $10,584 |
| Cleaning Person 1 – Part time | $11,200 | $11,760 | $12,348 |
| Cleaning Person 2 – Part time | $11,200 | $11,760 | $12,348 |
| Professional instructor | $0 | $0 | $0 |
| Accountant | $3,600 | $3,780 | $3,970 |
| Guard 1 | $0 | $19,300 | $22,243 |
| Guard 2 | $0 | $19,300 | $22,243 |
| Other | $0 | $0 | $0 |
| Total People | 7 | 9 | 11 |
| Total Payroll | $109,000 | $157,650 | $194,231 |
Financial Plan
We are assuming start-up will be financed by the investors and continued financing will come through long-term loan (interest rate around 7%).
8.1 Important Assumptions
The financial plan depends on important assumptions. The monthly assumptions are included in the appendix. Interest rates, tax rates, and personnel burden are based on conservative assumptions.
Some of the important underlying assumptions are:
- We assume a slow growth economy, without major recession.
- We assume the rate of growth for the number of golf memberships will continue.
| General Assumptions | |||
| Year 1 | Year 2 | Year 3 | |
| Plan Month | 1 | 2 | 3 |
| Current Interest Rate | 12.00% | 12.00% | 12.00% |
| Long-term Interest Rate | 7.00% | 7.00% | 7.00% |
| Tax Rate | 34.58% | 35.00% | 34.58% |
| Personnel Burden | 0 | 0 | 0 |
| Other | 0 | 0 | 0 |
8.2 Break-even Analysis
For our Break-even Analysis, we assume monthly running costs which include our full payroll, rent, and utilities, and an estimation of other running costs.
Margins are harder to assume.
The table shows what we need to sell per month to break-even, according to these assumptions. This is about two-thirds of our planned sales level, so we believe we can maintain it.
It should be emphasized that revenue from equipment selling, beverage, sponsorship and equipment rental is not taken into account in order to cover the worst case.

| Break-even Analysis | |
| Monthly Revenue Break-even | $19,756 |
| Assumptions: | |
| Average Percent Variable Cost | 12% |
| Estimated Monthly Fixed Cost | $17,429 |
8.3 Projected Profit and Loss
Our projected profit and loss is shown on the Profit and Loss table. We show a conservative estimated net profit in the first year. According to the research carried out by our team, these projections are conservative and should be easily attained. The monthly estimates are included in the appendix.


| Pro Forma Profit and Loss | |||
| Year 1 | Year 2 | Year 3 | |
| Sales | $239,150 | $345,525 | $503,768 |
| Direct Cost of Sales | $28,165 | $42,345 | $63,440 |
| Other Costs of Goods | $0 | $0 | $0 |
| Total Cost of Sales | $28,165 | $42,345 | $63,440 |
| Gross Margin | $210,985 | $303,180 | $440,328 |
| Gross Margin % | 88.22% | 87.74% | 87.41% |
| Expenses | |||
| Payroll | $109,000 | $157,650 | $194,231 |
| Sales and Marketing and Other Expenses | $6,000 | $12,000 | $18,000 |
| Depreciation | $15,000 | $15,000 | $15,000 |
| Rent (site) | $48,000 | $48,000 | $48,000 |
| Supplies (Office & Janitorial) | $1,200 | $1,200 | $1,200 |
| Web Site Expenses | $600 | $660 | $725 |
| Utilities | $3,000 | $3,300 | $3,630 |
| Insurance (fire,damages, loss) | $10,000 | $3,300 | $3,630 |
| Payroll Taxes | $16,350 | $9,545 | $10,022 |
| Other | $0 | $0 | $0 |
| Total Operating Expenses | $209,150 | $250,655 | $294,438 |
| Profit Before Interest and Taxes | $23,435 | $52,525 | $145,890 |
| EBITDA | $38,435 | $67,525 | $160,890 |
| Interest Expense | $9,573 | $9,030 | $8,330 |
| Taxes Incurred | $5,451 | $15,223 | $47,573 |
| Net Profit | $8,411 | $28,272 | $89,987 |
| Net Profit/Sales | 3.52% | 8.18% | 17.86% |
8.4 Projected Cash Flow
The following cash flow projections show our annual amounts only. For more detailed monthly projections please see the appendix.
Cash flow projections are critical to our success. The monthly cash flow is shown in the illustration, with one bar representing the cash flow per month, and the other the monthly balance. The annual cash flow figures are included here and the more important detailed monthly numbers are included in the appendix.

| Pro Forma Cash Flow | |||
| Year 1 | Year 2 | Year 3 | |
| Cash Received | |||
| Cash from Operations | |||
| Cash Sales | $239,150 | $345,525 | $503,768 |
| Subtotal Cash from Operations | $239,150 | $345,525 | $503,768 |
| Additional Cash Received | |||
| Non Operating (Other) Income | $21,600 | $0 | $0 |
| Sales Tax, VAT, HST/GST Received | $0 | $0 | $0 |
| New Current Borrowing | $0 | $0 | $0 |
| New Other Liabilities (interest-free) | $0 | $0 | $0 |
| New Long-term Liabilities | $0 | $0 | $0 |
| Sales of Other Current Assets | $0 | $0 | $0 |
| Sales of Long-term Assets | $0 | $0 | $0 |
| New Investment Received | $0 | $0 | $0 |
| Subtotal Cash Received | $260,750 | $345,525 | $503,768 |
| Expenditures | Year 1 | Year 2 | Year 3 |
| Expenditures from Operations | |||
| Cash Spending | $109,000 | $157,650 | $194,231 |
| Bill Payments | $108,669 | $152,388 | $199,623 |
| Subtotal Spent on Operations | $217,669 | $310,038 | $393,854 |
| Additional Cash Spent | |||
| Non Operating (Other) Expense | $0 | $0 | $0 |
| Sales Tax, VAT, HST/GST Paid Out | $0 | $0 | $0 |
| Principal Repayment of Current Borrowing | $0 | $0 | $0 |
| Other Liabilities Principal Repayment | $0 | $0 | $0 |
| Long-term Liabilities Principal Repayment | $6,000 | $10,000 | $10,000 |
| Purchase Other Current Assets | $0 | $0 | $0 |
| Purchase Long-term Assets | $0 | $0 | $0 |
| Dividends | $0 | $0 | $0 |
| Subtotal Cash Spent | $223,669 | $320,038 | $403,854 |
| Net Cash Flow | $37,081 | $25,487 | $99,914 |
| Cash Balance | $51,081 | $76,568 | $176,482 |
8.5 Projected Balance Sheet
The balance sheet in the following table shows managed but sufficient growth of net worth, and a sufficiently healthy financial position. The monthly estimates are included in the appendix.
| Pro Forma Balance Sheet | |||
| Year 1 | Year 2 | Year 3 | |
| Assets | |||
| Current Assets | |||
| Cash | $51,081 | $76,568 | $176,482 |
| Other Current Assets | $0 | $0 | $0 |
| Total Current Assets | $51,081 | $76,568 | $176,482 |
| Long-term Assets | |||
| Long-term Assets | $65,000 | $65,000 | $65,000 |
| Accumulated Depreciation | $15,000 | $30,000 | $45,000 |
| Total Long-term Assets | $50,000 | $35,000 | $20,000 |
| Total Assets | $101,081 | $111,568 | $196,482 |
| Liabilities and Capital | Year 1 | Year 2 | Year 3 |
| Current Liabilities | |||
| Accounts Payable | $19,670 | $11,885 | $16,812 |
| Current Borrowing | $0 | $0 | $0 |
| Other Current Liabilities | $0 | $0 | $0 |
| Subtotal Current Liabilities | $19,670 | $11,885 | $16,812 |
| Long-term Liabilities | $134,000 | $124,000 | $114,000 |
| Total Liabilities | $153,670 | $135,885 | $130,812 |
| Paid-in Capital | $200,000 | $200,000 | $200,000 |
| Retained Earnings | ($261,000) | ($252,589) | ($224,317) |
| Earnings | $8,411 | $28,272 | $89,987 |
| Total Capital | ($52,589) | ($24,317) | $65,670 |
| Total Liabilities and Capital | $101,081 | $111,568 | $196,482 |
| Net Worth | ($52,589) | ($24,317) | $65,670 |
8.6 Business Ratios
The table follows with our main business ratios. These are compared with the Industry Profile ratios as determined for the Golf Course Industry, NAICS code 713910. We do intend to improve gross margin, and inventory turnover.
| Ratio Analysis | ||||
| Year 1 | Year 2 | Year 3 | Industry Profile | |
| Sales Growth | 0.00% | 44.48% | 45.80% | 4.07% |
| Percent of Total Assets | ||||
| Other Current Assets | 0.00% | 0.00% | 0.00% | 35.65% |
| Total Current Assets | 50.53% | 68.63% | 89.82% | 46.58% |
| Long-term Assets | 49.47% | 31.37% | 10.18% | 53.42% |
| Total Assets | 100.00% | 100.00% | 100.00% | 100.00% |
| Current Liabilities | 19.46% | 10.65% | 8.56% | 25.61% |
| Long-term Liabilities | 132.57% | 111.14% | 58.02% | 35.91% |
| Total Liabilities | 152.03% | 121.80% | 66.58% | 61.52% |
| Net Worth | -52.03% | -21.80% | 33.42% | 38.48% |
| Percent of Sales | ||||
| Sales | 100.00% | 100.00% | 100.00% | 100.00% |
| Gross Margin | 88.22% | 87.74% | 87.41% | 100.00% |
| Selling, General & Administrative Expenses | 81.36% | 79.71% | 69.85% | 72.53% |
| Advertising Expenses | 0.00% | 0.00% | 0.00% | 3.68% |
| Profit Before Interest and Taxes | 9.80% | 15.20% | 28.96% | 1.60% |
| Main Ratios | ||||
| Current | 2.60 | 6.44 | 10.50 | 1.32 |
| Quick | 2.60 | 6.44 | 10.50 | 0.85 |
| Total Debt to Total Assets | 152.03% | 121.80% | 66.58% | 65.83% |
| Pre-tax Return on Net Worth | -26.36% | -178.87% | 209.47% | 2.41% |
| Pre-tax Return on Assets | 13.71% | 38.99% | 70.01% | 7.06% |
| Additional Ratios | Year 1 | Year 2 | Year 3 | |
| Net Profit Margin | 3.52% | 8.18% | 17.86% | n.a |
| Return on Equity | 0.00% | 0.00% | 137.03% | n.a |
| Activity Ratios | ||||
| Accounts Payable Turnover | 6.52 | 12.17 | 12.17 | n.a |
| Payment Days | 27 | 40 | 26 | n.a |
| Total Asset Turnover | 2.37 | 3.10 | 2.56 | n.a |
| Debt Ratios | ||||
| Debt to Net Worth | 0.00 | 0.00 | 1.99 | n.a |
| Current Liab. to Liab. | 0.13 | 0.09 | 0.13 | n.a |
| Liquidity Ratios | ||||
| Net Working Capital | $31,411 | $64,683 | $159,670 | n.a |
| Interest Coverage | 2.45 | 5.82 | 17.51 | n.a |
| Additional Ratios | ||||
| Assets to Sales | 0.42 | 0.32 | 0.39 | n.a |
| Current Debt/Total Assets | 19% | 11% | 9% | n.a |
| Acid Test | 2.60 | 6.44 | 10.50 | n.a |
| Sales/Net Worth | 0.00 | 0.00 | 7.67 | n.a |
| Dividend Payout | 0.00 | 0.00 | 0.00 | n.a |
Appendix
| Sales Forecast | |||||||||||||
| Month 1 | Month 2 | Month 3 | Month 4 | Month 5 | Month 6 | Month 7 | Month 8 | Month 9 | Month 10 | Month 11 | Month 12 | ||
| Sales | |||||||||||||
| Membership Fees | 0% | $2,200 | $4,400 | $6,600 | $8,800 | $11,000 | $13,200 | $15,950 | $17,600 | $19,800 | $22,000 | $22,000 | $22,000 |
| Golf Equipment | 0% | $0 | $0 | $2,000 | $2,000 | $2,000 | $2,000 | $2,000 | $2,000 | $2,000 | $2,000 | $2,000 | $2,000 |
| Food & Beverages | 0% | $180 | $360 | $540 | $720 | $900 | $1,080 | $1,260 | $1,440 | $1,620 | $1,800 | $1,800 | $1,800 |
| Cigars | 0% | $0 | $0 | $0 | $0 | $0 | $0 | $500 | $500 | $500 | $500 | $500 | $500 |
| Private Lessons | 0% | $0 | $0 | $0 | $0 | $0 | $0 | $250 | $250 | $250 | $250 | $250 | $250 |
| Equipment Rental | 0% | $0 | $0 | $0 | $0 | $0 | $0 | $250 | $250 | $250 | $250 | $250 | $250 |
| Advertising | 0% | $0 | $3,000 | $3,000 | $3,000 | $3,000 | $3,000 | $3,000 | $3,000 | $3,000 | $3,000 | $3,000 | $3,000 |
| Extra Performance Analysis | 0% | $0 | $0 | $0 | $0 | $0 | $0 | $0 | $0 | $0 | $0 | $250 | $250 |
| Other | 0% | $0 | $0 | $0 | $0 | $0 | $0 | $100 | $100 | $100 | $100 | $100 | $100 |
| Total Sales | $2,380 | $7,760 | $12,140 | $14,520 | $16,900 | $19,280 | $23,310 | $25,140 | $27,520 | $29,900 | $30,150 | $30,150 | |
| Direct Cost of Sales | Month 1 | Month 2 | Month 3 | Month 4 | Month 5 | Month 6 | Month 7 | Month 8 | Month 9 | Month 10 | Month 11 | Month 12 | |
| Membership Fees | $110 | $220 | $330 | $440 | $550 | $660 | $795 | $880 | $990 | $1,100 | $1,100 | $1,100 | |
| Golf Equipment | $0 | $0 | $1,500 | $1,500 | $1,500 | $1,500 | $1,500 | $1,500 | $1,500 | $1,500 | $1,500 | $1,500 | |
| Food & Beverages | $36 | $72 | $108 | $144 | $180 | $216 | $252 | $288 | $324 | $360 | $360 | $360 | |
| Cigars | $0 | $0 | $0 | $0 | $0 | $0 | $125 | $125 | $125 | $125 | $125 | $125 | |
| Private Lessons | $0 | $0 | $0 | $0 | $0 | $0 | $190 | $190 | $190 | $190 | $190 | $190 | |
| Equipment Rental | $0 | $0 | $0 | $0 | $0 | $0 | $0 | $0 | $0 | $0 | $0 | $0 | |
| Advertising | $0 | $0 | $0 | $0 | $0 | $0 | $0 | $0 | $0 | $0 | $0 | $0 | |
| Extra Performance Analysis | $0 | $0 | $0 | $0 | $0 | $0 | $0 | $0 | $0 | $0 | $0 | $0 | |
| Other | $0 | $0 | $0 | $0 | $0 | $0 | $50 | $50 | $50 | $50 | $50 | $50 | |
| Subtotal Direct Cost of Sales | $146 | $292 | $1,938 | $2,084 | $2,230 | $2,376 | $2,912 | $3,033 | $3,179 | $3,325 | $3,325 | $3,325 | |
| Personnel Plan | |||||||||||||
| Month 1 | Month 2 | Month 3 | Month 4 | Month 5 | Month 6 | Month 7 | Month 8 | Month 9 | Month 10 | Month 11 | Month 12 | ||
| Managing Director & consultant | 0% | $4,000 | $4,000 | $4,000 | $4,000 | $4,000 | $4,000 | $4,000 | $4,000 | $4,000 | $4,000 | $4,000 | $4,000 |
| Administration 1 – Part time | 0% | $800 | $800 | $1,200 | $800 | $1,200 | $800 | $800 | $800 | $800 | $1,600 | $800 | $800 |
| Administration 2 – Part time | 0% | $800 | $800 | $1,200 | $800 | $1,200 | $800 | $800 | $800 | $800 | $1,600 | $800 | $800 |
| Administration 3 – Part time | 0% | $0 | $0 | $0 | $0 | $0 | $0 | $0 | $0 | $0 | $0 | $0 | $0 |
| Janitor | 0% | $900 | $900 | $1,350 | $900 | $1,350 | $900 | $900 | $900 | $900 | $1,800 | $900 | $900 |
| Janitor assistant | 0% | $0 | $0 | $0 | $0 | $0 | $0 | $0 | $0 | $0 | $0 | $0 | $0 |
| Cleaning Person 1 – Part time | 0% | $800 | $800 | $1,200 | $800 | $1,200 | $800 | $800 | $800 | $800 | $1,600 | $800 | $800 |
| Cleaning Person 2 – Part time | 0% | $800 | $800 | $1,200 | $800 | $1,200 | $800 | $800 | $800 | $800 | $1,600 | $800 | $800 |
| Professional instructor | 0% | $0 | $0 | $0 | $0 | $0 | $0 | $0 | $0 | $0 | $0 | $0 | $0 |
| Accountant | 0% | $300 | $300 | $300 | $300 | $300 | $300 | $300 | $300 | $300 | $300 | $300 | $300 |
| Guard 1 | 0% | $0 | $0 | $0 | $0 | $0 | $0 | $0 | $0 | $0 | $0 | $0 | $0 |
| Guard 2 | 0% | $0 | $0 | $0 | $0 | $0 | $0 | $0 | $0 | $0 | $0 | $0 | $0 |
| Other | 0% | $0 | $0 | $0 | $0 | $0 | $0 | $0 | $0 | $0 | $0 | $0 | $0 |
| Total People | 7 | 7 | 7 | 7 | 7 | 7 | 7 | 7 | 7 | 7 | 7 | 7 | |
| Total Payroll | $8,400 | $8,400 | $10,450 | $8,400 | $10,450 | $8,400 | $8,400 | $8,400 | $8,400 | $12,500 | $8,400 | $8,400 | |
| General Assumptions | |||||||||||||
| Month 1 | Month 2 | Month 3 | Month 4 | Month 5 | Month 6 | Month 7 | Month 8 | Month 9 | Month 10 | Month 11 | Month 12 | ||
| Plan Month | 1 | 2 | 3 | 4 | 5 | 6 | 7 | 8 | 9 | 10 | 11 | 12 | |
| Current Interest Rate | 12.00% | 12.00% | 12.00% | 12.00% | 12.00% | 12.00% | 12.00% | 12.00% | 12.00% | 12.00% | 12.00% | 12.00% | |
| Long-term Interest Rate | 7.00% | 7.00% | 7.00% | 7.00% | 7.00% | 7.00% | 7.00% | 7.00% | 7.00% | 7.00% | 7.00% | 7.00% | |
| Tax Rate | 30.00% | 35.00% | 35.00% | 35.00% | 35.00% | 35.00% | 35.00% | 35.00% | 35.00% | 35.00% | 35.00% | 35.00% | |
| Personnel Burden | 0 | 0 | 0 | 0 | 0 | 0 | 0 | 0 | 0 | 0 | 0 | 0 | |
| Other | 0 | 0 | 0 | 0 | 0 | 0 | 0 | 0 | 0 | 0 | 0 | 0 | |
| Pro Forma Profit and Loss | |||||||||||||
| Month 1 | Month 2 | Month 3 | Month 4 | Month 5 | Month 6 | Month 7 | Month 8 | Month 9 | Month 10 | Month 11 | Month 12 | ||
| Sales | $2,380 | $7,760 | $12,140 | $14,520 | $16,900 | $19,280 | $23,310 | $25,140 | $27,520 | $29,900 | $30,150 | $30,150 | |
| Direct Cost of Sales | $146 | $292 | $1,938 | $2,084 | $2,230 | $2,376 | $2,912 | $3,033 | $3,179 | $3,325 | $3,325 | $3,325 | |
| Other Costs of Goods | $0 | $0 | $0 | $0 | $0 | $0 | $0 | $0 | $0 | $0 | $0 | $0 | |
| Total Cost of Sales | $146 | $292 | $1,938 | $2,084 | $2,230 | $2,376 | $2,912 | $3,033 | $3,179 | $3,325 | $3,325 | $3,325 | |
| Gross Margin | $2,234 | $7,468 | $10,202 | $12,436 | $14,670 | $16,904 | $20,398 | $22,107 | $24,341 | $26,575 | $26,825 | $26,825 | |
| Gross Margin % | 93.87% | 96.24% | 84.04% | 85.65% | 86.80% | 87.68% | 87.51% | 87.94% | 88.45% | 88.88% | 88.97% | 88.97% | |
| Expenses | |||||||||||||
| Payroll | $8,400 | $8,400 | $10,450 | $8,400 | $10,450 | $8,400 | $8,400 | $8,400 | $8,400 | $12,500 | $8,400 | $8,400 | |
| Sales and Marketing and Other Expenses | $500 | $500 | $500 | $500 | $500 | $500 | $500 | $500 | $500 | $500 | $500 | $500 | |
| Depreciation | $1,250 | $1,250 | $1,250 | $1,250 | $1,250 | $1,250 | $1,250 | $1,250 | $1,250 | $1,250 | $1,250 | $1,250 | |
| Rent (site) | $4,000 | $4,000 | $4,000 | $4,000 | $4,000 | $4,000 | $4,000 | $4,000 | $4,000 | $4,000 | $4,000 | $4,000 | |
| Supplies (Office & Janitorial) | $100 | $100 | $100 | $100 | $100 | $100 | $100 | $100 | $100 | $100 | $100 | $100 | |
| Web Site Expenses | $50 | $50 | $50 | $50 | $50 | $50 | $50 | $50 | $50 | $50 | $50 | $50 | |
| Utilities | $250 | $250 | $250 | $250 | $250 | $250 | $250 | $250 | $250 | $250 | $250 | $250 | |
| Insurance (fire,damages, loss) | $0 | $0 | $0 | $0 | $0 | $0 | $0 | $0 | $0 | $0 | $0 | $10,000 | |
| Payroll Taxes | 15% | $1,260 | $1,260 | $1,568 | $1,260 | $1,568 | $1,260 | $1,260 | $1,260 | $1,260 | $1,875 | $1,260 | $1,260 |
| Other | $0 | $0 | $0 | $0 | $0 | $0 | $0 | $0 | $0 | $0 | $0 | $0 | |
| Total Operating Expenses | $15,810 | $15,810 | $18,168 | $15,810 | $18,168 | $15,810 | $15,810 | $15,810 | $15,810 | $20,525 | $15,810 | $25,810 | |
| Profit Before Interest and Taxes | ($11,176) | ($5,942) | ($4,366) | ($974) | $103 | $3,494 | $6,988 | $8,697 | $8,531 | $6,050 | $11,015 | $1,015 | |
| EBITDA | ($9,926) | ($4,692) | ($3,116) | $276 | $1,353 | $4,744 | $8,238 | $9,947 | $9,781 | $7,300 | $12,265 | $2,265 | |
| Interest Expense | $814 | $811 | $808 | $805 | $802 | $799 | $796 | $793 | $790 | $788 | $785 | $782 | |
| Taxes Incurred | ($3,597) | ($2,363) | ($1,811) | ($623) | ($245) | $943 | $2,167 | $2,766 | $2,709 | $1,842 | $3,581 | $82 | |
| Net Profit | ($8,393) | ($4,389) | ($3,363) | ($1,156) | ($455) | $1,752 | $4,025 | $5,137 | $5,031 | $3,421 | $6,650 | $152 | |
| Net Profit/Sales | -352.64% | -56.56% | -27.70% | -7.96% | -2.69% | 9.09% | 17.27% | 20.44% | 18.28% | 11.44% | 22.06% | 0.50% | |
| Pro Forma Cash Flow | |||||||||||||
| Month 1 | Month 2 | Month 3 | Month 4 | Month 5 | Month 6 | Month 7 | Month 8 | Month 9 | Month 10 | Month 11 | Month 12 | ||
| Cash Received | |||||||||||||
| Cash from Operations | |||||||||||||
| Cash Sales | $2,380 | $7,760 | $12,140 | $14,520 | $16,900 | $19,280 | $23,310 | $25,140 | $27,520 | $29,900 | $30,150 | $30,150 | |
| Subtotal Cash from Operations | $2,380 | $7,760 | $12,140 | $14,520 | $16,900 | $19,280 | $23,310 | $25,140 | $27,520 | $29,900 | $30,150 | $30,150 | |
| Additional Cash Received | |||||||||||||
| Non Operating (Other) Income | $2,400 | $2,400 | $3,600 | $2,400 | $3,600 | $2,400 | $2,400 | $2,400 | $0 | $0 | $0 | $0 | |
| Sales Tax, VAT, HST/GST Received | 0.00% | $0 | $0 | $0 | $0 | $0 | $0 | $0 | $0 | $0 | $0 | $0 | $0 |
| New Current Borrowing | $0 | $0 | $0 | $0 | $0 | $0 | $0 | $0 | $0 | $0 | $0 | $0 | |
| New Other Liabilities (interest-free) | $0 | $0 | $0 | $0 | $0 | $0 | $0 | $0 | $0 | $0 | $0 | $0 | |
| New Long-term Liabilities | $0 | $0 | $0 | $0 | $0 | $0 | $0 | $0 | $0 | $0 | $0 | $0 | |
| Sales of Other Current Assets | $0 | $0 | $0 | $0 | $0 | $0 | $0 | $0 | $0 | $0 | $0 | $0 | |
| Sales of Long-term Assets | $0 | $0 | $0 | $0 | $0 | $0 | $0 | $0 | $0 | $0 | $0 | $0 | |
| New Investment Received | $0 | $0 | $0 | $0 | $0 | $0 | $0 | $0 | $0 | $0 | $0 | $0 | |
| Subtotal Cash Received | $4,780 | $10,160 | $15,740 | $16,920 | $20,500 | $21,680 | $25,710 | $27,540 | $27,520 | $29,900 | $30,150 | $30,150 | |
| Expenditures | Month 1 | Month 2 | Month 3 | Month 4 | Month 5 | Month 6 | Month 7 | Month 8 | Month 9 | Month 10 | Month 11 | Month 12 | |
| Expenditures from Operations | |||||||||||||
| Cash Spending | $8,400 | $8,400 | $10,450 | $8,400 | $10,450 | $8,400 | $8,400 | $8,400 | $8,400 | $12,500 | $8,400 | $8,400 | |
| Bill Payments | $117 | $3,569 | $4,983 | $7,437 | $8,454 | $9,289 | $10,337 | $12,059 | $12,755 | $12,835 | $12,767 | $14,067 | |
| Subtotal Spent on Operations | $8,517 | $11,969 | $15,433 | $15,837 | $18,904 | $17,689 | $18,737 | $20,459 | $21,155 | $25,335 | $21,167 | $22,467 | |
| Additional Cash Spent | |||||||||||||
| Non Operating (Other) Expense | $0 | $0 | $0 | $0 | $0 | $0 | $0 | $0 | $0 | $0 | $0 | $0 | |
| Sales Tax, VAT, HST/GST Paid Out | $0 | $0 | $0 | $0 | $0 | $0 | $0 | $0 | $0 | $0 | $0 | $0 | |
| Principal Repayment of Current Borrowing | $0 | $0 | $0 | $0 | $0 | $0 | $0 | $0 | $0 | $0 | $0 | $0 | |
| Other Liabilities Principal Repayment | $0 | $0 | $0 | $0 | $0 | $0 | $0 | $0 | $0 | $0 | $0 | $0 | |
| Long-term Liabilities Principal Repayment | $500 | $500 | $500 | $500 | $500 | $500 | $500 | $500 | $500 | $500 | $500 | $500 | |
| Purchase Other Current Assets | $0 | $0 | $0 | $0 | $0 | $0 | $0 | $0 | $0 | $0 | $0 | $0 | |
| Purchase Long-term Assets | $0 | $0 | $0 | $0 | $0 | $0 | $0 | $0 | $0 | $0 | $0 | $0 | |
| Dividends | $0 | $0 | $0 | $0 | $0 | $0 | $0 | $0 | $0 | $0 | $0 | $0 | |
| Subtotal Cash Spent | $9,017 | $12,469 | $15,933 | $16,337 | $19,404 | $18,189 | $19,237 | $20,959 | $21,655 | $25,835 | $21,667 | $22,967 | |
| Net Cash Flow | ($4,237) | ($2,309) | ($193) | $583 | $1,096 | $3,491 | $6,473 | $6,581 | $5,865 | $4,065 | $8,483 | $7,183 | |
| Cash Balance | $9,763 | $7,454 | $7,261 | $7,844 | $8,940 | $12,431 | $18,904 | $25,485 | $31,350 | $35,415 | $43,898 | $51,081 | |
| Pro Forma Balance Sheet | |||||||||||||
| Month 1 | Month 2 | Month 3 | Month 4 | Month 5 | Month 6 | Month 7 | Month 8 | Month 9 | Month 10 | Month 11 | Month 12 | ||
| Assets | Starting Balances | ||||||||||||
| Current Assets | |||||||||||||
| Cash | $14,000 | $9,763 | $7,454 | $7,261 | $7,844 | $8,940 | $12,431 | $18,904 | $25,485 | $31,350 | $35,415 | $43,898 | $51,081 |
| Other Current Assets | $0 | $0 | $0 | $0 | $0 | $0 | $0 | $0 | $0 | $0 | $0 | $0 | $0 |
| Total Current Assets | $14,000 | $9,763 | $7,454 | $7,261 | $7,844 | $8,940 | $12,431 | $18,904 | $25,485 | $31,350 | $35,415 | $43,898 | $51,081 |
| Long-term Assets | |||||||||||||
| Long-term Assets | $65,000 | $65,000 | $65,000 | $65,000 | $65,000 | $65,000 | $65,000 | $65,000 | $65,000 | $65,000 | $65,000 | $65,000 | $65,000 |
| Accumulated Depreciation | $0 | $1,250 | $2,500 | $3,750 | $5,000 | $6,250 | $7,500 | $8,750 | $10,000 | $11,250 | $12,500 | $13,750 | $15,000 |
| Total Long-term Assets | $65,000 | $63,750 | $62,500 | $61,250 | $60,000 | $58,750 | $57,500 | $56,250 | $55,000 | $53,750 | $52,500 | $51,250 | $50,000 |
| Total Assets | $79,000 | $73,513 | $69,954 | $68,511 | $67,844 | $67,690 | $69,931 | $75,154 | $80,485 | $85,100 | $87,915 | $95,148 | $101,081 |
| Liabilities and Capital | Month 1 | Month 2 | Month 3 | Month 4 | Month 5 | Month 6 | Month 7 | Month 8 | Month 9 | Month 10 | Month 11 | Month 12 | |
| Current Liabilities | |||||||||||||
| Accounts Payable | $0 | $3,405 | $4,736 | $7,156 | $8,145 | $8,946 | $9,936 | $11,634 | $12,328 | $12,411 | $12,305 | $13,389 | $19,670 |
| Current Borrowing | $0 | $0 | $0 | $0 | $0 | $0 | $0 | $0 | $0 | $0 | $0 | $0 | $0 |
| Other Current Liabilities | $0 | $0 | $0 | $0 | $0 | $0 | $0 | $0 | $0 | $0 | $0 | $0 | $0 |
| Subtotal Current Liabilities | $0 | $3,405 | $4,736 | $7,156 | $8,145 | $8,946 | $9,936 | $11,634 | $12,328 | $12,411 | $12,305 | $13,389 | $19,670 |
| Long-term Liabilities | $140,000 | $139,500 | $139,000 | $138,500 | $138,000 | $137,500 | $137,000 | $136,500 | $136,000 | $135,500 | $135,000 | $134,500 | $134,000 |
| Total Liabilities | $140,000 | $142,905 | $143,736 | $145,656 | $146,145 | $146,446 | $146,936 | $148,134 | $148,328 | $147,911 | $147,305 | $147,889 | $153,670 |
| Paid-in Capital | $200,000 | $200,000 | $200,000 | $200,000 | $200,000 | $200,000 | $200,000 | $200,000 | $200,000 | $200,000 | $200,000 | $200,000 | $200,000 |
| Retained Earnings | ($261,000) | ($261,000) | ($261,000) | ($261,000) | ($261,000) | ($261,000) | ($261,000) | ($261,000) | ($261,000) | ($261,000) | ($261,000) | ($261,000) | ($261,000) |
| Earnings | $0 | ($8,393) | ($12,782) | ($16,145) | ($17,301) | ($17,756) | ($16,004) | ($11,980) | ($6,842) | ($1,811) | $1,610 | $8,259 | $8,411 |
| Total Capital | ($61,000) | ($69,393) | ($73,782) | ($77,145) | ($78,301) | ($78,756) | ($77,004) | ($72,980) | ($67,842) | ($62,811) | ($59,390) | ($52,741) | ($52,589) |
| Total Liabilities and Capital | $79,000 | $73,513 | $69,954 | $68,511 | $67,844 | $67,690 | $69,931 | $75,154 | $80,485 | $85,100 | $87,915 | $95,148 | $101,081 |
| Net Worth | ($61,000) | ($69,393) | ($73,782) | ($77,145) | ($78,301) | ($78,756) | ($77,004) | ($72,980) | ($67,842) | ($62,811) | ($59,390) | ($52,741) | ($52,589) |


