
Willow Park Golf Course
Executive Summary
The Willow Park Golf Course is located a half mile from Willow Lake Village, a new vacation retirement complex. Located in the expanding Crest Canyon area, this 18-hole facility offers a challenging layout and beautiful views. The property includes a Pro Shop, driving range, cart barn, maintenance buildings, and a pavilion that seats up to 50. The free shuttle service that serves all the area’s retirement complexes makes the course extremely accessible. Willow Park Golf Course also will have an on-site snack bar.
Each year, over 200,000 retirees visit the Crest Canyon area. On average, these visitors spend over $250 million, annually, for lodging, food, and recreational activities at Crest Canyon area.
Marty Snyderman, Palmer St. Andrews and Luke Roth, co-owners of the Willow Park Golf Course, have signed a 10 year lease with Claremont Properties for $250,000 annually.
1.1 Objectives
The objectives of the Willow Park Golf Course for the first three years of operation include:
- Revitalize the old course and attract a loyal local clientele.
- Use strategic alliances and players’ word-of-mouth recommendations to make Willow Park a destination course for vacationers, and avid players who are willing to travel to golf.
- Exceeding customer’s expectations.
- Assembling an experienced and effective staff.
1.2 Mission
The mission of Willow Park Golf Course is to become a popular course with visitors to, and residents of, the Crest Canyon area.
Company Summary
The Willow Park Golf Course is located in the expanding Crest Canyon area. This 18-hole facility offers a challenging layout and beautiful views. The property includes a Pro Shop, driving range, cart barn, maintenance buildings, and a pavilion that seats up to 50. Willow Park Golf Course also will have an on-site snack bar.
The facility was the Crescent Hills Golf Course for ten years before closing in 1999. Most of Crescent Hills Golf Course assets were sold in 1999. The property was bought by Claremont Properties in 2000 for $2,000,000. Since the purchase, Claremont Properties has been seeking a leasing arrangement that would reopen the facility. In the interim, the new owners have completed repairs on the Pro Shop, snack bar, cart barn, maintenance shed, and driving range. Claremont Properties owns 4,000 condo units in the Crest Canyon area. The company also owns Willow Park Condominiums which borders Willow Park Golf Course. The Willow Park Golf Course will form a strategic alliance with Claremont Properties in promoting and advertising the new golf course.
Willow Park Golf Course will require extensive landscape work. This work will be performed during the three month period (October-December) before the course opens in January. In addition, the following new equipment will be purchased:
- Driving Range Equipment
- Greens and Landscape Maintenance Equipment
- Food Service Equipment for the Snack Bar
Thirty-six golf carts will also be leased to assure that there is sufficient transportation for all members and guests. Willow Park Golf Course will have a staff of four to maintain the golf cart pool.
2.1 Start-up Summary
Marty Snyderman, Palmer St. Andrews and Luke Roth will each invest in the venture. They will also secure a long-term loan.

| Start-up | |
| Requirements | |
| Start-up Expenses | |
| Legal | $5,000 |
| Stationery etc. | $400 |
| Brochures | $6,000 |
| Pro Shop Setup | $50,000 |
| Landscape Development and Repair | $280,000 |
| Food Service Equipment | $20,000 |
| Insurance | $4,000 |
| Driving Range Equipment | $80,000 |
| Lease Golf Carts | $10,000 |
| Greens/Landscape Equipment | $170,000 |
| Other | $0 |
| Total Start-up Expenses | $625,400 |
| Start-up Assets | |
| Cash Required | $34,600 |
| Start-up Inventory | $30,000 |
| Other Current Assets | $0 |
| Long-term Assets | $210,000 |
| Total Assets | $274,600 |
| Total Requirements | $900,000 |
| Start-up Funding | |
| Start-up Expenses to Fund | $625,400 |
| Start-up Assets to Fund | $274,600 |
| Total Funding Required | $900,000 |
| Assets | |
| Non-cash Assets from Start-up | $240,000 |
| Cash Requirements from Start-up | $34,600 |
| Additional Cash Raised | $0 |
| Cash Balance on Starting Date | $34,600 |
| Total Assets | $274,600 |
| Liabilities and Capital | |
| Liabilities | |
| Current Borrowing | $0 |
| Long-term Liabilities | $300,000 |
| Accounts Payable (Outstanding Bills) | $0 |
| Other Current Liabilities (interest-free) | $0 |
| Total Liabilities | $300,000 |
| Capital | |
| Planned Investment | |
| Marty Snyderman | $200,000 |
| Luke Roth | $200,000 |
| Palmer St. Andrews | $200,000 |
| Additional Investment Requirement | $0 |
| Total Planned Investment | $600,000 |
| Loss at Start-up (Start-up Expenses) | ($625,400) |
| Total Capital | ($25,400) |
| Total Capital and Liabilities | $274,600 |
| Total Funding | $900,000 |
2.2 Company Ownership
Marty Snyderman, Luke Roth, and Palmer St. Andrews are co-owners of the Willow Park Golf Course.
Products and Services
The Willow Park Golf Course will offer the following services:
- 18-hole golf course
- Pro Shop
- Driving range
- Snack bar
Market Analysis Summary
Retirement hotel development and operation in the Crest Canyon area has been very profitable and successful due to the economic upturn experienced in the mid-1990s. Retirement living and vacation development are currently going strong. In the past two years, the sales of condos in the Crest Canyon area have increased by over 35 percent. There are twenty condominium developments, retirement complexes, and hotels within a five mile radius of Willow Park Golf Course. The area’s room occupancy is 90% year round. New construction is planned during spring of 2002 for two retirement condo complexes and a hotel.
4.1 Market Segmentation
Our customers can be broadly divided into two groups:
- Retirement Residents. The Crest Canyon area is quickly becoming one of the best retirement locations in the US. The population is growing at a rate of 15% annually. Currently the Crest Canyon area has a population of 80,000 year-round residents
- Retirement Visitors. The Crest Canyon area welcomes 200,000 visitors annually, who enjoy the sun and recreational activities throughout the year.

| Market Analysis | |||||||
| Year 1 | Year 2 | Year 3 | Year 4 | Year 5 | |||
| Potential Customers | Growth | CAGR | |||||
| Residents | 15% | 80,000 | 92,000 | 105,800 | 121,670 | 139,921 | 15.00% |
| Visitors | 15% | 200,000 | 230,000 | 264,500 | 304,175 | 349,801 | 15.00% |
| Total | 15.00% | 280,000 | 322,000 | 370,300 | 425,845 | 489,722 | 15.00% |
Strategy and Implementation Summary
Willow Park Golf Course will aggressively market to both retired residents and vacationers to the Crest Canyon area.
- Residents. The course will initiate a membership drive. Membership fees will reflect a 30% discount for course use and a 20% discount on purchases in the Pro Shop.
- Visitors. The Willow Park Golf Course will offer 3, 7, 10, and 14-day membership packages as well as a single day membership fee. The 3 and 7-day packages will represent a 10% savings over the single day rate. The 10 and 14-day packages will represent a 15% discount over the single day rate.
Claremont Properties will market Willow Park Golf Course to the residents and visitors in their condo units.
5.1 Marketing Strategy
Claremont Properties will take an active role in marketing Willow Park Golf Course in its 4,000+ condo units. Claremont Properties will offer its residents a 20% discount on membership fees. Vacation visitors staying in Claremont Properties’ units will be offered a 15% discount on the day use fee.
Claremont Properties is including Willow Park Golf Course in its marketing material. Its annual nationwide advertising budget is $300,000.
Willow Park also has a strategic alliance with Crest Lake Golf Course, also owned by Marty Snyderman. Palmer St. Andrews has been the Head Teaching Pro and Pro Shop manager there. Crest Lake will provide the purchasing channel for the Pro Shop inventory during the first year while Willow Park establishes lines-of-credit with suppliers and distributors. In addition, Crest Lake will enter and recommend players to Willow Park.
5.2 Competitive Edge
The competitive edge of Willow Park Golf Course is the service, first and foremost. Marty Snyderman and Luke Roth, co-owners of the Willow Park Golf Course, have over twenty years experience in managing golf facilities.

Marty is the manager-owner of the Crest Lake Golf Course. He has owned the course for ten years.
Most recently, Luke was the manager of the Village Green Golf Course. He held that position for the last five years. Before this position, Luke was the manager of the The Ridge, a 160-unit golf retirement condo complex in the nearby community of Henderson.
Palmer St. Andrews is a former PGA tour pro. He has been the Pro Shop manager and Head Teaching Pro for Marty’s Crest Lake Golf Course for the last 5 years. He brings a respected PGA reputation, experience in course play, instruction, and retail management, as well as an established student clientele base.
Another competitive advantage for Willow Park Golf Course is the free shuttle service that serves all the area’s retirement complexes. The shuttle makes the course extremely accessible to local residents.
Another critical advantage is the course’s relationship with Claremont Properties that owns over 4,000 condo units in Crest Canyon area. Claremont Properties will aggressively promote Willow Park Golf Course with residents and vacation visitors.
5.3 Sales Strategy
The Willow Park Golf Course sales strategy is to aggressively gain market share of residents and vacationers.
Willow Park Golf Course will use the following pricing strategy:
- Membership Fees: Annual membership fee is $500. Members will have a 30% discount on course use and a 20% diwcount on purchases in the Pro Shop.
- Day Use Fee: 9 holes is $50 (members $34). 18 holes is $90 (members $67).
Willow Park Golf Course will offer the following Day USe Packages:
- 9 Holes: 3 days-$125, 7 days-$135, 10 days-$425, and 14 days-$595
- 18 Holes: 3 days-$243, 7 days-$567, 10 days-$765, 14 days-$1071.
5.3.1 Sales Forecast
The following is the sales forecast for three years. We anticipate a fast start course play sales since we have a large local resident population who we believe will flock to the newly reopened course.
As the golf and vacation season progress we see the usual spate of new equipment and clothing sales, and the monthly increase in memberships and course play sales as more folks take their vacations and travel to the Crest Canyon area. We are fortunate to be situated in a warm temperate climatic and geographic area, and so the course is open all year for play, unlike many other courses that are covered with snow three to six months of the year. We anticipate increased winter month sales in subsequent years, as ‘snowbirds’ learn of Willow Park, and leave the cold behind to come play our course.
The Pro Shop should have increased sales in November and December as family and friends buy holiday gifts for their favorite golfer.


| Sales Forecast | |||
| Year 1 | Year 2 | Year 3 | |
| Sales | |||
| Memberships/Use Fees | $445,000 | $500,000 | $580,000 |
| Day Use Fees (for 1 or more days) | $325,000 | $370,000 | $450,000 |
| Golf Lessons | $234,000 | $260,000 | $330,000 |
| Snacks | $256,000 | $275,000 | $320,000 |
| Pro Shop | $80,500 | $100,000 | $120,000 |
| Driving Range | $103,000 | $115,000 | $130,000 |
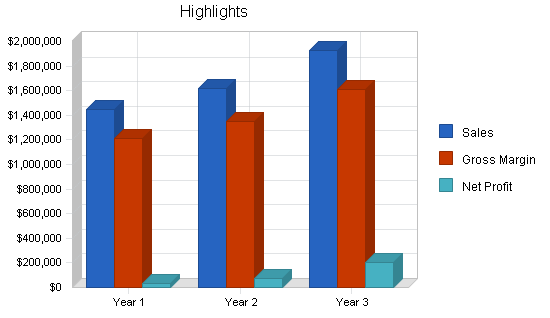
| Total Sales | $1,443,500 | $1,620,000 | $1,930,000 |
| Direct Cost of Sales | Year 1 | Year 2 | Year 3 |
| Memberships/Use Fees | $0 | $0 | $0 |
| Day Use Fees (for 1 or more days) | $0 | $0 | $0 |
| Golf Lessons | $117,000 | $133,000 | $150,000 |
| Snacks | $64,000 | $75,000 | $90,000 |
| Pro Shop | $32,300 | $40,000 | $58,000 |
| Driving Range | $21,000 | $23,000 | $25,000 |
| Subtotal Direct Cost of Sales | $234,300 | $271,000 | $323,000 |
Management Summary
Luke Roth will be the manager of daily operations of the Willow Park Golf Course. Palmer St. Andrews will be the manager of the Pro Shop, as well as the Head Teaching Pro and supervisor of the teaching staff. We are currently in the process of recruiting an experienced Greens and Landscape Superintendent.
6.1 Personnel Plan
Because Willow Park Golf Course is open all year we will be recruiting and training full time employees. We want loyal dedicated folks, so unlike other snowbound courses, we will not rely on seasonal employees. The minimum personnel needed for the Willow Park Golf Course’s first year will be:
- Manager
- Assistant Manager
- Head Teaching Pro/Pro Shop Manager
- Greens and Landscape Superintendent
- 7 Course Staff
- 3 Snack Shop Staff
- 3 Pro Shop Staff
- 3 Greens Maintenance Staff
- 4 Golf Cart Maintenance Staff
| Personnel Plan | |||
| Year 1 | Year 2 | Year 3 | |
| Manager | $54,000 | $59,000 | $64,000 |
| Assistant Manager | $42,000 | $47,000 | $52,000 |
| Pro Shop Manager/Head Teaching Pro | $60,000 | $70,000 | $80,000 |
| Greeens/Landscape Superintendent | $48,000 | $53,000 | $58,000 |
| Course Staff | $156,000 | $163,000 | $168,000 |
| Snack Shop Staff | $54,000 | $57,000 | $61,000 |
| Pro Shop Staff | $54,000 | $58,000 | $62,000 |
| Greens Maintenance Staff | $48,000 | $52,000 | $56,000 |
| Golf Cart Maintenance Staff | $72,000 | $76,000 | $79,000 |
| Other | $0 | $0 | $0 |
| Total People | 24 | 24 | 24 |
| Total Payroll | $588,000 | $635,000 | $680,000 |
Financial Plan
The following is the financial plan for the Willow Park Golf Course. We anticipate a first year of fluctuating sales and expenses as we become established physically, and in the minds of our target market. The first year we will have one time expenses in restoring the course and establishing our maintenance routines. As our existence and reputation become known we steady growth, and a more even membership sales as golfers from cold snowy climes travel to the Crest Canyon area, and Willow Park particularly to play golf during the winter months.
7.1 Break-even Analysis
Using averaged monthly total expenses and an estimated variable cost, the monthly break-even point in sales revenue is calculated and shown below.

| Break-even Analysis | |
| Monthly Revenue Break-even | $113,085 |
| Assumptions: | |
| Average Percent Variable Cost | 16% |
| Estimated Monthly Fixed Cost | $94,730 |
7.2 Projected Profit and Loss
The following table and charts show the projected profit and loss for three years. Monthly figures for the first year are shown in the appendix.


| Pro Forma Profit and Loss | |||
| Year 1 | Year 2 | Year 3 | |
| Sales | $1,443,500 | $1,620,000 | $1,930,000 |
| Direct Cost of Sales | $234,300 | $271,000 | $323,000 |
| Other Production Expenses | $0 | $0 | $0 |
| Total Cost of Sales | $234,300 | $271,000 | $323,000 |
| Gross Margin | $1,209,200 | $1,349,000 | $1,607,000 |
| Gross Margin % | 83.77% | 83.27% | 83.26% |
| Expenses | |||
| Payroll | $588,000 | $635,000 | $680,000 |
| Sales and Marketing and Other Expenses | $60,000 | $80,000 | $100,000 |
| Depreciation | $28,560 | $28,560 | $28,560 |
| Leased Equipment | $72,000 | $80,000 | $80,000 |
| Utilities | $26,000 | $26,000 | $26,000 |
| Insurance | $24,000 | $24,000 | $24,000 |
| Lease | $250,000 | $250,000 | $250,000 |
| Payroll Taxes | $88,200 | $95,250 | $102,000 |
| Other | $0 | $0 | $0 |
| Total Operating Expenses | $1,136,760 | $1,218,810 | $1,290,560 |
| Profit Before Interest and Taxes | $72,440 | $130,190 | $316,440 |
| EBITDA | $101,000 | $158,750 | $345,000 |
| Interest Expense | $28,066 | $24,643 | $21,072 |
| Taxes Incurred | $13,312 | $31,664 | $88,610 |
| Net Profit | $31,062 | $73,883 | $206,758 |
| Net Profit/Sales | 2.15% | 4.56% | 10.71% |
7.3 Projected Cash Flow
The following table and chart show the projected cash flow for three years. Monthly figures for the first year are shown in the appendix.

| Pro Forma Cash Flow | |||
| Year 1 | Year 2 | Year 3 | |
| Cash Received | |||
| Cash from Operations | |||
| Cash Sales | $1,443,500 | $1,620,000 | $1,930,000 |
| Subtotal Cash from Operations | $1,443,500 | $1,620,000 | $1,930,000 |
| Additional Cash Received | |||
| Sales Tax, VAT, HST/GST Received | $0 | $0 | $0 |
| New Current Borrowing | $0 | $0 | $0 |
| New Other Liabilities (interest-free) | $0 | $0 | $0 |
| New Long-term Liabilities | $0 | $0 | $0 |
| Sales of Other Current Assets | $0 | $0 | $0 |
| Sales of Long-term Assets | $0 | $0 | $0 |
| New Investment Received | $0 | $0 | $0 |
| Subtotal Cash Received | $1,443,500 | $1,620,000 | $1,930,000 |
| Expenditures | Year 1 | Year 2 | Year 3 |
| Expenditures from Operations | |||
| Cash Spending | $588,000 | $635,000 | $680,000 |
| Bill Payments | $732,096 | $861,100 | $1,007,098 |
| Subtotal Spent on Operations | $1,320,096 | $1,496,100 | $1,687,098 |
| Additional Cash Spent | |||
| Sales Tax, VAT, HST/GST Paid Out | $0 | $0 | $0 |
| Principal Repayment of Current Borrowing | $0 | $0 | $0 |
| Other Liabilities Principal Repayment | $0 | $0 | $0 |
| Long-term Liabilities Principal Repayment | $35,712 | $35,712 | $35,712 |
| Purchase Other Current Assets | $0 | $0 | $0 |
| Purchase Long-term Assets | $0 | $0 | $0 |
| Dividends | $0 | $0 | $0 |
| Subtotal Cash Spent | $1,355,808 | $1,531,812 | $1,722,810 |
| Net Cash Flow | $87,692 | $88,188 | $207,190 |
| Cash Balance | $122,292 | $210,480 | $417,670 |
7.4 Projected Balance Sheet
The following table presents the projected balance sheet for three years. Monthly figures for the first year are shown in the appendix.
| Pro Forma Balance Sheet | |||
| Year 1 | Year 2 | Year 3 | |
| Assets | |||
| Current Assets | |||
| Cash | $122,292 | $210,480 | $417,670 |
| Inventory | $15,125 | $17,494 | $20,851 |
| Other Current Assets | $0 | $0 | $0 |
| Total Current Assets | $137,417 | $227,975 | $438,521 |
| Long-term Assets | |||
| Long-term Assets | $210,000 | $210,000 | $210,000 |
| Accumulated Depreciation | $28,560 | $57,120 | $85,680 |
| Total Long-term Assets | $181,440 | $152,880 | $124,320 |
| Total Assets | $318,857 | $380,855 | $562,841 |
| Liabilities and Capital | Year 1 | Year 2 | Year 3 |
| Current Liabilities | |||
| Accounts Payable | $48,907 | $72,734 | $83,674 |
| Current Borrowing | $0 | $0 | $0 |
| Other Current Liabilities | $0 | $0 | $0 |
| Subtotal Current Liabilities | $48,907 | $72,734 | $83,674 |
| Long-term Liabilities | $264,288 | $228,576 | $192,864 |
| Total Liabilities | $313,195 | $301,310 | $276,538 |
| Paid-in Capital | $600,000 | $600,000 | $600,000 |
| Retained Earnings | ($625,400) | ($594,338) | ($520,455) |
| Earnings | $31,062 | $73,883 | $206,758 |
| Total Capital | $5,662 | $79,545 | $286,302 |
| Total Liabilities and Capital | $318,857 | $380,855 | $562,841 |
| Net Worth | $5,662 | $79,545 | $286,302 |
7.5 Business Ratios
Business ratios for the years of this plan are shown below. Industry profile ratios based on the Standard Industrial Classification (SIC) code 7997, Membership Sports and Recreation, are shown for comparison.
| Ratio Analysis | ||||
| Year 1 | Year 2 | Year 3 | Industry Profile | |
| Sales Growth | 0.00% | 12.23% | 19.14% | 15.20% |
| Percent of Total Assets | ||||
| Inventory | 4.74% | 4.59% | 3.70% | 4.00% |
| Other Current Assets | 0.00% | 0.00% | 0.00% | 31.80% |
| Total Current Assets | 43.10% | 59.86% | 77.91% | 40.90% |
| Long-term Assets | 56.90% | 40.14% | 22.09% | 59.10% |
| Total Assets | 100.00% | 100.00% | 100.00% | 100.00% |
| Current Liabilities | 15.34% | 19.10% | 14.87% | 31.60% |
| Long-term Liabilities | 82.89% | 60.02% | 34.27% | 28.00% |
| Total Liabilities | 98.22% | 79.11% | 49.13% | 59.60% |
| Net Worth | 1.78% | 20.89% | 50.87% | 40.40% |
| Percent of Sales | ||||
| Sales | 100.00% | 100.00% | 100.00% | 100.00% |
| Gross Margin | 83.77% | 83.27% | 83.26% | 0.00% |
| Selling, General & Administrative Expenses | 81.62% | 78.71% | 72.55% | 72.30% |
| Advertising Expenses | 4.16% | 4.94% | 5.18% | 2.70% |
| Profit Before Interest and Taxes | 5.02% | 8.04% | 16.40% | 2.60% |
| Main Ratios | ||||
| Current | 2.81 | 3.13 | 5.24 | 1.23 |
| Quick | 2.50 | 2.89 | 4.99 | 0.83 |
| Total Debt to Total Assets | 98.22% | 79.11% | 49.13% | 59.60% |
| Pre-tax Return on Net Worth | 783.71% | 132.69% | 103.17% | 2.80% |
| Pre-tax Return on Assets | 13.92% | 27.71% | 52.48% | 6.90% |
| Additional Ratios | Year 1 | Year 2 | Year 3 | |
| Net Profit Margin | 2.15% | 4.56% | 10.71% | n.a |
| Return on Equity | 548.60% | 92.88% | 72.22% | n.a |
| Activity Ratios | ||||
| Inventory Turnover | 10.64 | 16.62 | 16.85 | n.a |
| Accounts Payable Turnover | 15.97 | 12.17 | 12.17 | n.a |
| Payment Days | 27 | 25 | 28 | n.a |
| Total Asset Turnover | 4.53 | 4.25 | 3.43 | n.a |
| Debt Ratios | ||||
| Debt to Net Worth | 55.31 | 3.79 | 0.97 | n.a |
| Current Liab. to Liab. | 0.16 | 0.24 | 0.30 | n.a |
| Liquidity Ratios | ||||
| Net Working Capital | $88,510 | $155,241 | $354,846 | n.a |
| Interest Coverage | 2.58 | 5.28 | 15.02 | n.a |
| Additional Ratios | ||||
| Assets to Sales | 0.22 | 0.24 | 0.29 | n.a |
| Current Debt/Total Assets | 15% | 19% | 15% | n.a |
| Acid Test | 2.50 | 2.89 | 4.99 | n.a |
| Sales/Net Worth | 254.94 | 20.37 | 6.74 | n.a |
| Dividend Payout | 0.00 | 0.00 | 0.00 | n.a |
Appendix
| Sales Forecast | |||||||||||||
| Month 1 | Month 2 | Month 3 | Month 4 | Month 5 | Month 6 | Month 7 | Month 8 | Month 9 | Month 10 | Month 11 | Month 12 | ||
| Sales | |||||||||||||
| Memberships/Use Fees | 0% | $20,000 | $30,000 | $40,000 | $40,000 | $40,000 | $45,000 | $45,000 | $50,000 | $45,000 | $40,000 | $25,000 | $25,000 |
| Day Use Fees (for 1 or more days) | 0% | $20,000 | $20,000 | $20,000 | $30,000 | $30,000 | $35,000 | $35,000 | $40,000 | $35,000 | $30,000 | $15,000 | $15,000 |
| Golf Lessons | 0% | $8,000 | $16,000 | $20,000 | $20,000 | $25,000 | $25,000 | $25,000 | $25,000 | $25,000 | $25,000 | $10,000 | $10,000 |
| Snacks | 0% | $16,000 | $24,000 | $24,000 | $24,000 | $24,000 | $24,000 | $24,000 | $24,000 | $24,000 | $24,000 | $12,000 | $12,000 |
| Pro Shop | 0% | $4,000 | $10,000 | $8,000 | $7,000 | $7,000 | $4,000 | $5,000 | $6,000 | $5,000 | $4,500 | $8,000 | $12,000 |
| Driving Range | 0% | $5,000 | $6,000 | $7,000 | $8,000 | $9,000 | $11,000 | $11,000 | $12,000 | $11,000 | $9,000 | $8,000 | $6,000 |
| Total Sales | $73,000 | $106,000 | $119,000 | $129,000 | $135,000 | $144,000 | $145,000 | $157,000 | $145,000 | $132,500 | $78,000 | $80,000 | |
| Direct Cost of Sales | Month 1 | Month 2 | Month 3 | Month 4 | Month 5 | Month 6 | Month 7 | Month 8 | Month 9 | Month 10 | Month 11 | Month 12 | |
| Memberships/Use Fees | $0 | $0 | $0 | $0 | $0 | $0 | $0 | $0 | $0 | $0 | $0 | $0 | |
| Day Use Fees (for 1 or more days) | $0 | $0 | $0 | $0 | $0 | $0 | $0 | $0 | $0 | $0 | $0 | $0 | |
| Golf Lessons | $4,000 | $8,000 | $10,000 | $10,000 | $12,500 | $12,500 | $12,500 | $12,500 | $12,500 | $12,500 | $5,000 | $5,000 | |
| Snacks | $4,000 | $6,000 | $6,000 | $6,000 | $6,000 | $6,000 | $6,000 | $6,000 | $6,000 | $6,000 | $3,000 | $3,000 | |
| Pro Shop | $1,400 | $4,000 | $3,600 | $3,000 | $3,000 | $1,500 | $2,300 | $2,700 | $2,300 | $1,500 | $3,000 | $4,000 | |
| Driving Range | $1,750 | $1,750 | $1,750 | $1,750 | $1,750 | $1,750 | $1,750 | $1,750 | $1,750 | $1,750 | $1,750 | $1,750 | |
| Subtotal Direct Cost of Sales | $11,150 | $19,750 | $21,350 | $20,750 | $23,250 | $21,750 | $22,550 | $22,950 | $22,550 | $21,750 | $12,750 | $13,750 | |
| Personnel Plan | |||||||||||||
| Month 1 | Month 2 | Month 3 | Month 4 | Month 5 | Month 6 | Month 7 | Month 8 | Month 9 | Month 10 | Month 11 | Month 12 | ||
| Manager | 0% | $4,500 | $4,500 | $4,500 | $4,500 | $4,500 | $4,500 | $4,500 | $4,500 | $4,500 | $4,500 | $4,500 | $4,500 |
| Assistant Manager | 0% | $3,500 | $3,500 | $3,500 | $3,500 | $3,500 | $3,500 | $3,500 | $3,500 | $3,500 | $3,500 | $3,500 | $3,500 |
| Pro Shop Manager/Head Teaching Pro | 0% | $5,000 | $5,000 | $5,000 | $5,000 | $5,000 | $5,000 | $5,000 | $5,000 | $5,000 | $5,000 | $5,000 | $5,000 |
| Greeens/Landscape Superintendent | 0% | $4,000 | $4,000 | $4,000 | $4,000 | $4,000 | $4,000 | $4,000 | $4,000 | $4,000 | $4,000 | $4,000 | $4,000 |
| Course Staff | 0% | $13,000 | $13,000 | $13,000 | $13,000 | $13,000 | $13,000 | $13,000 | $13,000 | $13,000 | $13,000 | $13,000 | $13,000 |
| Snack Shop Staff | 0% | $4,500 | $4,500 | $4,500 | $4,500 | $4,500 | $4,500 | $4,500 | $4,500 | $4,500 | $4,500 | $4,500 | $4,500 |
| Pro Shop Staff | 0% | $4,500 | $4,500 | $4,500 | $4,500 | $4,500 | $4,500 | $4,500 | $4,500 | $4,500 | $4,500 | $4,500 | $4,500 |
| Greens Maintenance Staff | 0% | $4,000 | $4,000 | $4,000 | $4,000 | $4,000 | $4,000 | $4,000 | $4,000 | $4,000 | $4,000 | $4,000 | $4,000 |
| Golf Cart Maintenance Staff | 0% | $6,000 | $6,000 | $6,000 | $6,000 | $6,000 | $6,000 | $6,000 | $6,000 | $6,000 | $6,000 | $6,000 | $6,000 |
| Other | 0% | $0 | $0 | $0 | $0 | $0 | $0 | $0 | $0 | $0 | $0 | $0 | $0 |
| Total People | 24 | 24 | 24 | 24 | 24 | 24 | 24 | 24 | 24 | 24 | 24 | 24 | |
| Total Payroll | $49,000 | $49,000 | $49,000 | $49,000 | $49,000 | $49,000 | $49,000 | $49,000 | $49,000 | $49,000 | $49,000 | $49,000 | |
| General Assumptions | |||||||||||||
| Month 1 | Month 2 | Month 3 | Month 4 | Month 5 | Month 6 | Month 7 | Month 8 | Month 9 | Month 10 | Month 11 | Month 12 | ||
| Plan Month | 1 | 2 | 3 | 4 | 5 | 6 | 7 | 8 | 9 | 10 | 11 | 12 | |
| Current Interest Rate | 10.00% | 10.00% | 10.00% | 10.00% | 10.00% | 10.00% | 10.00% | 10.00% | 10.00% | 10.00% | 10.00% | 10.00% | |
| Long-term Interest Rate | 10.00% | 10.00% | 10.00% | 10.00% | 10.00% | 10.00% | 10.00% | 10.00% | 10.00% | 10.00% | 10.00% | 10.00% | |
| Tax Rate | 30.00% | 30.00% | 30.00% | 30.00% | 30.00% | 30.00% | 30.00% | 30.00% | 30.00% | 30.00% | 30.00% | 30.00% | |
| Other | 0 | 0 | 0 | 0 | 0 | 0 | 0 | 0 | 0 | 0 | 0 | 0 | |
| Pro Forma Profit and Loss | |||||||||||||
| Month 1 | Month 2 | Month 3 | Month 4 | Month 5 | Month 6 | Month 7 | Month 8 | Month 9 | Month 10 | Month 11 | Month 12 | ||
| Sales | $73,000 | $106,000 | $119,000 | $129,000 | $135,000 | $144,000 | $145,000 | $157,000 | $145,000 | $132,500 | $78,000 | $80,000 | |
| Direct Cost of Sales | $11,150 | $19,750 | $21,350 | $20,750 | $23,250 | $21,750 | $22,550 | $22,950 | $22,550 | $21,750 | $12,750 | $13,750 | |
| Other Production Expenses | $0 | $0 | $0 | $0 | $0 | $0 | $0 | $0 | $0 | $0 | $0 | $0 | |
| Total Cost of Sales | $11,150 | $19,750 | $21,350 | $20,750 | $23,250 | $21,750 | $22,550 | $22,950 | $22,550 | $21,750 | $12,750 | $13,750 | |
| Gross Margin | $61,850 | $86,250 | $97,650 | $108,250 | $111,750 | $122,250 | $122,450 | $134,050 | $122,450 | $110,750 | $65,250 | $66,250 | |
| Gross Margin % | 84.73% | 81.37% | 82.06% | 83.91% | 82.78% | 84.90% | 84.45% | 85.38% | 84.45% | 83.58% | 83.65% | 82.81% | |
| Expenses | |||||||||||||
| Payroll | $49,000 | $49,000 | $49,000 | $49,000 | $49,000 | $49,000 | $49,000 | $49,000 | $49,000 | $49,000 | $49,000 | $49,000 | |
| Sales and Marketing and Other Expenses | $5,000 | $5,000 | $5,000 | $5,000 | $5,000 | $5,000 | $5,000 | $5,000 | $5,000 | $5,000 | $5,000 | $5,000 | |
| Depreciation | $2,380 | $2,380 | $2,380 | $2,380 | $2,380 | $2,380 | $2,380 | $2,380 | $2,380 | $2,380 | $2,380 | $2,380 | |
| Leased Equipment | $6,000 | $6,000 | $6,000 | $6,000 | $6,000 | $6,000 | $6,000 | $6,000 | $6,000 | $6,000 | $6,000 | $6,000 | |
| Utilities | $3,000 | $3,000 | $3,000 | $3,000 | $3,000 | $3,000 | $1,500 | $1,300 | $1,300 | $1,300 | $1,300 | $1,300 | |
| Insurance | $2,000 | $2,000 | $2,000 | $2,000 | $2,000 | $2,000 | $2,000 | $2,000 | $2,000 | $2,000 | $2,000 | $2,000 | |
| Lease | $20,833 | $20,833 | $20,833 | $20,833 | $20,833 | $20,833 | $20,833 | $20,833 | $20,833 | $20,833 | $20,833 | $20,837 | |
| Payroll Taxes | 15% | $7,350 | $7,350 | $7,350 | $7,350 | $7,350 | $7,350 | $7,350 | $7,350 | $7,350 | $7,350 | $7,350 | $7,350 |
| Other | $0 | $0 | $0 | $0 | $0 | $0 | $0 | $0 | $0 | $0 | $0 | $0 | |
| Total Operating Expenses | $95,563 | $95,563 | $95,563 | $95,563 | $95,563 | $95,563 | $94,063 | $93,863 | $93,863 | $93,863 | $93,863 | $93,867 | |
| Profit Before Interest and Taxes | ($33,713) | ($9,313) | $2,087 | $12,687 | $16,187 | $26,687 | $28,387 | $40,187 | $28,587 | $16,887 | ($28,613) | ($27,617) | |
| EBITDA | ($31,333) | ($6,933) | $4,467 | $15,067 | $18,567 | $29,067 | $30,767 | $42,567 | $30,967 | $19,267 | ($26,233) | ($25,237) | |
| Interest Expense | $2,475 | $2,450 | $2,426 | $2,401 | $2,376 | $2,351 | $2,326 | $2,302 | $2,277 | $2,252 | $2,227 | $2,202 | |
| Taxes Incurred | ($10,856) | ($3,529) | ($102) | $3,086 | $4,143 | $7,301 | $7,818 | $11,366 | $7,893 | $4,391 | ($9,252) | ($8,946) | |
| Net Profit | ($25,332) | ($8,234) | ($237) | $7,200 | $9,668 | $17,035 | $18,242 | $26,520 | $18,417 | $10,245 | ($21,588) | ($20,874) | |
| Net Profit/Sales | -34.70% | -7.77% | -0.20% | 5.58% | 7.16% | 11.83% | 12.58% | 16.89% | 12.70% | 7.73% | -27.68% | -26.09% | |
| Pro Forma Cash Flow | |||||||||||||
| Month 1 | Month 2 | Month 3 | Month 4 | Month 5 | Month 6 | Month 7 | Month 8 | Month 9 | Month 10 | Month 11 | Month 12 | ||
| Cash Received | |||||||||||||
| Cash from Operations | |||||||||||||
| Cash Sales | $73,000 | $106,000 | $119,000 | $129,000 | $135,000 | $144,000 | $145,000 | $157,000 | $145,000 | $132,500 | $78,000 | $80,000 | |
| Subtotal Cash from Operations | $73,000 | $106,000 | $119,000 | $129,000 | $135,000 | $144,000 | $145,000 | $157,000 | $145,000 | $132,500 | $78,000 | $80,000 | |
| Additional Cash Received | |||||||||||||
| Sales Tax, VAT, HST/GST Received | 0.00% | $0 | $0 | $0 | $0 | $0 | $0 | $0 | $0 | $0 | $0 | $0 | $0 |
| New Current Borrowing | $0 | $0 | $0 | $0 | $0 | $0 | $0 | $0 | $0 | $0 | $0 | $0 | |
| New Other Liabilities (interest-free) | $0 | $0 | $0 | $0 | $0 | $0 | $0 | $0 | $0 | $0 | $0 | $0 | |
| New Long-term Liabilities | $0 | $0 | $0 | $0 | $0 | $0 | $0 | $0 | $0 | $0 | $0 | $0 | |
| Sales of Other Current Assets | $0 | $0 | $0 | $0 | $0 | $0 | $0 | $0 | $0 | $0 | $0 | $0 | |
| Sales of Long-term Assets | $0 | $0 | $0 | $0 | $0 | $0 | $0 | $0 | $0 | $0 | $0 | $0 | |
| New Investment Received | $0 | $0 | $0 | $0 | $0 | $0 | $0 | $0 | $0 | $0 | $0 | $0 | |
| Subtotal Cash Received | $73,000 | $106,000 | $119,000 | $129,000 | $135,000 | $144,000 | $145,000 | $157,000 | $145,000 | $132,500 | $78,000 | $80,000 | |
| Expenditures | Month 1 | Month 2 | Month 3 | Month 4 | Month 5 | Month 6 | Month 7 | Month 8 | Month 9 | Month 10 | Month 11 | Month 12 | |
| Expenditures from Operations | |||||||||||||
| Cash Spending | $49,000 | $49,000 | $49,000 | $49,000 | $49,000 | $49,000 | $49,000 | $49,000 | $49,000 | $49,000 | $49,000 | $49,000 | |
| Bill Payments | $1,193 | $36,799 | $65,859 | $69,622 | $69,991 | $76,610 | $74,012 | $76,367 | $79,381 | $74,604 | $68,939 | $38,718 | |
| Subtotal Spent on Operations | $50,193 | $85,799 | $114,859 | $118,622 | $118,991 | $125,610 | $123,012 | $125,367 | $128,381 | $123,604 | $117,939 | $87,718 | |
| Additional Cash Spent | |||||||||||||
| Sales Tax, VAT, HST/GST Paid Out | $0 | $0 | $0 | $0 | $0 | $0 | $0 | $0 | $0 | $0 | $0 | $0 | |
| Principal Repayment of Current Borrowing | $0 | $0 | $0 | $0 | $0 | $0 | $0 | $0 | $0 | $0 | $0 | $0 | |
| Other Liabilities Principal Repayment | $0 | $0 | $0 | $0 | $0 | $0 | $0 | $0 | $0 | $0 | $0 | $0 | |
| Long-term Liabilities Principal Repayment | $2,976 | $2,976 | $2,976 | $2,976 | $2,976 | $2,976 | $2,976 | $2,976 | $2,976 | $2,976 | $2,976 | $2,976 | |
| Purchase Other Current Assets | $0 | $0 | $0 | $0 | $0 | $0 | $0 | $0 | $0 | $0 | $0 | $0 | |
| Purchase Long-term Assets | $0 | $0 | $0 | $0 | $0 | $0 | $0 | $0 | $0 | $0 | $0 | $0 | |
| Dividends | $0 | $0 | $0 | $0 | $0 | $0 | $0 | $0 | $0 | $0 | $0 | $0 | |
| Subtotal Cash Spent | $53,169 | $88,775 | $117,835 | $121,598 | $121,967 | $128,586 | $125,988 | $128,343 | $131,357 | $126,580 | $120,915 | $90,694 | |
| Net Cash Flow | $19,831 | $17,225 | $1,165 | $7,402 | $13,033 | $15,414 | $19,012 | $28,657 | $13,643 | $5,920 | ($42,915) | ($10,694) | |
| Cash Balance | $54,431 | $71,655 | $72,820 | $80,223 | $93,255 | $108,669 | $127,681 | $156,338 | $169,981 | $175,901 | $132,986 | $122,292 | |
| Pro Forma Balance Sheet | |||||||||||||
| Month 1 | Month 2 | Month 3 | Month 4 | Month 5 | Month 6 | Month 7 | Month 8 | Month 9 | Month 10 | Month 11 | Month 12 | ||
| Assets | Starting Balances | ||||||||||||
| Current Assets | |||||||||||||
| Cash | $34,600 | $54,431 | $71,655 | $72,820 | $80,223 | $93,255 | $108,669 | $127,681 | $156,338 | $169,981 | $175,901 | $132,986 | $122,292 |
| Inventory | $30,000 | $18,850 | $21,725 | $23,485 | $22,825 | $25,575 | $23,925 | $24,805 | $25,245 | $24,805 | $23,925 | $14,025 | $15,125 |
| Other Current Assets | $0 | $0 | $0 | $0 | $0 | $0 | $0 | $0 | $0 | $0 | $0 | $0 | $0 |
| Total Current Assets | $64,600 | $73,281 | $93,380 | $96,305 | $103,048 | $118,830 | $132,594 | $152,486 | $181,583 | $194,786 | $199,826 | $147,011 | $137,417 |
| Long-term Assets | |||||||||||||
| Long-term Assets | $210,000 | $210,000 | $210,000 | $210,000 | $210,000 | $210,000 | $210,000 | $210,000 | $210,000 | $210,000 | $210,000 | $210,000 | $210,000 |
| Accumulated Depreciation | $0 | $2,380 | $4,760 | $7,140 | $9,520 | $11,900 | $14,280 | $16,660 | $19,040 | $21,420 | $23,800 | $26,180 | $28,560 |
| Total Long-term Assets | $210,000 | $207,620 | $205,240 | $202,860 | $200,480 | $198,100 | $195,720 | $193,340 | $190,960 | $188,580 | $186,200 | $183,820 | $181,440 |
| Total Assets | $274,600 | $280,901 | $298,620 | $299,165 | $303,528 | $316,930 | $328,314 | $345,826 | $372,543 | $383,366 | $386,026 | $330,831 | $318,857 |
| Liabilities and Capital | Month 1 | Month 2 | Month 3 | Month 4 | Month 5 | Month 6 | Month 7 | Month 8 | Month 9 | Month 10 | Month 11 | Month 12 | |
| Current Liabilities | |||||||||||||
| Accounts Payable | $0 | $34,608 | $63,538 | $67,296 | $67,434 | $74,146 | $71,470 | $73,716 | $76,889 | $72,271 | $67,662 | $37,031 | $48,907 |
| Current Borrowing | $0 | $0 | $0 | $0 | $0 | $0 | $0 | $0 | $0 | $0 | $0 | $0 | $0 |
| Other Current Liabilities | $0 | $0 | $0 | $0 | $0 | $0 | $0 | $0 | $0 | $0 | $0 | $0 | $0 |
| Subtotal Current Liabilities | $0 | $34,608 | $63,538 | $67,296 | $67,434 | $74,146 | $71,470 | $73,716 | $76,889 | $72,271 | $67,662 | $37,031 | $48,907 |
| Long-term Liabilities | $300,000 | $297,024 | $294,048 | $291,072 | $288,096 | $285,120 | $282,144 | $279,168 | $276,192 | $273,216 | $270,240 | $267,264 | $264,288 |
| Total Liabilities | $300,000 | $331,632 | $357,586 | $358,368 | $355,530 | $359,266 | $353,614 | $352,884 | $353,081 | $345,487 | $337,902 | $304,295 | $313,195 |
| Paid-in Capital | $600,000 | $600,000 | $600,000 | $600,000 | $600,000 | $600,000 | $600,000 | $600,000 | $600,000 | $600,000 | $600,000 | $600,000 | $600,000 |
| Retained Earnings | ($625,400) | ($625,400) | ($625,400) | ($625,400) | ($625,400) | ($625,400) | ($625,400) | ($625,400) | ($625,400) | ($625,400) | ($625,400) | ($625,400) | ($625,400) |
| Earnings | $0 | ($25,332) | ($33,566) | ($33,803) | ($26,603) | ($16,935) | $100 | $18,342 | $44,862 | $63,279 | $73,524 | $51,936 | $31,062 |
| Total Capital | ($25,400) | ($50,732) | ($58,966) | ($59,203) | ($52,003) | ($42,335) | ($25,300) | ($7,058) | $19,462 | $37,879 | $48,124 | $26,536 | $5,662 |
| Total Liabilities and Capital | $274,600 | $280,901 | $298,620 | $299,165 | $303,528 | $316,930 | $328,314 | $345,826 | $372,543 | $383,366 | $386,026 | $330,831 | $318,857 |
| Net Worth | ($25,400) | ($50,732) | ($58,966) | ($59,203) | ($52,003) | ($42,335) | ($25,300) | ($7,058) | $19,462 | $37,879 | $48,124 | $26,536 | $5,662 |

