
RA Concepts
Executive Summary
RA Concepts hopes to make a successful effort to secure start-up financing to begin operation as a golf club manufacturer in the Southern California area.
RA Concepts will meet the ever growing demands for new technology in the golf industry. The company’s initial product offering will be the unique “D” style featherweight putter, with three other designs to follow in the first year of operation.
The “D” style is expected to be very popular among women golfers because of its light weight, multiple color combinations, and other custom options. The technology of the material used, along with the accuracy of the club will allow us to satisfy the avid golfer looking to put her personal “stamp” on a club that improves her game.
Our technology allows us to do what traditional manufacturers cannot. We can make a custom club for any customer, and ship that club within three working days. Traditional manufacturers with old technology cannot produce stock clubs, let alone custom clubs, in less than four weeks.
All clubs will conform to USGA regulations. The “D” design has already been submitted to the USGA for technical approval.
We will market our clubs both to end-users and to the retail golfing supply shops where they will be sold. We are targeting pro shops and high-end, prestige golf retailers by offering them additional draws for female customers. This allows us to show our club in a thousand of shops and stores across America. This network will allow for a rapid entry into the golf market.
1.1 Mission
At RA Concepts, we are committed to giving customers the level of quality and customization they demand. While adhering to USGA regulations, we will produce clubs with better accuracy, lighter weight, and more style than those currently produced by traditional methods.
We will use technology only to improve our products, and not just for the sake of using technology. Changes that do not increase the performance or appearance of the club will not be considered. However, part of our mission is to show golf club manufacturers and retailers that new golf technology is going to out-perform older, established manufacturing methods. We will prove that the future of golf manufacturing lies with high-tech innovations in materials and design, not in standard mass production.
1.2 Keys to Success
RA Concepts’ keys to success will include:
- A high level of quality in its product line.
- Maintaining and growing its referral networks to generate new and repeat sales.
- Significant investments in research and development and engineering with the aim of focusing on new technology.
1.3 Objectives
- Acquire 1% of the sales across the United States and ½% of the world wide market for putters.
- Increase product line to include full range of golf clubs.
- Increase the net profit to a healthy and stable percent of sales by Year 2.
Company Summary
RA Concepts is a privately-owned, start-up manufacturing firm specializing in new technology in golf equipment. Our customers are in all levels of the golfing world.
RA Concepts will be managed by three executives responsible for administration, marketing, sales, and finance. These executives bring many years of experience in the manufacturing industry to the company. They perceive an opportunity to acquire a share of the golfing industry, and by providing greater precision controls to their products than other competitors. The company will be seeking to raise start-up investment captial. The company will have one manufacturing facility in California. In the long-term, there are expectations of another manufacturing plant in Colorado Springs.
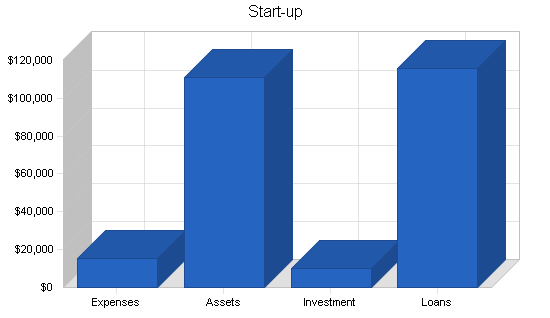
2.1 Start-up Summary
The projected start-up costs during the first month are production related: machinery, equipment needed for the production line, and the raw materials to manufacture products for the expected demand. We have already developed several prototypes for D and V putters which are ready for production, and more innovative designs are in the R&D stages.
| Long Term Assets |
|
| Ford Ranger Edge Super Cab |
$15,715 |
| CNC Machine |
$43,245 |
| Sanding Machines |
$3,200 |
| Total Long Term Assets |
$62,160 |
| Start Up Inventory (for 1000 units) | |
| Sheet material, acrylic and polyester blend stock, assorted colors |
$10,000 |
| Shafts (True Temper) |
$4,950 |
| Grips (Winn) |
$4,950 |
| Head Cover |
$3,950 |
| Ball Markers |
$1,350 |
| Total Start up Inventory (for 1000 units) |
$25,200 |
The start up material is based on one thousand units, so we can take advantage of price breaks and incentives, as in free logo placement on grips and head covers. Based on communications with suppliers and retail businesses, we determined that we will be operational within one month after financing is in place.
| Start-up | |
| Requirements | |
| Start-up Expenses | |
| Legal | $7,200 |
| Stationery etc. | $1,800 |
| Brochures | $1,300 |
| Consultants | $500 |
| Insurance | $300 |
| Rent | $1,100 |
| Research and Development | $350 |
| Expensed Equipment | $2,200 |
| Other | $400 |
| Total Start-up Expenses | $15,150 |
| Start-up Assets | |
| Cash Required | $23,490 |
| Start-up Inventory | $25,200 |
| Other Current Assets | $0 |
| Long-term Assets | $62,160 |
| Total Assets | $110,850 |
| Total Requirements | $126,000 |
| Start-up Funding | |
| Start-up Expenses to Fund | $15,150 |
| Start-up Assets to Fund | $110,850 |
| Total Funding Required | $126,000 |
| Assets | |
| Non-cash Assets from Start-up | $87,360 |
| Cash Requirements from Start-up | $23,490 |
| Additional Cash Raised | $0 |
| Cash Balance on Starting Date | $23,490 |
| Total Assets | $110,850 |
| Liabilities and Capital | |
| Liabilities | |
| Current Borrowing | $0 |
| Long-term Liabilities | $116,000 |
| Accounts Payable (Outstanding Bills) | $0 |
| Other Current Liabilities (interest-free) | $0 |
| Total Liabilities | $116,000 |
| Capital | |
| Planned Investment | |
| Randy Comstock | $8,000 |
| Alan Comstock | $2,000 |
| Other | $0 |
| Additional Investment Requirement | $0 |
| Total Planned Investment | $10,000 |
| Loss at Start-up (Start-up Expenses) | ($15,150) |
| Total Capital | ($5,150) |
| Total Capital and Liabilities | $110,850 |
| Total Funding | $126,000 |
2.2 Company Ownership
RA Concepts is a private partnership owned by:
- Randy Comstock: The designer and head of all manufacturing, research,and the day-to-day operations.
- Alan Comstock: Financial Manager, working with the day-to-day operation.
Products
RA Concepts has several different putter designs in the works. We have several prototypes of our D model, one each of our V model and Scorpion putters, and another (the W) is in the design phase. The D model design and prototype have already been submitted to the USGA for approval, and should be ready for production soon.
Details of each follow:
“D” Putters
These clubs are a new concept in material and design. The material is an acrylic polymer and polyester polymer blend. By using these materials this allows us to be able to control perimeter weighting. These materials are available in different colors that allow us to customize the putter to almost any color combination. Our technology is not that of the old school of casting. Instead, by using the state of the art CNC machines, we can make hundreds of putters at the same time that are exactly the same in color and weight, or hundreds of putters that are completely customized to individual orders.
The design of the “D” putter has a parameter ring that houses the acrylic and tungsten weighting. Placing the weight in this area allows the putter to have a larger sweet spot. This enables the ball to roll off the club head with increased accuracy. To decrease the twisting of the head when the ball impacts the putter head, our technology allows us to run the shaft insert across the face of the putter from the entry point to the toe of the club.
The design of the “D” putter has a large center area behind the face of the club that allows us to place additional weight if desired, and has an area that can hold either a ball marker or an acrylic filled logo that can we can match to existing or customized design.

This design has been submitted to USGA for technical approval and we have several prototypes manufactured.
“V” Putters
These clubs utilize the same polymer blends in material and CNC technology as the “D” putter, but that’s where the similarity stops.
The “V” putter includes three vertical bars that attach at the rear with a slight bending bar. The two outer bars with the offsetting tungsten weight once again help with head twisting, but more importantly, they increase the sweet spot, to increase accuracy. The center bar allows for additional weighting and a longer site line.
The shaft insert is used once again for head twisting but its job is two-fold. By redesigning the insert, we can transfer the impact energy of the ball to the outer bars, this energy travels down the outer bars and meets at the center of the rear center bar. At this point, without the insert in the way, the energy travels up the center bar, allowing the club head to remain balanced during the shot.
We have one prototype made and are in testing. This putter should be available two months after start up.
“W” Putters
These will use utilizes the same polymer blends in material and CNC technology as the “D” and “V” but this putter is being design primarily to be used as a belly putter or a long putter.
This putter is currently in design and development, and should be available five months after the start up.
We have one other putter on the drawing board, radical in both design and material. This design will bring our materials and technology to the category of the Irons.
“An ‘iron’ club is one where the head is relatively narrow from face to back, and it is usually made of steel. The whole of the impact area must be of the same material. Exceptions may be made for wooden clubs.”
–Quote from the USGA rule book on Iron’s.
The “Scorpion”
This putter will use the CNC technology, but the material now turns to a urethane blend and tungsten. The design is pushing the limits of the USGA regulations, and with its unique look, could be our best seller The Scorpion is still in research and development. The current USGA definition of “Irons” does not allow traditional manufacturers of clubs to change the way the make Irons today.
However, we have developed a wedge that is manufactured from urethane and tungsten. Our technology allows us to float the tungsten weight from the top to the bottom; this creates a feathering effect from the top to bottom that has more weight at the bottom of the club, to increase accuracy and control. Approval of this club by the USGA will hinge on the definition of “the impact area.” We are working with USGA officers to introduce this new design and prepare the groundwork for re-examining the details of the Iron rules.
We have one prototype of the Scorpion that is currently being tested.
Market Analysis Summary
Our target market end-user wants to have a very fine putter, with the latest in technology, combined with the ability to be fully customized. This person can be at any skill level, from the beginner to the touring professional. The primary target segment at first will be the female golfer, who likes the featherweight touch, different colors, and the personal touch that we can provide.
With millions of golfers and our new technology, we have an opportunity to reach a market of approximately 26 million recreational and professional golfers.
The golfing consumer is currently exploring the benefits of items made with new technology. This increased interest in special materials and designs goes hand in hand with a desire for “personalized” sporting equipment. Golf is a prestige sport; golfing consumers demand personal attention, high-end products, and a prestige value in their purchasing choices. RA Concepts’ high-tech, customized putters will fill these market needs, and consumers will “pull” our product through distribution channels by demanding access to our high-quality putters.
From the distribution side, our target market is high-end retail golf shops catering to these targeted end-users. They want high-profit margin goods that will draw customers into the store, and practically sell themselves. They also want the kind of quality product that allows the retailer to demonstrate his superior knowledge of the sport; this encourages consumer trust in that retailer, and assures repeat business for accessories and other golfing purchases.
4.1 Market Segmentation
With a steadily growing world golfer market of more than 26 million (according to the Sporting Goods Manufacturers Association), our niche has been created. Our aim is to expand this market by promoting new technology.
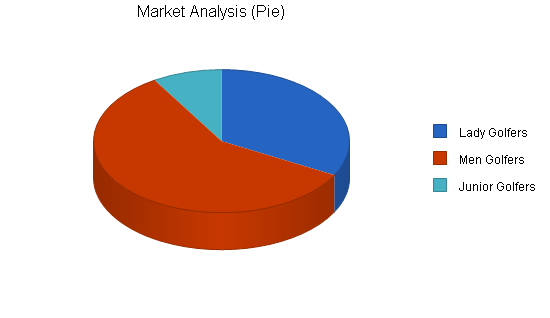
The Sporting Goods Manufacturers Association survey indicates that golf now has more participation than football, softball, skiing, and snow boarding combined. The breakdown of participation in golf is as follows: 1% Professional, 63% men, 32% women , 4% youth, with 81% recreational golfers. Our products are targeting the lady golfer/recreational group, because they are the fastest growing segment in the golfing industry. Since our primary target segment is female golfers, we are going with the more conservative estimate from the National Golf Foundation, 22% of American adult golfers, not 32%.
The following table outlines our potential market segments over the next five years. This is a very conservative estimate – we are looking to gain 2% of the American female golfing market, 1% of the male golfing market, and .5% of the juniors golfing market. The National Golf Foundation broke down total American Golfers as follows:
- Female golfers: 5.76 million
- Male golfers: 20.44 million
- Junior golfers (5-17 years old): 6.1 million
| Market Analysis | |||||||
| Year 1 | Year 2 | Year 3 | Year 4 | Year 5 | |||
| Potential Customers | Growth | CAGR | |||||
| Lady Golfers | 8% | 115,200 | 124,416 | 134,369 | 145,119 | 156,728 | 8.00% |
| Men Golfers | 5% | 204,400 | 214,620 | 225,351 | 236,619 | 248,449 | 5.00% |
| Junior Golfers | 2% | 30,500 | 31,110 | 31,732 | 32,367 | 33,014 | 2.00% |
| Total | 5.77% | 350,100 | 370,146 | 391,452 | 414,104 | 438,192 | 5.77% |
4.2 Target Market Segment Strategy
Our segment definition is of itself strategic. We are not intending to satisfy all golfers, but only those who are most demanding. We are definitely out to address the needs of the high-end buyer who is willing to pay more for quality. In our particular market, we also seek the buyer who appreciates two attributes: the quality of club workmanship and the excellence of design, with an understanding of new technology.
According to the National Golf Foundation, “Avid golfers (25+ rounds annually) make up the smallest player segment (23 percent), but accounted for 63 percent of all golf-related spending in 2002.” Our clubs are an investment; they repay the consumer with high-quality performance, prestige value, and greater enjoyment of their game. For the avid golfer, our products are part of their normal disposable income decisions. Our challenge is not to get them into the golfing supply shops, but to get them to choose our products over another manufacturer’s.
Our marketing will appeal to their good taste, committment to the sport, and vanity, advertising our clubs with same sort of flair used to sell custom-tailored clothing and custom-designed houses. We will target retail shops with demographics matching our targeted end-users. Their existing knowledge of their client base will make our advantages clear.
4.3 Industry Analysis
The industry is dominated by a few very large companies, such as Callaway, Ping, Taylormade, and Titleist. Each of these giants has large or multi-segment marketing strategies that provide general equipment for large blocks of customers.
Customers who purchase golf equipment require reliability and are influenced by reputation and cost, since golf equipment purchases can range from less than twenty, to thousands of dollars.
4.3.1 Competition and Buying Patterns
There is no direct competition to RA Concepts: no similar golf clubs exist today. The inventor, Randy Comstock, has the sole rights of utilizing the patent (pending) worldwide. This patent (pending) gives very wide protection to the revolutionary invention of special materials and to the process of making golf clubs. The “competition” comes from golf clubs made of other materials, like steel and other metal alloys.
To our target market, there is no choice between price and performance; performance is always the goal. However, what kind of performance they need depends on their skill level and individual quirks.
Consumers in our target market are avid golfers. They know their strengths and weaknesses, and seek out products that will improve their particular game (game improvement clubs). While a large sweet-spot is always desirable, designing for the largest sweet spot can leave less room to correct other common swing errors. Our competitors’ clubs usually offer a choice between a big sweet spot and perimeter weighting that is shifted to cure toe-miss-hits and to help get the ball up in the air. Most of our new designs allow for both.
The professional or truly accomplished golfer is seeking a club that will not over-correct his or her shots. They are seeking exactly the opposite of the game improvement club – they want a club that accurately transmits the slightest nuances of their hit directly to the ball. The Scorpion is targeted at these consumers.
The one big division in our target market is gender-based. Female golfers are usually looking for less weight and different shaft stiffness than their male counterparts. Our products are lightweight, and can work with a variety of custom shafts to fit the whole club to the individual golfer.
Strategy and Implementation Summary
We focus on a special kind of customer, the person who wants a very high quality golf clubs customized to his or her personal preference. Our customer will purchase the club because of the way it looks, but will use it because of the way the new technology allows them to play better.
Our marketing strategy assumes that we need to go into golf shops, pro shops, and other retail outlets to address and pinpoint our customer needs. We will offer free seminars and demonstrations of the clubs, first to retail managers and buyers, and then in individual retail shops as special events directly to our targeted consumers.
The sales strategy is based on the high quality of our products, from the combination of technical design understanding with very high quality materials and workmanship.
Our most important competitive edge is our material, which is based on a special sanding process of such high quality that assembly is not only a pleasure for our customers, it is actually a feature that enhances the sense of quality and feel.
5.1 Competitive Edge
Our competitive edge is our high-technology design and manufacturing process. With new generation materials and high-quality club workmanship, our products themselves are higher quality, more easily produced, and more customizable than those of our competitors. Although there are many golf manufacturers, none have brought technology and design together as we have.
5.2 Marketing Strategy
RA Concepts’ revolutionary proprietary technology and materials positions the company to be a leader in new putter design. RA Concepts offers a novel approach that clearly provides significant value to our customer (retail shops) and ultimately the end user.
In marketing directed at retail stores, we will offer a combination of programs:
- In-house seminars on the production and design of our putters, to educate the buyers/resellers on our products’ advantages and features
- Cost comparisons of our products with competitors’ products
- Companion advertising – we will join with the retailers in customizing advertising for their locale and age segment, to increase consumer interest in our product at their store
In marketing directed at end users (golfers), we will place ads in several specialty golfing magazines, send free clubs to the top one hundred American golfers and golfing magazine editors for their own review, and offer tours of the facility to interested golfers, so they can see for themselves our unique production process.
We have already received offers for short documentary-type spots on our new technological processes from a sports channel as part of a “high-tech and sports” series, and will pursue the newsworthiness of our products as part of our marketing campaign.
5.3 Sales Strategy
Our strategy focuses first on maintaining the identity with the high-end buyer who appreciates the best available quality, but is also very demanding regarding his/her golf game. We’ve been able to find these customers using a combination of pro shops and other retail stores.
For the next year, we will continue to focus on increasing our presence in the golf shops that target our specialty customer. We will work with golf shops and retail stores more than ever, and we expect to gain position in the pro shops as well. Specialty retail is a new channel that could become important for us. The key to our sales strategy is long-term relationships with retail buyers. These buyers make major, million dollar decisions for their stores every day, and will not buy products from people they don’t trust. Our affiliation with Van Russel, our pro-golfing sales associate, will go a long way in establishing our credibility during initial contacts. However, the design of the clubs almost sells itself – their advantages in price, turn-around time for custom work, and quality will compare favorably with any other high-end golf club on the market.
Although our forecasts here are conservative, RA Concepts anticipates that our limited production will cause our five-year plan to be revised in order to meet the demand. Our first plant is expected to produce approximately 2,000 golf clubs in the first year and 2,500 from the second year forward. The market for golf equipment is in excess of 800 million dollars annually. This takes a great part of the risk out of our project.
5.3.1 Sales Forecast
Our sales forecast is based on a conservative estimate of selling roughly 2230 putters at ~$79.60 apiece to retailers in the first year. These will mostly be D putters, since that design is the most ready to ramp up for production with increases in our other models in years 2 and 3.
Suggested retail price for the clubs is $150, a comfortable profit margin for most high-end retailers.
In year 2, we expect to be reaching full capacity with production, which will allow us to increase sales significantly. We expect year 2 sales to be roughly twice year 1 sales. Despite the large growth, these estimates are fairly conservative, based on interest we have already received from high-end retail golfing shops.


| Sales Forecast | |||
| Year 1 | Year 2 | Year 3 | |
| Sales | |||
| D Putter | $107,775 | $118,552 | $130,407 |
| V Putter | $42,984 | $70,923 | $78,015 |
| W Putter | $18,308 | $60,416 | $66,457 |
| Scorpion | $8,358 | $55,162 | $60,678 |
| Total Sales | $177,425 | $305,053 | $335,557 |
| Direct Cost of Sales | Year 1 | Year 2 | Year 3 |
| Putter Cost | $50,034 | $86,603 | $95,259 |
| Other | $0 | $0 | $0 |
| Subtotal Direct Cost of Sales | $50,034 | $86,603 | $95,259 |
Management Summary
Randy Comstock
Randy has twenty years in the golf club manufacturing industry, with the last ten years in design and project management. Randy is in charge of design and production.
Alan Comstock
Alan has a degree in accounting and experience as a controller in the golfing retail industry. 12 years ago, he started an air pollution control business, then sold it as a profitable entity ten years later to a larger corporation; Alan is coming out of retirement to run the financial aspects of RA Concepts. Alan will organize marketing operations in tandem with our selected retail agents.
Van Russell
Van is a PGA golf professional who has been teaching for last fifteen years. He owns a golf club refurbishing and retail sales company in the Colorado Springs area, and brings a large amount of the golfing industry knowledge. Van Russell will be in charge of sales, and will work with Alan on marketing.
6.1 Personnel Plan
Randy Comstock is the only full time employee. Alan Comstock is a part time employee, with a base salary plus incentives as sales increase.
Van Russell’s salary will be based on the amount of sales in his region, starting at a part-time base salary.
| Personnel Plan | |||
| Year 1 | Year 2 | Year 3 | |
| Randy Comstock | $30,000 | $33,000 | $36,300 |
| Alan Comstock | $9,147 | $14,501 | $16,711 |
| Van Russell | $19,671 | $16,153 | $17,678 |
| Total People | 3 | 3 | 3 |
| Total Payroll | $58,819 | $63,654 | $70,689 |
Financial Plan
We do not expect Cash flow to be a problem. Since initial sales (first 6 months) will not cover expenses, we have budgeted a cash reserve to take us through the first year, and have additional resources for short-term, no-interest loans if necessary. We expect to generate a profit within the first six months, and even with this conservative forecast, we expect modest profits in the second year.
We plan to pace growth slowly at first until we have a larger, more stable cash balance. RA Concepts’ growth is based on internal financial resources.
7.1 Important Assumptions
- 100% of sales are on credit, with collection days for Receivables at 60.
- Payment days for Accounts Payable at 30.
- No unforeseen changes in technology to make our products obsolete.
- Only moderate increases or decreases in our raw material costs over time.
- A 5% annual raise in prices, typical for the golfing industry.
Due to the initial limited production in comparison to the market size, RA Concepts assumes that even a slow-growth economy will not affect our plan for the next five years.
RA Concepts assumes no substantial increases in our material costs, given the recent history of those supplies. In addition, as we buy raw materials in greater quantities in years 2 and 3, we should start to see economies of scale.
| General Assumptions | |||
| Year 1 | Year 2 | Year 3 | |
| Plan Month | 1 | 2 | 3 |
| Current Interest Rate | 10.00% | 10.00% | 10.00% |
| Long-term Interest Rate | 6.00% | 6.00% | 6.00% |
| Tax Rate | 30.00% | 30.00% | 30.00% |
| Other | 0 | 0 | 0 |
7.2 Break-even Analysis
RA Concepts’ break-even analysis is based on the average of the first-year figures for total sales, costs, and operating expenses. Our variable cost here consists of inventory (raw materials). We expect to surpass the break-even point by July.

| Break-even Analysis | |
| Monthly Revenue Break-even | $11,862 |
| Assumptions: | |
| Average Percent Variable Cost | 28% |
| Estimated Monthly Fixed Cost | $8,517 |
7.3 Projected Profit and Loss
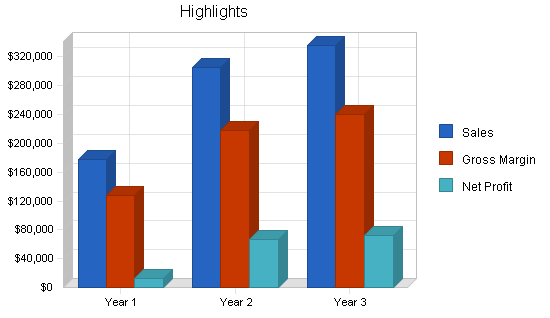
As the profit and loss table shows, RA Concepts forecasts steady growth in profitability over the next three years of operations. We show increased R&D costs in years 2 and 3 because putters are constantly changing; we expect feedback from customers and special requests to generate ideas for new designs, and we expect customers to show continued interest in the “newest,” most up to date designs over existing ones.


| Pro Forma Profit and Loss | |||
| Year 1 | Year 2 | Year 3 | |
| Sales | $177,425 | $305,053 | $335,557 |
| Direct Cost of Sales | $50,034 | $86,603 | $95,259 |
| Other Costs of Goods | $0 | $0 | $0 |
| Total Cost of Sales | $50,034 | $86,603 | $95,259 |
| Gross Margin | $127,391 | $218,450 | $240,298 |
| Gross Margin % | 71.80% | 71.61% | 71.61% |
| Expenses | |||
| Payroll | $58,819 | $63,654 | $70,689 |
| Sales and Marketing and Other Expenses | $17,900 | $19,360 | $21,296 |
| Depreciation | $1,200 | $1,100 | $1,100 |
| Rent | $13,200 | $12,100 | $12,100 |
| Research and Development | $4,000 | $10,000 | $12,000 |
| Equipment Maintenance and Repair | $0 | $5,000 | $8,500 |
| Utilities | $4,380 | $4,416 | $4,857 |
| Insurance | $1,200 | $1,100 | $1,100 |
| Payroll Taxes | $0 | $0 | $0 |
| Other | $1,500 | $1,512 | $1,663 |
| Total Operating Expenses | $102,199 | $118,242 | $133,305 |
| Profit Before Interest and Taxes | $25,192 | $100,208 | $106,993 |
| EBITDA | $26,392 | $101,308 | $108,093 |
| Interest Expense | $6,489 | $5,655 | $4,785 |
| Taxes Incurred | $5,611 | $28,366 | $30,662 |
| Net Profit | $13,093 | $66,187 | $71,546 |
| Net Profit/Sales | 7.38% | 21.70% | 21.32% |
7.4 Projected Cash Flow
The table presents our projected cash flow balances. The critical first year reflects positive cash flow. Monthly cash balances are positive, which indicates adequate financial reserves and correct planning for the required working capital. The estimated results permit a margin of error and still appear strong, even though the numbers remain conservative. We expect that the low cash balance in the final month of the first year will be offset by spring sales to retailers in the next month. We do not plan to collect dividends until the fourth year.
The following chart shows the cash availability for the next 12 months. The bar labeled “Cash Balance” shows our projected cash balance for the first 12 months of the project. The second set of bars, labeled “Net Cash Flow”, indicates the change in the Cash Balance for each month.

| Pro Forma Cash Flow | |||
| Year 1 | Year 2 | Year 3 | |
| Cash Received | |||
| Cash from Operations | |||
| Cash Sales | $0 | $0 | $0 |
| Cash from Receivables | $128,939 | $270,176 | $327,221 |
| Subtotal Cash from Operations | $128,939 | $270,176 | $327,221 |
| Additional Cash Received | |||
| Sales Tax, VAT, HST/GST Received | $0 | $0 | $0 |
| New Current Borrowing | $0 | $0 | $0 |
| New Other Liabilities (interest-free) | $0 | $0 | $0 |
| New Long-term Liabilities | $0 | $0 | $0 |
| Sales of Other Current Assets | $0 | $0 | $0 |
| Sales of Long-term Assets | $0 | $0 | $0 |
| New Investment Received | $0 | $0 | $0 |
| Subtotal Cash Received | $128,939 | $270,176 | $327,221 |
| Expenditures | Year 1 | Year 2 | Year 3 |
| Expenditures from Operations | |||
| Cash Spending | $58,819 | $63,654 | $70,689 |
| Bill Payments | $72,830 | $173,380 | $191,356 |
| Subtotal Spent on Operations | $131,649 | $237,034 | $262,045 |
| Additional Cash Spent | |||
| Sales Tax, VAT, HST/GST Paid Out | $0 | $0 | $0 |
| Principal Repayment of Current Borrowing | $0 | $0 | $0 |
| Other Liabilities Principal Repayment | $0 | $0 | $0 |
| Long-term Liabilities Principal Repayment | $14,500 | $14,500 | $14,500 |
| Purchase Other Current Assets | $0 | $0 | $0 |
| Purchase Long-term Assets | $0 | $0 | $0 |
| Dividends | $0 | $0 | $0 |
| Subtotal Cash Spent | $146,149 | $251,534 | $276,545 |
| Net Cash Flow | ($17,209) | $18,642 | $50,676 |
| Cash Balance | $6,281 | $24,923 | $75,599 |
7.5 Projected Balance Sheet
Our projected Balance Sheet shows a steadily increasing net worth, as we pay off loans and increase production over the first three years. Even with these conservative estimates, our balances are good.
| Pro Forma Balance Sheet | |||
| Year 1 | Year 2 | Year 3 | |
| Assets | |||
| Current Assets | |||
| Cash | $6,281 | $24,923 | $75,599 |
| Accounts Receivable | $48,486 | $83,363 | $91,699 |
| Inventory | $7,780 | $7,251 | $7,976 |
| Other Current Assets | $0 | $0 | $0 |
| Total Current Assets | $62,547 | $115,537 | $175,274 |
| Long-term Assets | |||
| Long-term Assets | $62,160 | $62,160 | $62,160 |
| Accumulated Depreciation | $1,200 | $2,300 | $3,400 |
| Total Long-term Assets | $60,960 | $59,860 | $58,760 |
| Total Assets | $123,507 | $175,397 | $234,034 |
| Liabilities and Capital | Year 1 | Year 2 | Year 3 |
| Current Liabilities | |||
| Accounts Payable | $14,064 | $14,267 | $15,859 |
| Current Borrowing | $0 | $0 | $0 |
| Other Current Liabilities | $0 | $0 | $0 |
| Subtotal Current Liabilities | $14,064 | $14,267 | $15,859 |
| Long-term Liabilities | $101,500 | $87,000 | $72,500 |
| Total Liabilities | $115,564 | $101,267 | $88,359 |
| Paid-in Capital | $10,000 | $10,000 | $10,000 |
| Retained Earnings | ($15,150) | ($2,057) | $64,130 |
| Earnings | $13,093 | $66,187 | $71,546 |
| Total Capital | $7,943 | $74,130 | $145,675 |
| Total Liabilities and Capital | $123,507 | $175,397 | $234,034 |
| Net Worth | $7,943 | $74,130 | $145,675 |
7.6 Business Ratios
Business ratios for the years of this plan are shown below. Industry profile ratios based on the Standard Industrial Classification for the Sporting Goods Manufacturing industry (SIC code 3069).
Our technological advances allow us to waste less raw material during production, changing ratios related to inventory. Our asset and liability structure is comparable to industry standards, but we are a smaller company than most golf club manufacturers, and the industry comparison is very broad – across all equipment categories. The ratios table shows an important steady increase in working capital, a a reasonable net profit margin for all years.
| Ratio Analysis | ||||
| Year 1 | Year 2 | Year 3 | Industry Profile | |
| Sales Growth | 0.00% | 71.93% | 10.00% | 8.66% |
| Percent of Total Assets | ||||
| Accounts Receivable | 39.26% | 47.53% | 39.18% | 30.00% |
| Inventory | 6.30% | 4.13% | 3.41% | 23.04% |
| Other Current Assets | 0.00% | 0.00% | 0.00% | 22.61% |
| Total Current Assets | 50.64% | 65.87% | 74.89% | 75.65% |
| Long-term Assets | 49.36% | 34.13% | 25.11% | 24.35% |
| Total Assets | 100.00% | 100.00% | 100.00% | 100.00% |
| Current Liabilities | 11.39% | 8.13% | 6.78% | 37.93% |
| Long-term Liabilities | 82.18% | 49.60% | 30.98% | 14.30% |
| Total Liabilities | 93.57% | 57.74% | 37.75% | 52.23% |
| Net Worth | 6.43% | 42.26% | 62.25% | 47.77% |
| Percent of Sales | ||||
| Sales | 100.00% | 100.00% | 100.00% | 100.00% |
| Gross Margin | 71.80% | 71.61% | 71.61% | 22.53% |
| Selling, General & Administrative Expenses | 26.12% | 0.00% | 0.00% | 5.73% |
| Advertising Expenses | 0.00% | 0.00% | 0.00% | 0.36% |
| Profit Before Interest and Taxes | 14.20% | 32.85% | 31.89% | 2.95% |
| Main Ratios | ||||
| Current | 4.45 | 8.10 | 11.05 | 1.88 |
| Quick | 3.89 | 7.59 | 10.55 | 1.19 |
| Total Debt to Total Assets | 93.57% | 57.74% | 37.75% | 53.00% |
| Pre-tax Return on Net Worth | 235.49% | 127.55% | 70.16% | 4.52% |
| Pre-tax Return on Assets | 15.14% | 53.91% | 43.67% | 9.61% |
| Additional Ratios | Year 1 | Year 2 | Year 3 | |
| Net Profit Margin | 7.38% | 21.70% | 21.32% | n.a |
| Return on Equity | 164.84% | 89.29% | 49.11% | n.a |
| Activity Ratios | ||||
| Accounts Receivable Turnover | 3.66 | 3.66 | 3.66 | n.a |
| Collection Days | 56 | 79 | 95 | n.a |
| Inventory Turnover | 4.31 | 11.52 | 12.51 | n.a |
| Accounts Payable Turnover | 6.18 | 12.17 | 12.17 | n.a |
| Payment Days | 27 | 30 | 28 | n.a |
| Total Asset Turnover | 1.44 | 1.74 | 1.43 | n.a |
| Debt Ratios | ||||
| Debt to Net Worth | 14.55 | 1.37 | 0.61 | n.a |
| Current Liab. to Liab. | 0.12 | 0.14 | 0.18 | n.a |
| Liquidity Ratios | ||||
| Net Working Capital | $48,483 | $101,270 | $159,416 | n.a |
| Interest Coverage | 3.88 | 17.72 | 22.36 | n.a |
| Additional Ratios | ||||
| Assets to Sales | 0.70 | 0.57 | 0.70 | n.a |
| Current Debt/Total Assets | 11% | 8% | 7% | n.a |
| Acid Test | 0.45 | 1.75 | 4.77 | n.a |
| Sales/Net Worth | 22.34 | 4.12 | 2.30 | n.a |
| Dividend Payout | 0.00 | 0.00 | 0.00 | n.a |
Appendix
| Sales Forecast | |||||||||||||
| Month 1 | Month 2 | Month 3 | Month 4 | Month 5 | Month 6 | Month 7 | Month 8 | Month 9 | Month 10 | Month 11 | Month 12 | ||
| Sales | |||||||||||||
| D Putter | 0% | $0 | $9,552 | $10,507 | $8,358 | $9,154 | $10,029 | $11,064 | $12,178 | $7,960 | $8,756 | $9,631 | $10,586 |
| V Putter | 0% | $0 | $0 | $0 | $3,980 | $4,378 | $4,776 | $5,174 | $5,572 | $3,980 | $4,378 | $5,174 | $5,572 |
| W Putter | 0% | $0 | $0 | $0 | $0 | $0 | $0 | $0 | $0 | $3,980 | $4,378 | $4,776 | $5,174 |
| Scorpion | 0% | $0 | $0 | $0 | $0 | $0 | $0 | $0 | $0 | $0 | $0 | $3,980 | $4,378 |
| Total Sales | $0 | $9,552 | $10,507 | $12,338 | $13,532 | $14,805 | $16,238 | $17,750 | $15,920 | $17,512 | $23,561 | $25,710 | |
| Direct Cost of Sales | Month 1 | Month 2 | Month 3 | Month 4 | Month 5 | Month 6 | Month 7 | Month 8 | Month 9 | Month 10 | Month 11 | Month 12 | |
| Putter Cost | $0 | $2,712 | $2,983 | $3,503 | $3,842 | $4,204 | $4,610 | $5,039 | $4,520 | $4,972 | $6,576 | $7,073 | |
| Other | $0 | $0 | $0 | $0 | $0 | $0 | $0 | $0 | $0 | $0 | $0 | $0 | |
| Subtotal Direct Cost of Sales | $0 | $2,712 | $2,983 | $3,503 | $3,842 | $4,204 | $4,610 | $5,039 | $4,520 | $4,972 | $6,576 | $7,073 | |
| Personnel Plan | |||||||||||||
| Month 1 | Month 2 | Month 3 | Month 4 | Month 5 | Month 6 | Month 7 | Month 8 | Month 9 | Month 10 | Month 11 | Month 12 | ||
| Randy Comstock | 0% | $2,500 | $2,500 | $2,500 | $2,500 | $2,500 | $2,500 | $2,500 | $2,500 | $2,500 | $2,500 | $2,500 | $2,500 |
| Alan Comstock | 0% | $500 | $500 | $500 | $747 | $771 | $796 | $825 | $855 | $818 | $850 | $971 | $1,014 |
| Van Russell | 0% | $900 | $1,378 | $1,425 | $1,517 | $1,577 | $1,640 | $1,712 | $1,788 | $1,696 | $1,776 | $2,078 | $2,186 |
| Total People | 3 | 3 | 3 | 3 | 3 | 3 | 3 | 3 | 3 | 3 | 3 | 3 | |
| Total Payroll | $3,900 | $4,378 | $4,425 | $4,764 | $4,847 | $4,936 | $5,037 | $5,143 | $5,014 | $5,126 | $5,549 | $5,700 | |
| General Assumptions | |||||||||||||
| Month 1 | Month 2 | Month 3 | Month 4 | Month 5 | Month 6 | Month 7 | Month 8 | Month 9 | Month 10 | Month 11 | Month 12 | ||
| Plan Month | 1 | 2 | 3 | 4 | 5 | 6 | 7 | 8 | 9 | 10 | 11 | 12 | |
| Current Interest Rate | 10.00% | 10.00% | 10.00% | 10.00% | 10.00% | 10.00% | 10.00% | 10.00% | 10.00% | 10.00% | 10.00% | 10.00% | |
| Long-term Interest Rate | 6.00% | 6.00% | 6.00% | 6.00% | 6.00% | 6.00% | 6.00% | 6.00% | 6.00% | 6.00% | 6.00% | 6.00% | |
| Tax Rate | 30.00% | 30.00% | 30.00% | 30.00% | 30.00% | 30.00% | 30.00% | 30.00% | 30.00% | 30.00% | 30.00% | 30.00% | |
| Other | 0 | 0 | 0 | 0 | 0 | 0 | 0 | 0 | 0 | 0 | 0 | 0 | |
| Pro Forma Profit and Loss | |||||||||||||
| Month 1 | Month 2 | Month 3 | Month 4 | Month 5 | Month 6 | Month 7 | Month 8 | Month 9 | Month 10 | Month 11 | Month 12 | ||
| Sales | $0 | $9,552 | $10,507 | $12,338 | $13,532 | $14,805 | $16,238 | $17,750 | $15,920 | $17,512 | $23,561 | $25,710 | |
| Direct Cost of Sales | $0 | $2,712 | $2,983 | $3,503 | $3,842 | $4,204 | $4,610 | $5,039 | $4,520 | $4,972 | $6,576 | $7,073 | |
| Other Costs of Goods | $0 | $0 | $0 | $0 | $0 | $0 | $0 | $0 | $0 | $0 | $0 | $0 | |
| Total Cost of Sales | $0 | $2,712 | $2,983 | $3,503 | $3,842 | $4,204 | $4,610 | $5,039 | $4,520 | $4,972 | $6,576 | $7,073 | |
| Gross Margin | $0 | $6,840 | $7,524 | $8,835 | $9,690 | $10,601 | $11,628 | $12,711 | $11,400 | $12,540 | $16,985 | $18,637 | |
| Gross Margin % | 0.00% | 71.61% | 71.61% | 71.61% | 71.61% | 71.60% | 71.61% | 71.61% | 71.61% | 71.61% | 72.09% | 72.49% | |
| Expenses | |||||||||||||
| Payroll | $3,900 | $4,378 | $4,425 | $4,764 | $4,847 | $4,936 | $5,037 | $5,143 | $5,014 | $5,126 | $5,549 | $5,700 | |
| Sales and Marketing and Other Expenses | $900 | $900 | $900 | $1,300 | $1,200 | $1,200 | $1,200 | $1,200 | $2,600 | $2,100 | $2,200 | $2,200 | |
| Depreciation | $100 | $100 | $100 | $100 | $100 | $100 | $100 | $100 | $100 | $100 | $100 | $100 | |
| Rent | $1,100 | $1,100 | $1,100 | $1,100 | $1,100 | $1,100 | $1,100 | $1,100 | $1,100 | $1,100 | $1,100 | $1,100 | |
| Research and Development | $500 | $500 | $500 | $500 | $500 | $500 | $500 | $500 | $0 | $0 | $0 | $0 | |
| Equipment Maintenance and Repair | $0 | $0 | $0 | $0 | $0 | $0 | $0 | $0 | $0 | $0 | $0 | $0 | |
| Utilities | $365 | $365 | $365 | $365 | $365 | $365 | $365 | $365 | $365 | $365 | $365 | $365 | |
| Insurance | $100 | $100 | $100 | $100 | $100 | $100 | $100 | $100 | $100 | $100 | $100 | $100 | |
| Payroll Taxes | 15% | $0 | $0 | $0 | $0 | $0 | $0 | $0 | $0 | $0 | $0 | $0 | $0 |
| Other | $125 | $125 | $125 | $125 | $125 | $125 | $125 | $125 | $125 | $125 | $125 | $125 | |
| Total Operating Expenses | $7,090 | $7,568 | $7,615 | $8,354 | $8,337 | $8,426 | $8,527 | $8,633 | $9,404 | $9,016 | $9,539 | $9,690 | |
| Profit Before Interest and Taxes | ($7,090) | ($728) | ($91) | $481 | $1,353 | $2,175 | $3,101 | $4,079 | $1,996 | $3,524 | $7,446 | $8,947 | |
| EBITDA | ($6,990) | ($628) | $9 | $581 | $1,453 | $2,275 | $3,201 | $4,179 | $2,096 | $3,624 | $7,546 | $9,047 | |
| Interest Expense | $574 | $568 | $562 | $556 | $550 | $544 | $538 | $532 | $526 | $520 | $514 | $508 | |
| Taxes Incurred | ($2,299) | ($389) | ($196) | ($22) | $241 | $489 | $769 | $1,064 | $441 | $901 | $2,080 | $2,532 | |
| Net Profit | ($5,365) | ($907) | ($457) | ($52) | $562 | $1,142 | $1,795 | $2,483 | $1,029 | $2,103 | $4,853 | $5,908 | |
| Net Profit/Sales | 0.00% | -9.49% | -4.35% | -0.42% | 4.15% | 7.71% | 11.05% | 13.99% | 6.46% | 12.01% | 20.60% | 22.98% | |
| Pro Forma Cash Flow | |||||||||||||
| Month 1 | Month 2 | Month 3 | Month 4 | Month 5 | Month 6 | Month 7 | Month 8 | Month 9 | Month 10 | Month 11 | Month 12 | ||
| Cash Received | |||||||||||||
| Cash from Operations | |||||||||||||
| Cash Sales | $0 | $0 | $0 | $0 | $0 | $0 | $0 | $0 | $0 | $0 | $0 | $0 | |
| Cash from Receivables | $0 | $0 | $318 | $9,584 | $10,568 | $12,378 | $13,574 | $14,853 | $16,288 | $17,689 | $15,973 | $17,714 | |
| Subtotal Cash from Operations | $0 | $0 | $318 | $9,584 | $10,568 | $12,378 | $13,574 | $14,853 | $16,288 | $17,689 | $15,973 | $17,714 | |
| Additional Cash Received | |||||||||||||
| Sales Tax, VAT, HST/GST Received | 0.00% | $0 | $0 | $0 | $0 | $0 | $0 | $0 | $0 | $0 | $0 | $0 | $0 |
| New Current Borrowing | $0 | $0 | $0 | $0 | $0 | $0 | $0 | $0 | $0 | $0 | $0 | $0 | |
| New Other Liabilities (interest-free) | $0 | $0 | $0 | $0 | $0 | $0 | $0 | $0 | $0 | $0 | $0 | $0 | |
| New Long-term Liabilities | $0 | $0 | $0 | $0 | $0 | $0 | $0 | $0 | $0 | $0 | $0 | $0 | |
| Sales of Other Current Assets | $0 | $0 | $0 | $0 | $0 | $0 | $0 | $0 | $0 | $0 | $0 | $0 | |
| Sales of Long-term Assets | $0 | $0 | $0 | $0 | $0 | $0 | $0 | $0 | $0 | $0 | $0 | $0 | |
| New Investment Received | $0 | $0 | $0 | $0 | $0 | $0 | $0 | $0 | $0 | $0 | $0 | $0 | |
| Subtotal Cash Received | $0 | $0 | $318 | $9,584 | $10,568 | $12,378 | $13,574 | $14,853 | $16,288 | $17,689 | $15,973 | $17,714 | |
| Expenditures | Month 1 | Month 2 | Month 3 | Month 4 | Month 5 | Month 6 | Month 7 | Month 8 | Month 9 | Month 10 | Month 11 | Month 12 | |
| Expenditures from Operations | |||||||||||||
| Cash Spending | $3,900 | $4,378 | $4,425 | $4,764 | $4,847 | $4,936 | $5,037 | $5,143 | $5,014 | $5,126 | $5,549 | $5,700 | |
| Bill Payments | $45 | $1,428 | $3,275 | $3,475 | $4,029 | $4,189 | $4,490 | $6,558 | $10,454 | $9,255 | $10,818 | $14,814 | |
| Subtotal Spent on Operations | $3,945 | $5,806 | $7,701 | $8,238 | $8,876 | $9,125 | $9,526 | $11,700 | $15,468 | $14,381 | $16,368 | $20,514 | |
| Additional Cash Spent | |||||||||||||
| Sales Tax, VAT, HST/GST Paid Out | $0 | $0 | $0 | $0 | $0 | $0 | $0 | $0 | $0 | $0 | $0 | $0 | |
| Principal Repayment of Current Borrowing | $0 | $0 | $0 | $0 | $0 | $0 | $0 | $0 | $0 | $0 | $0 | $0 | |
| Other Liabilities Principal Repayment | $0 | $0 | $0 | $0 | $0 | $0 | $0 | $0 | $0 | $0 | $0 | $0 | |
| Long-term Liabilities Principal Repayment | $1,208 | $1,208 | $1,208 | $1,208 | $1,208 | $1,208 | $1,208 | $1,208 | $1,208 | $1,208 | $1,208 | $1,208 | |
| Purchase Other Current Assets | $0 | $0 | $0 | $0 | $0 | $0 | $0 | $0 | $0 | $0 | $0 | $0 | |
| Purchase Long-term Assets | $0 | $0 | $0 | $0 | $0 | $0 | $0 | $0 | $0 | $0 | $0 | $0 | |
| Dividends | $0 | $0 | $0 | $0 | $0 | $0 | $0 | $0 | $0 | $0 | $0 | $0 | |
| Subtotal Cash Spent | $5,154 | $7,014 | $8,909 | $9,447 | $10,084 | $10,333 | $10,735 | $12,908 | $16,676 | $15,589 | $17,576 | $21,722 | |
| Net Cash Flow | ($5,154) | ($7,014) | ($8,591) | $137 | $484 | $2,044 | $2,840 | $1,944 | ($388) | $2,100 | ($1,603) | ($4,009) | |
| Cash Balance | $18,336 | $11,322 | $2,731 | $2,868 | $3,352 | $5,396 | $8,236 | $10,180 | $9,793 | $11,893 | $10,290 | $6,281 | |
| Pro Forma Balance Sheet | |||||||||||||
| Month 1 | Month 2 | Month 3 | Month 4 | Month 5 | Month 6 | Month 7 | Month 8 | Month 9 | Month 10 | Month 11 | Month 12 | ||
| Assets | Starting Balances | ||||||||||||
| Current Assets | |||||||||||||
| Cash | $23,490 | $18,336 | $11,322 | $2,731 | $2,868 | $3,352 | $5,396 | $8,236 | $10,180 | $9,793 | $11,893 | $10,290 | $6,281 |
| Accounts Receivable | $0 | $0 | $9,552 | $19,741 | $22,495 | $25,459 | $27,886 | $30,549 | $33,447 | $33,078 | $32,901 | $40,489 | $48,486 |
| Inventory | $25,200 | $25,200 | $22,488 | $19,505 | $16,002 | $12,160 | $7,956 | $5,071 | $5,543 | $4,972 | $5,469 | $7,234 | $7,780 |
| Other Current Assets | $0 | $0 | $0 | $0 | $0 | $0 | $0 | $0 | $0 | $0 | $0 | $0 | $0 |
| Total Current Assets | $48,690 | $43,536 | $43,362 | $41,977 | $41,365 | $40,971 | $41,238 | $43,857 | $49,170 | $47,843 | $50,263 | $58,013 | $62,547 |
| Long-term Assets | |||||||||||||
| Long-term Assets | $62,160 | $62,160 | $62,160 | $62,160 | $62,160 | $62,160 | $62,160 | $62,160 | $62,160 | $62,160 | $62,160 | $62,160 | $62,160 |
| Accumulated Depreciation | $0 | $100 | $200 | $300 | $400 | $500 | $600 | $700 | $800 | $900 | $1,000 | $1,100 | $1,200 |
| Total Long-term Assets | $62,160 | $62,060 | $61,960 | $61,860 | $61,760 | $61,660 | $61,560 | $61,460 | $61,360 | $61,260 | $61,160 | $61,060 | $60,960 |
| Total Assets | $110,850 | $105,596 | $105,322 | $103,837 | $103,125 | $102,631 | $102,798 | $105,317 | $110,530 | $109,103 | $111,423 | $119,073 | $123,507 |
| Liabilities and Capital | Month 1 | Month 2 | Month 3 | Month 4 | Month 5 | Month 6 | Month 7 | Month 8 | Month 9 | Month 10 | Month 11 | Month 12 | |
| Current Liabilities | |||||||||||||
| Accounts Payable | $0 | $1,319 | $3,160 | $3,341 | $3,889 | $4,041 | $4,276 | $6,208 | $10,147 | $8,899 | $10,324 | $14,329 | $14,064 |
| Current Borrowing | $0 | $0 | $0 | $0 | $0 | $0 | $0 | $0 | $0 | $0 | $0 | $0 | $0 |
| Other Current Liabilities | $0 | $0 | $0 | $0 | $0 | $0 | $0 | $0 | $0 | $0 | $0 | $0 | $0 |
| Subtotal Current Liabilities | $0 | $1,319 | $3,160 | $3,341 | $3,889 | $4,041 | $4,276 | $6,208 | $10,147 | $8,899 | $10,324 | $14,329 | $14,064 |
| Long-term Liabilities | $116,000 | $114,792 | $113,583 | $112,375 | $111,167 | $109,958 | $108,750 | $107,542 | $106,333 | $105,125 | $103,917 | $102,708 | $101,500 |
| Total Liabilities | $116,000 | $116,111 | $116,744 | $115,716 | $115,056 | $114,000 | $113,026 | $113,749 | $116,480 | $114,024 | $114,241 | $117,038 | $115,564 |
| Paid-in Capital | $10,000 | $10,000 | $10,000 | $10,000 | $10,000 | $10,000 | $10,000 | $10,000 | $10,000 | $10,000 | $10,000 | $10,000 | $10,000 |
| Retained Earnings | ($15,150) | ($15,150) | ($15,150) | ($15,150) | ($15,150) | ($15,150) | ($15,150) | ($15,150) | ($15,150) | ($15,150) | ($15,150) | ($15,150) | ($15,150) |
| Earnings | $0 | ($5,365) | ($6,272) | ($6,729) | ($6,781) | ($6,219) | ($5,077) | ($3,283) | ($800) | $229 | $2,332 | $7,185 | $13,093 |
| Total Capital | ($5,150) | ($10,515) | ($11,422) | ($11,879) | ($11,931) | ($11,369) | ($10,227) | ($8,433) | ($5,950) | ($4,921) | ($2,818) | $2,035 | $7,943 |
| Total Liabilities and Capital | $110,850 | $105,596 | $105,322 | $103,837 | $103,125 | $102,631 | $102,798 | $105,317 | $110,530 | $109,103 | $111,423 | $119,073 | $123,507 |
| Net Worth | ($5,150) | ($10,515) | ($11,422) | ($11,879) | ($11,931) | ($11,369) | ($10,227) | ($8,433) | ($5,950) | ($4,921) | ($2,818) | $2,035 | $7,943 |


