
West Pacific Marketing
Executive Summary
West Pacific Marketing Consultants aims to provide marketing services to targeted business environments in Indonesia, Asia, and the west Pacific region. This plan seeks to generate a significant increase in company sales and profits from the delivery of retainer consulting, project consulting, market research and industrial analysis, feasibility studies, and strategic analysis and reporting services, compared to the preceding year.
The highlights of this plan are the targeted gross margin and sales-revenue. The targeted gross margin and sales-revenue for each of the first five years of this plan are presented in the following chart and the tables presented later in this plan. These figures represent the key prospects available for West Pacific Marketing Consultants. These targets are attainable through a proactive approach to the candidacy of clients, teaming-up with technology providers, and partnering with reputable local and regional engineering suppliers and construction firms to reduce competition, improve pricing, and reduce risks.
This business plan has been created on the basis of five years of market research. Data conclude the size and growth of the market and geographical segments, customer needs, perception, and buying behavior trends have been on the upswing, and are expected to continue in this trend for the next five years. West Pacific Marketing Consultants feels that it is able to fill the hole in the marketing niche, and will benefit from operations beginning in January, Year 1.
Note: All figures within this plan are in the U.S. dollar, and reflect the currency exchange rate of $1 = Rp 7,200.
1.1 Objectives
West Pacific Marketing Consultants’ objectives are to make an equal and fair profit in the business-to-business (B2B) and business-to-consumer (B2C) marketing services industry. This goal is to be reached by attaining the numbers presented in the Sales Forecast and Financial Plan topics.
1.2 Mission
West Pacific Marketing Consultants offers companies, government institutions, nongovernment organizations (NGO), and individuals reliable, high-quality, and cost-effective consulting services for various purposes. Our services include business development, market development, market intelligence, industrial sectors analysis, and channel development on a global scale, as well as sales assistance for global companies in the Indonesian market.
The situation in Indonesia is currently characterized by the facts that times are tough, investment appetites are low, industries are cutting costs, and budgets are being slashed. Fully aware of this situation, West Pacific Marketing Consultants, after completing a five year research study, has come to the conclusion that its potential clients would be interested in doing things in a smarter way, with good support of a reliable and efficient market intelligence. West Pacific Marketing Consultants believes that it can provide both solutions and value creations to its clients. Its senior executive consultants have been working with some reputable U.S.-based global companies for more than 14 years, and have extensive knowledge of Indonesian, Asian, and Pacific business environments.
1.3 Keys to Success
The are two keys to success that West Pacific Marketing Consultants is focused on. These are broadlky characterized as Internal and External Factors, and are explained in more detail in the following two sections.
1.3.1 External (Business Environment) Factors
The Asia-Pacific Region is now living in an interesting era: the process of change from the “old economy” to the “global new economy” brings a tremendous development growth of e-commerce, mobility of capital, and liberalization to the region. Since the new global economy brings new economics, new market structures, new industry structures, and new company structures, the profile of customers has also changed. Customers have evolved from “solution demander” to “value demander,” and from “clients” to “business partners.”
West Pacific Marketing Consultants is proactively focused on establishing relationships with multiple digital contents, companies, government institutions, regional (provincial) government offices, NGOs, and individual customers as its prospective business partners.
1.3.2 Internal Factors
The company feels that it controls its own success through some basic internal factors. These are:
- Selling and Marketing Power. The services the company provides are made attractive in order to maintain a certain percentage of B2B and B2C clients. Being a market intelligence services provider, business and market development consulting services provider, and business and sales representative, West Pacific Marketing Consultants demonstrates a successful approach in converting its reputation into an excellent brand to ensure the conversion of its clients’ knowledge into their intellectual property, thus creating value for its clients.
- Excellence in fulfilling the promise. Clients do not buy features, they buy benefits. To realize a benefit, a claim must be made and proof presented. This company has had success on claim after claim.
- Developing visibility to generate new business leads. Participation by the company in online business affiliations with reputable global players of e-business technology is a necessity. Two of these players are Palo Alto Software and B2BToday.com. Strategic relationships must also be made with companies, government institutions, regional (provincial) government offices, and NGOs, as well as with individual customers.
- High-quality service and customer satisfaction. Everything the company sells is guaranteed; therefore, the services have to do what the customers want, and do it well. Long-term customer satisfaction is critical to the survival of the company.
- Create multiple opportunities from a single line of expertise. West Pacific Marketing Consultants is able to leverage from a single pool of expertise into multiple revenue generation opportunities: business development, market development, market intelligence, industrial sectors analysis, and channel development on a global scale, as well as sales assistance for global companies in the Indonesian market.
- Key management team. The right management team is integral, and must have a strong foundation in marketing, management, finance, and services development. The company is confident in its team.

Company Summary
The founders of West Pacific Marketing Consultants are former marketers of large multinational engineering, procurement, and construction contracting services and, at the same time, are experienced market researchers in global markets. They founded West Pacific Global Trading Portal (SiliconOctopus.com), the parent company of West Pacific Marketing Consultants, to formalize the integrated B2B, B2C, and consumer-to-consumer services they offer.
The parent company was founded by Jaka J. Legawa and his business partners from Chicago, Kansas City, and Singapore. This company was originally installed in a home office and moved into its new office space in January, last year. The subsidiary company, West Pacific Marketing Consultants, was founded in April, last year by these same investors.
2.1 Company Ownership
West Pacific Marketing Consultants was created as an Indonesian “Perseroan Terbatas” (PT) corporation based in Jakarta, namely “PT. Portal Bisnis Pasifik Barat,” owned by its principal investors and principal operators. It was created in April, last year
2.2 Company History
Between April and December of the previous year, West Pacific Marketing Consultants achieved excellent performance ratings. The sales revenue of $1.9 million, with a gross margin of $1.6 million, was 15% higher than the projected sales for that year.
From its recent growth until the time of this writing, West Pacific Marketing Consultants has costs and cash flow under control.

| Past Performance | |||
| 1998 | 1999 | 2000 | |
| Sales | $0 | $0 | $1,895,000 |
| Gross Margin | $0 | $0 | $1,516,000 |
| Gross Margin % | 0.00% | 0.00% | 80.00% |
| Operating Expenses | $0 | $0 | $84,400 |
| Collection Period (days) | 0 | 0 | 0 |
| Balance Sheet | |||
| 1998 | 1999 | 2000 | |
| Current Assets | |||
| Cash | $0 | $0 | $656,086 |
| Accounts Receivable | $0 | $0 | $118,438 |
| Other Current Assets | $0 | $0 | $0 |
| Total Current Assets | $0 | $0 | $774,524 |
| Long-term Assets | |||
| Long-term Assets | $0 | $0 | $126,588 |
| Accumulated Depreciation | $0 | $0 | $0 |
| Total Long-term Assets | $0 | $0 | $126,588 |
| Total Assets | $0 | $0 | $901,112 |
| Current Liabilities | |||
| Accounts Payable | $0 | $0 | $5,000 |
| Current Borrowing | $0 | $0 | $0 |
| Other Current Liabilities (interest free) | $0 | $0 | $0 |
| Total Current Liabilities | $0 | $0 | $5,000 |
| Long-term Liabilities | $0 | $0 | $0 |
| Total Liabilities | $0 | $0 | $5,000 |
| Paid-in Capital | $0 | $0 | $37,800 |
| Retained Earnings | $0 | $0 | $12,762 |
| Earnings | $0 | $0 | $845,550 |
| Total Capital | $0 | $0 | $896,112 |
| Total Capital and Liabilities | $0 | $0 | $901,112 |
| Other Inputs | |||
| Payment Days | 0 | 0 | 30 |
| Sales on Credit | $0 | $0 | $0 |
| Receivables Turnover | 0.00 | 0.00 | 0.00 |

2.3 Company Locations and Facilities
The office is located in one of the strategic locations in the heart of the Indonesian business area, at Komplek Pertanian, in Jakarta.
Services
West Pacific Marketing Consultants is an e-business-based market-development consulting firm specializing in the marketing of a comprehensive set of integrated professional services that provide our customers with high-quality consulting services for business development, market development, market intelligence, industrial sectors analysis, and channel development on a global scale, as well as sales assistance for global companies in the Indonesian market.
3.1 Service Description
West Pacific Marketing Consultants offers expertise in the services it provides. With much experience in this field, the company is able to sell and package its services in various ways that allow clients to choose their preferred benefit(s). These include:
- Retainer Consulting
- Project Consulting
- Market Research and Industry Sectors Analysis
- Feasibility Studies
- Strategic Analysis and Reports
3.2 Competitive Comparison
Within its niche, West Pacific Marketing Consultants does not have any competitors, but rather has “prospective business partners.” This is because the cmpany provides its clients with solutions as well as value creations. Its services have been sought out by companies ranging from high-level management firms to international market research companies. Companies choosing to do business development, channel development, and in-house market research, will seek West Pacific Marketing Consultants to deliver the following value creations:
Consulting/Market Researchers/Traders/Suppliers:
- Improved communication
- Access to new markets
- Broader products offering
- Lower cost of doing business
- New ways of adding value
Technology Providers/Manufacturers:
- Lower cost of sales
- Access to niche markets
- Better cost of identification
New business models (outsourcing alliances)
Individual Clients:
- Shopping convenience
- Immediate delivery
- More frequent updates
- Access to more products and services
- Better pricing
3.3 Sales Literature
The business began with a general corporate brochure establishing the positioning. This brochure was developed, and was included as part of last year’s start-up expenses.
Literature and mailings for the market forums will be very important.
3.4 Fulfillment
The key fulfillment and delivery will be provided by the principals of the business. The core value is professional expertise provided by a combination of experience, smart and hard work, discipline, improvements, and education (in that order).
West Pacific Marketing Consultants will turn to qualified professionals for freelance back-up in market research, presentation, and report development; these areas are ones that the company can afford to sub-contract without risking the core values provided to the clients.
3.5 Technology
West Pacific Marketing Consultants maintains the latest Windows and Macintosh capabilities including:
- Internet facilities for working with clients directly through email delivery of drafts and information.
- Facilities for preparation and delivery of multimedia presentations on any computer, in formats including on-disk, live, or video.
- Desktop publishing facilities for delivery of regular retainer reports, project output reports, marketing materials, and market research reports.
Market Analysis Summary
West Pacific Marketing Consultants has a unique offering of services that appeals to a large customer base. The company will concentrate on large corporations because they provide the maximum profit potential. The following sections outline key information regarding the target markets.
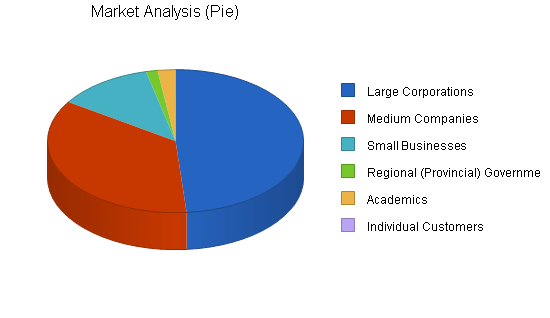
4.1 Market Segmentation
The groups of potential customers for West Pacific Marketing Consultants are, in order of importance:
- Large Corporations
- Medium Companies
- Small Businesses
- Regional (Provincial) Government Offices
- Academics
- Individual Customers
| Market Analysis | |||||||
| 2001 | 2002 | 2003 | 2004 | 2005 | |||
| Potential Customers | Growth | CAGR | |||||
| Large Corporations | 11% | 50,500,000 | 56,034,800 | 62,176,214 | 68,990,727 | 76,552,111 | 10.96% |
| Medium Companies | 35% | 37,000,000 | 49,950,000 | 67,432,500 | 91,033,875 | 122,895,731 | 35.00% |
| Small Businesses | 5% | 12,500,000 | 13,125,000 | 13,781,250 | 14,470,313 | 15,193,829 | 5.00% |
| Regional (Provincial) Governments | 2% | 1,500,000 | 1,530,000 | 1,560,600 | 1,591,812 | 1,623,648 | 2.00% |
| Academics | 1% | 2,250,000 | 2,272,500 | 2,295,225 | 2,318,177 | 2,341,359 | 1.00% |
| Individual Customers | 332% | 87,500 | 377,580 | 1,629,333 | 7,030,898 | 30,339,731 | 331.52% |
| Total | 24.43% | 103,837,500 | 123,289,880 | 148,875,122 | 185,435,802 | 248,946,409 | 24.43% |
4.2 Target Market Segment Strategy
As indicated by the previous chart and table, West Pacific Marketing Consultants must focus on large corporations, medium companies, small businesses, and individual customers in the global market; and in the Indonesian market, regional (provincial) government offices, NGOs, academics, and individual customers will be the core of profits.
4.3 Service Business Analysis
The following companies are major players in Indonesian market research consulting business:
- AC Nielsen Indonesia
- Australian Trade Commission
- Business Advisory Indonesia
- The Castle Group
- CIC Consulting Group
- CDA International
- Consensus MBL
- PT. Data Consult, Inc.
- Ganesha Aggies Jaya
- Harvest International Inc.
- PT. IBIS Dharma Nusa
- IndoAust Jaya
- Indonesia Executive Search
- Penelitian Hukum Indonesia
- Plansearch Associates
- SOFRES FSA Jakarta (Taylor Nelson Sofres Group)
4.4 Competition and Buying Patterns
Recent analysis indicated that consultant costs (in US$/man-hour) in Indonesia have decreased by 12% since the economic turmoil of 1996. This analysis is based on the assumptions that the local senior consultants’ and senior engineers’ salaries have increased by 25% at the average exchange rate of US$1 = Rp 7,200. This is because the Indonesian skilled manpower market offers the lowest man-hour cost in the world, even with the estimated average increasing 20% per year.
To take advantage of this situation, West Pacific Marketing Consultants utilizes Indonesian resources for serving both global and regional markets.
Strategy and Implementation Summary
West Pacific Marketing Consultants will focus on six technographical market segments as follows:
- Large corporations. The most important market segment consists of the large manufacturers, technology providers, suppliers, trading houses, turnkey contractors, developers, utilities, banking and financing institutions, mining, consulting, and engineering industries. These companies will be interacting with West Pacific Marketing Consultants for development functions that are more effective when spun off than when managed in-house.
- Medium-sized growth companies. For high-growth fields, such as software and multimedia, West Pacific Marketing Consultants will offer an attractive development alternative that will allow the company to address opportunities in new market segments.
- Regional (Provincial) Government Office. In line with the launching of the new Regional Autonomy Law in Indonesia, West Pacific Marketing Consultants will offer innovative assistance in export facilitation and investment promotion.
- Academics. Universities and Colleges granting professionals, masters, and doctorate degrees in business, engineering, and technology-related subjects we deemed as profitable by the company.
- Small businesses owners.
- Individual customers. Influential people such as boards of directors, marketing managers, general managers, sales managers, and government officials.
5.1 Competitive Edge
West Pacific Marketing Consultants has close and effective relationships with its end-users, vendors (suppliers and sub-contractors), and even competitors. On several occasions, West Pacific Marketing Consultants has teamed-up with its end-user or supplier in a consortium partnership to perform projects.
West Pacific Marketing Consultants combines unparalleled quality with a cost-effective package to create a consulting service with many competitive advantages. The seasoned management is qualified for multiple services, such as: business development, market development, market intelligence, industrial sectors analysis, and channel development. We provide this range of services to anyone from a high-level marketing firm to a home-based business owner; clients can always count on quick, accurate services from the company.
5.2 Sales Strategy
West Pacific Marketing Consultants’ strategy focuses first on maintaining the identity of the high-end buyer who appreciates quality service, but is also very demanding regarding value creations. West Pacific Marketing Consultants has been able to find these customers using a combination of social and interactive email relationships.
Furthermore, as a part of its “individual sales strategy,” to ensure optimum client satisfaction, West Pacific Marketing Consultants customizes its services for each specific client. This approach is called “individual sales strategy” because customization permits clients to participate in producing exactly what they want.
Even when a business offers a standard service, it is not making a standard sales offer. The customer is able to choose a tailored offering mix of elements, such as optional services benefits, delivery conditions, training, financing alternatives, technical services options, sales assistance options, etc.
5.2.1 Sales Forecast
The sales forecast monthly summary is included in the appendix. The annual sales projections are included here in the following chart and table.
The sales forecast assumes that the yearly change in costs or prices will average 20%, which is a reasonable assumption based on the last few years.
West Pacific Marketing Consultants is expecting to increase sales modestly in 2001 and 2002, with sales growth accelerating in 2003-2005. It is the expectation that the company will double its starting sales within five years.

| Sales Forecast | |||||
| 2001 | 2002 | 2003 | 2004 | 2005 | |
| Sales | |||||
| Retainer Consulting | $580,000 | $696,000 | $835,200 | $1,002,240 | $1,202,688 |
| Project Consulting | $480,000 | $576,000 | $691,200 | $829,440 | $995,328 |
| Market Research & Industrial Analyses | $360,000 | $432,000 | $518,400 | $622,080 | $746,496 |
| Feasibility Studies | $360,000 | $432,000 | $518,400 | $622,080 | $746,496 |
| Strategic Analysis and Reports | $300,000 | $360,000 | $432,000 | $518,400 | $622,080 |
| Other | $0 | $0 | $0 | $0 | $0 |
| Total Sales | $2,080,000 | $2,496,000 | $2,995,200 | $3,594,240 | $4,313,088 |
| Direct Cost of Sales | 2001 | 2002 | 2003 | 2004 | 2005 |
| Retainer Consulting | $116,040 | $139,248 | $167,098 | $200,517 | $240,621 |
| Project Consulting | $93,720 | $112,464 | $134,957 | $161,948 | $194,334 |
| Market Research & Industrial Analyses | $72,000 | $86,400 | $103,680 | $124,416 | $149,299 |
| Feasibility Studies | $72,000 | $86,400 | $103,680 | $124,416 | $149,299 |
| Strategic Analysis and Reports | $58,560 | $70,272 | $84,236 | $101,192 | $121,430 |
| Other | $0 | $0 | $0 | $0 | $0 |
| Subtotal Direct Cost of Sales | $412,320 | $494,784 | $593,651 | $712,489 | $854,983 |
5.3 Milestones
The accompanying chart and table show specific milestones, with responsibilities assigned, dates, and budgets. West Pacific Marketing Consultants is focusing on a few key milestones that are to be accomplished.
Print adverstising will target newspapers and magazines, while Internet advertising will appear on both websites and search engines.
Participation in Indonesian business and trade exhibitions will be important as well.

| Milestones | |||||
| Milestone | Start Date | End Date | Budget | Manager | Department |
| Business Plan | 11/20/2000 | 11/24/2000 | $3,500 | Jaka Legawa | CEO |
| Stationery | 11/1/2000 | 11/3/2000 | $3,000 | VP Internal Bus. Mngt. | Internal Bus. Mngt. |
| Brochures | 11/6/2000 | 12/1/2000 | $5,000 | VP Internal Bus. Mngt. | Internal Bus. Mngt. |
| Office Equipment | 12/4/2000 | 12/6/2000 | $3,000 | VP Internal Bus. Mngt. | Internal Bus. Mngt. |
| Advertising — Print | 1/2/2001 | 2/28/2001 | $3,000 | VP Sales & Marketing | Sales & Marketing |
| Advertising — Internet | 1/2/2001 | 2/28/2001 | $2,000 | VP Sales & Marketing | Sales & Marketing |
| Exports Exhibition/Jakarta | 4/9/2001 | 4/13/2001 | $2,500 | VP Sales & Marketing | Sales & Marketing |
| Trade Exhibition/Bali | 8/6/2001 | 8/17/2001 | $13,000 | VP Sales & Marketing | Sales & Marketing |
| Computer Tech Exhibition/Jakarta | 11/12/2001 | 11/17/2001 | $6,000 | VP Sales & Marketing | Sales & Marketing |
| Totals | $41,000 | ||||
Management Summary
The initial management team depends on the founders themselves, with little back-up. As it grows, West Pacific Marketing Consultants will establish a team that includes 17 employees who operate under a president and three vice-presidents.
The management philosophy is based on responsibility and mutual respect. People who work at West Pacific Marketing Consultants want to work at the company because it has an environment that encourages “C4A,” which is: Creativity, Concepts, Competencies, Connections, and Achievement. This C4A concept is our tool in performing the Shareholders Value Creation of West Pacific Marketing Consultants.
6.1 Personnel Plan
The team includes 17 employees, under a president and three vice-presidents.
The three main management divisions are Sales and Marketing, Operations, and Internal Business Management. The departments managed by the Sales and Marketing division are: marketing, sales, products and services, research and development, and public relations operations. The departments managed by the Internal Business Management division are: accounting, administration, and human resources development.
Note: The following table reflects the currency exchange rate of US$1 = Rp 7,2000
| Personnel Plan | |||||
| 2001 | 2002 | 2003 | 2004 | 2005 | |
| Vice President Sales & Marketing | $24,000 | $26,400 | $29,040 | $31,944 | $35,138 |
| Technical Sales B2B | $14,400 | $15,840 | $17,424 | $19,166 | $21,083 |
| Technical Sales B2C | $14,400 | $15,840 | $17,424 | $19,166 | $21,083 |
| Secretary – Sales & Marketing Office | $3,600 | $3,960 | $4,356 | $4,792 | $5,271 |
| Vice President Operations | $24,000 | $26,400 | $29,040 | $31,944 | $35,138 |
| Senior Consultant – Marketing | $14,400 | $15,840 | $17,424 | $19,166 | $21,083 |
| Senior Consultant – Finance Management | $14,400 | $15,840 | $17,424 | $19,166 | $21,083 |
| Senior Consultant – Strategic Management | $14,400 | $15,840 | $17,424 | $19,166 | $21,083 |
| Secretary – Operations Office | $3,600 | $3,960 | $4,356 | $4,792 | $5,271 |
| VP Internal Business Management | $24,000 | $26,400 | $29,040 | $31,944 | $35,138 |
| Accountant | $14,400 | $15,840 | $17,424 | $19,166 | $21,083 |
| Legal Officer | $14,400 | $15,840 | $17,424 | $19,166 | $21,083 |
| Administrative Officer | $14,400 | $15,840 | $17,424 | $19,166 | $21,083 |
| HRD Officer | $14,400 | $15,840 | $17,424 | $19,166 | $21,083 |
| President/CEO | $48,000 | $52,800 | $58,080 | $63,888 | $70,277 |
| Secretary to the CEO | $6,000 | $6,600 | $7,260 | $7,986 | $8,785 |
| Bookkeeper | $3,600 | $3,960 | $4,356 | $4,792 | $5,271 |
| Clerical | $1,200 | $1,320 | $1,452 | $1,597 | $1,757 |
| Clerical | $1,200 | $1,320 | $1,452 | $1,597 | $1,757 |
| Clerical | $1,200 | $1,320 | $1,452 | $1,597 | $1,757 |
| Clerical | $1,200 | $1,320 | $1,452 | $1,597 | $1,757 |
| Total People | 0 | 0 | 0 | 0 | 0 |
| Total Payroll | $271,200 | $298,320 | $328,152 | $360,967 | $397,064 |
Financial Plan
The financial picture is quite encouraging. West Pacific Marketing Consultants does not foresee a debt situation.
The company does expect to be able to take some money out as dividends. The owners don’t take overly generous salaries, so some draw is appropriate.
7.1 Important Assumptions
The accompanying table lists West Pacific Marketing Consultants’ main assumptions for developing its financial projections. The most sensitive assumption is the collection days. West Pacific Marketing Consultants would like to improve collection days to take pressure off of its working capital.
| General Assumptions | |||||
| 2001 | 2002 | 2003 | 2004 | 2005 | |
| Plan Month | 1 | 2 | 3 | 4 | 5 |
| Current Interest Rate | 9.00% | 9.00% | 9.00% | 9.00% | 9.00% |
| Long-term Interest Rate | 9.00% | 9.00% | 9.00% | 9.00% | 9.00% |
| Tax Rate | 25.00% | 25.00% | 25.00% | 25.00% | 25.00% |
| Other | 0 | 0 | 0 | 0 | 0 |
7.2 Business Ratios
The following table presents significant business ratios for West Pacific Marketing Consultants. The last column, Industry Profiles, contains ratios based on the management consulting services industry, as defined by the Standard Industry Classification (SIC) Index code 8742.
| Ratio Analysis | ||||||
| 2001 | 2002 | 2003 | 2004 | 2005 | Industry Profile | |
| Sales Growth | 9.76% | 20.00% | 20.00% | 20.00% | 20.00% | 8.60% |
| Percent of Total Assets | ||||||
| Accounts Receivable | 9.13% | 6.82% | 5.61% | 4.86% | 4.36% | 24.40% |
| Other Current Assets | 0.00% | 0.00% | 0.00% | 0.00% | 0.00% | 46.70% |
| Total Current Assets | 93.28% | 95.82% | 97.14% | 97.93% | 98.45% | 74.90% |
| Long-term Assets | 6.72% | 4.18% | 2.86% | 2.07% | 1.55% | 25.10% |
| Total Assets | 100.00% | 100.00% | 100.00% | 100.00% | 100.00% | 100.00% |
| Current Liabilities | 3.75% | 2.92% | 2.40% | 2.09% | 1.88% | 42.80% |
| Long-term Liabilities | 0.00% | 0.00% | 0.00% | 0.00% | 0.00% | 17.20% |
| Total Liabilities | 3.75% | 2.92% | 2.40% | 2.09% | 1.88% | 60.00% |
| Net Worth | 96.25% | 97.08% | 97.60% | 97.91% | 98.12% | 40.00% |
| Percent of Sales | ||||||
| Sales | 100.00% | 100.00% | 100.00% | 100.00% | 100.00% | 100.00% |
| Gross Margin | 80.18% | 80.18% | 80.18% | 80.18% | 80.18% | 0.00% |
| Selling, General & Administrative Expenses | 36.08% | 35.14% | 34.28% | 33.49% | 32.77% | 83.50% |
| Advertising Expenses | 1.27% | 1.27% | 1.27% | 1.27% | 1.27% | 1.20% |
| Profit Before Interest and Taxes | 58.80% | 60.05% | 61.20% | 62.25% | 63.21% | 2.60% |
| Main Ratios | ||||||
| Current | 24.86 | 32.86 | 40.41 | 46.87 | 52.42 | 1.59 |
| Quick | 24.86 | 32.86 | 40.41 | 46.87 | 52.42 | 1.26 |
| Total Debt to Total Assets | 3.75% | 2.92% | 2.40% | 2.09% | 1.88% | 60.00% |
| Pre-tax Return on Net Worth | 67.44% | 51.02% | 42.51% | 37.35% | 33.93% | 4.40% |
| Pre-tax Return on Assets | 64.91% | 49.54% | 41.49% | 36.57% | 33.29% | 10.90% |
| Additional Ratios | 2001 | 2002 | 2003 | 2004 | 2005 | |
| Net Profit Margin | 44.10% | 45.04% | 45.90% | 46.69% | 47.41% | n.a |
| Return on Equity | 50.58% | 38.27% | 31.88% | 28.01% | 25.45% | n.a |
| Activity Ratios | ||||||
| Accounts Receivable Turnover | 6.04 | 6.04 | 6.04 | 6.04 | 6.04 | n.a |
| Collection Days | 59 | 55 | 55 | 55 | 55 | n.a |
| Accounts Payable Turnover | 12.61 | 12.17 | 12.17 | 12.17 | 12.17 | n.a |
| Payment Days | 27 | 27 | 27 | 27 | 27 | n.a |
| Total Asset Turnover | 1.10 | 0.82 | 0.68 | 0.59 | 0.53 | n.a |
| Debt Ratios | ||||||
| Debt to Net Worth | 0.04 | 0.03 | 0.02 | 0.02 | 0.02 | n.a |
| Current Liab. to Liab. | 1.00 | 1.00 | 1.00 | 1.00 | 1.00 | n.a |
| Liquidity Ratios | ||||||
| Net Working Capital | $1,686,804 | $2,810,931 | $4,185,741 | $5,863,735 | $7,908,464 | n.a |
| Interest Coverage | 0.00 | 0.00 | 0.00 | 0.00 | 0.00 | n.a |
| Additional Ratios | ||||||
| Assets to Sales | 0.91 | 1.21 | 1.48 | 1.70 | 1.90 | n.a |
| Current Debt/Total Assets | 4% | 3% | 2% | 2% | 2% | n.a |
| Acid Test | 22.42 | 30.52 | 38.08 | 44.54 | 50.10 | n.a |
| Sales/Net Worth | 1.15 | 0.85 | 0.69 | 0.60 | 0.54 | n.a |
| Dividend Payout | 0.00 | 0.00 | 0.00 | 0.00 | 0.00 | n.a |
7.3 Break-even Analysis
The following chart and table summarize the break-even analysis, including monthly units and sales break-even points.

| Break-even Analysis | |
| Monthly Revenue Break-even | $46,214 |
| Assumptions: | |
| Average Percent Variable Cost | 20% |
| Estimated Monthly Fixed Cost | $37,053 |
7.4 Projected Profit and Loss
The detailed monthly pro-forma income statement for the first year is included in the appendix. The annual estimates are included here.


| Pro Forma Profit and Loss | |||||
| 2001 | 2002 | 2003 | 2004 | 2005 | |
| Sales | $2,080,000 | $2,496,000 | $2,995,200 | $3,594,240 | $4,313,088 |
| Direct Cost of Sales | $412,320 | $494,784 | $593,651 | $712,489 | $854,983 |
| Other | $0 | $0 | $0 | $0 | $0 |
| Total Cost of Sales | $412,320 | $494,784 | $593,651 | $712,489 | $854,983 |
| Gross Margin | $1,667,680 | $2,001,216 | $2,401,549 | $2,881,751 | $3,458,105 |
| Gross Margin % | 80.18% | 80.18% | 80.18% | 80.18% | 80.18% |
| Expenses | |||||
| Payroll | $271,200 | $298,320 | $328,152 | $360,967 | $397,064 |
| Sales and Marketing and Other Expenses | $85,000 | $102,000 | $122,320 | $146,784 | $176,141 |
| Depreciation | $0 | $0 | $0 | $0 | $0 |
| Leased Equipment | $0 | $0 | $0 | $0 | $0 |
| Utilities | $7,200 | $8,640 | $10,368 | $12,442 | $14,930 |
| Insurance | $2,160 | $2,592 | $3,110 | $3,732 | $4,479 |
| Office Rent | $38,400 | $46,080 | $55,296 | $66,355 | $79,626 |
| Payroll Taxes | $40,680 | $44,748 | $49,223 | $54,145 | $59,560 |
| Other | $0 | $0 | $0 | $0 | $0 |
| Total Operating Expenses | $444,640 | $502,380 | $568,469 | $644,426 | $731,799 |
| Profit Before Interest and Taxes | $1,223,040 | $1,498,836 | $1,833,080 | $2,237,325 | $2,726,306 |
| EBITDA | $1,223,040 | $1,498,836 | $1,833,080 | $2,237,325 | $2,726,306 |
| Interest Expense | $0 | $0 | $0 | $0 | $0 |
| Taxes Incurred | $305,760 | $374,709 | $458,270 | $559,331 | $681,576 |
| Net Profit | $917,280 | $1,124,127 | $1,374,810 | $1,677,994 | $2,044,729 |
| Net Profit/Sales | 44.10% | 45.04% | 45.90% | 46.69% | 47.41% |
7.5 Projected Cash Flow
Cash flow projections are critical to West Pacific Marketing Consultants’ success. The monthly cash flow is shown in the illustration, with one bar representing the cash flow per month and the other representing the monthly balance. The annual cash flow figures are included below in the following chart and table. Detailed monthly numbers are included in the appendix.

| Pro Forma Cash Flow | |||||
| 2001 | 2002 | 2003 | 2004 | 2005 | |
| Cash Received | |||||
| Cash from Operations | |||||
| Cash Sales | $1,040,000 | $1,248,000 | $1,497,600 | $1,797,120 | $2,156,544 |
| Cash from Receivables | $986,355 | $1,213,583 | $1,456,300 | $1,747,560 | $2,097,072 |
| Subtotal Cash from Operations | $2,026,355 | $2,461,583 | $2,953,900 | $3,544,680 | $4,253,616 |
| Additional Cash Received | |||||
| Sales Tax, VAT, HST/GST Received | $0 | $0 | $0 | $0 | $0 |
| New Current Borrowing | $0 | $0 | $0 | $0 | $0 |
| New Other Liabilities (interest-free) | $0 | $0 | $0 | $0 | $0 |
| New Long-term Liabilities | $0 | $0 | $0 | $0 | $0 |
| Sales of Other Current Assets | $0 | $0 | $0 | $0 | $0 |
| Sales of Long-term Assets | $0 | $0 | $0 | $0 | $0 |
| New Investment Received | $0 | $0 | $0 | $0 | $0 |
| Subtotal Cash Received | $2,026,355 | $2,461,583 | $2,953,900 | $3,544,680 | $4,253,616 |
| Expenditures | 2001 | 2002 | 2003 | 2004 | 2005 |
| Expenditures from Operations | |||||
| Cash Spending | $271,200 | $298,320 | $328,152 | $360,967 | $397,064 |
| Bill Payments | $825,811 | $1,056,025 | $1,274,264 | $1,533,659 | $1,845,321 |
| Subtotal Spent on Operations | $1,097,011 | $1,354,345 | $1,602,416 | $1,894,626 | $2,242,385 |
| Additional Cash Spent | |||||
| Sales Tax, VAT, HST/GST Paid Out | $0 | $0 | $0 | $0 | $0 |
| Principal Repayment of Current Borrowing | $0 | $0 | $0 | $0 | $0 |
| Other Liabilities Principal Repayment | $0 | $0 | $0 | $0 | $0 |
| Long-term Liabilities Principal Repayment | $0 | $0 | $0 | $0 | $0 |
| Purchase Other Current Assets | $0 | $0 | $0 | $0 | $0 |
| Purchase Long-term Assets | $0 | $0 | $0 | $0 | $0 |
| Dividends | $0 | $0 | $0 | $0 | $0 |
| Subtotal Cash Spent | $1,097,011 | $1,354,345 | $1,602,416 | $1,894,626 | $2,242,385 |
| Net Cash Flow | $929,344 | $1,107,238 | $1,351,484 | $1,650,054 | $2,011,231 |
| Cash Balance | $1,585,430 | $2,692,668 | $4,044,152 | $5,694,206 | $7,705,437 |
7.6 Projected Balance Sheet
The following balance sheet shows healthy growth of net worth, and strong financial position. The monthly estimates are included in the appendix.
| Pro Forma Balance Sheet | |||||
| 2001 | 2002 | 2003 | 2004 | 2005 | |
| Assets | |||||
| Current Assets | |||||
| Cash | $1,585,430 | $2,692,668 | $4,044,152 | $5,694,206 | $7,705,437 |
| Accounts Receivable | $172,083 | $206,500 | $247,800 | $297,360 | $356,832 |
| Other Current Assets | $0 | $0 | $0 | $0 | $0 |
| Total Current Assets | $1,757,513 | $2,899,168 | $4,291,952 | $5,991,566 | $8,062,269 |
| Long-term Assets | |||||
| Long-term Assets | $126,588 | $126,588 | $126,588 | $126,588 | $126,588 |
| Accumulated Depreciation | $0 | $0 | $0 | $0 | $0 |
| Total Long-term Assets | $126,588 | $126,588 | $126,588 | $126,588 | $126,588 |
| Total Assets | $1,884,101 | $3,025,756 | $4,418,540 | $6,118,154 | $8,188,857 |
| Liabilities and Capital | 2001 | 2002 | 2003 | 2004 | 2005 |
| Current Liabilities | |||||
| Accounts Payable | $70,709 | $88,237 | $106,211 | $127,831 | $153,805 |
| Current Borrowing | $0 | $0 | $0 | $0 | $0 |
| Other Current Liabilities | $0 | $0 | $0 | $0 | $0 |
| Subtotal Current Liabilities | $70,709 | $88,237 | $106,211 | $127,831 | $153,805 |
| Long-term Liabilities | $0 | $0 | $0 | $0 | $0 |
| Total Liabilities | $70,709 | $88,237 | $106,211 | $127,831 | $153,805 |
| Paid-in Capital | $37,800 | $37,800 | $37,800 | $37,800 | $37,800 |
| Retained Earnings | $858,312 | $1,775,592 | $2,899,719 | $4,274,528 | $5,952,522 |
| Earnings | $917,280 | $1,124,127 | $1,374,810 | $1,677,994 | $2,044,729 |
| Total Capital | $1,813,392 | $2,937,519 | $4,312,328 | $5,990,322 | $8,035,052 |
| Total Liabilities and Capital | $1,884,101 | $3,025,756 | $4,418,540 | $6,118,154 | $8,188,857 |
| Net Worth | $1,813,392 | $2,937,519 | $4,312,328 | $5,990,322 | $8,035,052 |
Appendix
| Sales Forecast | |||||||||||||
| Jan | Feb | Mar | Apr | May | Jun | Jul | Aug | Sep | Oct | Nov | Dec | ||
| Sales | |||||||||||||
| Retainer Consulting | 0% | $46,000 | $46,000 | $46,000 | $46,000 | $46,000 | $50,000 | $50,000 | $50,000 | $50,000 | $50,000 | $50,000 | $50,000 |
| Project Consulting | 0% | $40,000 | $40,000 | $40,000 | $40,000 | $40,000 | $40,000 | $40,000 | $40,000 | $40,000 | $40,000 | $40,000 | $40,000 |
| Market Research & Industrial Analyses | 0% | $30,000 | $30,000 | $30,000 | $30,000 | $30,000 | $30,000 | $30,000 | $30,000 | $30,000 | $30,000 | $30,000 | $30,000 |
| Feasibility Studies | 0% | $30,000 | $30,000 | $30,000 | $30,000 | $30,000 | $30,000 | $30,000 | $30,000 | $30,000 | $30,000 | $30,000 | $30,000 |
| Strategic Analysis and Reports | 0% | $25,000 | $25,000 | $25,000 | $25,000 | $25,000 | $25,000 | $25,000 | $25,000 | $25,000 | $25,000 | $25,000 | $25,000 |
| Other | 0% | $0 | $0 | $0 | $0 | $0 | $0 | $0 | $0 | $0 | $0 | $0 | $0 |
| Total Sales | $171,000 | $171,000 | $171,000 | $171,000 | $171,000 | $175,000 | $175,000 | $175,000 | $175,000 | $175,000 | $175,000 | $175,000 | |
| Direct Cost of Sales | Jan | Feb | Mar | Apr | May | Jun | Jul | Aug | Sep | Oct | Nov | Dec | |
| Retainer Consulting | $9,670 | $9,670 | $9,670 | $9,670 | $9,670 | $9,670 | $9,670 | $9,670 | $9,670 | $9,670 | $9,670 | $9,670 | |
| Project Consulting | $7,810 | $7,810 | $7,810 | $7,810 | $7,810 | $7,810 | $7,810 | $7,810 | $7,810 | $7,810 | $7,810 | $7,810 | |
| Market Research & Industrial Analyses | $6,000 | $6,000 | $6,000 | $6,000 | $6,000 | $6,000 | $6,000 | $6,000 | $6,000 | $6,000 | $6,000 | $6,000 | |
| Feasibility Studies | $6,000 | $6,000 | $6,000 | $6,000 | $6,000 | $6,000 | $6,000 | $6,000 | $6,000 | $6,000 | $6,000 | $6,000 | |
| Strategic Analysis and Reports | $4,880 | $4,880 | $4,880 | $4,880 | $4,880 | $4,880 | $4,880 | $4,880 | $4,880 | $4,880 | $4,880 | $4,880 | |
| Other | $0 | $0 | $0 | $0 | $0 | $0 | $0 | $0 | $0 | $0 | $0 | $0 | |
| Subtotal Direct Cost of Sales | $34,360 | $34,360 | $34,360 | $34,360 | $34,360 | $34,360 | $34,360 | $34,360 | $34,360 | $34,360 | $34,360 | $34,360 | |
| Personnel Plan | |||||||||||||
| Jan | Feb | Mar | Apr | May | Jun | Jul | Aug | Sep | Oct | Nov | Dec | ||
| Vice President Sales & Marketing | 0% | $2,000 | $2,000 | $2,000 | $2,000 | $2,000 | $2,000 | $2,000 | $2,000 | $2,000 | $2,000 | $2,000 | $2,000 |
| Technical Sales B2B | 0% | $1,200 | $1,200 | $1,200 | $1,200 | $1,200 | $1,200 | $1,200 | $1,200 | $1,200 | $1,200 | $1,200 | $1,200 |
| Technical Sales B2C | 0% | $1,200 | $1,200 | $1,200 | $1,200 | $1,200 | $1,200 | $1,200 | $1,200 | $1,200 | $1,200 | $1,200 | $1,200 |
| Secretary – Sales & Marketing Office | 0% | $300 | $300 | $300 | $300 | $300 | $300 | $300 | $300 | $300 | $300 | $300 | $300 |
| Vice President Operations | 0% | $2,000 | $2,000 | $2,000 | $2,000 | $2,000 | $2,000 | $2,000 | $2,000 | $2,000 | $2,000 | $2,000 | $2,000 |
| Senior Consultant – Marketing | 0% | $1,200 | $1,200 | $1,200 | $1,200 | $1,200 | $1,200 | $1,200 | $1,200 | $1,200 | $1,200 | $1,200 | $1,200 |
| Senior Consultant – Finance Management | 0% | $1,200 | $1,200 | $1,200 | $1,200 | $1,200 | $1,200 | $1,200 | $1,200 | $1,200 | $1,200 | $1,200 | $1,200 |
| Senior Consultant – Strategic Management | 0% | $1,200 | $1,200 | $1,200 | $1,200 | $1,200 | $1,200 | $1,200 | $1,200 | $1,200 | $1,200 | $1,200 | $1,200 |
| Secretary – Operations Office | 0% | $300 | $300 | $300 | $300 | $300 | $300 | $300 | $300 | $300 | $300 | $300 | $300 |
| VP Internal Business Management | 0% | $2,000 | $2,000 | $2,000 | $2,000 | $2,000 | $2,000 | $2,000 | $2,000 | $2,000 | $2,000 | $2,000 | $2,000 |
| Accountant | 0% | $1,200 | $1,200 | $1,200 | $1,200 | $1,200 | $1,200 | $1,200 | $1,200 | $1,200 | $1,200 | $1,200 | $1,200 |
| Legal Officer | 0% | $1,200 | $1,200 | $1,200 | $1,200 | $1,200 | $1,200 | $1,200 | $1,200 | $1,200 | $1,200 | $1,200 | $1,200 |
| Administrative Officer | 0% | $1,200 | $1,200 | $1,200 | $1,200 | $1,200 | $1,200 | $1,200 | $1,200 | $1,200 | $1,200 | $1,200 | $1,200 |
| HRD Officer | 0% | $1,200 | $1,200 | $1,200 | $1,200 | $1,200 | $1,200 | $1,200 | $1,200 | $1,200 | $1,200 | $1,200 | $1,200 |
| President/CEO | 0% | $4,000 | $4,000 | $4,000 | $4,000 | $4,000 | $4,000 | $4,000 | $4,000 | $4,000 | $4,000 | $4,000 | $4,000 |
| Secretary to the CEO | 0% | $500 | $500 | $500 | $500 | $500 | $500 | $500 | $500 | $500 | $500 | $500 | $500 |
| Bookkeeper | 0% | $300 | $300 | $300 | $300 | $300 | $300 | $300 | $300 | $300 | $300 | $300 | $300 |
| Clerical | 0% | $100 | $100 | $100 | $100 | $100 | $100 | $100 | $100 | $100 | $100 | $100 | $100 |
| Clerical | 0% | $100 | $100 | $100 | $100 | $100 | $100 | $100 | $100 | $100 | $100 | $100 | $100 |
| Clerical | 0% | $100 | $100 | $100 | $100 | $100 | $100 | $100 | $100 | $100 | $100 | $100 | $100 |
| Clerical | 0% | $100 | $100 | $100 | $100 | $100 | $100 | $100 | $100 | $100 | $100 | $100 | $100 |
| Total People | 0 | 0 | 0 | 0 | 0 | 0 | 0 | 0 | 0 | 0 | 0 | 0 | |
| Total Payroll | $22,600 | $22,600 | $22,600 | $22,600 | $22,600 | $22,600 | $22,600 | $22,600 | $22,600 | $22,600 | $22,600 | $22,600 | |
| General Assumptions | |||||||||||||
| Jan | Feb | Mar | Apr | May | Jun | Jul | Aug | Sep | Oct | Nov | Dec | ||
| Plan Month | 1 | 2 | 3 | 4 | 5 | 6 | 7 | 8 | 9 | 10 | 11 | 12 | |
| Current Interest Rate | 9.00% | 9.00% | 9.00% | 9.00% | 9.00% | 9.00% | 9.00% | 9.00% | 9.00% | 9.00% | 9.00% | 9.00% | |
| Long-term Interest Rate | 9.00% | 9.00% | 9.00% | 9.00% | 9.00% | 9.00% | 9.00% | 9.00% | 9.00% | 9.00% | 9.00% | 9.00% | |
| Tax Rate | 25.00% | 25.00% | 25.00% | 25.00% | 25.00% | 25.00% | 25.00% | 25.00% | 25.00% | 25.00% | 25.00% | 25.00% | |
| Other | 0 | 0 | 0 | 0 | 0 | 0 | 0 | 0 | 0 | 0 | 0 | 0 | |
| Pro Forma Profit and Loss | |||||||||||||
| Jan | Feb | Mar | Apr | May | Jun | Jul | Aug | Sep | Oct | Nov | Dec | ||
| Sales | $171,000 | $171,000 | $171,000 | $171,000 | $171,000 | $175,000 | $175,000 | $175,000 | $175,000 | $175,000 | $175,000 | $175,000 | |
| Direct Cost of Sales | $34,360 | $34,360 | $34,360 | $34,360 | $34,360 | $34,360 | $34,360 | $34,360 | $34,360 | $34,360 | $34,360 | $34,360 | |
| Other | $0 | $0 | $0 | $0 | $0 | $0 | $0 | $0 | $0 | $0 | $0 | $0 | |
| Total Cost of Sales | $34,360 | $34,360 | $34,360 | $34,360 | $34,360 | $34,360 | $34,360 | $34,360 | $34,360 | $34,360 | $34,360 | $34,360 | |
| Gross Margin | $136,640 | $136,640 | $136,640 | $136,640 | $136,640 | $140,640 | $140,640 | $140,640 | $140,640 | $140,640 | $140,640 | $140,640 | |
| Gross Margin % | 79.91% | 79.91% | 79.91% | 79.91% | 79.91% | 80.37% | 80.37% | 80.37% | 80.37% | 80.37% | 80.37% | 80.37% | |
| Expenses | |||||||||||||
| Payroll | $22,600 | $22,600 | $22,600 | $22,600 | $22,600 | $22,600 | $22,600 | $22,600 | $22,600 | $22,600 | $22,600 | $22,600 | |
| Sales and Marketing and Other Expenses | $10,500 | $4,500 | $2,000 | $12,500 | $2,000 | $2,000 | $8,000 | $15,000 | $2,000 | $2,000 | $19,500 | $5,000 | |
| Depreciation | $0 | $0 | $0 | $0 | $0 | $0 | $0 | $0 | $0 | $0 | $0 | $0 | |
| Leased Equipment | $0 | $0 | $0 | $0 | $0 | $0 | $0 | $0 | $0 | $0 | $0 | $0 | |
| Utilities | $600 | $600 | $600 | $600 | $600 | $600 | $600 | $600 | $600 | $600 | $600 | $600 | |
| Insurance | $180 | $180 | $180 | $180 | $180 | $180 | $180 | $180 | $180 | $180 | $180 | $180 | |
| Office Rent | $3,200 | $3,200 | $3,200 | $3,200 | $3,200 | $3,200 | $3,200 | $3,200 | $3,200 | $3,200 | $3,200 | $3,200 | |
| Payroll Taxes | 15% | $3,390 | $3,390 | $3,390 | $3,390 | $3,390 | $3,390 | $3,390 | $3,390 | $3,390 | $3,390 | $3,390 | $3,390 |
| Other | $0 | $0 | $0 | $0 | $0 | $0 | $0 | $0 | $0 | $0 | $0 | $0 | |
| Total Operating Expenses | $40,470 | $34,470 | $31,970 | $42,470 | $31,970 | $31,970 | $37,970 | $44,970 | $31,970 | $31,970 | $49,470 | $34,970 | |
| Profit Before Interest and Taxes | $96,170 | $102,170 | $104,670 | $94,170 | $104,670 | $108,670 | $102,670 | $95,670 | $108,670 | $108,670 | $91,170 | $105,670 | |
| EBITDA | $96,170 | $102,170 | $104,670 | $94,170 | $104,670 | $108,670 | $102,670 | $95,670 | $108,670 | $108,670 | $91,170 | $105,670 | |
| Interest Expense | $0 | $0 | $0 | $0 | $0 | $0 | $0 | $0 | $0 | $0 | $0 | $0 | |
| Taxes Incurred | $24,043 | $25,543 | $26,168 | $23,543 | $26,168 | $27,168 | $25,668 | $23,918 | $27,168 | $27,168 | $22,793 | $26,418 | |
| Net Profit | $72,128 | $76,628 | $78,503 | $70,628 | $78,503 | $81,503 | $77,003 | $71,753 | $81,503 | $81,503 | $68,378 | $79,253 | |
| Net Profit/Sales | 42.18% | 44.81% | 45.91% | 41.30% | 45.91% | 46.57% | 44.00% | 41.00% | 46.57% | 46.57% | 39.07% | 45.29% | |
| Pro Forma Cash Flow | |||||||||||||
| Jan | Feb | Mar | Apr | May | Jun | Jul | Aug | Sep | Oct | Nov | Dec | ||
| Cash Received | |||||||||||||
| Cash from Operations | |||||||||||||
| Cash Sales | $85,500 | $85,500 | $85,500 | $85,500 | $85,500 | $87,500 | $87,500 | $87,500 | $87,500 | $87,500 | $87,500 | $87,500 | |
| Cash from Receivables | $59,219 | $62,069 | $85,500 | $85,500 | $85,500 | $85,500 | $85,567 | $87,500 | $87,500 | $87,500 | $87,500 | $87,500 | |
| Subtotal Cash from Operations | $144,719 | $147,569 | $171,000 | $171,000 | $171,000 | $173,000 | $173,067 | $175,000 | $175,000 | $175,000 | $175,000 | $175,000 | |
| Additional Cash Received | |||||||||||||
| Sales Tax, VAT, HST/GST Received | 0.00% | $0 | $0 | $0 | $0 | $0 | $0 | $0 | $0 | $0 | $0 | $0 | $0 |
| New Current Borrowing | $0 | $0 | $0 | $0 | $0 | $0 | $0 | $0 | $0 | $0 | $0 | $0 | |
| New Other Liabilities (interest-free) | $0 | $0 | $0 | $0 | $0 | $0 | $0 | $0 | $0 | $0 | $0 | $0 | |
| New Long-term Liabilities | $0 | $0 | $0 | $0 | $0 | $0 | $0 | $0 | $0 | $0 | $0 | $0 | |
| Sales of Other Current Assets | $0 | $0 | $0 | $0 | $0 | $0 | $0 | $0 | $0 | $0 | $0 | $0 | |
| Sales of Long-term Assets | $0 | $0 | $0 | $0 | $0 | $0 | $0 | $0 | $0 | $0 | $0 | $0 | |
| New Investment Received | $0 | $0 | $0 | $0 | $0 | $0 | $0 | $0 | $0 | $0 | $0 | $0 | |
| Subtotal Cash Received | $144,719 | $147,569 | $171,000 | $171,000 | $171,000 | $173,000 | $173,067 | $175,000 | $175,000 | $175,000 | $175,000 | $175,000 | |
| Expenditures | Jan | Feb | Mar | Apr | May | Jun | Jul | Aug | Sep | Oct | Nov | Dec | |
| Expenditures from Operations | |||||||||||||
| Cash Spending | $22,600 | $22,600 | $22,600 | $22,600 | $22,600 | $22,600 | $22,600 | $22,600 | $22,600 | $22,600 | $22,600 | $22,600 | |
| Bill Payments | $7,542 | $76,123 | $71,710 | $70,160 | $77,510 | $69,931 | $71,048 | $75,573 | $80,323 | $70,898 | $71,335 | $83,660 | |
| Subtotal Spent on Operations | $30,142 | $98,723 | $94,310 | $92,760 | $100,110 | $92,531 | $93,648 | $98,173 | $102,923 | $93,498 | $93,935 | $106,260 | |
| Additional Cash Spent | |||||||||||||
| Sales Tax, VAT, HST/GST Paid Out | $0 | $0 | $0 | $0 | $0 | $0 | $0 | $0 | $0 | $0 | $0 | $0 | |
| Principal Repayment of Current Borrowing | $0 | $0 | $0 | $0 | $0 | $0 | $0 | $0 | $0 | $0 | $0 | $0 | |
| Other Liabilities Principal Repayment | $0 | $0 | $0 | $0 | $0 | $0 | $0 | $0 | $0 | $0 | $0 | $0 | |
| Long-term Liabilities Principal Repayment | $0 | $0 | $0 | $0 | $0 | $0 | $0 | $0 | $0 | $0 | $0 | $0 | |
| Purchase Other Current Assets | $0 | $0 | $0 | $0 | $0 | $0 | $0 | $0 | $0 | $0 | $0 | $0 | |
| Purchase Long-term Assets | $0 | $0 | $0 | $0 | $0 | $0 | $0 | $0 | $0 | $0 | $0 | $0 | |
| Dividends | $0 | $0 | $0 | $0 | $0 | $0 | $0 | $0 | $0 | $0 | $0 | $0 | |
| Subtotal Cash Spent | $30,142 | $98,723 | $94,310 | $92,760 | $100,110 | $92,531 | $93,648 | $98,173 | $102,923 | $93,498 | $93,935 | $106,260 | |
| Net Cash Flow | $114,577 | $48,847 | $76,690 | $78,240 | $70,890 | $80,469 | $79,419 | $76,828 | $72,078 | $81,503 | $81,065 | $68,740 | |
| Cash Balance | $770,663 | $819,509 | $896,199 | $974,439 | $1,045,329 | $1,125,798 | $1,205,217 | $1,282,045 | $1,354,122 | $1,435,625 | $1,516,690 | $1,585,430 | |
| Pro Forma Balance Sheet | |||||||||||||
| Jan | Feb | Mar | Apr | May | Jun | Jul | Aug | Sep | Oct | Nov | Dec | ||
| Assets | Starting Balances | ||||||||||||
| Current Assets | |||||||||||||
| Cash | $656,086 | $770,663 | $819,509 | $896,199 | $974,439 | $1,045,329 | $1,125,798 | $1,205,217 | $1,282,045 | $1,354,122 | $1,435,625 | $1,516,690 | $1,585,430 |
| Accounts Receivable | $118,438 | $144,719 | $168,150 | $168,150 | $168,150 | $168,150 | $170,150 | $172,083 | $172,083 | $172,083 | $172,083 | $172,083 | $172,083 |
| Other Current Assets | $0 | $0 | $0 | $0 | $0 | $0 | $0 | $0 | $0 | $0 | $0 | $0 | $0 |
| Total Current Assets | $774,524 | $915,382 | $987,659 | $1,064,349 | $1,142,589 | $1,213,479 | $1,295,948 | $1,377,301 | $1,454,128 | $1,526,206 | $1,607,708 | $1,688,773 | $1,757,513 |
| Long-term Assets | |||||||||||||
| Long-term Assets | $126,588 | $126,588 | $126,588 | $126,588 | $126,588 | $126,588 | $126,588 | $126,588 | $126,588 | $126,588 | $126,588 | $126,588 | $126,588 |
| Accumulated Depreciation | $0 | $0 | $0 | $0 | $0 | $0 | $0 | $0 | $0 | $0 | $0 | $0 | $0 |
| Total Long-term Assets | $126,588 | $126,588 | $126,588 | $126,588 | $126,588 | $126,588 | $126,588 | $126,588 | $126,588 | $126,588 | $126,588 | $126,588 | $126,588 |
| Total Assets | $901,112 | $1,041,969 | $1,114,247 | $1,190,937 | $1,269,177 | $1,340,067 | $1,422,536 | $1,503,888 | $1,580,716 | $1,652,793 | $1,734,296 | $1,815,361 | $1,884,101 |
| Liabilities and Capital | Jan | Feb | Mar | Apr | May | Jun | Jul | Aug | Sep | Oct | Nov | Dec | |
| Current Liabilities | |||||||||||||
| Accounts Payable | $5,000 | $73,730 | $69,380 | $67,568 | $75,180 | $67,568 | $68,534 | $72,884 | $77,959 | $68,534 | $68,534 | $81,222 | $70,709 |
| Current Borrowing | $0 | $0 | $0 | $0 | $0 | $0 | $0 | $0 | $0 | $0 | $0 | $0 | $0 |
| Other Current Liabilities | $0 | $0 | $0 | $0 | $0 | $0 | $0 | $0 | $0 | $0 | $0 | $0 | $0 |
| Subtotal Current Liabilities | $5,000 | $73,730 | $69,380 | $67,568 | $75,180 | $67,568 | $68,534 | $72,884 | $77,959 | $68,534 | $68,534 | $81,222 | $70,709 |
| Long-term Liabilities | $0 | $0 | $0 | $0 | $0 | $0 | $0 | $0 | $0 | $0 | $0 | $0 | $0 |
| Total Liabilities | $5,000 | $73,730 | $69,380 | $67,568 | $75,180 | $67,568 | $68,534 | $72,884 | $77,959 | $68,534 | $68,534 | $81,222 | $70,709 |
| Paid-in Capital | $37,800 | $37,800 | $37,800 | $37,800 | $37,800 | $37,800 | $37,800 | $37,800 | $37,800 | $37,800 | $37,800 | $37,800 | $37,800 |
| Retained Earnings | $12,762 | $858,312 | $858,312 | $858,312 | $858,312 | $858,312 | $858,312 | $858,312 | $858,312 | $858,312 | $858,312 | $858,312 | $858,312 |
| Earnings | $845,550 | $72,128 | $148,755 | $227,258 | $297,885 | $376,388 | $457,890 | $534,893 | $606,645 | $688,148 | $769,650 | $838,028 | $917,280 |
| Total Capital | $896,112 | $968,239 | $1,044,867 | $1,123,369 | $1,193,997 | $1,272,499 | $1,354,002 | $1,431,004 | $1,502,757 | $1,584,259 | $1,665,762 | $1,734,139 | $1,813,392 |
| Total Liabilities and Capital | $901,112 | $1,041,969 | $1,114,247 | $1,190,937 | $1,269,177 | $1,340,067 | $1,422,536 | $1,503,888 | $1,580,716 | $1,652,793 | $1,734,296 | $1,815,361 | $1,884,101 |
| Net Worth | $896,112 | $968,239 | $1,044,867 | $1,123,369 | $1,193,997 | $1,272,499 | $1,354,002 | $1,431,004 | $1,502,757 | $1,584,259 | $1,665,762 | $1,734,139 | $1,813,392 |


