
Classique Gifts Etc.
Executive Summary
Classique Gifts Etc. is a start-up retail store offering fine gifts, collectible dolls and doll accessories. The store will be located in Lexington, Kentucky, catering to the middle- and upper-class consumers who look beyond the congested retail malls for the special shopping experience. In addition to offering a wide array of unique, quality products, the consumer will enjoy friendly and knowledgeable customer service and a convenient, uncongested location.
This business plan is prepared to obtain financing in the amount of $50,000 to purchase inventory and to help cover expenses in the first year of operations. We are also asking for a credit line of $10,000 to be used as necessary in low cash flow periods. Brenda and Charles Gajdik will own and operate the store together as a team. They will provide $40,000 in cash as an equity investment to be used in start-up costs, equipment purchases, and operating capital.
The sales forecasts used in this plan are very conservative compared to a similar business now operating in Lexington. Brenda has observed the strengths and weaknesses of this store and is convinced it can be done better.

1.1 Objectives
- To develop Classique Gifts Etc. into the premier gift retail store in Central Kentucky.
- To begin and maintain a gross profit margin above 40% for the first year.
- To acquire a customer base of 4,000 by the end of the second year by using personal customer service and marketing.
- To achieve a substantial net profit by the end of Year 3.
1.2 Mission
Classique Gifts Etc.will be a retail gift store specializing in fine gifts, collectible dolls and doll accessories. We want to provide products from quality suppliers and provide professional customer service in a friendly environment.
1.3 Keys to Success
To succeed in this business we must:
- Sell products the customer desires and are of the highest quality.
- Provide friendly customer service.
- Establish excellent vendor/supplier relations that will facilitate quick shipment of orders.
- Advertise and promote our store immediately to take advantage of the current Christmas shopping season.
- Continuously review our inventory and sales and adjust our inventory levels based on detailed records.
Company Summary
Classique Gifts Etc. is proposed to be a sole-proprietorship company operated by Brenda and Charles Gajdik and is a newly established retail store offering unique gifts and elegant collectible dolls.
Located in Lexington, Kentucky, we will cater to special consumers who are interested in finding unique items to supplement their doll collection or finding a gift that cannot be found in the national chain store in the very busy, very congested shopping mall.
We intend to expand our business by carefully building a repeat customer base and provide the products and merchandise they wish to purchase. We feel it is important to offer personal customer support and services to achieve our business philosophy.
2.1 Company Ownership
Classique Gifts Etc. will begin operation as a sole-proprietorship. The company will be owned by Charles and Brenda Gajdik.
2.2 Start-up Summary
Total current and long-term assets will make up 78% of start-up requirements. Start-up expenses, which are detailed in the following start-up table comprise the remaining 22% at $20,058
Funding
As detailed in the start-up funding table, $90,000 with a $10,000 line of credit will be required to fund Classique Gifts Etc. This proposal is to be accomplished as follows:
- Owners’ investment from Charles and Brenda of $40,000
- Commercial loan of $50,000, calculated at 7% for seven years
- Line of credit of $10,000 to be used as necessary
Details of other start-up expenses include:
- Research and Development:
Buying trip expenses to Columbus, OH. $133 Buying trip expenses to Atlanta, GA. $430 Internet provider service paid in July, for the Year 1 $120 Total $683
- 1st Month Rent & Deposit (proposed location):
Rent = $9.50/square foot $1425/mo. $17,100/yr. Common Area Maintenance (CAM) = $1.50/square foot $225/mo. $2700/yr. Total Rent and CAM $1650/mo.
$19,800/yr.
- Leasehold Improvements:
Slatwall Panels and Accessories 50 panels @ $50 each $2500
Ceiling Tiles 1,400 sq ft @ $.50/sq ft $700
Carpet with Pad 1,400 sq ft @ 2.50/sq ft $3500
Carpenter Estimate Display Risers and Counter $300
Total
$7,000
- Phone line installation: Single line installation $100
- Insurance: Medical insurance for Brenda and Charles $650 first month
- Advertising & Promotion:
Newspaper $76/week for 26 weeks (Community Section on Wednesday) $1976
TV Shopping with Santa in the Bluegrass $1500
Total
$3476
| Start-up | |
| Requirements | |
| Start-up Expenses | |
| Utility Deposits (gas, water, electric) | $600 |
| Legal | $250 |
| Advertising & Promotion | $3,500 |
| Consultants | $200 |
| Insurance: Store Liability | $2,400 |
| Medical Insurance 1st Month | $650 |
| Office Supplies, Gift Wrap and Packaging | $1,500 |
| Leasehold Improvements | $7,000 |
| 1st Month Rent & Deposit | $3,075 |
| Phone line installation | $100 |
| Research and Development | $683 |
| Business Plan Development | $100 |
| Total Start-up Expenses | $20,058 |
| Start-up Assets | |
| Cash Required | $12,185 |
| Start-up Inventory | $45,000 |
| Other Current Assets | $12,757 |
| Long-term Assets | $0 |
| Total Assets | $69,942 |
| Total Requirements | $90,000 |
| Start-up Funding | |
| Start-up Expenses to Fund | $20,058 |
| Start-up Assets to Fund | $69,942 |
| Total Funding Required | $90,000 |
| Assets | |
| Non-cash Assets from Start-up | $57,757 |
| Cash Requirements from Start-up | $12,185 |
| Additional Cash Raised | $0 |
| Cash Balance on Starting Date | $12,185 |
| Total Assets | $69,942 |
| Liabilities and Capital | |
| Liabilities | |
| Current Borrowing | $0 |
| Long-term Liabilities | $50,000 |
| Accounts Payable (Outstanding Bills) | $0 |
| Other Current Liabilities (interest-free) | $0 |
| Total Liabilities | $50,000 |
| Capital | |
| Planned Investment | |
| Charles & Brenda Gajdik | $40,000 |
| Other | $0 |
| Additional Investment Requirement | $0 |
| Total Planned Investment | $40,000 |
| Loss at Start-up (Start-up Expenses) | ($20,058) |
| Total Capital | $19,942 |
| Total Capital and Liabilities | $69,942 |
| Total Funding | $90,000 |
2.2.1 Start-up Current & Long-term Asset Listing
| Description of Asset | Brand | Quantity | Cost |
| Display Cases and Furniture | various |
*$2,000 |
|
| Cash Register | Penny | 1 |
800 |
| Phone System | Radio Shack | 1 |
* 250 |
| Office Furniture | Office Depot | desk, chair,cabinets |
* 750 |
| Computer System | Dell | 1 |
2,261 |
| Additional SW and Services | Quickbooks |
** 700 |
|
| Storefront Channel Sign | Gabbard | 1 |
5,996 |
| TOTAL |
$12,757 |
||
| *budgeted amounts | **including annual payroll service |
2.3 Location: Proposed
The most desirable location we have found is in Imperial Plaza Shopping Center located on Waller Avenue. The center will soon be renamed to Waller Center. The property manager estimates that 20,000 cars pass this center daily.
Imperial Plaza: This location has 1,800 sq. ft. and is priced at $9.50 per sq. ft. The CAM expense is $1.50 per sq. ft. and is adjustable and refundable at the end of the year. In other words, if the common area maintenance fund has not been fully used during the year, the remaining portion of the fund will be credited toward the tenant’s lease payment.
Approximately 350 sq ft in the back room can be used as work space and storage. The sales counter is adequate but could use some paint. The drop-down ceiling panels need to be replaced. The floor needs carpet and the walls need to have the pegboard panels removed or covered with slatwall. The window display risers are adequate but could use some carpet.
Monthly rent is $1,425 and the Common Area Maintenance (CAM) is $225 for a total of $1,650 per month. However, the owner’s representative said he would consider taking less. All appropriate insurance for liability and inventory is the tenant’s responsibility. The owner appears to be very flexible and helpful. The start-up leasehold expenses have been based on this property.
Other potential sites we have looked at are as follows:
Southland Drive: The location has 2,000 sq. ft. at the very end of Southland Drive close to Lane Allen Rd. It was previously occupied by Southland Florists, which moved to a new location. The property has been available for about three years. The space is one of 4 or 5 spaces of the same size in a stand-alone building at the end of Southland Shopping Center.

The back room, which serves as a work and storage area, has a bathroom and will need remodeling. The floor will need new tile and some of the walls in back need repair.
There is an office area with a separate ceiling which should be removed for additional ventilation. An additional small room is adjacent to the office and should be removed to provide additional retail floor space.
The retail portion of the property needs the carpet replaced. The sales counter and the display window risers need to be replaced. The front door needs advertising material removed and the walls throughout the front and back need painting. The entire ceiling must be repaired.
The business sign must be flat against the outside surface. The existing sign with a new face can be utilized. However, the signs cannot be seen from Southland Drive because of three very large pine trees blocking the view. Parking is small but probably adequate for these shops.
The rent is $1,800 per month with the first month free for renovation. There is no common area maintenance (CAM) charge. The deposit is $1,800 and is due along with the first month’s rent. The tenant must provide the appropriate insurance for liability and protection of his assets. The owner said he would repair the ceiling and walls. The tenant is responsible for all other leasehold improvements.
This space will need considerable leasehold improvements. An existing tenant next door is not happy with the owner or her current situation and has only been in the location for six months.
Chinoe Center: The location has 2,280 sq ft in an upscale strip center with a mix of office space and retail outlets anchored by Kroger Supermarket Grocery Store. The property is located next to Kroger and with the right sign will receive a tremendous amount of visual advertisement exposure with the Kroger traffic. However, there is no display window, which explains the relatively inexpensive rent and CAM expenses. We have not seen the inside space.
The door leading to the space is located between a carryout Pizza store and Kroger. The door leads to a hallway about 25 to 30 feet long into a space which turns into three separate oddly shaped rooms. The space was previously used as a modern dance studio.
The space is priced at $8 per sq ft and $1.65 per sq ft CAM fee. That is $1,833.50 per month. The tenant assumes full insurance responsibility for inventory and liability.
Products
Classique Gifts Etc. plans to carry special occasion gifts and merchandise from the San Francisco Music Box Company, Swarovski crystal, Lennox crystal, Outback Chair Company, Traditions Artglass Company, children’s books from Harvest House and other suppliers who display their products at the Atlanta International Gift Market or the Columbus Marketplace for Gift, Garden and Home.
We will also purchase merchandise from the most well-known collectible doll manufacturers and suppliers in the United States, including Steiff, Madame Alexander, Turner Dolls, Lee Middleton, Wendy Lawton, Susan Wakeen, Kish Dolls, Lloyd Middleton and others that provide the quality products that our customers wish to purchase.
Market Analysis Summary
According to Pam Danziger, President of Unity Marketing, the collectible doll industry generated $3 billion in retail sales in 2000. The gift industry, which includes general gifts, collectibles, stationery and greeting cards, generated $54 billion in sales in 2002. As predicted by Unity Marketing, “the future of the gifts and home accents market is positive for the next several years.” Source:Unity Marketing, The Home Report 2001:The Market, The Competitors, The Trends
4.1 Market Segmentation
The ideal customer we expect to serve is:
- Middle to Upper Class
- Primarily Female
- 30-75 Years of Age
- Educated
- Homeowner
- Quality Conscious
- Value Conscious
- Family Oriented
We will attract these customers by offering unique and uncommon product selections not found in the mass-market retail stores.
4.2 Industry Analysis
- More and more consumers are seeking independent retailers that offer them the feel of home with a more personalized shopping experience.
- As consumers become more time-deprived, they are looking to shop at stores whose service offerings are as equal in quality and value to their products.
4.2.1 Competition and Buying Patterns
Brand name products sell well in stores that maintain a good selection, good location, and knowledgeable, friendly employees. These are the most important factors when selling collectibles and gifts.
There is only one store in the Lexington area that carries a wide variety of collectible dolls. However, the doll inventory only makes up about 25% of the total inventory. We do not consider this store serious competition because their lease for the 4800 sq. ft. store expires in March, 2004, and it is rumored the business will not renew the lease.
Other stores in the Central Kentucky area carry one or two lines of dolls but do not offer a wide variety of collectible doll lines. We intend to offer many different doll lines, doll accessories, personalized knowledgeable service, and a variety of other unique gift merchandise.
The Internet offers dolls at discount prices. However, most of the merchandise is retired or discontinued lines that the manufacturers sell in bulk at discount wholesale prices. These are not the products we intend to carry in Classique Gifts Etc.
We intend to develop a web page at some point, probably in year three to market our merchandise on the Internet.
Strategy and Implementation Summary
Classique Gifts Etc. will develop product offerings and marketing strategy to increase its customer base while driving sales and profit. The following sections review the various strategies that will support this effort.
5.1 Marketing Strategy
Classique Gifts Etc. will focus its marketing efforts by advertising in the Lexington Herald-Leader and Insight Media Advertising on cable TV.
We will also increase consumer awareness, retain the existing customer base and promote sales via seasonal postcard and newsletter mailings. The mailings will announce special events or holiday specials during the year. These events will be used to sell slow-moving products and vendor special promotions. This means our marketing resources will be centered around both sales promotions (events, displays) and personal sales (customer service, friendly atmosphere).
Classique Gifts Etc. will offer $5 coupons for every $100 spent. The coupon can be used by the customer on future visits to the store.
5.2 Sales Strategy
Classique Gifts Etc. will approach sales from a salesperson-customer relationship basis. All customers will be assisted in a very personal manner. Gathering key customer information and seeking performance feedback on the products and services offered will assist us in the following ways:
- Targeting our marketing efforts more effectively.
- Developing product offers and merchandising formats that will increase sales.
- Developing services that enhance the shopping experience.
- Increase awareness of Classique Gifts Etc. within the retail consumer marketplace.
- Develop future sales opportunities that allow for continued growth of the business.
5.2.1 Sales Forecast
Sales in the retail gift and collectible doll industry is enhanced by seasonal holidays and special gift giving occasions. The following sales forecast is from direct retail sales and does not include miscellaneous income. The figures also include dips in sales for those slow periods the business usually experiences in the summer months.

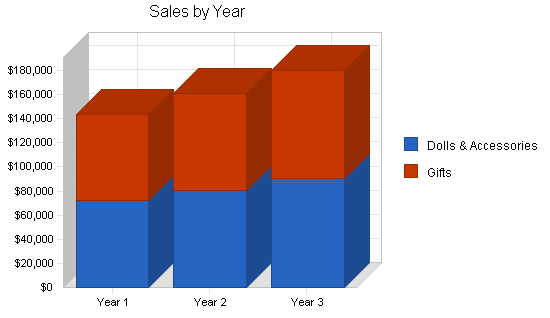
| Sales Forecast | |||
| Year 1 | Year 2 | Year 3 | |
| Sales | |||
| Dolls & Accessories | $72,105 | $80,758 | $90,449 |
| Gifts | $71,405 | $79,974 | $89,570 |
| Total Sales | $143,510 | $160,731 | $180,019 |
| Direct Cost of Sales | Year 1 | Year 2 | Year 3 |
| Dolls & Accessories | $40,871 | $42,915 | $45,060 |
| Gifts | $40,885 | $42,929 | $45,076 |
| Subtotal Direct Cost of Sales | $81,756 | $85,844 | $90,136 |
5.3 Competitive Edge
Classique Gifts Etc. will establish itself competitively as a unique retail environment through product offering and friendly, personal customer service. With St. Joseph Hospital, medical offices, the Kentucky Inn, the University of Kentucky and the Campbell House all located within 1/2 mile of the proposed site, we will attempt to offer items that appeal to this diverse population as well as the doll collector.
5.4 Milestones
The following table lists important milestone dates.
| Milestones | |||||
| Milestone | Start Date | End Date | Budget | Manager | Department |
| Business Plan | 11/1/2003 | 11/18/2003 | $0 | Charles | Department |
| Secure Funding | 11/18/2003 | 12/31/2003 | $0 | Charles | Department |
| Negotiate and Sign Lease | 11/18/2003 | 12/31/2003 | $0 | Charles | Department |
| Business Setup | 11/18/2003 | 12/31/2003 | $0 | Charles | Department |
| Leasehold Improvements | 11/18/2003 | 12/31/2003 | $0 | Charles | Department |
| Purchase Start-up Equipment | 11/18/2003 | 12/31/2003 | $0 | Charles | Department |
| Advertising Developed | 1/1/2004 | 2/1/2004 | $0 | Charles/Brenda | Department |
| Store Open For Business | 2/1/2004 | 2/2/2004 | $0 | Charles/Brenda | Department |
| Totals | $0 | ||||
Management Summary
Classique Gifts Etc. will be managed and operated on a daily basis by Brenda and Charles Gajdik, a husband and wife team.
Brenda will manage merchandising, sales, customer relations, and all part-time staff. She will also provide the information necessary to develop a marketing plan to attract repeat customers. Brenda has been employed for three years at Schwab’s Collectibles, a retail collectible and gift store in Lexington. She is currently the assistant store manager which she has held for two years. Some of her management duties include shipping and receiving, merchandising, and sales. She has always served the public in most every position she has previously held. She understands what customer service is and has a loyal following of repeat customers.
Charles will manage the finances and financial records, operations, data processing and assist in all other areas of the business. Charles has 14 years experience in accounting and nearly 15 years experience in information technology as an Information Systems (IS) Support Specialist. He also maintains the financial records for a family owned business and has some experience in retail sales.
6.1 Personnel Plan
The personnel plan is included in the following table. It shows the owners’ salaries along with one part-time employee used as needed.
| Personnel Plan | |||
| Year 1 | Year 2 | Year 3 | |
| Brenda Owner/Manager-Sales & Merchandising | $14,600 | $16,000 | $16,000 |
| Charles Owner/Manager-Operations & Finance | $9,000 | $14,000 | $14,000 |
| Part-Time as Needed ($7 per hour) | $3,120 | $4,120 | $5,120 |
| Total People | 3 | 3 | 3 |
| Total Payroll | $26,720 | $34,120 | $35,120 |
Financial Plan
- Growth will be moderate.
- Costs will be managed and forecasts for future needs will be performed on a regular basis.
- Finding the right product, at the right price will enable the business to meet planned margins and maintain inventory at an acceptable level.
7.1 Important Assumptions
Key assumptions are:
- We do not sell anything on credit.
- We assume the continued popularity of collectibles.
- We assume access to financing sufficient to maintain our financial plan as shown in the tables.
| General Assumptions | |||
| Year 1 | Year 2 | Year 3 | |
| Plan Month | 1 | 2 | 3 |
| Current Interest Rate | 6.00% | 6.00% | 6.00% |
| Long-term Interest Rate | 7.00% | 7.00% | 7.00% |
| Tax Rate | 30.00% | 30.00% | 30.00% |
| Other | 0 | 0 | 0 |
7.2 Projected Profit and Loss
The following table shows our planned three-year profit and loss estimates. We expect to have a gross margin percent above 40% our first year, which will continue to grow in years two and three.
The associated charts show that we will have a negative profit/sales percentage for the first two years with a positive net profit by year three.


| Pro Forma Profit and Loss | |||
| Year 1 | Year 2 | Year 3 | |
| Sales | $143,510 | $160,731 | $180,019 |
| Direct Cost of Sales | $81,756 | $85,844 | $90,136 |
| Other Costs of Goods | $0 | $0 | $0 |
| Total Cost of Sales | $81,756 | $85,844 | $90,136 |
| Gross Margin | $61,754 | $74,887 | $89,883 |
| Gross Margin % | 43.03% | 46.59% | 49.93% |
| Expenses | |||
| Payroll | $26,720 | $34,120 | $35,120 |
| Sales and Marketing and Other Expenses | $600 | $1,200 | $2,400 |
| Depreciation | $0 | $0 | $0 |
| Rent and CAM Expense | $18,150 | $18,150 | $18,150 |
| Utilities | $3,600 | $3,600 | $3,600 |
| Liability Insurance:Store | $0 | $2,400 | $2,400 |
| Insurance (medical Brenda & Charles) | $7,800 | $7,150 | $7,150 |
| Payroll Taxes | $0 | $0 | $0 |
| Other | $0 | $0 | $0 |
| Total Operating Expenses | $56,870 | $66,620 | $68,820 |
| Profit Before Interest and Taxes | $4,884 | $8,267 | $21,063 |
| EBITDA | $4,884 | $8,267 | $21,063 |
| Interest Expense | $3,156 | $2,549 | $1,915 |
| Taxes Incurred | $518 | $1,716 | $5,745 |
| Net Profit | $1,209 | $4,003 | $13,404 |
| Net Profit/Sales | 0.84% | 2.49% | 7.45% |
7.3 Break-even Analysis
The following table and chart show our estimated monthly revenue break-even point.

| Break-even Analysis | |
| Monthly Revenue Break-even | $11,013 |
| Assumptions: | |
| Average Percent Variable Cost | 57% |
| Estimated Monthly Fixed Cost | $4,739 |
7.4 Projected Cash Flow
The following table and chart represents the projected cash flow.

| Pro Forma Cash Flow | |||
| Year 1 | Year 2 | Year 3 | |
| Cash Received | |||
| Cash from Operations | |||
| Cash Sales | $143,510 | $160,731 | $180,019 |
| Subtotal Cash from Operations | $143,510 | $160,731 | $180,019 |
| Additional Cash Received | |||
| Sales Tax, VAT, HST/GST Received | $0 | $0 | $0 |
| New Current Borrowing | $0 | $0 | $0 |
| New Other Liabilities (interest-free) | $0 | $0 | $0 |
| New Long-term Liabilities | $0 | $0 | $0 |
| Sales of Other Current Assets | $0 | $0 | $0 |
| Sales of Long-term Assets | $0 | $0 | $0 |
| New Investment Received | $0 | $0 | $0 |
| Subtotal Cash Received | $143,510 | $160,731 | $180,019 |
| Expenditures | Year 1 | Year 2 | Year 3 |
| Expenditures from Operations | |||
| Cash Spending | $26,720 | $34,120 | $35,120 |
| Bill Payments | $67,291 | $124,798 | $131,213 |
| Subtotal Spent on Operations | $94,011 | $158,918 | $166,333 |
| Additional Cash Spent | |||
| Sales Tax, VAT, HST/GST Paid Out | $0 | $0 | $0 |
| Principal Repayment of Current Borrowing | $0 | $0 | $0 |
| Other Liabilities Principal Repayment | $0 | $0 | $0 |
| Long-term Liabilities Principal Repayment | $9,060 | $9,060 | $9,060 |
| Purchase Other Current Assets | $0 | $0 | $0 |
| Purchase Long-term Assets | $0 | $0 | $0 |
| Dividends | $0 | $0 | $0 |
| Subtotal Cash Spent | $103,071 | $167,978 | $175,393 |
| Net Cash Flow | $40,439 | ($7,247) | $4,625 |
| Cash Balance | $52,624 | $45,378 | $50,003 |
7.5 Projected Balance Sheet
The following table shows our projected Balance Sheet.
| Pro Forma Balance Sheet | |||
| Year 1 | Year 2 | Year 3 | |
| Assets | |||
| Current Assets | |||
| Cash | $52,624 | $45,378 | $50,003 |
| Inventory | $8,583 | $9,012 | $9,463 |
| Other Current Assets | $12,757 | $12,757 | $12,757 |
| Total Current Assets | $73,964 | $67,147 | $72,223 |
| Long-term Assets | |||
| Long-term Assets | $0 | $0 | $0 |
| Accumulated Depreciation | $0 | $0 | $0 |
| Total Long-term Assets | $0 | $0 | $0 |
| Total Assets | $73,964 | $67,147 | $72,223 |
| Liabilities and Capital | Year 1 | Year 2 | Year 3 |
| Current Liabilities | |||
| Accounts Payable | $11,873 | $10,113 | $10,845 |
| Current Borrowing | $0 | $0 | $0 |
| Other Current Liabilities | $0 | $0 | $0 |
| Subtotal Current Liabilities | $11,873 | $10,113 | $10,845 |
| Long-term Liabilities | $40,940 | $31,880 | $22,820 |
| Total Liabilities | $52,813 | $41,993 | $33,665 |
| Paid-in Capital | $40,000 | $40,000 | $40,000 |
| Retained Earnings | ($20,058) | ($18,849) | ($14,846) |
| Earnings | $1,209 | $4,003 | $13,404 |
| Total Capital | $21,151 | $25,154 | $38,558 |
| Total Liabilities and Capital | $73,964 | $67,147 | $72,223 |
| Net Worth | $21,151 | $25,154 | $38,558 |
7.6 Business Ratios
The following table outlines some of the more important ratios from the Gift Shop industry. The final column, Industry Profile, details specific ratios based on the industry as it is classified by the Standard Industry Classification (SIC) code 5947.
| Ratio Analysis | ||||
| Year 1 | Year 2 | Year 3 | Industry Profile | |
| Sales Growth | 0.00% | 12.00% | 12.00% | 3.34% |
| Percent of Total Assets | ||||
| Inventory | 11.60% | 13.42% | 13.10% | 40.42% |
| Other Current Assets | 17.25% | 19.00% | 17.66% | 23.99% |
| Total Current Assets | 100.00% | 100.00% | 100.00% | 80.29% |
| Long-term Assets | 0.00% | 0.00% | 0.00% | 19.71% |
| Total Assets | 100.00% | 100.00% | 100.00% | 100.00% |
| Current Liabilities | 16.05% | 15.06% | 15.02% | 36.19% |
| Long-term Liabilities | 55.35% | 47.48% | 31.60% | 15.42% |
| Total Liabilities | 71.40% | 62.54% | 46.61% | 51.61% |
| Net Worth | 28.60% | 37.46% | 53.39% | 48.39% |
| Percent of Sales | ||||
| Sales | 100.00% | 100.00% | 100.00% | 100.00% |
| Gross Margin | 43.03% | 46.59% | 49.93% | 37.74% |
| Selling, General & Administrative Expenses | 44.22% | 47.15% | 45.12% | 23.72% |
| Advertising Expenses | 0.00% | 0.00% | 0.00% | 2.14% |
| Profit Before Interest and Taxes | 3.40% | 5.14% | 11.70% | 1.65% |
| Main Ratios | ||||
| Current | 6.23 | 6.64 | 6.66 | 1.98 |
| Quick | 5.51 | 5.75 | 5.79 | 0.74 |
| Total Debt to Total Assets | 71.40% | 62.54% | 46.61% | 3.65% |
| Pre-tax Return on Net Worth | 8.17% | 22.73% | 49.66% | 58.19% |
| Pre-tax Return on Assets | 2.34% | 8.52% | 26.51% | 8.72% |
| Additional Ratios | Year 1 | Year 2 | Year 3 | |
| Net Profit Margin | 0.84% | 2.49% | 7.45% | n.a |
| Return on Equity | 5.72% | 15.91% | 34.76% | n.a |
| Activity Ratios | ||||
| Inventory Turnover | 5.75 | 9.76 | 9.76 | n.a |
| Accounts Payable Turnover | 6.67 | 12.17 | 12.17 | n.a |
| Payment Days | 27 | 33 | 29 | n.a |
| Total Asset Turnover | 1.94 | 2.39 | 2.49 | n.a |
| Debt Ratios | ||||
| Debt to Net Worth | 2.50 | 1.67 | 0.87 | n.a |
| Current Liab. to Liab. | 0.22 | 0.24 | 0.32 | n.a |
| Liquidity Ratios | ||||
| Net Working Capital | $62,091 | $57,034 | $61,378 | n.a |
| Interest Coverage | 1.55 | 3.24 | 11.00 | n.a |
| Additional Ratios | ||||
| Assets to Sales | 0.52 | 0.42 | 0.40 | n.a |
| Current Debt/Total Assets | 16% | 15% | 15% | n.a |
| Acid Test | 5.51 | 5.75 | 5.79 | n.a |
| Sales/Net Worth | 6.78 | 6.39 | 4.67 | n.a |
| Dividend Payout | 0.00 | 0.00 | 0.00 | n.a |
Appendix
| Sales Forecast | |||||||||||||
| Month 1 | Month 2 | Month 3 | Month 4 | Month 5 | Month 6 | Month 7 | Month 8 | Month 9 | Month 10 | Month 11 | Month 12 | ||
| Sales | |||||||||||||
| Dolls & Accessories | 0% | $7,400 | $7,900 | $5,350 | $5,230 | $5,600 | $5,850 | $6,475 | $5,500 | $5,400 | $5,450 | $5,700 | $6,250 |
| Gifts | 0% | $7,400 | $7,900 | $5,250 | $5,230 | $5,500 | $5,750 | $6,375 | $5,400 | $5,300 | $5,450 | $5,600 | $6,250 |
| Total Sales | $14,800 | $15,800 | $10,600 | $10,460 | $11,100 | $11,600 | $12,850 | $10,900 | $10,700 | $10,900 | $11,300 | $12,500 | |
| Direct Cost of Sales | Month 1 | Month 2 | Month 3 | Month 4 | Month 5 | Month 6 | Month 7 | Month 8 | Month 9 | Month 10 | Month 11 | Month 12 | |
| Dolls & Accessories | $3,900 | $4,243 | $2,690 | $2,759 | $3,425 | $3,550 | $3,988 | $2,988 | $3,150 | $3,125 | $3,150 | $3,903 | |
| Gifts | $3,900 | $4,250 | $2,690 | $2,759 | $3,425 | $3,550 | $3,998 | $2,988 | $3,150 | $3,125 | $3,150 | $3,900 | |
| Subtotal Direct Cost of Sales | $7,800 | $8,493 | $5,380 | $5,518 | $6,850 | $7,100 | $7,986 | $5,976 | $6,300 | $6,250 | $6,300 | $7,803 | |
| Personnel Plan | |||||||||||||
| Month 1 | Month 2 | Month 3 | Month 4 | Month 5 | Month 6 | Month 7 | Month 8 | Month 9 | Month 10 | Month 11 | Month 12 | ||
| Brenda Owner/Manager-Sales & Merchandising | 0% | $1,200 | $1,200 | $1,200 | $1,200 | $1,200 | $1,200 | $1,200 | $1,200 | $1,200 | $1,200 | $1,300 | $1,300 |
| Charles Owner/Manager-Operations & Finance | 0% | $0 | $0 | $900 | $900 | $900 | $900 | $900 | $900 | $900 | $900 | $900 | $900 |
| Part-Time as Needed ($7 per hour) | 0% | $280 | $560 | $0 | $0 | $0 | $300 | $300 | $320 | $320 | $320 | $320 | $400 |
| Total People | 3 | 3 | 2 | 2 | 2 | 3 | 3 | 3 | 3 | 3 | 3 | 3 | |
| Total Payroll | $1,480 | $1,760 | $2,100 | $2,100 | $2,100 | $2,400 | $2,400 | $2,420 | $2,420 | $2,420 | $2,520 | $2,600 | |
| General Assumptions | |||||||||||||
| Month 1 | Month 2 | Month 3 | Month 4 | Month 5 | Month 6 | Month 7 | Month 8 | Month 9 | Month 10 | Month 11 | Month 12 | ||
| Plan Month | 1 | 2 | 3 | 4 | 5 | 6 | 7 | 8 | 9 | 10 | 11 | 12 | |
| Current Interest Rate | 6.00% | 6.00% | 6.00% | 6.00% | 6.00% | 6.00% | 6.00% | 6.00% | 6.00% | 6.00% | 6.00% | 6.00% | |
| Long-term Interest Rate | 7.00% | 7.00% | 7.00% | 7.00% | 7.00% | 7.00% | 7.00% | 7.00% | 7.00% | 7.00% | 7.00% | 7.00% | |
| Tax Rate | 30.00% | 30.00% | 30.00% | 30.00% | 30.00% | 30.00% | 30.00% | 30.00% | 30.00% | 30.00% | 30.00% | 30.00% | |
| Other | 0 | 0 | 0 | 0 | 0 | 0 | 0 | 0 | 0 | 0 | 0 | 0 | |
| Pro Forma Profit and Loss | |||||||||||||
| Month 1 | Month 2 | Month 3 | Month 4 | Month 5 | Month 6 | Month 7 | Month 8 | Month 9 | Month 10 | Month 11 | Month 12 | ||
| Sales | $14,800 | $15,800 | $10,600 | $10,460 | $11,100 | $11,600 | $12,850 | $10,900 | $10,700 | $10,900 | $11,300 | $12,500 | |
| Direct Cost of Sales | $7,800 | $8,493 | $5,380 | $5,518 | $6,850 | $7,100 | $7,986 | $5,976 | $6,300 | $6,250 | $6,300 | $7,803 | |
| Other Costs of Goods | $0 | $0 | $0 | $0 | $0 | $0 | $0 | $0 | $0 | $0 | $0 | $0 | |
| Total Cost of Sales | $7,800 | $8,493 | $5,380 | $5,518 | $6,850 | $7,100 | $7,986 | $5,976 | $6,300 | $6,250 | $6,300 | $7,803 | |
| Gross Margin | $7,000 | $7,307 | $5,220 | $4,942 | $4,250 | $4,500 | $4,864 | $4,924 | $4,400 | $4,650 | $5,000 | $4,697 | |
| Gross Margin % | 47.30% | 46.25% | 49.25% | 47.25% | 38.29% | 38.79% | 37.85% | 45.17% | 41.12% | 42.66% | 44.25% | 37.58% | |
| Expenses | |||||||||||||
| Payroll | $1,480 | $1,760 | $2,100 | $2,100 | $2,100 | $2,400 | $2,400 | $2,420 | $2,420 | $2,420 | $2,520 | $2,600 | |
| Sales and Marketing and Other Expenses | $0 | $0 | $0 | $0 | $0 | $0 | $0 | $0 | $0 | $0 | $300 | $300 | |
| Depreciation | $0 | $0 | $0 | $0 | $0 | $0 | $0 | $0 | $0 | $0 | $0 | $0 | |
| Rent and CAM Expense | $0 | $1,650 | $1,650 | $1,650 | $1,650 | $1,650 | $1,650 | $1,650 | $1,650 | $1,650 | $1,650 | $1,650 | |
| Utilities | $300 | $300 | $300 | $300 | $300 | $300 | $300 | $300 | $300 | $300 | $300 | $300 | |
| Liability Insurance:Store | $0 | $0 | $0 | $0 | $0 | $0 | $0 | $0 | $0 | $0 | $0 | $0 | |
| Insurance (medical Brenda & Charles) | $650 | $650 | $650 | $650 | $650 | $650 | $650 | $650 | $650 | $650 | $650 | $650 | |
| Payroll Taxes | 15% | $0 | $0 | $0 | $0 | $0 | $0 | $0 | $0 | $0 | $0 | $0 | $0 |
| Other | $0 | $0 | $0 | $0 | $0 | $0 | $0 | $0 | $0 | $0 | $0 | $0 | |
| Total Operating Expenses | $2,430 | $4,360 | $4,700 | $4,700 | $4,700 | $5,000 | $5,000 | $5,020 | $5,020 | $5,020 | $5,420 | $5,500 | |
| Profit Before Interest and Taxes | $4,570 | $2,947 | $520 | $242 | ($450) | ($500) | ($136) | ($96) | ($620) | ($370) | ($420) | ($803) | |
| EBITDA | $4,570 | $2,947 | $520 | $242 | ($450) | ($500) | ($136) | ($96) | ($620) | ($370) | ($420) | ($803) | |
| Interest Expense | $287 | $283 | $278 | $274 | $270 | $265 | $261 | $256 | $252 | $248 | $243 | $239 | |
| Taxes Incurred | $1,285 | $799 | $72 | ($10) | ($216) | ($230) | ($119) | ($106) | ($262) | ($185) | ($199) | ($313) | |
| Net Profit | $2,998 | $1,865 | $169 | ($22) | ($504) | ($536) | ($278) | ($247) | ($610) | ($432) | ($464) | ($729) | |
| Net Profit/Sales | 20.26% | 11.80% | 1.60% | -0.21% | -4.54% | -4.62% | -2.16% | -2.26% | -5.70% | -3.97% | -4.11% | -5.83% | |
| Pro Forma Cash Flow | |||||||||||||
| Month 1 | Month 2 | Month 3 | Month 4 | Month 5 | Month 6 | Month 7 | Month 8 | Month 9 | Month 10 | Month 11 | Month 12 | ||
| Cash Received | |||||||||||||
| Cash from Operations | |||||||||||||
| Cash Sales | $14,800 | $15,800 | $10,600 | $10,460 | $11,100 | $11,600 | $12,850 | $10,900 | $10,700 | $10,900 | $11,300 | $12,500 | |
| Subtotal Cash from Operations | $14,800 | $15,800 | $10,600 | $10,460 | $11,100 | $11,600 | $12,850 | $10,900 | $10,700 | $10,900 | $11,300 | $12,500 | |
| Additional Cash Received | |||||||||||||
| Sales Tax, VAT, HST/GST Received | 0.00% | $0 | $0 | $0 | $0 | $0 | $0 | $0 | $0 | $0 | $0 | $0 | $0 |
| New Current Borrowing | $0 | $0 | $0 | $0 | $0 | $0 | $0 | $0 | $0 | $0 | $0 | $0 | |
| New Other Liabilities (interest-free) | $0 | $0 | $0 | $0 | $0 | $0 | $0 | $0 | $0 | $0 | $0 | $0 | |
| New Long-term Liabilities | $0 | $0 | $0 | $0 | $0 | $0 | $0 | $0 | $0 | $0 | $0 | $0 | |
| Sales of Other Current Assets | $0 | $0 | $0 | $0 | $0 | $0 | $0 | $0 | $0 | $0 | $0 | $0 | |
| Sales of Long-term Assets | $0 | $0 | $0 | $0 | $0 | $0 | $0 | $0 | $0 | $0 | $0 | $0 | |
| New Investment Received | $0 | $0 | $0 | $0 | $0 | $0 | $0 | $0 | $0 | $0 | $0 | $0 | |
| Subtotal Cash Received | $14,800 | $15,800 | $10,600 | $10,460 | $11,100 | $11,600 | $12,850 | $10,900 | $10,700 | $10,900 | $11,300 | $12,500 | |
| Expenditures | Month 1 | Month 2 | Month 3 | Month 4 | Month 5 | Month 6 | Month 7 | Month 8 | Month 9 | Month 10 | Month 11 | Month 12 | |
| Expenditures from Operations | |||||||||||||
| Cash Spending | $1,480 | $1,760 | $2,100 | $2,100 | $2,100 | $2,400 | $2,400 | $2,420 | $2,420 | $2,420 | $2,520 | $2,600 | |
| Bill Payments | $84 | $2,561 | $3,658 | $2,948 | $2,857 | $2,785 | $6,757 | $11,529 | $6,607 | $9,234 | $8,872 | $9,399 | |
| Subtotal Spent on Operations | $1,564 | $4,321 | $5,758 | $5,048 | $4,957 | $5,185 | $9,157 | $13,949 | $9,027 | $11,654 | $11,392 | $11,999 | |
| Additional Cash Spent | |||||||||||||
| Sales Tax, VAT, HST/GST Paid Out | $0 | $0 | $0 | $0 | $0 | $0 | $0 | $0 | $0 | $0 | $0 | $0 | |
| Principal Repayment of Current Borrowing | $0 | $0 | $0 | $0 | $0 | $0 | $0 | $0 | $0 | $0 | $0 | $0 | |
| Other Liabilities Principal Repayment | $0 | $0 | $0 | $0 | $0 | $0 | $0 | $0 | $0 | $0 | $0 | $0 | |
| Long-term Liabilities Principal Repayment | $755 | $755 | $755 | $755 | $755 | $755 | $755 | $755 | $755 | $755 | $755 | $755 | |
| Purchase Other Current Assets | $0 | $0 | $0 | $0 | $0 | $0 | $0 | $0 | $0 | $0 | $0 | $0 | |
| Purchase Long-term Assets | $0 | $0 | $0 | $0 | $0 | $0 | $0 | $0 | $0 | $0 | $0 | $0 | |
| Dividends | $0 | $0 | $0 | $0 | $0 | $0 | $0 | $0 | $0 | $0 | $0 | $0 | |
| Subtotal Cash Spent | $2,319 | $5,076 | $6,513 | $5,803 | $5,712 | $5,940 | $9,912 | $14,704 | $9,782 | $12,409 | $12,147 | $12,754 | |
| Net Cash Flow | $12,481 | $10,724 | $4,087 | $4,657 | $5,388 | $5,660 | $2,938 | ($3,804) | $918 | ($1,509) | ($847) | ($254) | |
| Cash Balance | $24,666 | $35,390 | $39,477 | $44,134 | $49,522 | $55,182 | $58,120 | $54,315 | $55,234 | $53,725 | $52,878 | $52,624 | |
| Pro Forma Balance Sheet | |||||||||||||
| Month 1 | Month 2 | Month 3 | Month 4 | Month 5 | Month 6 | Month 7 | Month 8 | Month 9 | Month 10 | Month 11 | Month 12 | ||
| Assets | Starting Balances | ||||||||||||
| Current Assets | |||||||||||||
| Cash | $12,185 | $24,666 | $35,390 | $39,477 | $44,134 | $49,522 | $55,182 | $58,120 | $54,315 | $55,234 | $53,725 | $52,878 | $52,624 |
| Inventory | $45,000 | $37,200 | $28,707 | $23,327 | $17,809 | $10,959 | $7,810 | $8,785 | $6,574 | $6,930 | $6,875 | $6,930 | $8,583 |
| Other Current Assets | $12,757 | $12,757 | $12,757 | $12,757 | $12,757 | $12,757 | $12,757 | $12,757 | $12,757 | $12,757 | $12,757 | $12,757 | $12,757 |
| Total Current Assets | $69,942 | $74,623 | $76,854 | $75,561 | $74,700 | $73,238 | $75,749 | $79,662 | $73,646 | $74,921 | $73,357 | $72,565 | $73,964 |
| Long-term Assets | |||||||||||||
| Long-term Assets | $0 | $0 | $0 | $0 | $0 | $0 | $0 | $0 | $0 | $0 | $0 | $0 | $0 |
| Accumulated Depreciation | $0 | $0 | $0 | $0 | $0 | $0 | $0 | $0 | $0 | $0 | $0 | $0 | $0 |
| Total Long-term Assets | $0 | $0 | $0 | $0 | $0 | $0 | $0 | $0 | $0 | $0 | $0 | $0 | $0 |
| Total Assets | $69,942 | $74,623 | $76,854 | $75,561 | $74,700 | $73,238 | $75,749 | $79,662 | $73,646 | $74,921 | $73,357 | $72,565 | $73,964 |
| Liabilities and Capital | Month 1 | Month 2 | Month 3 | Month 4 | Month 5 | Month 6 | Month 7 | Month 8 | Month 9 | Month 10 | Month 11 | Month 12 | |
| Current Liabilities | |||||||||||||
| Accounts Payable | $0 | $2,438 | $3,559 | $2,853 | $2,769 | $2,565 | $6,367 | $11,312 | $6,299 | $8,939 | $8,562 | $8,989 | $11,873 |
| Current Borrowing | $0 | $0 | $0 | $0 | $0 | $0 | $0 | $0 | $0 | $0 | $0 | $0 | $0 |
| Other Current Liabilities | $0 | $0 | $0 | $0 | $0 | $0 | $0 | $0 | $0 | $0 | $0 | $0 | $0 |
| Subtotal Current Liabilities | $0 | $2,438 | $3,559 | $2,853 | $2,769 | $2,565 | $6,367 | $11,312 | $6,299 | $8,939 | $8,562 | $8,989 | $11,873 |
| Long-term Liabilities | $50,000 | $49,245 | $48,490 | $47,735 | $46,980 | $46,225 | $45,470 | $44,715 | $43,960 | $43,205 | $42,450 | $41,695 | $40,940 |
| Total Liabilities | $50,000 | $51,683 | $52,049 | $50,588 | $49,749 | $48,790 | $51,837 | $56,027 | $50,259 | $52,144 | $51,012 | $50,684 | $52,813 |
| Paid-in Capital | $40,000 | $40,000 | $40,000 | $40,000 | $40,000 | $40,000 | $40,000 | $40,000 | $40,000 | $40,000 | $40,000 | $40,000 | $40,000 |
| Retained Earnings | ($20,058) | ($20,058) | ($20,058) | ($20,058) | ($20,058) | ($20,058) | ($20,058) | ($20,058) | ($20,058) | ($20,058) | ($20,058) | ($20,058) | ($20,058) |
| Earnings | $0 | $2,998 | $4,863 | $5,032 | $5,009 | $4,506 | $3,970 | $3,692 | $3,446 | $2,835 | $2,403 | $1,939 | $1,209 |
| Total Capital | $19,942 | $22,940 | $24,805 | $24,974 | $24,951 | $24,448 | $23,912 | $23,634 | $23,388 | $22,777 | $22,345 | $21,881 | $21,151 |
| Total Liabilities and Capital | $69,942 | $74,623 | $76,854 | $75,561 | $74,700 | $73,238 | $75,749 | $79,662 | $73,646 | $74,921 | $73,357 | $72,565 | $73,964 |
| Net Worth | $19,942 | $22,940 | $24,805 | $24,974 | $24,951 | $24,448 | $23,912 | $23,634 | $23,388 | $22,777 | $22,345 | $21,881 | $21,151 |

