
Yeti Cards & Gifts
Executive Summary
Yeti Card & Gifts (Yeti) is an established retail business that offers a wide range of cards and gifts. Yeti’s motto is “Fun, Functional, & Funky, that’s Yeti.” Yeti opened two years ago as a retail gift store specializing in Asian gifts and home decor. Yeti quickly out-grew its original space and is now located in the Wigman Hospital/Physicians & Surgeons South Building, open Monday through Saturday 10 am – 6 pm. Yeti is currently finishing tenant improvements on their second location, a space in University Heights. The grand opening is slated for July 4th.
The Market
Yeti has been successful in doing something that no other retail card/gift store has been able to do, successfully appeal to two distinct target market segments. Yeti’s first target segment is university students. This segment is identified by their younger age and higher disposable income relative to their household income. For many students, the years at university is the first time they are living away from home and away from their parent’s often watchful and restrictive eyes. This means that students like to use their disposable income to its full potential, sometimes (unfortunately for them) beyond their financial means. There are over 38,833 potential customers in this market segment.
The second distinct segment that Yeti has been successful in appealing to is the university faculty and staff, Wigman Hospital staff, and the greater Cleveland Heights/University Heights community. This segment is an older, more mature market relative. They are looking for a safe and friendly atmosphere that provides a sense of nostalgia mixed with youthful excitement. This segment has over 191,590 potential customers.
Competitive Edge
Yeti’s competitive edge is their ability to effectively serve both market segments at the same time, a feat that no other gift/card shop has been able to do. Yeti has accomplished this by leveraging two competitive advantages. The first element is a wide product selection that appeals to both target markets. Yeti’s other motto, “Risque not Raunchy” captures this idea well. While some of the products come close to pushing the limits of good taste, nothing is offensive or outrageously obscene. This creates an atmosphere that has an edge, but one in which anyone would feel comfortable. This wide product span helps allow Yeti to serve two distinct sets of customers. A wide product selection is not inherently enough on its own to serve two customer segments however. The second element of their competitive edge is the high level of customer service that supports the broad product selection. The store provides outstanding service to customers who feel like they are truly welcome and enjoy the entire shopping experience. All of the Yeti employees are trained to create a helpful, gracious, welcoming experience for all customers. The sales staff recognize that it is their job to provide the customer with whatever type of assistance they may need. The customer will leave the store feeling that Yeti exists to cater to their individual needs.
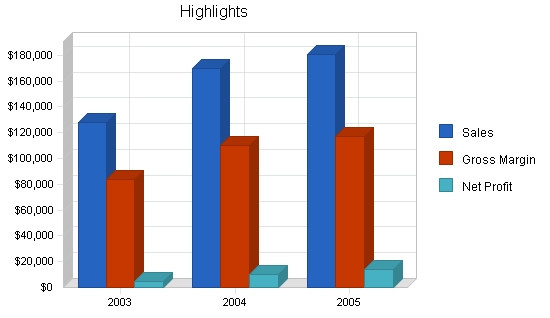
Having been open now for almost two years, Yeti Cards & Gifts has proven that they have been successful in meeting the needs of two distinct customer segments. The Yeti concept is being led by the husband and wife team of Dan and Ishada Gordon, both of whom bring a wealth of experience and skills to the company. Yeti is currently preparing for the grand opening of their second location and its overall growth looks quite promising. Sales forecasts indicate revenue of $169,000 for Year 3 and $180,000 for Year 4 with net profit of 5.96% and 7.59% respectively.
1.1 Mission
Yeti Cards & Gifts’ goal is to provide new and exciting products in an environment that is fun and friendly for customer and staff alike. Customer service is our #1 priority.
“Fun, Functional & Funky, that’s Yeti.”
1.2 Keys to Success
The keys to success are:
- Offering items of a high quality-value relationship which are not available everywhere. This is essential for maintaining the niche market sectors mentioned in the Executive Summary.
- Advertising and promoting in areas that our target customer base will learn about our store.
- Continuously reviewing our inventory and sales and adjusting our inventory levels accordingly.
1.3 Objectives
Yeti has two objectives for the organization. The objectives are lofty, yet achievable. By developing and tracking progress toward the goals, the organization will push everyone to perform their best.
- Open a second store in the University Heights community, increasing visibility and sales potential.
- Open a third store in Year 4.
Company Summary
Yeti Card & Gifts is a retail gift store specializing in cards, health and beauty products, novelty, candy, beverages, and Japanese products. Yeti currently has two locations, their current store located at the Wigman Hospital/Physician & Surgeons South Building, and a University Heights community store (opening soon) in the Madison Plaza in-between existing tenants Starbucks and Noah’s Bagels.
2.1 Company Ownership
Yeti Cards & Gifts is a single member Ohio registered L.L.C. owned wholly by Dan Gordon.
2.2 Company History
Yeti was originally founded two years ago. The popularity of Yeti was quickly apparent and the business out-grew the location. The business soon moved into the Wigman Hospital/Physicians & Surgeons South Building to take advantage of the 1,144 square foot highly visible retail space. The Wigman location was chosen to leverage its high density of people. Wigman Hospital is Cuyahoga County’s largest employer. On the east side of Yeti is The Case Western Reserve, the state’s largest private university with over 20,933 students, faculty, and employee. The move to the Wigman building was also strategically timed to fill the vacancy of Jabberwocky Cards & Gifts which had just closed their doors.
Yeti is currently in the tenant improvement stage of opening their second store in University Heights. This 800 square foot store is located in the Madison Plaza in-between Starbucks and Noah’s Bagel. This location was chosen because of the high traffic counts (1,800) and the close proximity to two nationally known tenants.
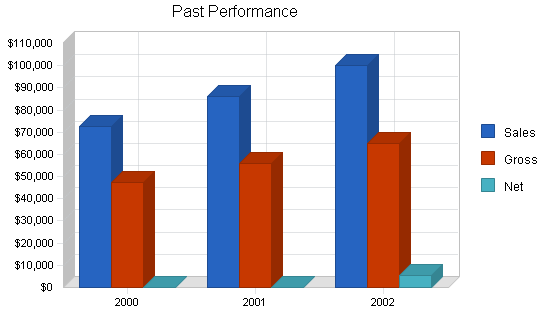
| Past Performance | |||
| 2000 | 2001 | 2002 | |
| Sales | $72,554 | $85,884 | $100,212 |
| Gross Margin | $47,160 | $55,825 | $65,138 |
| Gross Margin % | 65.00% | 65.00% | 65.00% |
| Operating Expenses | $62,554 | $65,545 | $68,778 |
| Inventory Turnover | 6.00 | 6.00 | 6.00 |
| Balance Sheet | |||
| 2000 | 2001 | 2002 | |
| Current Assets | |||
| Cash | $10,225 | $10,988 | $12,363 |
| Inventory | $17,778 | $15,554 | $12,455 |
| Other Current Assets | $0 | $0 | $0 |
| Total Current Assets | $28,003 | $26,542 | $24,818 |
| Long-term Assets | |||
| Long-term Assets | $5,000 | $5,000 | $5,000 |
| Accumulated Depreciation | $2,751 | $2,751 | $2,751 |
| Total Long-term Assets | $2,249 | $2,249 | $2,249 |
| Total Assets | $30,252 | $28,791 | $27,067 |
| Current Liabilities | |||
| Accounts Payable | $3,254 | $4,254 | $4,001 |
| Current Borrowing | $0 | $0 | $0 |
| Other Current Liabilities (interest free) | $0 | $0 | $0 |
| Total Current Liabilities | $3,254 | $4,254 | $4,001 |
| Long-term Liabilities | $20,000 | $18,000 | $15,000 |
| Total Liabilities | $23,254 | $22,254 | $19,001 |
| Paid-in Capital | $0 | $0 | $0 |
| Retained Earnings | $6,998 | $6,537 | $2,612 |
| Earnings | $0 | $0 | $5,454 |
| Total Capital | $6,998 | $6,537 | $8,066 |
| Total Capital and Liabilities | $30,252 | $28,791 | $27,067 |
| Other Inputs | |||
| Payment Days | 0 | 0 | 0 |
Products
Yeti carries a wide range of products chosen to be aligned with the private motto of “Risque, not Raunchy.” Yeti’s products can be grouped into five main categories: cards, health and beauty, novelty, candy and beverages, and Japanese products. The following list shows examples of products within their respective categories:
Cards (vendors include: Winking Moon Press, Tetter Saw Cards, Mik Wright, Clayboys, Mojo Ryzen, Image Connection, Unusual Cards, Cara Scissoria, Shag/Roger La Borde, Paper Troupe, Palm Breeze, Smart Alex, and Classico San Francisco)
- Birthday (boy, girl, romantic)
- Blank
- Wedding
- New baby
- Get well
- General humor
- I love you
- Engagement
- Missing you
- Friendship
- Encouragement
- Sympathy
- Postcards
Health and Beauty (vendors include: Blue Q, Fridge Fun, San-X, Tsukineko, T-n-T Candles)

- Hand soap
- Body wash/detergent
- Shampoo
- Moist towelettes
- Lip balm
- Moisturizer
- Bubble bath
- Body powder
- Glitter ball/lotion
- Compact mirror
- Foot/hand/body cream
- Large & small tampon case
- Air freshener
- Tweezers
- Temporary body tattoos
- Candles
Novelty (vendors include: Accoutrements, Hobbs & Dobbs, San-X, Lantor, Dark Horse, Blue Q, O.R.E., Three by Three, Lucy Lu, Hot Properties, Fridge Fun)
- Stationary
- Wigs
- Glasses
- Picture frames
- Hats
- Coffee mugs
- Bags
- Purses
- Clocks
- CD cases
- String lights
- Bookmarks
- Action figures
- Antenna toppers
- Magnets
- Key chains
- Toothpick/toothbrush holders
- Mist makers
- Toilet seats
- Stickers
- Clothes hampers
- Whoopee cushions
- Squirt guns
Candy and Beverages (vendors include: Garvey, Hobbs & Dobbs, Golden Pacific, JFC Trading)
- Hello Kitty Hi-Chew & Jelly candy
- Gummi Bears/Army Guys/Hamburgers/French Fries/Donuts
- Now & Later
- Big Hunk
- Bottle caps
- Jolly Rancher
- Blow Pops
- Sugar Daddy
- Nerds
- Tangy Taffy
- Sweet Tarts
- Smarties
- Sixlets
- Dorks
- Shock Tarts
- Ducle de Leche
- Abba Zabba
- Sour Patch
- Rocky Road
- Runts
- Spree
- Gum
- Soft drinks
- Jones
- Suntory-CC Lemon
- CC Grape
- Natchan (honey lemon, apple, grape, fruit punch flavors)
- Woolong tea
- Asahi cold asian tea drinks
- Kirin cold tea drinks (milk tea, lemon tea)
- Milk, coffee
- Otsuka Pocari Sweat
- Sokenbi-cha
- JT peach water
- Sapporo fruit & milk
- Cream melon soda
- Caffe latte
- Citrus mix
- Green tea
- Chinese tea
Japanese products (vendors include: San-X, Masudamasu, Enadi, Kitamura, Tokyo-Inn, Etoile Kaito, Okutani)
- Stickers
- Plush toys
- Bottle caps
- Movie merchandise
- Mouse pads
- Cell phone accessories
- Zipper pulls
- Patches
- Animation fun packs
Market Analysis Summary
Yeti has identified two distinct market segments for each of the two different stores. For the Cleveland Heights location there is the Case Western Reserve University students and the Wigman Hospital/Cleveland Heights community. For the University Heights location there is the John Carroll University students and the local community.
Age is a significant determinant in differentiating between the different segments. The student segments are generally of a lower age than the surrounding community.
4.1 Market Segmentation
Cleveland Heights Store
Case Western Reserve community
20,044 students total. Largest private university in Ohio.
- Female students, 53.6% of student population (10,747)
- This group makes the most “lifestyle” purchases. They are either buying for themselves to give their living space a personal touch, or buying items as a gift for a friend or relative.
- Male students, 46.4% of student population (9,297)
- Male students are known for their infrequent shopping habits. They make occasional purchases. These occasional purchasers will need to be converted into impulse buyers. This can be accomplished by offering more items that appeal to their sense of independence.
- Case Western Reserve Univ. faculty (889) and employees
- This segment makes less frequent purchases than the students
Wigman Hospital community/Cleveland Heights community
Wigman Hospital is the county’s largest employer. Administrative offices have recently been moved to this location, further consolidating the hospital into a dense employer.
- Wigman Hospital community. Total population 2,700.
- Higher income levels than students
- Their work site is in very close proximity to Yeti, less than a block.
- Cleveland Heights community. Total population 140,550. Ages:
- 15-19: 11,585 (8.4%)
- 20-24: 17,390 (12.6%)
- 25-34: 20,591 (14.9%)
- 35-44: 18,656 (13.5%)
- 45-54: 20,184 (14.6%)
- 55-59: 5,864 (4.3%)
University Heights Store
John Carroll University community 18,789 students total
- Female students, 47.6% (8,937)
- This group makes the most “lifestyle” purchases. They are either buying for themselves to give their living space a personal touch, or buying items for a friend or relative to give as a gift.
- Males students, 52.4%, (9,852)
- Male students are known for their infrequent shopping habits. They make occasional purchases. These occasional purchasers will need to be converted into impulse buyers. This can be accomplished by offering more items that appeal to their sense of independence.
- John Carroll Univ. faculty (830) and employees
- This segment is likely to make fewer purchases than students
University Heights community. Total population 51,040. Ages:
- 15-19: 5,662 (11.5%)
- 20-24: 9,896 (20.1%)
- 25-34: 7,317 (14.8%)
- 35-44: 5,991 (12.1%)
- 45-54: 5,570 (11.3%)
- 55-59:1,603 (3.3%)

| Market Analysis | |||||||
| 2003 | 2004 | 2005 | 2006 | 2007 | |||
| Potential Customers | Growth | CAGR | |||||
| Case Western Reserve community | 2% | 20,933 | 21,435 | 21,949 | 22,476 | 23,015 | 2.40% |
| Wigman Hospital/Cleveland Hts. community | 2% | 140,550 | 143,361 | 146,228 | 149,153 | 152,136 | 2.00% |
| John Carroll community | 1% | 19,619 | 19,815 | 20,013 | 20,213 | 20,415 | 1.00% |
| University Hts. community | 1% | 51,040 | 51,550 | 52,066 | 52,587 | 53,113 | 1.00% |
| Total | 1.74% | 232,142 | 236,161 | 240,256 | 244,429 | 248,679 | 1.74% |
4.2 Target Market Segment Strategy
The market segments were chosen for two specific reasons, location/proximity and customer demographics, specifically age:
Location/Proximity
In the case of both the Cleveland Heights and University Heights stores, the location is quite convenient to both the students and the surrounding communities. As our days become busier and busier, with less and less free time, we tend to choose stores that are the most convenient. The more convenient the location, the more free time that we have for ourselves.
- Cleveland Heights. The store is within several blocks of a large university campus. Students are continually walking off campus, looking for food, shopping, and diversions from school, all convenient enough so that they can easily get back on campus for the next class. For the Wigman Hospital community, the largest single employer in Cuyahoga County, Yeti is located below their offices. Many people can just walk downstairs to the ground floor, and at most they may have to walk a block to get to Yeti. Customers who need to do a bit of shopping on their break or before they leave for home are able to get to Yeti within five minutes.
- University Heights. Again, location is key in University Heights. The store is also only a few blocks from the large campus making it quite accessible to students, faculty, and campus employees. Yeti was able to secure a desired location within Madison Plaza, one of the premier shopping areas. The fact that Yeti is situated next to Starbucks is significant. Starbucks is nationally known for their real estate prowess, in addition to their marketing. Starbucks is very good at choosing good retail locations for their stores, a prime reason that they have closed so few poor performing stores in their history. On the other side of Yeti is another national retail tenant, Noah’s Bagel. Being surrounded by two national tenants, one of them being the mighty Starbucks is quite material. Additionally, this retail space has customer daily walk-by traffic of 1,800, an impressive number.
Customer Demographics
- University communities, both Case and John Carroll. While students do not have the highest household income, since the majority of their time is spent in school instead of working, they have a very high rate of disposable income. This can be explained by two reasons. First, when students enter university, this is often the first time that they are no longer under the watchful eye of their parents, who have controlled or affected the purchasing behavior and lifestyles of their offspring. For many of the students, they suddenly have more freedom in the lives and how they spend their money.
A second explanation of this phenomenon is that students tend to spend money in a short-sighted manner. The overwhelming majority of students receive financial aid and it is uncommon for all of the money from financial aid to be spent solely on books and tuition. Frequently a good portion becomes their disposable income. Many students take the viewpoint that if they are going to be taking on debt to complete school, then a little more debt, which provides them ample disposable income, is OK, as they will eventually pay it off years down the road when they are making good money. These two explanations offer insight into why students, those with low household incomes have high levels of disposable income. Yeti recognizes this reality and caters to these students with products that appeal to them.
- Surrounding communities, both Cleveland Heights and University Heights. The members of the community population, older than the university students, want a safe and friendly atmosphere where they can enjoy a sense of nostalgia mixed with youthful excitement. The problem with most card and gift shops is their inability to cater to a wide cross section of the population. They are either too hip or trendy and turn off the more mature crowd, or they are too safe and secure so that only your grandparents would shop there. This “hallmarkification” of gift and card shops is quite common as evidenced by (name omitted), (name omitted), and (name omitted). Yeti has been successful in appealing to both the young and hip crowd (students) as well as the more mature crowd (university faculty, Wigman staff, and the surrounding city communities). Yeti has accomplished this feat in part by offering a wide product selection with the two target segments in mind and offering every customer benchmarked customer service, a way of treating customers so that every customer that enters the store recalls their experience as a pleasant experience that exceeded their expectations.
4.3 Industry Analysis
As mentioned in the previous section, gift and card shops typically fall into two distinct categories, trendy and hip shops that appeal to a younger crowd, and conservative, “hallmarkified” stores that appeal to an older, safety conscious crowd. It is unusual for a store to be able to straddle both categories successfully.
Some stores will try by just carrying merchandise that appeals to the other category, but this approach rarely works. In addition to having the merchandise for the desired market segments, the store must have the look, feel, and customer service to make each market segment feel like they are wanted, that make them feel like they are the typical individual that the store is catering to. Please review section 5.1, the competitive edge for more information on how Yeti is able to accomplish what most in the industry has been unable to.
4.3.1 Competition and Buying Patterns
Competitor #1
Pros: Massive purchasing power (over $30 million in sales last year including a computer and book department); good location; guaranteed customers from the sale of text books.
Cons: Little to no parking; poor customer service; difficulty in selling anything but conservative merchandise for fear of being offensive; youthful customer base keeps adults away.
Competitor #2
Pros: Good location next to Case Univ.; good selection of women’s apparel; established customer base.
Cons: Little to no parking; very poor customer service; lack of diversity in customer base with young women being their primary customer.
Competitor #3
Pros: Chagrin River Center tenant; plenty of parking; a national chain; average customer service.
Cons: Primary customers are 12-19 year olds; too loud background sound system; main focus is on apparel (T-shirts); little to no advertising.
Competitor #4
Pros: Capitol Mall tenant; plenty of parking; national chain; large selection of movie paraphernalia.
Cons: Merchandise selection focused on too small of a customer base; poor customer service; little to no advertising; distance from Case Univ. requires car or bus ride.
Competitor #5
Pros: Eighth St. Market tenant; average amount of parking; established customer base.
Cons: Poor customer service; poor merchandise selection.
Competitor #6
Pros: Two stores within walking distance of John Carroll Univ.; established customer base; large merchandise selection.
Cons: Merchandise selection focused on older customers; too much merchandise clutters aisles and creates claustrophobic conditions.
Competitor #7
Pros: Large national chain with ample parking; large selection of goods; average customer service.
Cons: Cannot respond to customer requests and the latest trends; focused on general merchandise, not cards and gifts; distance from John Carroll Univ. requires a car or bus ride.
Strategy and Implementation Summary
Yeti will leverage their competitive edge to quickly gain market penetration. Yeti has implemented a unique and effective competitive advantage of having a product selection that caters to diverse market segments, and supporting the product selection with excellent customer service, allowing customers from different demographics to feel equally at home at Yeti and to create a memorable shopping experience.
Yeti will rely on two forms of media for their marketing campaign, a strategy to raise awareness of Yeti in the different target markets. The Cleveland Weekly will be used for print advertisements due to its large reach and readership demographics which are aligned with Yeti’s customer demographics. Yeti will support their print advertising with a creative, in-house produced series of catchy Flash animated TV commercials. The commercials will be aired on both local and cable TV.
Lastly, Yeti will undertake a sales strategy that focuses on extensive employee training to allow the employees to assist customers with the wide range of products that they sell. Having an extensive training program for employees signals Yeti’s intentions of having long-term employees who are like members of the family.
5.1 Competitive Edge
Yeti’s competitive edge can be summed up as “Risque, not Raunchy.” This indicates their ability to appeal to a younger hipper crowd such as students, as well as an older, more mature crowd typical of Wigman Hospital employees, university faculty members and employees, and surrounding community members. “Risque, not Raunchy” is achieved to a larger degree through an intelligent product selection that is supported by exemplary customer service.
Yeti sells items that appeal to a wide selection of the population. Some items may indeed seem to push the limits of taste, but in general, none of the items sold are offensive or outrageously obscene. A good litmus test for this feeling of risque not raunchy is that any of the customers, regardless of age feel as if they could bring their parents into the store and not feel embarrassed.
Having a wide product selection is not sufficient, in and of itself, to appeal to a wide demographic group of customers. Part of a customer’s desire to explore stores such as Yeti is the experience that they have while in the store; how they were treated; the help from employees; the feeling that they were welcome in the store. All of the Yeti employees go through training that reinforces the notion that exemplary customer service must be offered to every customer. The customer must feel like they were treated with respect and that the employee truly wanted to help the customer in any way possible. Having this level of customer service helps support the product selection in appealing to a wide range of customers. Just having the right product selection is not enough, you could have the most desired, coolest stuff, but if the experience is not noteworthy, the customer will not come back.
5.2 Marketing Strategy
Yeti’s marketing strategy will be a strategic effort to develop an awareness of Yeti in the community and the wide range of attractive products that they offer. The strategy will use several formats of media:
- Print advertising: The Cleveland Weekly will be the print medium of choice. Not only is their presence felt throughout the Cleveland metropolitan area (estimated readership is 278,000) but they are the premier alternative media outlet for both Cleveland Heights and University Heights.
- TV advertising: Television commercials are an expensive yet effective media source for a marketing campaign. Production is often one of the large cost drivers for commercials. As a way of significantly decreasing/eliminating production costs as well as developing a catchy, unique, and memorable commercial piece, Dan Gordon will be leveraging his creative mind and the technical assistance of a few university students to develop Flash-based commercials. These commercials create an edgy, distinct message that will be able to communicate the range of products and distinctiveness that Yeti has to offer. By reducing the production costs to almost zero, other than sweat equity by Dan, Yeti will be able to use TV advertisements which they would otherwise not be able to afford. The marketing plan calls for a 50% split between local (WKYC Channel 9) and cable television. Additionally, Yeti will also be using “book end spots” which are 15 second spots that surround a traditional 30 second spot but at a reduced air time fee.
5.3 Sales Strategy
Yeti’s sales strategy is an aggressive training/education regime for all employees. All employees will be trained on the different product categories as well as the specific products within each category. The more information each employee knows and can share with the customer, the increased likelihood a sale will occur. This is especially important since Yeti carries a large product selection and it would be easy for many products to get lost in the mix with no support from the sales associates.
The bottom line is that the more information the employees have regarding the products, how it is used, who the product appeals to, etc., the larger the sales will be with each customer. Additionally, this philosophy of proper training for the employees is aligned with Yeti’s perspective that it is far less expensive to train and maintain extraordinary employees and treat them well, than to invest minimally in the employees but have to deal with high turnover.
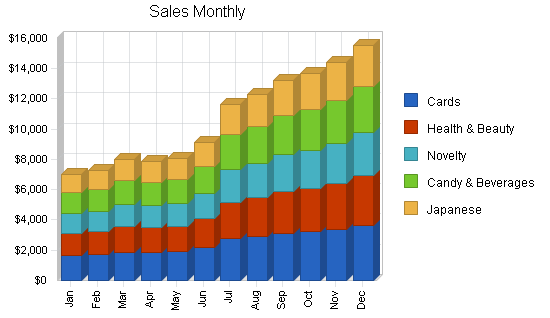
5.3.1 Sales Forecast
Yeti has adopted a conservative sales forecasts in order to increase the likelihood of reaching the sales goals and decreasing the possibility that the revenue figures will be incorrect. Yeti believes that the forecasts are accurate since they are based on actual, historical numbers.

| Sales Forecast | |||
| 2003 | 2004 | 2005 | |
| Sales | |||
| Cards | $30,181 | $39,887 | $42,455 |
| Health & Beauty | $26,861 | $35,499 | $37,785 |
| Novelty | $23,541 | $31,112 | $33,115 |
| Candy & Beverages | $25,352 | $33,505 | $35,662 |
| Japanese | $22,334 | $29,516 | $31,417 |
| Total Sales | $128,269 | $169,520 | $180,434 |
| Direct Cost of Sales | 2003 | 2004 | 2005 |
| Cards | $10,563 | $13,960 | $14,859 |
| Health & Beauty | $9,401 | $12,425 | $13,225 |
| Novelty | $8,239 | $10,889 | $11,590 |
| Candy & Beverages | $8,873 | $11,727 | $12,482 |
| Japanese | $7,817 | $10,331 | $10,996 |
| Subtotal Direct Cost of Sales | $44,894 | $59,332 | $63,152 |
5.4 Milestones
Yeti has several milestones that will help guide the organization to success. The following table and chart show these milestones.

| Milestones | |||||
| Milestone | Start Date | End Date | Budget | Manager | Department |
| University Hts store opening | 1/1/2003 | 7/4/2003 | $0 | Dan | Marketing |
| Website launch | 5/1/2003 | 10/1/2003 | $0 | Dan | Department |
| Open third store | 1/1/2006 | 6/30/2006 | $0 | Dan | Department |
| Totals | $0 | ||||
Web Plan Summary
Yeti is currently working on the production of a website. The website will act as an abbreviated catalog of some of the items the company sells. It would be far too difficult to have every product on the site.
6.1 Website Marketing Strategy
Yeti will rely on two sources for the marketing of the website. The first source is the printing of the Web address on all of Yeti’s correspondence and advertising. The second source will be the submission of the site to popular search engines. This will be advantageous for Internet users who may search on “gifts + Cleveland Heights” and Yeti’s website will pop up as a result.
6.2 Development Requirements
Yeti will contract with a computer science student to help develop the website.
Management Summary
Yeti was founded, is owned, and will be managed by Dan Gordon. Dan brings a wealth of topical experience to Yeti to assist in its retail success. Dan’s sales career began over 13 years ago when he worked in retail sales for Mervyn’s. After about a year he moved into a new position with Kaiser Permanente as a Security Administration Assistant. In this position Dan was responsible for teaching different classes to new hospital staff. It was this experience that provided the requisite skill set that he now uses for training new employees. Next Dan spent several years as a wholesale buyer of a large office supplies company. He was responsible for the development and implementation of policies and procedures for client returns, overseeing over $.5 million in returns.
Since Sept. 14, 2001 Dan has dedicated his time to Yeti and has managed the Cleveland Heights store and is in charge of purchasing, sales, advertising, maintenance, computer technology, and business development.
Yeti is also supported by Ishada Gordon. Ishada has over four years of sales and client service from a variety of different companies in Japan as well as the United States. Ishada also brings outstanding office management skills that will be invaluable to Yeti. Ishada has also been helpful with business development activities, raising money as well as developing vendor relationships with many different Japanese companies. Her knowledge and assistance in the Japanese product category has provided Yeti with an excellent Japanese product selection.
7.1 Personnel Plan
Dan will be the manager of both stores. His responsibilities include but are not limited to: sales, purchasing, marketing, advertising, business development, computer technology, and employee training.
Ishada’s responsibilities include but are not limited to: office management, employee training, and human resources.
The Cleveland Heights store will have two part-time employees. Their responsibilities include sales, display organizing, restocking, and light cleaning.
| Personnel Plan | |||
| 2003 | 2004 | 2005 | |
| Dan | $14,400 | $16,000 | $17,000 |
| Ishada | $14,400 | $16,000 | $17,000 |
| Part-time employee | $3,864 | $6,624 | $6,624 |
| Part-time employee | $3,864 | $6,624 | $6,624 |
| Part-time employee | $3,864 | $6,624 | $6,624 |
| Total People | 5 | 5 | 5 |
| Total Payroll | $40,392 | $51,872 | $53,872 |
Financial Plan
The following sections outline important financial information.
8.1 Important Assumptions
The following table details important financial assumptions.
| General Assumptions | |||
| 2003 | 2004 | 2005 | |
| Plan Month | 1 | 2 | 3 |
| Current Interest Rate | 10.00% | 10.00% | 10.00% |
| Long-term Interest Rate | 10.00% | 10.00% | 10.00% |
| Tax Rate | 30.00% | 30.00% | 30.00% |
| Other | 0 | 0 | 0 |
8.2 Break-even Analysis
The Break-even Analysis indicates that $9,500 will be needed in monthly revenue to reach the break-even point.

| Break-even Analysis | |
| Monthly Revenue Break-even | $9,500 |
| Assumptions: | |
| Average Percent Variable Cost | 35% |
| Estimated Monthly Fixed Cost | $6,175 |
8.3 Projected Cash Flow
The following chart and table show projected cash flow.

| Pro Forma Cash Flow | |||
| 2003 | 2004 | 2005 | |
| Cash Received | |||
| Cash from Operations | |||
| Cash Sales | $128,269 | $169,520 | $180,434 |
| Subtotal Cash from Operations | $128,269 | $169,520 | $180,434 |
| Additional Cash Received | |||
| Sales Tax, VAT, HST/GST Received | $0 | $0 | $0 |
| New Current Borrowing | $0 | $0 | $0 |
| New Other Liabilities (interest-free) | $0 | $0 | $0 |
| New Long-term Liabilities | $20,000 | $0 | $0 |
| Sales of Other Current Assets | $0 | $0 | $0 |
| Sales of Long-term Assets | $0 | $0 | $0 |
| New Investment Received | $0 | $0 | $0 |
| Subtotal Cash Received | $148,269 | $169,520 | $180,434 |
| Expenditures | 2003 | 2004 | 2005 |
| Expenditures from Operations | |||
| Cash Spending | $40,392 | $51,872 | $53,872 |
| Bill Payments | $68,546 | $107,359 | $110,062 |
| Subtotal Spent on Operations | $108,938 | $159,231 | $163,934 |
| Additional Cash Spent | |||
| Sales Tax, VAT, HST/GST Paid Out | $0 | $0 | $0 |
| Principal Repayment of Current Borrowing | $0 | $0 | $0 |
| Other Liabilities Principal Repayment | $0 | $0 | $0 |
| Long-term Liabilities Principal Repayment | $2,464 | $3,180 | $3,180 |
| Purchase Other Current Assets | $0 | $0 | $0 |
| Purchase Long-term Assets | $15,000 | $0 | $0 |
| Dividends | $0 | $0 | $0 |
| Subtotal Cash Spent | $126,402 | $162,411 | $167,114 |
| Net Cash Flow | $21,867 | $7,109 | $13,320 |
| Cash Balance | $34,230 | $41,339 | $54,659 |
8.4 Projected Profit and Loss
The following table and charts illustrate the projected profit and loss.


| Pro Forma Profit and Loss | |||
| 2003 | 2004 | 2005 | |
| Sales | $128,269 | $169,520 | $180,434 |
| Direct Cost of Sales | $44,894 | $59,332 | $63,152 |
| Other Production Expenses | $0 | $0 | $0 |
| Total Cost of Sales | $44,894 | $59,332 | $63,152 |
| Gross Margin | $83,375 | $110,188 | $117,282 |
| Gross Margin % | 65.00% | 65.00% | 65.00% |
| Expenses | |||
| Payroll | $40,392 | $51,872 | $53,872 |
| Sales and Marketing and Other Expenses | $6,000 | $6,000 | $6,000 |
| Depreciation | $2,751 | $3,000 | $3,000 |
| Leased Equipment | $0 | $0 | $0 |
| Utilities | $3,300 | $4,200 | $4,200 |
| Insurance | $4,200 | $5,400 | $5,400 |
| Rent | $10,200 | $13,200 | $13,200 |
| Payroll Taxes | $6,059 | $7,781 | $8,081 |
| Other | $1,200 | $1,200 | $1,200 |
| Total Operating Expenses | $74,101 | $92,653 | $94,953 |
| Profit Before Interest and Taxes | $9,274 | $17,535 | $22,329 |
| EBITDA | $12,024 | $20,535 | $25,329 |
| Interest Expense | $2,898 | $3,095 | $2,777 |
| Taxes Incurred | $1,913 | $4,332 | $5,866 |
| Net Profit | $4,463 | $10,108 | $13,687 |
| Net Profit/Sales | 3.48% | 5.96% | 7.59% |
8.5 Projected Balance Sheet
The following table present the projected balance sheet.
| Pro Forma Balance Sheet | |||
| 2003 | 2004 | 2005 | |
| Assets | |||
| Current Assets | |||
| Cash | $34,230 | $41,339 | $54,659 |
| Inventory | $5,982 | $7,906 | $8,415 |
| Other Current Assets | $0 | $0 | $0 |
| Total Current Assets | $40,212 | $49,245 | $63,074 |
| Long-term Assets | |||
| Long-term Assets | $20,000 | $20,000 | $20,000 |
| Accumulated Depreciation | $5,502 | $8,502 | $11,502 |
| Total Long-term Assets | $14,498 | $11,498 | $8,498 |
| Total Assets | $54,711 | $60,743 | $71,572 |
| Liabilities and Capital | 2003 | 2004 | 2005 |
| Current Liabilities | |||
| Accounts Payable | $9,646 | $8,750 | $9,073 |
| Current Borrowing | $0 | $0 | $0 |
| Other Current Liabilities | $0 | $0 | $0 |
| Subtotal Current Liabilities | $9,646 | $8,750 | $9,073 |
| Long-term Liabilities | $32,536 | $29,356 | $26,176 |
| Total Liabilities | $42,182 | $38,106 | $35,249 |
| Paid-in Capital | $0 | $0 | $0 |
| Retained Earnings | $8,066 | $12,529 | $22,637 |
| Earnings | $4,463 | $10,108 | $13,687 |
| Total Capital | $12,529 | $22,637 | $36,324 |
| Total Liabilities and Capital | $54,711 | $60,743 | $71,572 |
| Net Worth | $12,529 | $22,637 | $36,324 |
8.7 Business Ratios
The following table shows standard business ratios for Yeti Cards and Gifts. Industry Profile ratios are shown for comparison. Our Standard Industrial Classification (SIC) industry class and code are: Gift, novelty, and souvenir shop – 5947.
| Ratio Analysis | ||||
| 2003 | 2004 | 2005 | Industry Profile | |
| Sales Growth | 28.00% | 32.16% | 6.44% | 3.34% |
| Percent of Total Assets | ||||
| Inventory | 10.93% | 13.02% | 11.76% | 40.42% |
| Other Current Assets | 0.00% | 0.00% | 0.00% | 23.99% |
| Total Current Assets | 73.50% | 81.07% | 88.13% | 80.29% |
| Long-term Assets | 26.50% | 18.93% | 11.87% | 19.71% |
| Total Assets | 100.00% | 100.00% | 100.00% | 100.00% |
| Current Liabilities | 17.63% | 14.41% | 12.68% | 36.19% |
| Long-term Liabilities | 59.47% | 48.33% | 36.57% | 15.42% |
| Total Liabilities | 77.10% | 62.73% | 49.25% | 51.61% |
| Net Worth | 22.90% | 37.27% | 50.75% | 48.39% |
| Percent of Sales | ||||
| Sales | 100.00% | 100.00% | 100.00% | 100.00% |
| Gross Margin | 65.00% | 65.00% | 65.00% | 37.74% |
| Selling, General & Administrative Expenses | 0.00% | 0.00% | 0.00% | 23.72% |
| Advertising Expenses | 0.00% | 0.00% | 0.00% | 2.14% |
| Profit Before Interest and Taxes | 7.23% | 10.34% | 12.38% | 1.65% |
| Main Ratios | ||||
| Current | 4.17 | 5.63 | 6.95 | 1.98 |
| Quick | 3.55 | 4.72 | 6.02 | 0.74 |
| Total Debt to Total Assets | 77.10% | 62.73% | 49.25% | 3.65% |
| Pre-tax Return on Net Worth | 50.88% | 63.79% | 53.83% | 58.19% |
| Pre-tax Return on Assets | 11.65% | 23.77% | 27.32% | 8.72% |
| Additional Ratios | 2003 | 2004 | 2005 | |
| Net Profit Margin | 3.48% | 5.96% | 7.59% | n.a |
| Return on Equity | 35.62% | 44.65% | 37.68% | n.a |
| Activity Ratios | ||||
| Inventory Turnover | 8.57 | 8.54 | 7.74 | n.a |
| Accounts Payable Turnover | 7.69 | 12.17 | 12.17 | n.a |
| Payment Days | 29 | 32 | 29 | n.a |
| Total Asset Turnover | 2.34 | 2.79 | 2.52 | n.a |
| Debt Ratios | ||||
| Debt to Net Worth | 3.37 | 1.68 | 0.97 | n.a |
| Current Liab. to Liab. | 0.23 | 0.23 | 0.26 | n.a |
| Liquidity Ratios | ||||
| Net Working Capital | $30,566 | $40,494 | $54,001 | n.a |
| Interest Coverage | 3.20 | 5.67 | 8.04 | n.a |
| Additional Ratios | ||||
| Assets to Sales | 0.43 | 0.36 | 0.40 | n.a |
| Current Debt/Total Assets | 18% | 14% | 13% | n.a |
| Acid Test | 3.55 | 4.72 | 6.02 | n.a |
| Sales/Net Worth | 10.24 | 7.49 | 4.97 | n.a |
| Dividend Payout | 0.00 | 0.00 | 0.00 | n.a |
Appendix
| Sales Forecast | |||||||||||||
| Jan | Feb | Mar | Apr | May | Jun | Jul | Aug | Sep | Oct | Nov | Dec | ||
| Sales | |||||||||||||
| Cards | 0% | $1,654 | $1,715 | $1,878 | $1,854 | $1,901 | $2,154 | $2,745 | $2,898 | $3,112 | $3,225 | $3,389 | $3,656 |
| Health & Beauty | 0% | $1,472 | $1,526 | $1,671 | $1,650 | $1,692 | $1,917 | $2,443 | $2,579 | $2,770 | $2,870 | $3,016 | $3,254 |
| Novelty | 0% | $1,290 | $1,338 | $1,465 | $1,446 | $1,483 | $1,680 | $2,141 | $2,260 | $2,427 | $2,516 | $2,643 | $2,852 |
| Candy & Beverages | 0% | $1,389 | $1,441 | $1,578 | $1,557 | $1,597 | $1,809 | $2,306 | $2,434 | $2,614 | $2,709 | $2,847 | $3,071 |
| Japanese | 0% | $1,224 | $1,269 | $1,390 | $1,372 | $1,407 | $1,594 | $2,031 | $2,145 | $2,303 | $2,387 | $2,508 | $2,705 |
| Total Sales | $7,030 | $7,289 | $7,982 | $7,880 | $8,079 | $9,155 | $11,666 | $12,317 | $13,226 | $13,706 | $14,403 | $15,538 | |
| Direct Cost of Sales | Jan | Feb | Mar | Apr | May | Jun | Jul | Aug | Sep | Oct | Nov | Dec | |
| Cards | $579 | $600 | $657 | $649 | $665 | $754 | $961 | $1,014 | $1,089 | $1,129 | $1,186 | $1,280 | |
| Health & Beauty | $515 | $534 | $585 | $578 | $592 | $671 | $855 | $903 | $969 | $1,005 | $1,056 | $1,139 | |
| Novelty | $452 | $468 | $513 | $506 | $519 | $588 | $749 | $791 | $850 | $880 | $925 | $998 | |
| Candy & Beverages | $486 | $504 | $552 | $545 | $559 | $633 | $807 | $852 | $915 | $948 | $996 | $1,075 | |
| Japanese | $428 | $444 | $486 | $480 | $492 | $558 | $711 | $751 | $806 | $835 | $878 | $947 | |
| Subtotal Direct Cost of Sales | $2,460 | $2,551 | $2,794 | $2,758 | $2,828 | $3,204 | $4,083 | $4,311 | $4,629 | $4,797 | $5,041 | $5,438 | |
| Personnel Plan | |||||||||||||
| Jan | Feb | Mar | Apr | May | Jun | Jul | Aug | Sep | Oct | Nov | Dec | ||
| Dan | 0% | $1,200 | $1,200 | $1,200 | $1,200 | $1,200 | $1,200 | $1,200 | $1,200 | $1,200 | $1,200 | $1,200 | $1,200 |
| Ishada | 0% | $1,200 | $1,200 | $1,200 | $1,200 | $1,200 | $1,200 | $1,200 | $1,200 | $1,200 | $1,200 | $1,200 | $1,200 |
| Part-time employee | 0% | $0 | $0 | $0 | $0 | $0 | $552 | $552 | $552 | $552 | $552 | $552 | $552 |
| Part-time employee | 0% | $0 | $0 | $0 | $0 | $0 | $552 | $552 | $552 | $552 | $552 | $552 | $552 |
| Part-time employee | 0% | $0 | $0 | $0 | $0 | $0 | $552 | $552 | $552 | $552 | $552 | $552 | $552 |
| Total People | 2 | 2 | 2 | 2 | 2 | 5 | 5 | 5 | 5 | 5 | 5 | 5 | |
| Total Payroll | $2,400 | $2,400 | $2,400 | $2,400 | $2,400 | $4,056 | $4,056 | $4,056 | $4,056 | $4,056 | $4,056 | $4,056 | |
| General Assumptions | |||||||||||||
| Jan | Feb | Mar | Apr | May | Jun | Jul | Aug | Sep | Oct | Nov | Dec | ||
| Plan Month | 1 | 2 | 3 | 4 | 5 | 6 | 7 | 8 | 9 | 10 | 11 | 12 | |
| Current Interest Rate | 10.00% | 10.00% | 10.00% | 10.00% | 10.00% | 10.00% | 10.00% | 10.00% | 10.00% | 10.00% | 10.00% | 10.00% | |
| Long-term Interest Rate | 10.00% | 10.00% | 10.00% | 10.00% | 10.00% | 10.00% | 10.00% | 10.00% | 10.00% | 10.00% | 10.00% | 10.00% | |
| Tax Rate | 30.00% | 30.00% | 30.00% | 30.00% | 30.00% | 30.00% | 30.00% | 30.00% | 30.00% | 30.00% | 30.00% | 30.00% | |
| Other | 0 | 0 | 0 | 0 | 0 | 0 | 0 | 0 | 0 | 0 | 0 | 0 | |
| Pro Forma Profit and Loss | |||||||||||||
| Jan | Feb | Mar | Apr | May | Jun | Jul | Aug | Sep | Oct | Nov | Dec | ||
| Sales | $7,030 | $7,289 | $7,982 | $7,880 | $8,079 | $9,155 | $11,666 | $12,317 | $13,226 | $13,706 | $14,403 | $15,538 | |
| Direct Cost of Sales | $2,460 | $2,551 | $2,794 | $2,758 | $2,828 | $3,204 | $4,083 | $4,311 | $4,629 | $4,797 | $5,041 | $5,438 | |
| Other Production Expenses | $0 | $0 | $0 | $0 | $0 | $0 | $0 | $0 | $0 | $0 | $0 | $0 | |
| Total Cost of Sales | $2,460 | $2,551 | $2,794 | $2,758 | $2,828 | $3,204 | $4,083 | $4,311 | $4,629 | $4,797 | $5,041 | $5,438 | |
| Gross Margin | $4,569 | $4,738 | $5,188 | $5,122 | $5,252 | $5,950 | $7,583 | $8,006 | $8,597 | $8,909 | $9,362 | $10,100 | |
| Gross Margin % | 65.00% | 65.00% | 65.00% | 65.00% | 65.00% | 65.00% | 65.00% | 65.00% | 65.00% | 65.00% | 65.00% | 65.00% | |
| Expenses | |||||||||||||
| Payroll | $2,400 | $2,400 | $2,400 | $2,400 | $2,400 | $4,056 | $4,056 | $4,056 | $4,056 | $4,056 | $4,056 | $4,056 | |
| Sales and Marketing and Other Expenses | $500 | $500 | $500 | $500 | $500 | $500 | $500 | $500 | $500 | $500 | $500 | $500 | |
| Depreciation | $167 | $167 | $167 | $250 | $250 | $250 | $250 | $250 | $250 | $250 | $250 | $250 | |
| Leased Equipment | $0 | $0 | $0 | $0 | $0 | $0 | $0 | $0 | $0 | $0 | $0 | $0 | |
| Utilities | $200 | $200 | $200 | $200 | $200 | $200 | $350 | $350 | $350 | $350 | $350 | $350 | |
| Insurance | $250 | $250 | $250 | $250 | $250 | $250 | $450 | $450 | $450 | $450 | $450 | $450 | |
| Rent | $600 | $600 | $600 | $600 | $600 | $600 | $1,100 | $1,100 | $1,100 | $1,100 | $1,100 | $1,100 | |
| Payroll Taxes | 15% | $360 | $360 | $360 | $360 | $360 | $608 | $608 | $608 | $608 | $608 | $608 | $608 |
| Other | $100 | $100 | $100 | $100 | $100 | $100 | $100 | $100 | $100 | $100 | $100 | $100 | |
| Total Operating Expenses | $4,577 | $4,577 | $4,577 | $4,660 | $4,660 | $6,564 | $7,414 | $7,414 | $7,414 | $7,414 | $7,414 | $7,414 | |
| Profit Before Interest and Taxes | ($8) | $161 | $611 | $462 | $592 | ($614) | $169 | $591 | $1,183 | $1,495 | $1,948 | $2,685 | |
| EBITDA | $159 | $328 | $778 | $712 | $842 | ($364) | $419 | $841 | $1,433 | $1,745 | $2,198 | $2,935 | |
| Interest Expense | $125 | $125 | $125 | $289 | $287 | $285 | $283 | $280 | $278 | $276 | $273 | $271 | |
| Taxes Incurred | ($40) | $11 | $146 | $52 | $91 | ($270) | ($34) | $93 | $271 | $366 | $502 | $724 | |
| Net Profit | ($93) | $25 | $340 | $121 | $213 | ($629) | ($80) | $218 | $633 | $853 | $1,172 | $1,690 | |
| Net Profit/Sales | -1.32% | 0.35% | 4.26% | 1.53% | 2.64% | -6.87% | -0.68% | 1.77% | 4.79% | 6.22% | 8.14% | 10.88% | |
| Pro Forma Cash Flow | |||||||||||||
| Jan | Feb | Mar | Apr | May | Jun | Jul | Aug | Sep | Oct | Nov | Dec | ||
| Cash Received | |||||||||||||
| Cash from Operations | |||||||||||||
| Cash Sales | $7,030 | $7,289 | $7,982 | $7,880 | $8,079 | $9,155 | $11,666 | $12,317 | $13,226 | $13,706 | $14,403 | $15,538 | |
| Subtotal Cash from Operations | $7,030 | $7,289 | $7,982 | $7,880 | $8,079 | $9,155 | $11,666 | $12,317 | $13,226 | $13,706 | $14,403 | $15,538 | |
| Additional Cash Received | |||||||||||||
| Sales Tax, VAT, HST/GST Received | 0.00% | $0 | $0 | $0 | $0 | $0 | $0 | $0 | $0 | $0 | $0 | $0 | $0 |
| New Current Borrowing | $0 | $0 | $0 | $0 | $0 | $0 | $0 | $0 | $0 | $0 | $0 | $0 | |
| New Other Liabilities (interest-free) | $0 | $0 | $0 | $0 | $0 | $0 | $0 | $0 | $0 | $0 | $0 | $0 | |
| New Long-term Liabilities | $0 | $0 | $0 | $20,000 | $0 | $0 | $0 | $0 | $0 | $0 | $0 | $0 | |
| Sales of Other Current Assets | $0 | $0 | $0 | $0 | $0 | $0 | $0 | $0 | $0 | $0 | $0 | $0 | |
| Sales of Long-term Assets | $0 | $0 | $0 | $0 | $0 | $0 | $0 | $0 | $0 | $0 | $0 | $0 | |
| New Investment Received | $0 | $0 | $0 | $0 | $0 | $0 | $0 | $0 | $0 | $0 | $0 | $0 | |
| Subtotal Cash Received | $7,030 | $7,289 | $7,982 | $27,880 | $8,079 | $9,155 | $11,666 | $12,317 | $13,226 | $13,706 | $14,403 | $15,538 | |
| Expenditures | Jan | Feb | Mar | Apr | May | Jun | Jul | Aug | Sep | Oct | Nov | Dec | |
| Expenditures from Operations | |||||||||||||
| Cash Spending | $2,400 | $2,400 | $2,400 | $2,400 | $2,400 | $4,056 | $4,056 | $4,056 | $4,056 | $4,056 | $4,056 | $4,056 | |
| Bill Payments | $4,071 | $2,097 | $2,150 | $2,321 | $3,552 | $5,313 | $5,976 | $8,395 | $8,063 | $8,640 | $8,747 | $9,220 | |
| Subtotal Spent on Operations | $6,471 | $4,497 | $4,550 | $4,721 | $5,952 | $9,369 | $10,032 | $12,451 | $12,119 | $12,696 | $12,803 | $13,276 | |
| Additional Cash Spent | |||||||||||||
| Sales Tax, VAT, HST/GST Paid Out | $0 | $0 | $0 | $0 | $0 | $0 | $0 | $0 | $0 | $0 | $0 | $0 | |
| Principal Repayment of Current Borrowing | $0 | $0 | $0 | $0 | $0 | $0 | $0 | $0 | $0 | $0 | $0 | $0 | |
| Other Liabilities Principal Repayment | $0 | $0 | $0 | $0 | $0 | $0 | $0 | $0 | $0 | $0 | $0 | $0 | |
| Long-term Liabilities Principal Repayment | $0 | $0 | $0 | $265 | $267 | $269 | $271 | $274 | $276 | $278 | $281 | $283 | |
| Purchase Other Current Assets | $0 | $0 | $0 | $0 | $0 | $0 | $0 | $0 | $0 | $0 | $0 | $0 | |
| Purchase Long-term Assets | $10,000 | $0 | $0 | $5,000 | $0 | $0 | $0 | $0 | $0 | $0 | $0 | $0 | |
| Dividends | $0 | $0 | $0 | $0 | $0 | $0 | $0 | $0 | $0 | $0 | $0 | $0 | |
| Subtotal Cash Spent | $16,471 | $4,497 | $4,550 | $9,986 | $6,219 | $9,638 | $10,303 | $12,725 | $12,395 | $12,975 | $13,084 | $13,559 | |
| Net Cash Flow | ($9,441) | $2,792 | $3,431 | $17,894 | $1,860 | ($484) | $1,363 | ($408) | $831 | $732 | $1,319 | $1,979 | |
| Cash Balance | $2,922 | $5,714 | $9,145 | $27,038 | $28,898 | $28,414 | $29,777 | $29,369 | $30,200 | $30,932 | $32,251 | $34,230 | |
| Pro Forma Balance Sheet | |||||||||||||
| Jan | Feb | Mar | Apr | May | Jun | Jul | Aug | Sep | Oct | Nov | Dec | ||
| Assets | Starting Balances | ||||||||||||
| Current Assets | |||||||||||||
| Cash | $12,363 | $2,922 | $5,714 | $9,145 | $27,038 | $28,898 | $28,414 | $29,777 | $29,369 | $30,200 | $30,932 | $32,251 | $34,230 |
| Inventory | $12,455 | $9,995 | $7,444 | $4,650 | $3,034 | $3,111 | $3,524 | $4,492 | $4,742 | $5,092 | $5,277 | $5,545 | $5,982 |
| Other Current Assets | $0 | $0 | $0 | $0 | $0 | $0 | $0 | $0 | $0 | $0 | $0 | $0 | $0 |
| Total Current Assets | $24,818 | $12,916 | $13,157 | $13,795 | $30,072 | $32,009 | $31,939 | $34,269 | $34,111 | $35,292 | $36,209 | $37,796 | $40,212 |
| Long-term Assets | |||||||||||||
| Long-term Assets | $5,000 | $15,000 | $15,000 | $15,000 | $20,000 | $20,000 | $20,000 | $20,000 | $20,000 | $20,000 | $20,000 | $20,000 | $20,000 |
| Accumulated Depreciation | $2,751 | $2,918 | $3,085 | $3,252 | $3,502 | $3,752 | $4,002 | $4,252 | $4,502 | $4,752 | $5,002 | $5,252 | $5,502 |
| Total Long-term Assets | $2,249 | $12,082 | $11,915 | $11,748 | $16,498 | $16,248 | $15,998 | $15,748 | $15,498 | $15,248 | $14,998 | $14,748 | $14,498 |
| Total Assets | $27,067 | $24,998 | $25,073 | $25,543 | $46,570 | $48,257 | $47,937 | $50,017 | $49,609 | $50,541 | $51,207 | $52,545 | $54,711 |
| Liabilities and Capital | Jan | Feb | Mar | Apr | May | Jun | Jul | Aug | Sep | Oct | Nov | Dec | |
| Current Liabilities | |||||||||||||
| Accounts Payable | $4,001 | $2,025 | $2,074 | $2,205 | $3,376 | $5,117 | $5,695 | $8,127 | $7,775 | $8,349 | $8,441 | $8,887 | $9,646 |
| Current Borrowing | $0 | $0 | $0 | $0 | $0 | $0 | $0 | $0 | $0 | $0 | $0 | $0 | $0 |
| Other Current Liabilities | $0 | $0 | $0 | $0 | $0 | $0 | $0 | $0 | $0 | $0 | $0 | $0 | $0 |
| Subtotal Current Liabilities | $4,001 | $2,025 | $2,074 | $2,205 | $3,376 | $5,117 | $5,695 | $8,127 | $7,775 | $8,349 | $8,441 | $8,887 | $9,646 |
| Long-term Liabilities | $15,000 | $15,000 | $15,000 | $15,000 | $34,735 | $34,468 | $34,199 | $33,928 | $33,654 | $33,378 | $33,100 | $32,819 | $32,536 |
| Total Liabilities | $19,001 | $17,025 | $17,074 | $17,205 | $38,111 | $39,585 | $39,894 | $42,054 | $41,429 | $41,727 | $41,540 | $41,706 | $42,182 |
| Paid-in Capital | $0 | $0 | $0 | $0 | $0 | $0 | $0 | $0 | $0 | $0 | $0 | $0 | $0 |
| Retained Earnings | $2,612 | $8,066 | $8,066 | $8,066 | $8,066 | $8,066 | $8,066 | $8,066 | $8,066 | $8,066 | $8,066 | $8,066 | $8,066 |
| Earnings | $5,454 | ($93) | ($68) | $272 | $393 | $606 | ($23) | ($103) | $114 | $747 | $1,601 | $2,773 | $4,463 |
| Total Capital | $8,066 | $7,973 | $7,998 | $8,338 | $8,459 | $8,672 | $8,043 | $7,963 | $8,180 | $8,813 | $9,667 | $10,839 | $12,529 |
| Total Liabilities and Capital | $27,067 | $24,998 | $25,073 | $25,543 | $46,570 | $48,257 | $47,937 | $50,017 | $49,609 | $50,541 | $51,207 | $52,545 | $54,711 |
| Net Worth | $8,066 | $7,973 | $7,998 | $8,338 | $8,459 | $8,672 | $8,043 | $7,963 | $8,180 | $8,813 | $9,667 | $10,839 | $12,529 |


