
Basket of Goodies
Executive Summary
Introduction
Basket of Goodies (BOG) is a premier gift basket retailer. BOG is concentrating on making gourmet gift baskets out of a wide range of high-quality ingredients. In addition to having several flagship baskets, BOG will also offer the option of a custom basket allowing the customer to choose the ingredients themselves. BOG will be selling to individuals as well as corporations. Initially the bulk of BOG’s business will be generated by individuals from word-of-mouth referrals, but as time passes, corporations will become a growing percentage of sales.
Once up and running with some momentum, BOG will be steadily producing profits. It is projected that BOG will be making a profit by December. By the end of year three, it is projected that BOG will be generating a net profit of approximately $21,000.
The Company
The Basket of Goodies’ mission is to create the finest gift baskets available. BOG, soon to be located in Salem, OR, will be hand assembling our products out of premier ingredients, local when possible. The business will be based out of Susan Presento’s home. Although this will be a home-based business, toward the end of year one Susan will have an employee.
Susan Presento, founder and owner, managed a flower shop in Salem for three years and this has given her insight to the gift giving practices of Oregonians. The primary gift baskets that will be offered are: smoked fish basket, fruit basket, pasta dinner basket, and picnic basket that has caviar, crackers, fruit, and smoked fish. BOG also offers a custom basket which allows customers to pick items from a list and BOG will assemble the basket with its custom ingredients.
The Market
The purchasing of gift baskets is very “seasonal.” More than half of the gift basket purchasing occurs during a wide variety of holidays.
BOG’s competitive advantage will be based on two factors, low overhead which allows reasonable prices, and an unrelenting desire for the highest quality product and service.
- Low overhead.
- Highest quality product and service.
BOG’s sales strategy will be targeted at obtaining both the individual and corporate clients through word-of-mouth referrals. Customers will be able to place an order at the office, over the phone or via the website.
Financials
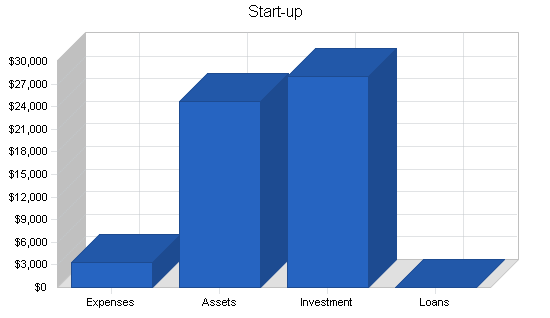
BOG’s start-up costs will include all the equipment needed for the home-based office, legal fees, website creation, and start-up advertising. The home office equipment will be the largest chunk of the start-up expenses. This equipment includes a computer system, fax machine, office supplies, cellular phone, and pager. Additionally, there will be the installation of a broadband connection, and furniture for the home office. Total start-up expenses are expected to be $28,000, all of which will be provided through Susan Presento’s own equity.
The Break-even Analysis indicates BOG will need to sell approximately $4,900 per month to break even. BOG expects to earn approximately $14,000 in year two and $21,000 in year three.

1.1 Mission
The Basket of Goodies’ mission is to create the finest gift baskets available. We exist to attract and maintain customers. When we adhere to this maxim, everything else will fall into place. Our products and services will exceed the expectations of our customers.
1.2 Objectives
The objectives for the first three years of operation include:
- To create a home-based company whose primary goal is to exceed customer’s expectations.
- To increase the number of clients served by at least 20% per year through superior performance and word-of-mouth referrals.
- To develop a sustainable home business, surviving off its own cash flow.
Company Summary
BOG, soon to be located in Salem, OR will offer a wide range of gourmet gift baskets, production as well as custom units. BOG will be hand assembling the baskets out of premier ingredients, local when possible. The business will be based out of Susan Presento’s home. Although this will be a home-based business, toward the end of year one Susan will have an employee. If the business goes per the forecasted plan, the business will achieve profits by the end of year one.
2.1 Company Ownership
The Basket of Goodies will be a sole proprietorship, owned by Susan Presento.
2.2 Start-up Summary
BOG’s start-up costs will include all the equipment needed for the home-based office, legal fees, website creation, and start-up advertising. The home office equipment will be the largest chunk of the start-up expenses. This equipment includes a computer system, fax machine, office supplies, cellular phone, and pager. The computer should have a 500 megahertz Celeron/Pentium processor, 64 megabytes of RAM (preferably 128), 6 gigabyte hard drive, and a rewritable CD-ROM for backing up the system. Additionally, there will be the expense installation of a broadband connection. While a broadband connection is not totally necessary, it only costs between $40-50 per month for service and will make working on the Internet significantly faster and easier.
The home office will also require a few pieces of furniture such as a desk, chair, and bookshelf to transform a standard room into an office. Lastly, an additional land phone line will be required. The legal fees are used for the formation of the business as well as for reviewing/generating standard client contracts. The Web creation fees at start-up costs are for design and creation of the website. The start-up advertising will be the production of brochures.
| Start-up | |
| Requirements | |
| Start-up Expenses | |
| Legal | $300 |
| Stationery etc. | $100 |
| Brochures | $200 |
| Consultants | $1,500 |
| Office Supplies | $100 |
| General Supplies | $250 |
| Website Creation | $500 |
| Mailings | $400 |
| Total Start-up Expenses | $3,350 |
| Start-up Assets | |
| Cash Required | $22,650 |
| Start-up Inventory | $0 |
| Other Current Assets | $0 |
| Long-term Assets | $2,000 |
| Total Assets | $24,650 |
| Total Requirements | $28,000 |
| Start-up Funding | |
| Start-up Expenses to Fund | $3,350 |
| Start-up Assets to Fund | $24,650 |
| Total Funding Required | $28,000 |
| Assets | |
| Non-cash Assets from Start-up | $2,000 |
| Cash Requirements from Start-up | $22,650 |
| Additional Cash Raised | $0 |
| Cash Balance on Starting Date | $22,650 |
| Total Assets | $24,650 |
| Liabilities and Capital | |
| Liabilities | |
| Current Borrowing | $0 |
| Long-term Liabilities | $0 |
| Accounts Payable (Outstanding Bills) | $0 |
| Other Current Liabilities (interest-free) | $0 |
| Total Liabilities | $0 |
| Capital | |
| Planned Investment | |
| Investor 1 | $28,000 |
| Other | $0 |
| Additional Investment Requirement | $0 |
| Total Planned Investment | $28,000 |
| Loss at Start-up (Start-up Expenses) | ($3,350) |
| Total Capital | $24,650 |
| Total Capital and Liabilities | $24,650 |
| Total Funding | $28,000 |
Products
BOG sells gourmet, hand-assembled gift baskets. Their premier baskets are: smoked fish basket, fruit basket, pasta dinner basket, and picnic basket that has caviar, crackers, fruit, and smoked fish. BOG also offers a custom basket which allow customers to pick items from a list and BOG will assemble the basket with their custom ingredients.
For the customer baskets, BOG will provide a list of options grouped into four different categories. The customer then chooses two items from each of the four categories and the gift basket is made for them. BOG highlights four previously mentioned premier baskets. In addition to these, BOG will typically have one or two specials, often seasonally based.
Market Analysis Summary
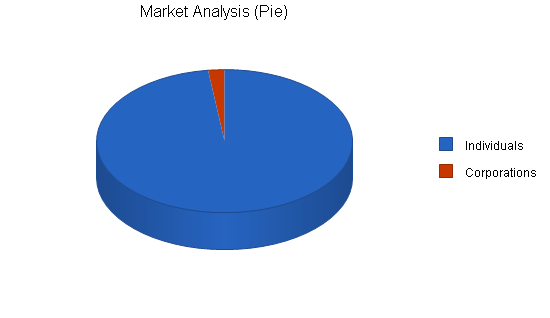
BOG will be going after two distinct market segments, individuals and corporations. Both groups buy gift baskets as a goodwill gesture, typically for different reasons. Individuals typically buy the baskets as a present with over half of sales occur during holidays. Corporations buy the baskets as presents as well, but usually for events unrelated to the holidays. By going after both of these groups, sales will be less seasonal (relative to if only the individuals were targeted).

There are many different “gift basket” retailers in Salem. BOG will differentiate themselves through the use of premium ingredients in their baskets. The gourmet baskets, coupled with a custom option and reasonable prices (attributed to low overhead) will spell success for BOG.
4.1 Market Segmentation
BOG’s has two distinct groups of customers, individuals and corporate customers:
- Individuals– The individuals are people who are looking to give a friend, relative, colleague, etc., a gift basket as a gesture of goodwill. These customers typically do not have a specific type of gift basket in mind when they look at BOG’s product offerings, they just want to give a gift.
- Corporate– The corporate customer is typically buying the basket for a colleague at work, either as a sign of appreciation, for a special event, or as a thank you for a customer. The corporate market can be further broken down to banks, health care, employment gifts, real estate, apartments, special events/promotions, corporate headquarters, hotels/vacation resorts, and automobile dealerships.
| Market Analysis | |||||||
| Year 1 | Year 2 | Year 3 | Year 4 | Year 5 | |||
| Potential Customers | Growth | CAGR | |||||
| Individuals | 8% | 14,258 | 15,399 | 16,631 | 17,961 | 19,398 | 8.00% |
| Corporations | 12% | 298 | 334 | 374 | 419 | 469 | 12.01% |
| Total | 8.09% | 14,556 | 15,733 | 17,005 | 18,380 | 19,867 | 8.09% |
4.2 Target Market Segment Strategy
BOG is focusing on individuals and corporate customers because they are the largest segments of purchasers for gift baskets. Individuals are the target purchaser of gift baskets. They purchase baskets typically as a thank you in response for something the recipient did or just to be nice. The gift basket is unmistakingly a gift so upon receipt there is no ambiguity why it was sent or at least what it is trying to accomplish. Within the individual category, women are 69% more likely to be the purchaser of a gift basket compared to men. This is not to say that women more often purchase gifts, it just indicates women are more likely to buy gift baskets.
BOG is focusing on the corporate customers as they currently represent approximately a third of the purchasers of gift baskets. The corporate customer could be buying the basket for someone within their company, or they could be buying it for a customer, vendor, etc. The trend for the corporation to purchase gifts is not a new phenomenon and therefore would appear to be a solid market segment to pursue.
4.3 Industry Analysis
There are many different forms of competition in the gift basket business:
- Similar gift basket type retail stores: There are several of these stores located in Salem. These competitors offer a wide range of gift baskets, however none of them are concentrating on the higher end, gourmet product line.
- Nut/fruit companies: There are several stores that concentrate on nuts and or fruit baskets.
- Bath product gift basket companies: There is currently one gift basket company that concentrates on bath products. Bath products have a slightly smaller population of people who appreciate these products (as women predominately appreciate bath products more then men do).
- Regional gift basket: There is one retailer that sells gift baskets composed of local products. These type of baskets tend to appeal to people that are buying gifts for people that are not from this area.
- Candy gift baskets: There are several candy stores that offer, as one on their products, a candy gift basket. Similar to the bath products basket, candy typically appeals to women a bit more so then men.
- Florists: Flowers are a similar product that competes with gift baskets. Once again flowers tend to appeal to women more so then men.
The purchasing of gift baskets is very “seasonal.” More than half of the gift basket purchasing occurs during a wide variety of holidays.
Strategy and Implementation Summary
BOG’s marketing and sales strategy will be based on two different types of media, brochures and a website. Through these two tools, customers will become familiar with BOG’s products. BOG will also heavily rely on word-of-mouth referrals for business. BOG does not anticipate any difficulties in developing these referrals as BOG’s mission is customer oriented. Everything they do revolves around developing a happy customer.
5.1 Competitive Edge
BOG’s competitive advantage will be based on two factors, low overhead which allows reasonable prices, and an unrelenting desire for the highest quality product and service.
- BOG’s overhead is particularly low because it is a home-based business. Most of the competition is based in retail shopping areas. While they receive more walk-by traffic and therefore higher sales numbers, their rent is a large monthly expense. BOG avoids this large expense by having the business run out of Susan’s home. Additionally, Susan will be using a modified version of just-in-time (JIT) inventory and assembling. Susan’s husband passes by the 90% of Susan’s vendors on his way home from work and is able to pick up needed inventory. This significantly lowers shipping and carrying costs for inventory. BOG will have some of the standard baskets in stock for walk-by orders, but will try not to have large amount in overhead.
- Unrelenting desire for the highest quality product and service. This market space is already crowded, a mediocre gift basket service will not succeed, so there must be some sort of differentiation. Susan only uses the finest quality ingredients and can afford to because of her low overhead. Additionally, she always follows the maxim that the customer must be 100% satisfied. That means she is willing to lose money in the short run if necessary to please a customer, confident that in the long run that this is a wise business decision.
5.2 Sales Strategy
BOG’s sales strategy will be targeted at obtaining both the individual and corporate clients. It is our belief that the individual customers will be primarily obtained through word-of-mouth referrals. It is likely that they will have spoken to a previous client about BOG and the referral of our services will speak for itself. Our sales strategy will be to use an emphasis on our value and high quality when trying to close the sale of the prospect. The prospective client can get a similar product from a number of different vendors. BOG will attempt to close the sale by showing the high quality of the basket by highlighting some of the individual ingredients. BOG’s expectation is that once they are impressed with the quality of the basket, they will then be surprised that it is priced the same as competing products. The combination of the perception of higher quality and the recognition of value should turn a lead into a customer.
Additionally, we provide several ways to procure the baskets. One way is for the customer to come by the office and place the order. The customer can also place the order through a phone call. Either they have ordered before, or are looking at a brochure and know what they want, or they can visit our website for a complete catalog of our products. To receive the product, they can pick up the product, or they may have it shipped via UPS. BOG believes that by providing the customer a wide range of options, they will feel that they are special as we will do a wide range of services to accommodate them. Our sales strategy for individuals and particularly corporations will be based on our Web presence in conjunction with our printed catalog. Both media will have detailed information about our service offerings.
Through our marketing efforts we will be driving people to our website and/or catalog. Once on our website, people will see the wide range of product offerings we have and then can contact us. The website will be especially useful for someone out of town who is need of a gift for someone. BOG expects the corporate customers to utilize the website as a catalog, as well as an order taker, because it takes less time for them to order on the Web then it does from them to do in person.
5.2.1 Sales Forecast
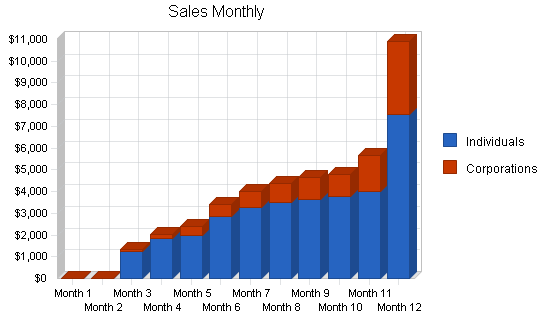
The first month will be spent setting up the business. It is unlikely that there will be much sales activity. In addition to dealing with legal and accounting issues, equipment will need to be purchased, an office created, and an assembly/inventory room set up in the basement. Susan will be developing a system for assembly within the first month as a way to streamline the entire process, as well as working on having the website designed and set up. This will require a bit of time spent with her Web designer to perfect the look and feel of the site as well as to set up the option of taking orders online.
Month two or three will begin to see some sales activity. BOG recognizes that it will take a bit of time to really ramp up the sales. Susan will be doing a lot of networking in an attempt to spread awareness about BOG’s products and services. Susan will also be doing some direct mailing to some local corporations in an attempt to drive in some corporate business. Susan has a friend who works at a large company and she will serve as a consultant for ways of increasing corporate purchases. Because Susan’s husband will be helping out with picking up some of the materials, Susan will not need an employee until near the end of year one.
| Sales Forecast | |||
| Year 1 | Year 2 | Year 3 | |
| Sales | |||
| Individuals | $33,640 | $64,575 | $78,452 |
| Corporations | $9,905 | $28,744 | $31,458 |
| Total Sales | $43,545 | $93,319 | $109,910 |
| Direct Cost of Sales | Year 1 | Year 2 | Year 3 |
| Individuals | $11,484 | $18,474 | $24,124 |
| Corporations | $3,505 | $7,854 | $9,898 |
| Subtotal Direct Cost of Sales | $14,989 | $26,328 | $34,022 |
5.3 Milestones
BOG will have several milestones early on:
- Business plan completion. This will be done as a road map for the company. While BOG does not need a business plan to raise capital, it will be an indispensable tool for the ongoing performance and improvement of the company.
- Set up office.
- Production of brochure and website.
- BOG’s 100th basket.
- BOG’s first profitable month.
| Milestones | |||||
| Milestone | Start Date | End Date | Budget | Manager | Department |
| Business plan completion | 1/1/2001 | 1/1/2001 | $0 | Susan | Marketing |
| Set-up office | 1/1/2001 | 1/1/2001 | $0 | Susan | Department |
| Production of brochure and website | 1/1/2001 | 2/1/2001 | $0 | Susan | Department |
| BOG’s 100th basket | 3/1/2001 | 3/1/2001 | $0 | Susan | Department |
| Totals | $0 | ||||
Management Summary
BOG will be formed as a sole proprietorship, owned and operated by Susan Presento. There is no compelling need to incorporate. The advantage of incorporation would be limited liability, yet the disadvantage would be the set-up costs and maintenance (tax disadvantages). A comprehensive insurance policy should cover any liability that BOG is exposed to.
Susan Presento, founder and owner, has a degree in communications from the University of Portland. During her undergraduate years, Susan worked at Nothstroms, perfecting her customer-centric perspective. After graduation, Susan managed a flower shop in Salem. It was during these three years that Susan gained her insight to the gift giving practices of Oregonians. Susan also gained valuable management experience in her work at the florist. Susan will be relying on Robert Presento, her husband to help out in the pick up of the ingredients of her products. In addition to Robert’s help, Susan will be using Jennifer Simon who works in the purchasing department of a large corporation. Jennifer will act as a consultant regarding the purchasing habits of corporations, a niche of the industry that Susan would like to be a part of.
6.1 Personnel Plan
The staff of BOG will consist of Susan working full time. Susan’s husband Robert will help with inventory procurement but will not be listed on the payroll. Robert will be picking up inventory on his way home from work occasionally and will not be billing BOG for his work. Jennifer Simon will be a consultant for BOG for insight into the corporate market. By month eight Susan will bring on board a part-time employee. This employee will be used for the assembly of the baskets.
| Personnel Plan | |||
| Year 1 | Year 2 | Year 3 | |
| Susan | $24,000 | $24,000 | $24,000 |
| Part-time employee | $7,500 | $15,000 | $15,000 |
| Other | $0 | $0 | $0 |
| Total People | 2 | 2 | 2 |
| Total Payroll | $31,500 | $39,000 | $39,000 |
Financial Plan
The following sections will outline the important financial data.
7.1 Important Assumptions
The following table details important financial assumptions for BOG.
| General Assumptions | |||
| Year 1 | Year 2 | Year 3 | |
| Plan Month | 1 | 2 | 3 |
| Current Interest Rate | 10.00% | 10.00% | 10.00% |
| Long-term Interest Rate | 10.00% | 10.00% | 10.00% |
| Tax Rate | 25.42% | 25.00% | 25.42% |
| Other | 0 | 0 | 0 |
7.2 Break-even Analysis
The Break-even Analysis indicates BOG will need to sell approximately $4,900 in baskets per month to break even.

| Break-even Analysis | |
| Monthly Revenue Break-even | $4,915 |
| Assumptions: | |
| Average Percent Variable Cost | 34% |
| Estimated Monthly Fixed Cost | $3,223 |
7.3 Projected Profit and Loss
The following table will indicate projected profit and loss.
| Pro Forma Profit and Loss | |||
| Year 1 | Year 2 | Year 3 | |
| Sales | $43,545 | $93,319 | $109,910 |
| Direct Cost of Sales | $14,989 | $26,328 | $34,022 |
| Other | $0 | $0 | $0 |
| Total Cost of Sales | $14,989 | $26,328 | $34,022 |
| Gross Margin | $28,556 | $66,991 | $75,888 |
| Gross Margin % | 65.58% | 71.79% | 69.05% |
| Expenses | |||
| Payroll | $31,500 | $39,000 | $39,000 |
| Sales and Marketing and Other Expenses | $1,200 | $1,200 | $1,200 |
| Depreciation | $655 | $672 | $672 |
| Leased Equipment | $0 | $0 | $0 |
| Utilities | $0 | $0 | $0 |
| Insurance | $600 | $600 | $600 |
| Rent | $0 | $0 | $0 |
| Payroll Taxes | $4,725 | $5,850 | $5,850 |
| Other | $0 | $0 | $0 |
| Total Operating Expenses | $38,680 | $47,322 | $47,322 |
| Profit Before Interest and Taxes | ($10,124) | $19,669 | $28,566 |
| EBITDA | ($9,469) | $20,341 | $29,238 |
| Interest Expense | $0 | $0 | $0 |
| Taxes Incurred | $0 | $4,917 | $7,261 |
| Net Profit | ($10,124) | $14,752 | $21,305 |
| Net Profit/Sales | -23.25% | 15.81% | 19.38% |
7.4 Projected Cash Flow
The following chart and table will indicate projected cash flow.

| Pro Forma Cash Flow | |||
| Year 1 | Year 2 | Year 3 | |
| Cash Received | |||
| Cash from Operations | |||
| Cash Sales | $43,545 | $93,319 | $109,910 |
| Subtotal Cash from Operations | $43,545 | $93,319 | $109,910 |
| Additional Cash Received | |||
| Sales Tax, VAT, HST/GST Received | $0 | $0 | $0 |
| New Current Borrowing | $0 | $0 | $0 |
| New Other Liabilities (interest-free) | $0 | $0 | $0 |
| New Long-term Liabilities | $0 | $0 | $0 |
| Sales of Other Current Assets | $0 | $0 | $0 |
| Sales of Long-term Assets | $0 | $0 | $0 |
| New Investment Received | $0 | $0 | $0 |
| Subtotal Cash Received | $43,545 | $93,319 | $109,910 |
| Expenditures | Year 1 | Year 2 | Year 3 |
| Expenditures from Operations | |||
| Cash Spending | $31,500 | $39,000 | $39,000 |
| Bill Payments | $18,916 | $44,238 | $49,978 |
| Subtotal Spent on Operations | $50,416 | $83,238 | $88,978 |
| Additional Cash Spent | |||
| Sales Tax, VAT, HST/GST Paid Out | $0 | $0 | $0 |
| Principal Repayment of Current Borrowing | $0 | $0 | $0 |
| Other Liabilities Principal Repayment | $0 | $0 | $0 |
| Long-term Liabilities Principal Repayment | $0 | $0 | $0 |
| Purchase Other Current Assets | $0 | $0 | $0 |
| Purchase Long-term Assets | $0 | $0 | $0 |
| Dividends | $0 | $0 | $0 |
| Subtotal Cash Spent | $50,416 | $83,238 | $88,978 |
| Net Cash Flow | ($6,871) | $10,081 | $20,932 |
| Cash Balance | $15,779 | $25,860 | $46,792 |
7.5 Projected Balance Sheet
The following table will indicate the projected balance sheet.
| Pro Forma Balance Sheet | |||
| Year 1 | Year 2 | Year 3 | |
| Assets | |||
| Current Assets | |||
| Cash | $15,779 | $25,860 | $46,792 |
| Inventory | $3,507 | $6,160 | $7,960 |
| Other Current Assets | $0 | $0 | $0 |
| Total Current Assets | $19,286 | $32,020 | $54,752 |
| Long-term Assets | |||
| Long-term Assets | $2,000 | $2,000 | $2,000 |
| Accumulated Depreciation | $655 | $1,327 | $1,999 |
| Total Long-term Assets | $1,345 | $673 | $1 |
| Total Assets | $20,631 | $32,693 | $54,753 |
| Liabilities and Capital | Year 1 | Year 2 | Year 3 |
| Current Liabilities | |||
| Accounts Payable | $6,105 | $3,415 | $4,170 |
| Current Borrowing | $0 | $0 | $0 |
| Other Current Liabilities | $0 | $0 | $0 |
| Subtotal Current Liabilities | $6,105 | $3,415 | $4,170 |
| Long-term Liabilities | $0 | $0 | $0 |
| Total Liabilities | $6,105 | $3,415 | $4,170 |
| Paid-in Capital | $28,000 | $28,000 | $28,000 |
| Retained Earnings | ($3,350) | ($13,474) | $1,278 |
| Earnings | ($10,124) | $14,752 | $21,305 |
| Total Capital | $14,526 | $29,278 | $50,584 |
| Total Liabilities and Capital | $20,631 | $32,693 | $54,753 |
| Net Worth | $14,526 | $29,278 | $50,584 |
7.6 Business Ratios
The ratios table compares BOG’s estimated growth, balance and profit ratios to the industry standard for Miscellaneous personal services (Standard Industry Code #7299).
| Ratio Analysis | ||||
| Year 1 | Year 2 | Year 3 | Industry Profile | |
| Sales Growth | 0.00% | 114.30% | 17.78% | 17.90% |
| Percent of Total Assets | ||||
| Inventory | 17.00% | 18.84% | 14.54% | 4.60% |
| Other Current Assets | 0.00% | 0.00% | 0.00% | 37.10% |
| Total Current Assets | 93.48% | 97.94% | 100.00% | 52.80% |
| Long-term Assets | 6.52% | 2.06% | 0.00% | 47.20% |
| Total Assets | 100.00% | 100.00% | 100.00% | 100.00% |
| Current Liabilities | 29.59% | 10.45% | 7.62% | 33.90% |
| Long-term Liabilities | 0.00% | 0.00% | 0.00% | 28.00% |
| Total Liabilities | 29.59% | 10.45% | 7.62% | 61.90% |
| Net Worth | 70.41% | 89.55% | 92.38% | 38.10% |
| Percent of Sales | ||||
| Sales | 100.00% | 100.00% | 100.00% | 100.00% |
| Gross Margin | 65.58% | 71.79% | 69.05% | 0.00% |
| Selling, General & Administrative Expenses | 88.87% | 55.98% | 49.55% | 72.70% |
| Advertising Expenses | 0.00% | 0.00% | 0.00% | 2.20% |
| Profit Before Interest and Taxes | -23.25% | 21.08% | 25.99% | 4.00% |
| Main Ratios | ||||
| Current | 3.16 | 9.38 | 13.13 | 1.81 |
| Quick | 2.58 | 7.57 | 11.22 | 1.33 |
| Total Debt to Total Assets | 29.59% | 10.45% | 7.62% | 61.90% |
| Pre-tax Return on Net Worth | -69.69% | 67.18% | 56.47% | 6.30% |
| Pre-tax Return on Assets | -49.07% | 60.16% | 52.17% | 16.60% |
| Additional Ratios | Year 1 | Year 2 | Year 3 | |
| Net Profit Margin | -23.25% | 15.81% | 19.38% | n.a |
| Return on Equity | -69.69% | 50.38% | 42.12% | n.a |
| Activity Ratios | ||||
| Inventory Turnover | 10.80 | 5.45 | 4.82 | n.a |
| Accounts Payable Turnover | 4.10 | 12.17 | 12.17 | n.a |
| Payment Days | 27 | 42 | 27 | n.a |
| Total Asset Turnover | 2.11 | 2.85 | 2.01 | n.a |
| Debt Ratios | ||||
| Debt to Net Worth | 0.42 | 0.12 | 0.08 | n.a |
| Current Liab. to Liab. | 1.00 | 1.00 | 1.00 | n.a |
| Liquidity Ratios | ||||
| Net Working Capital | $13,181 | $28,605 | $50,582 | n.a |
| Interest Coverage | 0.00 | 0.00 | 0.00 | n.a |
| Additional Ratios | ||||
| Assets to Sales | 0.47 | 0.35 | 0.50 | n.a |
| Current Debt/Total Assets | 30% | 10% | 8% | n.a |
| Acid Test | 2.58 | 7.57 | 11.22 | n.a |
| Sales/Net Worth | 3.00 | 3.19 | 2.17 | n.a |
| Dividend Payout | 0.00 | 0.00 | 0.00 | n.a |
Appendix
| Sales Forecast | |||||||||||||
| Month 1 | Month 2 | Month 3 | Month 4 | Month 5 | Month 6 | Month 7 | Month 8 | Month 9 | Month 10 | Month 11 | Month 12 | ||
| Sales | |||||||||||||
| Individuals | 0% | $0 | $0 | $1,245 | $1,854 | $1,987 | $2,854 | $3,254 | $3,475 | $3,654 | $3,758 | $4,014 | $7,545 |
| Corporations | 0% | $0 | $0 | $75 | $187 | $421 | $564 | $745 | $887 | $998 | $1,014 | $1,645 | $3,369 |
| Total Sales | $0 | $0 | $1,320 | $2,041 | $2,408 | $3,418 | $3,999 | $4,362 | $4,652 | $4,772 | $5,659 | $10,914 | |
| Direct Cost of Sales | Month 1 | Month 2 | Month 3 | Month 4 | Month 5 | Month 6 | Month 7 | Month 8 | Month 9 | Month 10 | Month 11 | Month 12 | |
| Individuals | $0 | $0 | $621 | $751 | $812 | $1,354 | $1,547 | $1,354 | $1,345 | $1,345 | $154 | $2,201 | |
| Corporations | $0 | $0 | $35 | $64 | $158 | $225 | $354 | $321 | $351 | $352 | $658 | $987 | |
| Subtotal Direct Cost of Sales | $0 | $0 | $656 | $815 | $970 | $1,579 | $1,901 | $1,675 | $1,696 | $1,697 | $812 | $3,188 | |
| Personnel Plan | |||||||||||||
| Month 1 | Month 2 | Month 3 | Month 4 | Month 5 | Month 6 | Month 7 | Month 8 | Month 9 | Month 10 | Month 11 | Month 12 | ||
| Susan | 0% | $2,000 | $2,000 | $2,000 | $2,000 | $2,000 | $2,000 | $2,000 | $2,000 | $2,000 | $2,000 | $2,000 | $2,000 |
| Part-time employee | 0% | $0 | $0 | $0 | $0 | $0 | $0 | $0 | $1,500 | $1,500 | $1,500 | $1,500 | $1,500 |
| Other | 0% | $0 | $0 | $0 | $0 | $0 | $0 | $0 | $0 | $0 | $0 | $0 | $0 |
| Total People | 1 | 1 | 1 | 1 | 1 | 1 | 1 | 2 | 2 | 2 | 2 | 2 | |
| Total Payroll | $2,000 | $2,000 | $2,000 | $2,000 | $2,000 | $2,000 | $2,000 | $3,500 | $3,500 | $3,500 | $3,500 | $3,500 | |
| General Assumptions | |||||||||||||
| Month 1 | Month 2 | Month 3 | Month 4 | Month 5 | Month 6 | Month 7 | Month 8 | Month 9 | Month 10 | Month 11 | Month 12 | ||
| Plan Month | 1 | 2 | 3 | 4 | 5 | 6 | 7 | 8 | 9 | 10 | 11 | 12 | |
| Current Interest Rate | 10.00% | 10.00% | 10.00% | 10.00% | 10.00% | 10.00% | 10.00% | 10.00% | 10.00% | 10.00% | 10.00% | 10.00% | |
| Long-term Interest Rate | 10.00% | 10.00% | 10.00% | 10.00% | 10.00% | 10.00% | 10.00% | 10.00% | 10.00% | 10.00% | 10.00% | 10.00% | |
| Tax Rate | 30.00% | 25.00% | 25.00% | 25.00% | 25.00% | 25.00% | 25.00% | 25.00% | 25.00% | 25.00% | 25.00% | 25.00% | |
| Other | 0 | 0 | 0 | 0 | 0 | 0 | 0 | 0 | 0 | 0 | 0 | 0 | |
| Pro Forma Profit and Loss | |||||||||||||
| Month 1 | Month 2 | Month 3 | Month 4 | Month 5 | Month 6 | Month 7 | Month 8 | Month 9 | Month 10 | Month 11 | Month 12 | ||
| Sales | $0 | $0 | $1,320 | $2,041 | $2,408 | $3,418 | $3,999 | $4,362 | $4,652 | $4,772 | $5,659 | $10,914 | |
| Direct Cost of Sales | $0 | $0 | $656 | $815 | $970 | $1,579 | $1,901 | $1,675 | $1,696 | $1,697 | $812 | $3,188 | |
| Other | $0 | $0 | $0 | $0 | $0 | $0 | $0 | $0 | $0 | $0 | $0 | $0 | |
| Total Cost of Sales | $0 | $0 | $656 | $815 | $970 | $1,579 | $1,901 | $1,675 | $1,696 | $1,697 | $812 | $3,188 | |
| Gross Margin | $0 | $0 | $664 | $1,226 | $1,438 | $1,839 | $2,098 | $2,687 | $2,956 | $3,075 | $4,847 | $7,726 | |
| Gross Margin % | 0.00% | 0.00% | 50.30% | 60.07% | 59.72% | 53.80% | 52.46% | 61.60% | 63.54% | 64.44% | 85.65% | 70.79% | |
| Expenses | |||||||||||||
| Payroll | $2,000 | $2,000 | $2,000 | $2,000 | $2,000 | $2,000 | $2,000 | $3,500 | $3,500 | $3,500 | $3,500 | $3,500 | |
| Sales and Marketing and Other Expenses | $100 | $100 | $100 | $100 | $100 | $100 | $100 | $100 | $100 | $100 | $100 | $100 | |
| Depreciation | $55 | $55 | $55 | $55 | $55 | $55 | $55 | $55 | $55 | $55 | $55 | $55 | |
| Leased Equipment | $0 | $0 | $0 | $0 | $0 | $0 | $0 | $0 | $0 | $0 | $0 | $0 | |
| Utilities | $0 | $0 | $0 | $0 | $0 | $0 | $0 | $0 | $0 | $0 | $0 | $0 | |
| Insurance | $50 | $50 | $50 | $50 | $50 | $50 | $50 | $50 | $50 | $50 | $50 | $50 | |
| Rent | $0 | $0 | $0 | $0 | $0 | $0 | $0 | $0 | $0 | $0 | $0 | $0 | |
| Payroll Taxes | 15% | $300 | $300 | $300 | $300 | $300 | $300 | $300 | $525 | $525 | $525 | $525 | $525 |
| Other | $0 | $0 | $0 | $0 | $0 | $0 | $0 | $0 | $0 | $0 | $0 | $0 | |
| Total Operating Expenses | $2,505 | $2,505 | $2,505 | $2,505 | $2,505 | $2,505 | $2,505 | $4,230 | $4,230 | $4,230 | $4,230 | $4,230 | |
| Profit Before Interest and Taxes | ($2,505) | ($2,505) | ($1,841) | ($1,279) | ($1,067) | ($666) | ($407) | ($1,543) | ($1,274) | ($1,155) | $617 | $3,496 | |
| EBITDA | ($2,450) | ($2,450) | ($1,786) | ($1,224) | ($1,012) | ($611) | ($352) | ($1,488) | ($1,219) | ($1,100) | $672 | $3,551 | |
| Interest Expense | $0 | $0 | $0 | $0 | $0 | $0 | $0 | $0 | $0 | $0 | $0 | $0 | |
| Taxes Incurred | $0 | $0 | $0 | $0 | $0 | $0 | $0 | $0 | $0 | $0 | $0 | $0 | |
| Net Profit | ($2,505) | ($2,505) | ($1,841) | ($1,279) | ($1,067) | ($666) | ($407) | ($1,543) | ($1,274) | ($1,155) | $617 | $3,496 | |
| Net Profit/Sales | 0.00% | 0.00% | -139.44% | -62.64% | -44.29% | -19.47% | -10.17% | -35.36% | -27.38% | -24.19% | 10.91% | 32.04% | |
| Pro Forma Cash Flow | |||||||||||||
| Month 1 | Month 2 | Month 3 | Month 4 | Month 5 | Month 6 | Month 7 | Month 8 | Month 9 | Month 10 | Month 11 | Month 12 | ||
| Cash Received | |||||||||||||
| Cash from Operations | |||||||||||||
| Cash Sales | $0 | $0 | $1,320 | $2,041 | $2,408 | $3,418 | $3,999 | $4,362 | $4,652 | $4,772 | $5,659 | $10,914 | |
| Subtotal Cash from Operations | $0 | $0 | $1,320 | $2,041 | $2,408 | $3,418 | $3,999 | $4,362 | $4,652 | $4,772 | $5,659 | $10,914 | |
| Additional Cash Received | |||||||||||||
| Sales Tax, VAT, HST/GST Received | 0.00% | $0 | $0 | $0 | $0 | $0 | $0 | $0 | $0 | $0 | $0 | $0 | $0 |
| New Current Borrowing | $0 | $0 | $0 | $0 | $0 | $0 | $0 | $0 | $0 | $0 | $0 | $0 | |
| New Other Liabilities (interest-free) | $0 | $0 | $0 | $0 | $0 | $0 | $0 | $0 | $0 | $0 | $0 | $0 | |
| New Long-term Liabilities | $0 | $0 | $0 | $0 | $0 | $0 | $0 | $0 | $0 | $0 | $0 | $0 | |
| Sales of Other Current Assets | $0 | $0 | $0 | $0 | $0 | $0 | $0 | $0 | $0 | $0 | $0 | $0 | |
| Sales of Long-term Assets | $0 | $0 | $0 | $0 | $0 | $0 | $0 | $0 | $0 | $0 | $0 | $0 | |
| New Investment Received | $0 | $0 | $0 | $0 | $0 | $0 | $0 | $0 | $0 | $0 | $0 | $0 | |
| Subtotal Cash Received | $0 | $0 | $1,320 | $2,041 | $2,408 | $3,418 | $3,999 | $4,362 | $4,652 | $4,772 | $5,659 | $10,914 | |
| Expenditures | Month 1 | Month 2 | Month 3 | Month 4 | Month 5 | Month 6 | Month 7 | Month 8 | Month 9 | Month 10 | Month 11 | Month 12 | |
| Expenditures from Operations | |||||||||||||
| Cash Spending | $2,000 | $2,000 | $2,000 | $2,000 | $2,000 | $2,000 | $2,000 | $3,500 | $3,500 | $3,500 | $3,500 | $3,500 | |
| Bill Payments | $15 | $450 | $496 | $1,815 | $1,454 | $1,618 | $2,699 | $2,685 | $2,111 | $2,393 | $2,316 | $863 | |
| Subtotal Spent on Operations | $2,015 | $2,450 | $2,496 | $3,815 | $3,454 | $3,618 | $4,699 | $6,185 | $5,611 | $5,893 | $5,816 | $4,363 | |
| Additional Cash Spent | |||||||||||||
| Sales Tax, VAT, HST/GST Paid Out | $0 | $0 | $0 | $0 | $0 | $0 | $0 | $0 | $0 | $0 | $0 | $0 | |
| Principal Repayment of Current Borrowing | $0 | $0 | $0 | $0 | $0 | $0 | $0 | $0 | $0 | $0 | $0 | $0 | |
| Other Liabilities Principal Repayment | $0 | $0 | $0 | $0 | $0 | $0 | $0 | $0 | $0 | $0 | $0 | $0 | |
| Long-term Liabilities Principal Repayment | $0 | $0 | $0 | $0 | $0 | $0 | $0 | $0 | $0 | $0 | $0 | $0 | |
| Purchase Other Current Assets | $0 | $0 | $0 | $0 | $0 | $0 | $0 | $0 | $0 | $0 | $0 | $0 | |
| Purchase Long-term Assets | $0 | $0 | $0 | $0 | $0 | $0 | $0 | $0 | $0 | $0 | $0 | $0 | |
| Dividends | $0 | $0 | $0 | $0 | $0 | $0 | $0 | $0 | $0 | $0 | $0 | $0 | |
| Subtotal Cash Spent | $2,015 | $2,450 | $2,496 | $3,815 | $3,454 | $3,618 | $4,699 | $6,185 | $5,611 | $5,893 | $5,816 | $4,363 | |
| Net Cash Flow | ($2,015) | ($2,450) | ($1,176) | ($1,774) | ($1,046) | ($200) | ($700) | ($1,823) | ($959) | ($1,121) | ($157) | $6,551 | |
| Cash Balance | $20,635 | $18,185 | $17,009 | $15,235 | $14,189 | $13,989 | $13,289 | $11,466 | $10,507 | $9,385 | $9,228 | $15,779 | |
| Pro Forma Balance Sheet | |||||||||||||
| Month 1 | Month 2 | Month 3 | Month 4 | Month 5 | Month 6 | Month 7 | Month 8 | Month 9 | Month 10 | Month 11 | Month 12 | ||
| Assets | Starting Balances | ||||||||||||
| Current Assets | |||||||||||||
| Cash | $22,650 | $20,635 | $18,185 | $17,009 | $15,235 | $14,189 | $13,989 | $13,289 | $11,466 | $10,507 | $9,385 | $9,228 | $15,779 |
| Inventory | $0 | $0 | $0 | $722 | $907 | $1,067 | $1,737 | $2,091 | $1,843 | $1,866 | $1,867 | $1,055 | $3,507 |
| Other Current Assets | $0 | $0 | $0 | $0 | $0 | $0 | $0 | $0 | $0 | $0 | $0 | $0 | $0 |
| Total Current Assets | $22,650 | $20,635 | $18,185 | $17,731 | $16,142 | $15,256 | $15,726 | $15,380 | $13,308 | $12,372 | $11,252 | $10,283 | $19,286 |
| Long-term Assets | |||||||||||||
| Long-term Assets | $2,000 | $2,000 | $2,000 | $2,000 | $2,000 | $2,000 | $2,000 | $2,000 | $2,000 | $2,000 | $2,000 | $2,000 | $2,000 |
| Accumulated Depreciation | $0 | $55 | $109 | $164 | $218 | $273 | $327 | $382 | $436 | $491 | $546 | $600 | $655 |
| Total Long-term Assets | $2,000 | $1,945 | $1,891 | $1,836 | $1,782 | $1,727 | $1,673 | $1,618 | $1,564 | $1,509 | $1,455 | $1,400 | $1,345 |
| Total Assets | $24,650 | $22,580 | $20,076 | $19,567 | $17,923 | $16,983 | $17,399 | $16,998 | $14,872 | $13,881 | $12,706 | $11,682 | $20,631 |
| Liabilities and Capital | Month 1 | Month 2 | Month 3 | Month 4 | Month 5 | Month 6 | Month 7 | Month 8 | Month 9 | Month 10 | Month 11 | Month 12 | |
| Current Liabilities | |||||||||||||
| Accounts Payable | $0 | $435 | $435 | $1,767 | $1,402 | $1,528 | $2,609 | $2,615 | $2,031 | $2,314 | $2,294 | $653 | $6,105 |
| Current Borrowing | $0 | $0 | $0 | $0 | $0 | $0 | $0 | $0 | $0 | $0 | $0 | $0 | $0 |
| Other Current Liabilities | $0 | $0 | $0 | $0 | $0 | $0 | $0 | $0 | $0 | $0 | $0 | $0 | $0 |
| Subtotal Current Liabilities | $0 | $435 | $435 | $1,767 | $1,402 | $1,528 | $2,609 | $2,615 | $2,031 | $2,314 | $2,294 | $653 | $6,105 |
| Long-term Liabilities | $0 | $0 | $0 | $0 | $0 | $0 | $0 | $0 | $0 | $0 | $0 | $0 | $0 |
| Total Liabilities | $0 | $435 | $435 | $1,767 | $1,402 | $1,528 | $2,609 | $2,615 | $2,031 | $2,314 | $2,294 | $653 | $6,105 |
| Paid-in Capital | $28,000 | $28,000 | $28,000 | $28,000 | $28,000 | $28,000 | $28,000 | $28,000 | $28,000 | $28,000 | $28,000 | $28,000 | $28,000 |
| Retained Earnings | ($3,350) | ($3,350) | ($3,350) | ($3,350) | ($3,350) | ($3,350) | ($3,350) | ($3,350) | ($3,350) | ($3,350) | ($3,350) | ($3,350) | ($3,350) |
| Earnings | $0 | ($2,505) | ($5,009) | ($6,850) | ($8,128) | ($9,195) | ($9,860) | ($10,267) | ($11,809) | ($13,083) | ($14,237) | ($13,620) | ($10,124) |
| Total Capital | $24,650 | $22,145 | $19,641 | $17,800 | $16,522 | $15,455 | $14,790 | $14,383 | $12,841 | $11,567 | $10,413 | $11,030 | $14,526 |
| Total Liabilities and Capital | $24,650 | $22,580 | $20,076 | $19,567 | $17,923 | $16,983 | $17,399 | $16,998 | $14,872 | $13,881 | $12,706 | $11,682 | $20,631 |
| Net Worth | $24,650 | $22,145 | $19,641 | $17,800 | $16,522 | $15,455 | $14,790 | $14,383 | $12,841 | $11,567 | $10,412 | $11,030 | $14,526 |


