
Timely Trucking
Executive Summary
Timely Trucking is a new medium- and long-haul dry van trucking business based on Portland, Oregon and founded by veteran entrepreneur Jim Kerrigan. Timely Trucking will serve businesses in the Pacific Northwest (eventually expanding to include Washington, Oregon, Idaho, Montana, and Wyoming) with freight hauling and logistics management services. The business will develop a reputation for its on-time and accurate service as well as sophisticated Web and software functionality, allowing clients to align their business with Timely Trucking’s services and scheduling automatically. The business will be managed by Jim Kerrigan, CEO, and a Chief Operating Officer.
Timely Trucking can be launched for about $700,000, largely with the investment of Jim Kerrigan, and with some investment by investing partners. The business will be launched with three 18-wheeler trucks and will expand its operations to utilize eight 18-wheelers by the end of its third year, using auto loans to finance this expansion. Gross margins will be around 60%, allowing for significant profit by the end of the third year as the business scales up.
Beyond three years, the business will seek to expand to additional bases of operation in the Northwest and to add trucks with refrigerated and temperature-controlled trailers. The business will be positioned for sale to a national freight-hauling service seeking to expand to, or add operations in, the Northwest.
Objectives
Timely Trucking intends to serve businesses in the Northwest United States (Washington, Oregon, Idaho, Montana, and Wyoming) with truck-based distribution services.
Over the first three years of operations, Timely Trucking will seek to meet the following objectives:
- Establish bases in Seattle, Spokane, Portland, Cheyenne, Boise, and Billings
- Purchase 8 18-wheeler trucks with dry van trailers
- Hire 10 full-time truck drivers
- Achieve strong annual revenue based on 1.2 million miles of hauling in the third year
Mission
Timely Trucking will simplify distribution of goods for Northwestern businesses, becoming their partner in operating efficiently and reliably. Timely Trucking will use management of logistics, on-time, accurate deliveries from destination to destination in the Northwest, and partnerships with distribution centers and warehousing businesses to achieve its goals.
Keys to Success
The keys to success in the trucking business are:
- Robust communication systems between drivers, bases, and clients
- Setting delivery schedules that can be met (i.e. setting the right expectations)
- Hiring and retaining reliable, safe drivers
- Understanding what clients are trying to achieve, and helping them find the right distribution solution to create long-term relationships
Company Summary
Timely Trucking, a startup truck company headquartered in Portland, Oregon, will provide trucking and logistics management solutions for business clients in the Northwestern states of Oregon, Washington, Idaho, Montana, and Wyoming. Beginning with operations in Washington and Oregon, the business will haul freight from suppliers to manufacturers to distributors and retailers, operating in partnership with distribution centers, warehouses, and wholesalers.
Company Ownership
Timely Trucking was founded by Jim Kerrigan, a previous owner of a warehousing business which he successfully exited from after fifteen years of management. Timely Trucking has been established as a sole proprietorship during its pre-launch phase, but will be reclassified as a limited liability company to take on partners. Kerrigan will share ownership with outside investors, giving 20% of shares to investors.
Start-up Summary
The start-up expenses include some of the basic set-up costs for the Timely Trucking office – stationery (business cards and letterhead), rent for the office and a large adjacent parking lot for two month’s rent and one month’s security at $4,000 per month, and computer equipment. Marketing expenses include brochures and website development (see website plan for more details). Other expenses include legal consultation fees to ensure that all precautions are taken to limit the risk of the business and to establish templates for client and partner agreements, insurance premiums for the first year of operation to cover liability associated with the service, the office, and the trucks, and licenses and permits for the business. These include Fuel Tax Reporting, USDOT numbers, 2290’s, IRP tags, MC numbers, and IFTA decals.
Cash required will be used to fund the months of operation before cash flow break even is achieved and to allow for adequate cash reserves to reduce the risk of running low on cash if targets are not met. Other current assets include office supplies, software for accounting, scheduling, and resource management and light equipment. Long-term assets include three new 18-wheelers, estimated at $150,000 each (approximately $120,000 for the cab and $30,000 for the trailer). The business will purchase new in order to better ensure that deliveries are made on time and that the usual risks of aging equipment are avoided. $75,000 is budgeted for three fork lifts estimated at $25,000 each, one per truck. An additional $25,000 is budgeted for long-term assets including repair equipment and tools which it is cost-effective to own in-house, satellite-tracking equipment for each truck, and office furniture.
While some trucking businesses hire owner-operators of trucks, Timely Trucking will maintain greater control over the service it offers by owning the trucks, ensuring that it always lives up to its name.

Services
Timely Trucking will offer the following services for businesses in the Northwest:
- Pick-up and delivery of goods with a minimum per-delivery weight of 20,000 lbs from and to locations in its geographic range by 18-wheeler trucks hauling dry van trailers
- Both “less than a truck load” and “truck load” services
- Online tracking information detailing the location of all GPS-tagged trucks and the status of deliveries, including expected arrival times for pick-up or delivery
- Phone support for all customer questions, delivery changes, and scheduling
- Preferred client services including online accounts, regular schedules of shipping, or linking of client order information directly to Timely Trucking’s scheduling software to allow for seamless logistics
To maintain its competitiveness in its core services, Timely Trucking will NOT offer:
- Storage or warehousing of goods awaiting delivery (goods can remain in storage in trucks for short periods, but at relatively high cost to customers)
- Packaging and crating
- Flat bed hauling
In the future, Timely Trucking will add the following services:
- Temperature-controlled shipping to expand the range of customers Timely can appeal to
Trucks are operated by qualified and well-trained drivers with spotless records. Drivers are safety trained and re-tested for knowledge of laws as they change. A dedicated suite of software and communication systems will allow for the logistical management mentioned above.
Market Analysis Summary
The American commercial trucking industry serves as a key link between raw material suppliers, manufacturers, wholesalers, distributors, and retailers in most industries. According to the American Trucking Association, the industry includes dry van, flatbed, refrigerated and bulk/tank trucking over short-haul (up to 100 miles), medium-haul (100 to 250 miles), and long-haul (250 miles and up).
Timely Trucking will compete in the market for medium and long haul dry van trucking in the American Northwest. This market serves businesses ranging from the packaged goods/grocery industry to the clothing industry to high-tech equipment, as well as commercial relocations.
Customers which require frequent dry van shipping generally have the appropriate-sized loading dock for the standard 9′ high, 8′ 6″ wide, 53′ length dry van cargo area.

Market Segmentation
The market analysis table covers likely market segments within the five states which Timely Trucking will serve.
Raw Material Suppliers ship large quantities of materials to large manufacturers in the northwestern states. These materials generally do not require refrigeration or temperature control. Manufacturers maintain some on-site storage for these supplies and generally have some leeway as to when deliveries can be received, except when projections are mistaken and supplies drop low. Packaging supplies also must be shipped to manufacturers and are included in this group.
Manufacturers often outsource the distribution of their goods to businesses that specialize in serving one the type of retailer or business. Their packaged goods are often shipped to only one wholesaler/distributor, creating a regular business in shipping between the two locations.
Wholesalers/Distributors that serve large retailers assemble truckloads of goods from the many manufacturers they serve. While they often have their own trucks or distribution means, some of these firms do not either because they are smaller or because they attempt to limit their investment in assets. Others may require additional trucking support when they are operating at capacity but not prepared to expand their shipping capacity.

Target Market Segment Strategy
Timely Trucking will begin by focusing specifically on the segment of manufacturers in Washington and Oregon states, expanding after the first year to the entire intended five state region. By serving manufacturers, Timely Trucking can provide an affordable shipping solution for new and growing manufacturers over purchasing their own trucks.
Raw material suppliers sometimes require flatbed or bulk/tank trucking which will not be an initial service offered by Timely Trucking and wholesalers often have their own trucks. These segments are expected to yield some customers, but by focusing first on the middle of the supply chain with manufacturers, Timely Trucking will be introduced to suppliers and distributors who may require their services without having to engage in full marketing campaigns to these segments.
Service Business Analysis
Hoovers reports that:
- The U.S. trucking industry includes about 110,000 for-hire carriers and 350,000 independent owner-operators
- Total industry revenue is nearly $200 billion
- Major players in the industry include YRC Worldwide, Swift Transportation, JB Hunt, and Con-way
- The industry is fragmented, with the 50 largest companies accounting for less than 30% of the market
The industry includes carriers that use commercial motor vehicles and doesn’t include couriers like UPS and FedEx or private carriers (companies that transport their own products and raw materials).
Hoover’s writes that “demand is driven by consumer spending and manufacturing output. The profitability of individual companies depends on efficient operations. Large companies have advantages in account relationships, bulk fuel purchasing, fleet size, and access to drivers. Small operations can compete effectively by providing quick turnaround, serving a local market, or transporting unusually sized goods. Average annual revenue per employee is $135,000.”
The industry is broken into “truckload (TL) shipments that dedicate trailers to a single shipper’s cargo” and “less-than-truckload (LTL) shipments, which transport the consolidated cargo of several shippers on one truck, dropping off goods at multiple delivery points”.
Competition and Buying Patterns
In addition to competing with other trucking companies, including national carriers, Timely Trucking will compete with rail and air cargo transportation. However, for the distances it intends to travel, and due to the few rail lines over the northwestern states, trucking is at an advantage.
Shippers choose between trucking companies based on:
- Their track record of on-time and accurate deliveries
- Their price
- Their ability to partner with the shipper to offer logistics expertise and added services.
Web Plan Summary
The Timely Trucking website will serve as a source of basic information for those who find it via Internet searches, as well as a sophisticated account management portal for clients. For potential clients, the website will serve as a deeper explanation of the services and background of the company than a brochure or advertisement can provide. Specific calls to action on the website will ask users to call to speak to a salesperson or to fill in a form with their basic information and a good time to speak with them, so that a salesperson can contact them. Even one-time clients will be able to access up-to-date information about the ETA and current location of their deliveries. Clients who subscribe to preferred services will have access to more advanced information and functions.
Website Marketing Strategy
Timely Trucking will utilize the following means to promote its website as a marketing tool:
- Initial and ongoing search engine optimization by the Web developer and then by an SEO firm
- Google Adwords campaign which can be reduced or defunded if organic search rankings are high enough
- Profiles and listings on ten business and trucking company online databases
- Mention of the website URL in all brochures and advertisements
Development Requirements
The website’s components will have the following requirements:
Front End
- Homepage – Mirroring a basic brochure about Timely Trucking
- About Us – Background on the partners, mission, and basics of the business
- Contact – Form to submit information and phone number to reach a salesperson during business hours
- Services – Deeper description of the service options along with images of the trucks and a map of the area served>
Delivery Tracking
- Form – To enter delivery code which was designated for the delivery
- Map – Shows current location of the delivery on a map
- Statistics – Gives ETA, minutes late or ahead of schedule, status of pick-up or drop-off, other notes about the order
Account Management
- Login – Login form for client username and password
- Account Profile – Basic client information, settings related to interface between client systems and Timely Trucking if direct links have been established
- Scheduling – Calendar on which pickups and deliveries can be scheduled and rescheduled
- Alerts – Settings for email or text alerts about deliveries which can be sent to client
Back End
- Database Entry – Ability to search within and make changes and edits to the client and scheduling information in the database
- Billing Interface – Website sends billing information for completed jobs directly to accounting software for bill creation
The website will be developed over a three month period and will require $20,000. Many elements can be adapted from off-the-shelf or open source software, but others must be developed from scratch to interface between client software and the Timely Trucking database.
Strategy and Implementation Summary
Timely Trucking will focus its strategy on the following areas:
- Establishing a strong software/Web component to its business to drive adoption of its preferred client services
- Building and maintaining its on-time reputation to command revenue per mile slightly over the industry average
- Targeting manufacturers in Oregon and Washington in the first wave of marketing as the segment most in need of Timely Trucking’s services
Competitive Edge
Timely Trucking will establish a competitive edge through its dogged focus on on-time deliveries for its specific target market. Software systems, communication systems, operational choices and marketing materials will all be oriented around this goal. By making customers more assured of on-time delivery with Timely Trucking than with competitors, they will be more likely to use the business overall, as they can never be sure when a few hours can make an incredible difference to their potential revenues or expenses.
Marketing Strategy
Timely Trucking will attempt to rapidly achieve awareness in Oregon and Washington states about its business in the first year, followed with awareness in Idaho, Wyoming, and Montana in future years. It will seek to position itself not as the most inexpensive carrier, but as a carrier with the best on-time record coupled with advanced systems to help clients manage their logistics better. Smaller businesses may feel more comfortable working with a smaller carrier as they fear being lost in the shuffle by bigger carriers who also handle huge accounts.
- Building a website with visibility on search engines and in databases of trucking companies (see Web plan)
- Creating a compelling brochure of Timely Trucking services which will be distributed through direct mail, and kept in stock for networking events
- Exhibiting at Northwestern business service conferences, especially for sectors of the manufacturing industry
- Advertisements in trade publications
- Public relations efforts including press releases related to the business launch and its unique preferred client account management package
Sales Strategy
Jim Kerrigan will manage sales for the business, making appointments with and traveling to client businesses in the region when necessary to establish relationships based on an understanding of the client’s needs for shipping. Kerrigan will prospect from a list of manufacturer businesses in the region, starting with small and new businesses which may not have established a long-term relationship with a carrier yet.
Sales Forecast
The cost of sales listed here for per-mile shipping is approximately 25% for fuel based on the estimated 10 mpg for loaded trucks, and another 25% for truck driver labor hours that can be assigned to the jobs based on $16/hour rate. Cost of sales for preferred accounts is much smaller as it consists only of set-up and maintenance labor for hourly operators.
Preferred client accounts are paid for once a year and a 90% retention rate is projected.


Milestones
The milestones table covers the early marketing activities described in the marketing strategy summary. The first two milestones (website and brochure) are budgeted under start-up expenses and the remainder are budgeted under the first year marketing budget for operations.

Management Summary
Jim Kerrigan, CEO, will manage the strategic direction, sales and marketing of Timely Trucking. He developed experience in all of these areas through work in his previous warehousing business, which he launched and successfully sold after fifteen years of operation.
The Chief Operating Officer position will be filled by a partner who will be granted up to 10% of shares in the business after meeting certain milestones. Additional shares will be granted if the COO contributes capital to the business. The COO will manage operations, finances, human resources, and procurement.
The business will require additional personnel including an administrator/dispatch center operator and a sales/marketing support associate. These individuals will be managed by the COO and the CEO, respectively. Three part-time truck drivers will be hired initially.
Personnel Plan
Truck driver salary listed here covers only wages paid which are not directly attributable to client jobs. This includes training, repair work, returns from deliveries, and other required driving with empty trucks. It is expected that this will be less than 20% of driver wages. Truck drivers will grow from three part-time at launch to four full-time by the end of year 1, eight full-time by the end of year 2, and 10 full-time by the end of year 3. There will be more full-time truck drivers than trucks as the business will attempt to utilize the capacity of the trucks at least 60 hours per week and will limit overtime of drivers.
The sales/marketing associate will be hired in the fourth month after the CEO has directly executed all sales and marketing operations for the first three months.
Financial Plan
Timely Trucking will establish its business with three trucks and a launch financed by the owner and investor’s equity. Starting debt-free will enable the business to take on debt once it has established cash flows to purchase additional trucks over the first three years. Profits will swing positive in the second year after a loss in the first year.
After the first three years, the business can sustain growth of at least three additional trucks per year, and begin to add additional bases of operation throughout the region so that truck drivers who do not live in the Portland area can be hired and trucks do not have to return to this base after all jobs.
Dividends will not be paid out, as cash will be used in the business to prepare for expansion to additional offices and purchase equipment on better terms going forward. After five years of operation, the business will seek a strategic sale to a national freight trucking operator for which Timely Trucking’s geographic and technological focus will be a good match.
Start-up Funding
Jim Kerrigan will provide the majority of start-up funding out of savings from the sale of his previous business. Additional investment will be from investing partners who will be granted 20% of shares in the business for their investment.
Important Assumptions
The business assumes the cost of fuel at an average of the past two years, slightly higher than today’s fuel prices. This is considered a conservative estimate as it is possible that fuel will stay below this number during at least part of the start-up phase. However, if fuel becomes significantly more expensive, the gross margins of the business will drop.
Break-even Analysis
The break even point is shown in the table and chart, below.

Projected Profit and Loss
Major expenses include:
- Payroll: Covers the management, staff, and truck driver wages (when not directly attributed to jobs)
- Marketing/Promotion: Projected higher in the first year and then dropping due to extra marketing devoted to the launch and the weaning off of search engine marketing over time
- Depreciation: Reflects the growing investment in trucks and equipment over the years. Trucks are depreciated on a 10 year straight-line schedule. The depreciation is $1,250 per month per truck or $1,458 per month including the additional equipment purchased with each truck. The business will grow from four trucks at the end of year 1 to six at the end of year 2 to eight at the end of year 3.
- Truck Maintenance/Repair: Estimated at $200 per month per truck to start and rising to $225 in year 3 due to aging of some of the first trucks purchased.
- Rent & Utilities: Projected to rise slightly due to inflationary increases
- Insurance: Will grow with the number of trucks and size of operations
- Payroll Taxes: Applied to payroll as listed and half of the direct cost of sales (truck driver wages)
- Licensing and Permitting: Include ongoing renewals of licenses and additional licenses for new trucks as they are purchased
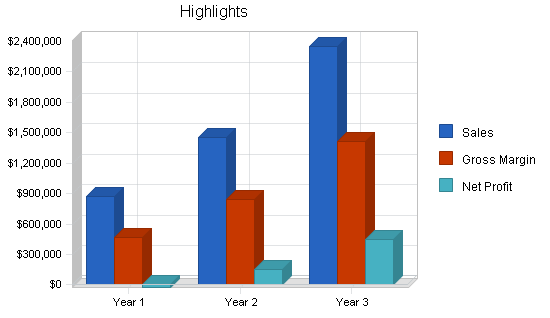
The business expects a net loss in the first year as operations and sales scale up appropriately. Net profits will begin in the second year.


Projected Cash Flow
Purchases of new trucks will be made with 3 year loans for 90% of the purchase price. The remaining $25,000 plus $25,000 in additional equipment (forklift, etc) for each purchase will be made in cash. Payments on these loans will be $3,750 per month, per truck loan for the life of the loans.
One additional truck will be purchased in the first year with a loan, two in the second year, and two in the third year.

Projected Balance Sheet
The balance sheet illustrates the launch of the business on equity financing and augmented by safe debt over its first three years of operation to purchase additional trucks. This will allow cash and assets, as well as net worth, to continue to grow.
Retained earnings will be negative due to the loss sustained in the first year of operation and the start-up phase, but will move closer to positive in the third year after a profitable second year.
Business Ratios
The ratios of the business are compared to General Freight/Long-Distance Trucking for businesses of $1 million to $5 million in revenues.
Valuation
The valuation of the business after three years is estimated at an average between two methods of valuation, based on an earnings multiple and based on a sales multiple. Both methods yield similar results. The average valuation is $4.53 million.
Investors will be given 20% of shares for their capital contribution. Kerrigan will be given 46% for his capital contribution and 34% for his contribution as founder. Investors will see a 63% internal rate of return based on this valuation.
The market value of the business will be determined after five years, when the business is best poised for sale. The valuation of the business is expected to be between $10 and $15 million for a strategic sale to a national trucking operator at that point.

