
Hair Recycling Technologies
Executive Summary
Hair Recycling Technologies’ (HRT) area of business will be to: collect, sanitize, and market human hair to be used as a consumer good. Our recycled hair products will be targeted toward the home gardener who will benefit from hair’s numerous elemental characteristics and its strong human scent.
The consumer will gain due to our product’s ability to encourage healthy plant life and deter unwanted pests and animals. Hair Recycling Technologies will initially manufacture three products: SMART SOIL hair fertilizer, HARE AWAY pest deterrent, and an organic plant food specifically for rose bushes.
Hair Recycling Technologies is entering a niche market since human hair has never been marketed before to be used in this manner. The founders of the business believe this to be a unique and viable concept that reaches an untapped and high growth market. Due to these factors, this venture has exciting possibilities due to its high potential and unique, innovative nature.
One of the most attractive aspects of this business is that investors will be paid back within one year and the company will still maintain a positive cash position. The business is expected to break-even in month nine of the first year.
Our in-depth research pertaining to human hair’s positive elemental characteristics and its many potential uses is well advanced. Even though this research will be an ongoing process for the company, initial results have been shown to be positive.
The Horticulture Department at the University of Georgia has shown interest in this concept and HRT plans to work with the department to research and test the use of human hair as a plant growth promoter. In addition, nurseries in the South Bend market have shown strong interest in carrying our product upon its release.
1.1 Keys to Success
Hair clippings have long been a useless waste problem for businesses engaged in the operation of barber shops and beauty salons. In metropolitan areas that handle large amounts of waste, human hair is often disposed in volume at municipal landfills. Driven by state and federal mandates, recycling and composting of municipal solid waste have increased dramatically during the past decade. There were more than 9,000 curbside recycling programs in America in 1997, and 12,000 drop-off centers for recyclable material. The EPA established a target-recycling goal of 35 percent by the year 2005, while maintaining the per capita generation of solid waste at 4.3 pounds per person per day. This presents an opportunity to recycle a landfill bound waste and give the consumer the opportunity to benefit from the many positive properties that hair can provide.
Our research has shown that clippings of human hair contain an extremely high nutrient value which, when utilized and mixed with potting soil, will produce a higher quality plant food and soil enhancer than what is currently on the market.
Human hair, in common with wool, silk, and other organic materials, has a very high nitrogen content, and in the soil, nitrogen encourages tissue growth. If the sweepings from a barber shop were regularly applied to a compost heap, an enormous amount of nitrogen could be recovered. Six to seven pounds of human hair contain approximately one pound of nitrogen, as much as found in 100 to 200 pounds of manure. What’s more, hair will disintegrate as easily as feathers, as long as it is kept in a well-moistened compost heap.
Experiments with 32 varieties of roses by William Stafford, of Austin Texas, indicate that human hair used around the roots of bushes produces longer stems, larger buds, and deeper color tones. Stafford experimented with hair at the base of plants and found it accelerated growth, though slowly, since it took many months for the hair to decay. Stafford produced a plant recipe for his experiments, which HRT will reproduce. No patents are registered for Stafford’s rose food recipe.
1.2 Mission
Hair Recycling Technologies intends to provide the consumer with a recyclable resource so that they may benefit from human hair’s many properties and organic elements. In addition, we hope to give the consumer a positive feeling about recycling and the Earth’s environment.
1.3 Objectives
The concept of recycling human hair to be used as a plant food, soil enhancer, and animal deterrent is unique and innovative to the plant and gardening industry. We feel that introducing this product to the marketplace will be successful due to its unique factor and the many positive characteristics that human hair can provide to the gardener. The consumer will find this to be a compelling product not only because it is organic, and thus in growing demand, but also due to its marketable benefits.
Company Summary
The legal name of the company will be established as Hair Recycling Technologies, Inc. Hair Recycling Technologies will be formed as a Sub-chapter S Corporation in the state of Delaware under the category “For Domestic Profit.”
Due to its tax benefits, an S-chapter Corporation will be advantageous since early phase start-up costs will be incurred by the founders. Delaware will be the place of incorporation due to its temperate legal requirements and pro-business environment.
2.1 Start-up Summary
A team consisting of six talented individuals has been formed. Of the four people who make up the company staff, all are the original founders of the company and its concept.
These individuals are the following:
- President and CEO: K. Justin Luber.
- Vice-president of operations/finance: Jason Mysliwec.
- Financial advisor: Hunter Korth.
- Marketing advisor: Robin Liu.

| Start-up Funding | |
| Start-up Expenses to Fund | $2,550 |
| Start-up Assets to Fund | $91,450 |
| Total Funding Required | $94,000 |
| Assets | |
| Non-cash Assets from Start-up | $14,829 |
| Cash Requirements from Start-up | $76,621 |
| Additional Cash Raised | $0 |
| Cash Balance on Starting Date | $76,621 |
| Total Assets | $91,450 |
| Liabilities and Capital | |
| Liabilities | |
| Current Borrowing | $0 |
| Long-term Liabilities | $60,000 |
| Accounts Payable (Outstanding Bills) | $0 |
| Other Current Liabilities (interest-free) | $0 |
| Total Liabilities | $60,000 |
| Capital | |
| Planned Investment | |
| Investor 1 | $10,000 |
| Investor 2 | $8,000 |
| Investor 3 | $16,000 |
| Additional Investment Requirement | $0 |
| Total Planned Investment | $34,000 |
| Loss at Start-up (Start-up Expenses) | ($2,550) |
| Total Capital | $31,450 |
| Total Capital and Liabilities | $91,450 |
| Total Funding | $94,000 |
| Start-up | |
| Requirements | |
| Start-up Expenses | |
| Legal | $200 |
| Stationery etc. | $150 |
| Brochures | $200 |
| Insurance | $200 |
| Rent | $600 |
| Utilities | $200 |
| Other | $1,000 |
| Total Start-up Expenses | $2,550 |
| Start-up Assets | |
| Cash Required | $76,621 |
| Start-up Inventory | $5,729 |
| Other Current Assets | $0 |
| Long-term Assets | $9,100 |
| Total Assets | $91,450 |
| Total Requirements | $94,000 |
2.2 Company Locations and Facilities
Hair Recycling Technologies will begin its initial operations in South Bend, IN. A suitable location has been obtained in the basement of one of the founders. When capacity is exhausted due to growth, the operations will be moved and based in a larger facility in South Bend, IN.
2.3 Government Regulations
Because Hair Recycling Technologies recycles a waste product and incorporates it into an environmental product, the company is under the potential jurisdiction of the Environmental Protection Agency. The manufacture and sale of human hair is not currently regulated or enforced by either federal or state authorities. According to the Environmental Protection Agency, there are “no current restrictions on human hair.” Currently since the sale of human hair does not fall under any federal or state law regulations, we will not need to file with the Environmental Protection Agency.
Hair Recycling Technologies will obtain all required federal and state permits and licenses to operate its facilities. There can be no assurance that HRT’s operation and profitability will not be subject to future restrictive regulations or increased taxation by federal, state, or local agencies.
Products
Hair Recycling Technologies will be the market leader as the first company of its type to collect, sanitize, and recycle human hair to be used as a plant food, a soil enhancer, and as an animal and pet deterrent. HRT realizes that consumers today are more conscious of recycling and of their environment. Because of this trend, consumers are moving away from traditional chemical based plant products to more natural organic plant materials.

3.1 Product Description
Hair is readily available at extremely low collection costs as the average major metropolitan area throws away approximately five tons monthly. A certain barbershop owner in Austin, TX illustrates: In one shop open five days per week, eight hours per day, employing three barbers, with 10 minutes waiting time between customers, the yield at 250 haircuts per week is approximately 2.5 lbs. per week or approximately 11 pounds per month (approximately 1,083 people).
In large metropolitan areas, if one half of the population receives a haircut each month, then one million people produce 10,000 lbs. of hair per month. One pound of hair per 100 lbs. of soil effectively feeds and maintains 33 potted plants equal to the size of a three feet tomato plant. Thus, 10,000 lbs. of hair should produce 1,000,000 lbs. of fertile nitrogen enriched soil, enough to support over 30,000 bushels of produce, all from one month’s collections of unused waste.
Hair Recycling Technologies will pick up the hair in the Midwest market and will take it to our facility for processing.
3.2 Sales Literature
Hair Recycling Technologies will aggressively enter the gardening market from South Bend, IN. We will begin by collecting the hair in the Midwest and will sell to Midwest nurseries and specialty stores. HRT will remain based in South Bend, IN until strong sustained growth allows us to penetrate the national market. We will then gradually move our operations to a larger facility in South Bend. Since the supply of hair is so critical to the success of our business, we will obtain contracts from our suppliers. In addition, HRT intends to work on a contract with the U.S. Army and other branches of the U.S. military to supply HRT with hair.
As our market share increases and growth allows, HRT will open facilities in other regions such as the Northwest, which is open to environmental products. As HRT grows, we will build on a national scale both collecting hair and distributing products nationwide. After HRT proves to be the market leader, maintaining sustainable growth, we will take advantage of free publicity since our products’ unique and innovative structures will attract many inquisitive parties.
Competitive Comparison
Hair Recycling Technologies is a company dedicated to the recycling concepts of our society and providing organic products, which completely satisfies our customers. All of our products will be composed of human hair that will be gathered from suppliers in the Midwest.
The hair we collect will be marketed in two basic forms. First, the hair will be sanitized and mixed with other organic elements to form a superior soil enhancer and plant food. Secondly, the hair will be packaged alone to be sold as an animal deterrent.
Our soil enhancer/plant food will consist of human hair, organic elements, and potting soil. What is a soil enhancer? A soil enhancer is an organic based mixture that can be used in place of, or mixed with, the existing potting soil to increase the soil’s nitrogen content and enhance the nutrients present in the soil. Our enhancer is similar to fertilizers; however, it reacts differently from most fertilizers. Our enhancer is time released and will last over a long period of time, on average two to three months. The chemical reaction in present fertilizers takes place immediately and usually lasts no longer than three to four weeks. After three to four weeks, the customer must buy more fertilizer, costing both time and money.
Our animal deterrent consists of only sanitized hair. The strong human scent in hair, as shown by research, is what keeps the animals away. Not only does it deter animals, but it has the benefit of adding nutrients for soil feeding. The customer simply places the hair around the vegetation and the work is done. Our soil enhancer, of course may be used as an animal deterrent as well. However, our separately packaged deterrent product will contain a strong mix of human hair and can be placed in strategic locations where it would face the animal head on.
4.1 Initial Product Line
HRT’s goal is to carry many products in its line. However, initially the company will introduce three specific products: SMART SOIL, HARE AWAY, and Rose Food.
4.1.1 Smart Soil
The first product will be a soil enhancer/plant food, which we will call SMART SOIL. The SMART SOIL name was chosen because the name describes our product and its advantages. SMART SOIL is a superior enhancer because the hair in our mixture slowly releases its nutrients over a longer period of time than other organic products currently on the market. All the consumer needs to do is spread the mix in with their plants and SMART SOIL goes to work. The product alleviates the hassle of having to constantly fertilize the plants, so hence the name SMART SOIL.
The advantage of our product with respect to other organic soil enhancers currently on the market is that it uses an ingredient that is new and unique to the organic soil market. Human hair is 97% protein and contains 27 trace elements: The chemical constituents are as follows:
| Carbon | 50% |
| Oxygen | 12% |
| Nitrogen | 18% |
| Hydrogen | 07% |
| Sulfur | 04% |
| Total | 100% |
SMART SOIL will be an organic mix containing potting soil, recycled sanitized human hair, and other organic elements such as cottonseed meal and peat moss. SMART SOIL will be packaged in a plastic 3-pound bag.
SMART SOIL will be introduced as a soil enhancer and not as a fertilizer, due to strict EPA restrictions regarding listing product contents for fertilizers such as the amounts of Nitrogen, Potassium, and Potash. We feel that initially we can save money by labeling our product as a soil enhancer, thus avoiding an extra expense for lab work on our product. As the company and resources grows, we will introduce SMART SOIL as a fertilizer to compete in the fertilizer market and generate additional revenue.
4.1.2 Hare Away
The second product that HRT will carry is packaged recycled sanitized human hair. This product will be called HARE AWAY. It will be marketed specifically toward consumers who are having problems with animals such as deer and rabbits entering their garden. Because our simple sanitizing process will not eliminate the human smell contained on the hair follicle, HARE AWAY will be useful to deter animals and pests. The human hair in HARE AWAY will be chopped and shredded to very short lengths. This will improve its solvency as a nutrient, and make it more aesthetically pleasing to the buyer.
HARE AWAY will be sanitized and packaged in two different forms. First, it will be sold in a recycled, clear plastic bag containing a header label on the top describing the product and its beneficial uses. Secondly, the hair will be placed in a stocking type material and sold in a plastic packaging. This product will be for consumers who desire to hang the stocking from a tree or post near or around the garden. This will allow consumers to strategically place our product in areas that will keep animals at a distance from their garden.
4.1.3 Rose Food
The third product HRT will introduce will be a rose food. As discussed earlier, HRT will reproduce the recipe by William Stafford of Austin, Texas to market towards avid rose gardeners. The rose food will be introduced in three months from the start of operations. The delay will be due to the time it takes to compost the ingredients in our product. The recipe is as follows:
William Stafford’s Hair Recipe:
(Enough for 50 rose bushes.)
- 10 pounds of hair clippings (should be clipped to 3/4 in lengths to prevent matting).
- 20 pounds of cottonseed meal to help hold moisture and encourage rotting.
- 1 1/2 yards of leaf mold.
Mix the dry ingredients together; then wet down well. Keep in a compost pit 30 to 60 days, turning it until it is all rotted, then put about three quarts around each bush. Water frequently the first ten days and keep watering until results show.
Hair used alone will produce similar results, although at longer duration. Spread the hair around the surface as a mulch and water until it decays. Keep the hair on the surface since it is a good insulator for the roots of all tender plants in the severe cold.
William Stafford has many blue ribbons as proof it helps roses bloom longer in the winter.
Each of these products and all future products will be registered with the U.S. Trademark Department and will have the recycled label on the package to show the consumer that they are buying a recycled product. William Stafford’s hair recipe has no current copyrights or patents.
4.2 Future Products
Future products that HRT is looking forward to producing are the following:
Chemical conversion of human hair to be used as a food additive. The food industry commonly uses a food ingredient called L-cysteine Hydrochloride (HCL). The additive can be produced in two ways: synthetically, from non-organic bases such as petroleum or directly from human hair. It can be cheaper to use human hair, which contains up to 8 percent of the natural amino acid cysteine. Cysteine is used as a flavoring and a dough enhancer, but by the time it reaches our pizzas and snacks, the hair has been thoroughly processed and reduced to its chemical constituents. Currently, the supply of hair that is collected, cleaned, processed, and then chemically converted into L-cysteine is solely done in Far East factories.
SMART SOIL fertilizer, similar to our soil enhancer however, marketed as a fertilizer containing additional organic elements. Plant spikes similar to what is currently on the market, but will be manufactured with our human hair formula. A gardening kit marketed toward the pre-teen gardener to help them gain a better appreciation for his/her environment. Resale of hair to wig manufacturers who use real hair for its wigs. In addition, HRT will be researching the benefits of using animal hair in future products.
Market Analysis Summary
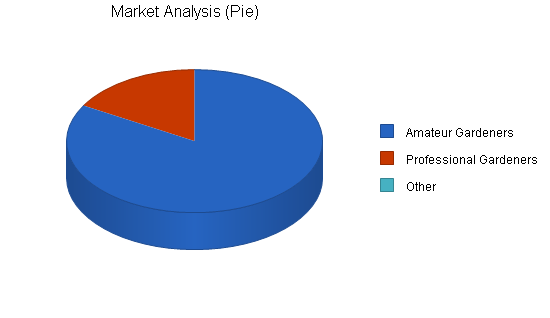
Customers who will benefit from HRT’s products range from amateur plant lovers to professional gardeners. HRT will focus on two market segments in the local area.
Amateur plant lovers consist of hobbyists, houseplant enthusiasts, first-time gardeners, weekend gardeners, and other plant growers. HRT defines this group as amateurs because their goal is to grow plants for the reason of enjoyment or as an entertaining hobby and not for reasons of competition or profit.
Professional gardeners include those who grow plants to be judged in gardening competitions and those who are organic food growers in the organic produce market. Professional gardeners are very serious about their plant-growing methods because they are motivated by goals of winning competitions or earning profits.
These amateur and professional gardeners make up the general customer base of HRT. However, HRT has a more specifically targeted customer in mind. A significant number of these amateurs and professionals are members in one or more of the 150+ organic gardening clubs that have been organized throughout the United States. HRT intends to target its customers as those who would use purely organic plant foods as an aid to their plant growing. The following chart offers a more detailed description of HRT’s customers.
| Market Analysis | |||||||
| Year 1 | Year 2 | Year 3 | Year 4 | Year 5 | |||
| Potential Customers | Growth | CAGR | |||||
| Amateur Gardeners | 3% | 20,000,000 | 20,500,000 | 21,012,500 | 21,537,813 | 22,076,258 | 2.50% |
| Professional Gardeners | 2% | 4,000,000 | 4,080,000 | 4,161,600 | 4,244,832 | 4,329,729 | 2.00% |
| Other | 0% | 0 | 0 | 0 | 0 | 0 | 0.00% |
| Total | 2.42% | 24,000,000 | 24,580,000 | 25,174,100 | 25,782,645 | 26,405,987 | 2.42% |
5.1 Target Market Segment Strategy
To specifically target our customers, we examined the market trends. Hair Recycling Technologies’ products are targeted at the garden and indoor segments with a specific aim at the organic segment. It is estimated that in the next five years, organic gardening products could capture 25 percent of the billion-dollar U.S. lawn and garden market. “Organic gardening is clearly in and chemical addiction is out,” says Lucy Warren, a San Diego-based garden historian and industry expert.
To what can we attribute this market growth? Research has shown that people are becoming increasingly aware of the problems that chemicals pose to the foods we eat and to the environment. A recent article states: The bloom clearly is off chemically dependent gardening. A Harris Poll indicates more than 60 percent of America’s home gardeners used at least one organic method, such as mulching, composting, or beneficial insects during the last year. And more than a third of gardeners, 37 percent, in the poll said they use primarily organic methods.
The “Gardening in America ‘95” poll, commissioned by the Rodale Press, found that only one in five U.S. gardeners admitted to not having used a single organic method over the last 12 months. The reality is clear: organic is here to stay.
Supporting this is the fact that sales of organic foods have risen dramatically over the past decade, totaling $1.4 billion in 1992, according to the most recent figures. And the organic food market continues to grow at an average rate of 25 percent a year, according to the Organic Food Production Association of North America.
The Encyclopedia of Organic Gardening applauds the use of organics instead of chemicals. It states: The organic school does not accept the use of artificial fertilizers for many reasons…Chemical fertilizers are quick-acting, short-term plant “boosters” and are responsible for:
- Creating hardpan soil.
- Destruction of beneficial soil life.
- Altering vitamin and protein contents of certain crops.
- Making certain crops more vulnerable to disease.
- Preventing plants from absorbing some needed minerals.
The following list describes the positive effects of organic fertilizers and the negative effects of chemicals, and thus exhibits the advantages of using organic fertilizers instead of chemicals.
- Organic Fertilizers: Replenish the soil. Keep soil friable. Promote beneficial soil life. Prevent hardpan soil conditions. Increase crop yields. Maintain a natural balance in the soil. Protect certain crops from disease. Benefit the environment by recycling wastes. Grow larger plants. Are easy to use. Are safe.
- Chemical Fertilizers: Pollute the nation’s lakes, rivers, and streams. Increase the infant mortality rate among female babies. Destroy beneficial soil life, including earthworms. Alter vitamin and protein contents of certain crops. Make certain crops vulnerable to disease. Prevent some plants from absorbing needed minerals. Produce foods that just do not taste as good. Are a leading cause of blindness on the farm. Are corrosive to farm equipment and storage areas. Deteriorate soil friability. Create hardpan soil. Are costly.
Further research indicates that organics are the “up-and-coming” products in the plant food market: “Organic gardeners are the long-term market. Retail sales for gardening centers are flat except for organic supplies and fertilizers,” says Mike McGrath, editor-in-chief of Organic Gardening Magazine.
Market trends indicate that the customer needs an organic product that works as well as or better than competitive chemical products. The product should be priced against competing chemical and organic lines and should be easy to use, environmentally safe, and have superior performance. HRT can specifically target customers who are environmentally and health conscious, and also those who just want a product that works better than the rest for a competitive price.
5.2 Industry Analysis
There are a number of companies in the fertilizer market that offer soil enhancers and plant foods. These companies compete mainly on the basis of price, time between applications, and promises of performance. However, market trends indicate that new competition exists between chemical and organic products and the inherent positive and negative effects of these differing formulas in soil enhancers and plant foods. HRT’s competition can be divided into two forms: direct and indirect.
5.2.1 Main Competitors
All of the prices are based on cost and a standard markup is used. Hair Recycling Technologies prices will be competitive with other chemical and organic fertilizers.
Plant Foods:
- Miracle Gro All Purpose $5.93 (48 oz.).
- Shultz’s Starter Plus $6.64 (40 oz.).
- Plantation Products Potting Mix $7.97 (40 oz.).
- Organica Plant Growth Activator $18.43 (16 oz.).
Animal Deterrents:
- Heneder Spray $11.99 (1 qt.).
- Blood Meal $4.99 (3 lbs.).
- Hair Today Gone Tomorrow $13.84 (pint).
- Liquid Fence Animal Repellant $29.95 (32 oz.).
- Bobex Deer Repellant $19.95 (32 oz.).
5.2.2 Industry Participants
HRT’s direct competition is made up of those companies that offer an organic soil enhancer and plant food product. Organics are no longer a niche market. Organic plant foods have developed from a niche market into a dominant sub-market in the plant food and fertilizer market and are strong competition for chemical competitors. Major direct competition includes VPG, makers of Super Bone Meal, and Scott’s, makers of Iron Bull. Other direct competition includes the products ZOO-DOO, and POO-PETS.
5.2.3 Distribution Patterns
Indirect competitors are those companies that offer only chemical soil enhancers and plant foods. HRT feels that these companies are an indirect form of competition because though the products they promote attempt to give the same results as our direct competition, they fall far short of current market expectations, and it will only be a matter of time until these companies’ products will be out-dated. Even so, HRT does acknowledge that as these companies’ products become outdated, many companies will be certain to phase-in their own organic substitutes in place of the chemicals. Major indirect competitors are Grace/Sierra, Stern, and Pursell.
5.2.4 Competition and Buying Patterns
In order to compete in the soil enhancer and plant food market, HRT identified market needs to gain an overall competitive advantage. The following explains our products competitive advantages. Our product is:
- Organic: To respond to current market trends, HRT is offering an organic product. This includes all of the advantages organics offer over chemicals.
- More effective between application times: Normal times between applications range from two to four weeks. Our product lasts for many months, thereby saving the customer time and money (no additional expenditure for more product).
- Recycled: This part of our product has to do with marketing. Recycled products characterize a “caring company” and are more appealing to the customer.
- A safe and effective pest repellent: Our product would be the only plant food on the market with the added convenience of repelling pests. Most gardeners use separate plant foods and pest repelling methods. Many of the methods used to keep animals away are not only dangerous and life threatening to the animals, but also to any humans that may come in contact with them. These may include chemicals and/or barriers and traps. HRT’s product is non-toxic and has the ability to deter animals safely because of the human scent in the hair, animals that are typically found in gardens steer clear!
Strategy and Implementation Summary
Hair Recycling Technologies marketing strategy is to enhance, promote, and support the fact that our products, SMART SOIL and HARE AWAY are organic, recycled, and more effective than our competitors. HRT will target the environmentally conscious gardener. Our marketing will show the customer that HRT will be the leading company in the organic soil enhancer and animal deterrent business for the 21st century. The quality and competitive price of our products will be used to generate sales, and HRT will introduce its products through retail outlets and through the Internet.
6.1 Strategy Pyramid
The first step is to create a website to promote our products. The creation of our website is expected to take a minimum amount of time and effort after contracting with a developer. This will be one source for selling our products directly to our customers.
Second, there will be much emphasis placed on contacting and securing contracts with buyers of large retail establishments who supply home and garden products to the marketplace. Establishments will include large nurseries such as Franks and discount stores such as K-Mart, Mynards, Myers, and Wal-Mart. We will also focus on selling to mid-sized retailers through direct selling.
Third, we will contact various online gardening sites to help us market our product. We will give commission for products that are sold either on their gardening sites or if they post a link to HRT’s website. Websites that we will target include the following:
- Gardensupply.com at www.gardensupply.com. This site offers a healthy patch of down to earth products and bushels of expert gardening advice. Helpful hints from real-life gardening gurus are sprinkled throughout the site.
- Home Harvest Garden Supply Online at www.homeharvest.com offers natural and organic gardening products. It has product information, gardening tips, and lists products available year-round.
- Landscape USA at www.landscape.com is for green thumb gardeners with unique and desirable plants, tools, and how-to information.
- Martha Stewart Living at www.marthastewart.com is the grand maven of unique ideas pertaining to home and gardening.
- Santa Fe Greenhouses at www.santafegreenhouses.com helps desert gardens grow with garden supplies.
- Amazon.com at www.amazon.com, the bookseller that also has become a purveyor of lawn and garden tools, along with Home Depot and Sears.
6.1.1 Future Marketing Strategy
During the first year of operations, HRT will use traditional marketing channels such as direct marketing and through the use of channel partners. In recent years, there has been a large increase in the number of distribution channels. Less expensive and more effective ways of promoting a product have emerged. Infomercials are a big part of this new trend. HRT may plan to use this channel during our third and forth year of operations.
6.2 Value Proposition
HRT will focus its advertising efforts toward the home gardener. The company will stress the fact that our product is organic, recycled, and does not require many applications. This advertising strategy is aimed toward the environmentally conscious gardener who believes SMART SOIL will add more time and require less maintenance to their gardening experience. The animal deterrent HARE AWAY will be marketed toward the gardener who needs protection for his or her plants.
6.3 Competitive Edge
The suggested retail price for a bag of our soil enhancer is $2.99. Our wholesale price for the same bag is $1.50, and our cost per bag is less than 50 cents. The retail price for our bagged hair is $1.99. The wholesale price for the bagged hair is 85 cents a bag, and our cost per bag is less than 15 cents.
The price for the soil enhancer and bagged hair are fairly inelastic. With the environmental issues our world faces today, the consumer is more demanding of organic and recycled products. We believe that most gardeners are true environmentalists and will pay a premium for organic products.
The price margins on our products are relatively high. These margins may shrink with possible unexpected costs and competitors, however, the margins are high enough to sustain a considerable amount of growth and allocation toward a strong, aggressive advertising campaign.
6.4 Strategic Alliances
HRT’s advertising will play an important role in reaching our target market. The company will try to reach the target market through print advertising. There are dozens of gardening magazines which have thousands of subscribers. Organic Gardening and Farming and Organic Gardening are two of the largest publications dealing with our business. These publications will be one of our first channels of advertising. As stated earlier, HRT will also advertise through relationships with online retailers of home and gardening supplies.
6.4.1 Advertising Budget
Advertising expenses for the first two years of operation can be summarized in the table below.
| Source | Total |
| Organic Gardening 1/12 page | $2,958/year |
| Organic Gardening/Farming 1/6 page | $6,150/year |
| Worm’s Way Catalog | $5,700/year |
| Internet Co-op Ads Variable | $3,692 |
| Other Advertising Variable | $5,500 |
| Total: | $24,000 |
Sales Strategy
Our present management team will become the main sales force when operations begin. HRT’s sales force will increase as business demand permits. In the first six to twelve months of operations, our sales team will focus its efforts on small nurseries and other related companies. The team will promote the products based on their environmental strengths and extended duration. HRT will use other channels of selling after the first year. Catalogs and direct mail selling are part of the selling plan. In the second year, HRT will take its products to larger stores and retail chains.


| Sales Forecast | |||
| Year 1 | Year 2 | Year 3 | |
| Sales | |||
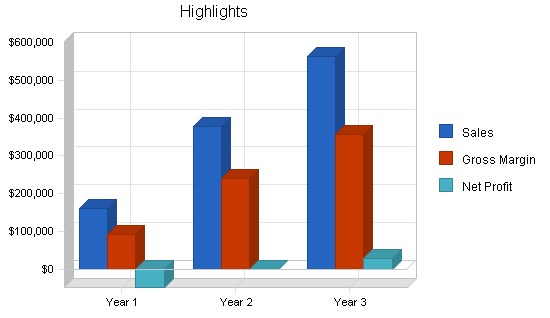
| Smart Soil, Hare Away, Rose Food, | $160,200 | $378,000 | $562,500 |
| Other | $0 | $0 | $0 |
| Total Sales | $160,200 | $378,000 | $562,500 |
| Direct Cost of Sales | Year 1 | Year 2 | Year 3 |
| Smart Soil, Hare Away, Rose Food, | $68,748 | $137,500 | $206,250 |
| Other | $0 | $0 | $0 |
| Subtotal Direct Cost of Sales | $68,748 | $137,500 | $206,250 |
Development Status
Acquisition of Supplies:
Hair Recycling Technologies will start its pilot program by establishing business partner relationships with owners of hair establishments in the Midwest. These relationships will involve placing hair collection bins in the salons to be picked up on a two-week basis. HRT will use a leased van to receive the supply of hair. Potting soil, along with peat moss, will be acquired to make the prototype. After two weeks, HRT will retrieve the hair collection bins; subsequently, the company will begin the next phase of processing.
Prototype of Product:
Hair Recycling Technologies will process the human hair by using a conventional microwave oven which will sanitize the human hair and then using a rotary cutter which will chop the hair into smaller strands. HRT will then process the components of human hair, potting soil, and peat moss. Substantial portions of each component will be combined and packaged. Thus, SMART SOIL, the company’s premier product, will be completed with a cost of less than 50 cents a bag.
Geographical Location:
Presently, the company facility is a 18′ x 30′ room located in the basement of one of the founders in the South Bend area. The maximum capacity of this facility is 250,000 units of the SMART SOIL product. Here are the capacity projects for the next three years:
- 2001: ~125,000 units/yr.
- 2002: [Two people processing] ~250,000 units/yr.
- 2003: [Three people processing] ~375,000 units/yr.
Facilities and Improvements:
As the projections indicate, the company essentially plans to stay in its current South Bend location through the first quarter of 2003. HRT projects to be fully established in a new South Bend facility by the beginning of the second quarter of 2003.
In this facility, the company will implement new processing equipment and procedures. Whereas HRT has sanitized the hair inside of a large commercial microwave oven, the company will lease the following equipment to improve production:
- The Gemco V-shape Tumble Blending Microwave Dryer
- To sanitize and toss the hair to prevent matting.
- The Munson M-1 Mini Rotary Cutter to chop the hair
- Cuts hair into finer strands for better packaging and consumer appeal.
Costs:
Supplies for Products:
| Item | Price\Pound |
| Potting Soil | $ 0.03 |
| Peat Moss | $0.07 |
| Cottonseed Meal | $0.01 |
| Hair | $0.03 |
| Bags (each) | $0.03 |
| Labels (each) | $0.03 |
| Total | $0.23 |
General Administrative Expenses:
- PBX system with voice mail service:
- Three phone lines ($60/mo.) $180
- One 800 line ($20/mo.) $20
- Used office furniture & equipment: $3,600
- Rent: $600.00/mo.
Advertising: Continued advertising costs will be approximately 15% of gross sales. Additional in-depth cost structure will be covered in the Financial Analysis.
Management Summary
K. Justin Luber is the mind behind Hair Recycling Technologies. He saw the need for hair to be recycled and used in several different and environmentally beneficial ways. With the development, determination, motivation, and persistence of everyone involved, HRT will be the leading producer of recycled hair in the future.
The management team of Hair Recycling Technologies will be comprised of the following executive positions.
- President of operations: K. Justin Luber.
- Vice-president of operations/finance: Jason Mysliwec.
- Financial advisor: Hunter Korth.
- Marketing advisor: Robin Liu.
At Hair Recycling Technologies, the management team believes that this unique way of recycling will change the way consumers look at gardening. As with any company, the responsibilities and duties of the management team are very important and cannot be taken lightly. However, along with these individual responsibilities the executives and advisors at HRT will work together as a team to create a successful company.
9.1 Organizational Structure
The responsibilities involved in the company Hair Recycling Technologies are great and abundant. HRT’s main purpose is to appeal to environmentally conscious minded gardeners by developing products that include recycled hair. Each executive member will have several responsibilities that are imperative to fulfill the duties in producing such unique gardening products.
As founder and president of Hair Recycling Technologies, Mr. Justin Luber will be responsible for the entire operation. Some of his duties will include overseeing the areas held by the other company executives, as well as the output produced by other employees. He will be in charge of the company’s public relations. He will also have the job of hiring dedicated people and firing employees who are not willing to put their best efforts into the production of HRT’s products. In addition, he will establish a good working relationship with the board of directors and company executives. Mr. Luber will also have an important role in making decisions that concern the well being of HRT.
Mr. Jason Mysliwec has an important job as vice-president of finance/operations. His job will be crucial in the survival of Hair Recycling Technologies. Mr. Mysliwec will be responsible for HRT’s financial operations which include start-up expenses, accounts payable, accounts receivables, and developing yearly budgets. In addition, his job will include developing funding needed for the company such as obtaining loans on behalf of the company and fund-raising. This will include developing and sustaining relationships with investors. Moreover, he will be allocating money for each division such as marketing, research and development and sales. This job will be important in that each department’s survival is dependent upon the financial abilities of Mr. Mysliwec.
Marketing will play an important role in convincing consumers to switch from their old products to HRT’s unique soil enhancer and animal deterrent. Mr. Luber will be responsible for creating the need for SMART SOIL and the animal deterrent while at the same time capturing the attention of the consumers’ targeted, home gardeners. Some of his duties will include the pricing of HRT’s products, monitoring the competition, analyzing results from market research studies, realizing customers’ needs, and appealing to those needs. In addition, Mr. Luber will be working closely with Mr. Mysliwec on the development and distribution of new product lines.
The sales department is parallel with marketing in that both aspects are dependent upon the other. Mr. Luber will be using strategies to make people aware of HRT’s unique products. He will be responsible for advertising and promotion ideas and have input into product pricing. He will also be in charge of projecting the overall sales of the products, setting sales quotas for sales representatives, and developing a sales force. In addition, Mr. Luber will be working along with marketing in order to obtain feedback from market research surveys which will help him target the customer more accurately.
Research and development is an important stage in the success of Hair Recycling Technologies. Mr. Mysliwec will be responsible for the growth of the company. His duties will include creating new ideas for using recycled hair in the gardening industry. This job might entail working closely with professionals who are experts in the field of agriculture, horticulture, and possibly organic chemistry. In addition, Mr. Mysliwec will have an important role in diversifying and expanding the product line.
Another responsibility Mr. Mysliwec will have is promoting teamwork throughout the company as well as exemplifying leadership qualities to production employees. Some of his duties will include handling conflicts within the company, dealing with problems that arise quickly and motivating employees as well as rewarding them for good performance. In addition, Mr. Mysliwec will be directly involved in people management. In order to have a good operation the manager must create a honest, open, trusting relationship with employees. This duty will entail establishing a good working relationship with production line employees because without them HRT’s products will not be produced.
9.2 Management Team
The management team and board of directors/advisors will play a critical part in the success and growth of the company’s unique products. One important aspect of being a team is the ability to work together. In the early stages of this venture, four individuals came together and formed a team in which they transformed into team players. Moreover, each primary member has different qualities and skills that will be beneficial to their division and company as a whole.
K. Justin Luber, President of Operations:
Mr. Luber is a second year MBA candidate at the Mendoza College of Business, University of Notre Dame with concentrations in marketing and strategy. He is also a graduate of the University of Georgia, Terry College of Business with a BBA degree in finance. Mr. Luber has many strengths that will be beneficial to Hair Recycling Technologies. He is motivated, ambitious and a team player. Throughout school, Mr. Luber has been acknowledged for the leadership abilities he possesses. He received the Outstanding Performance Award while attending a ten-week course at the Dale Carnegie Human Relations Course in Atlanta, Georgia. In addition, Mr. Luber was awarded for displaying leadership abilities at the United States Naval Gunnery School in Chicago, Illinois. In addition to his college experience, Mr. Luber has over five years of business experience which includes a management consulting summer internship with Arthur D. Little, Inc, three years sales and marketing experience with Unisys Corporation, and project management experience with the Atlanta Committee for the Olympic Games. Specifically, as it relates to his sales and marketing abilities, Mr. Luber’s sales and marketing strategies at Unisys led to a consistent increase in sales volume coupled with many achievements, such as achieving the Unisys 1997 Unisys Rookie of the Year Award for the North American Field Operations and the Southern Field Operations. Additionally, while working in sales and marketing with Unisys, Mr. Luber earned national recognition for securing over $2.5 million in new business.
Jason Mysliwec, Vice-President of Finance/Operations:
Mr. Mysliwiec will more than adequately complement the skills of Mr. Luber, Korth, and Liu. With a Bachelor of Science degree in business administration from Pepperdine University, as well as an MBA with a finance concentration from the University of Notre Dame, Mr. Mysliwiec is well equipped to lead and manage HRT effectively. Proficient in all Microsoft Office applications, and several financial software packages, Mr. Mysliwiec will ensure that the firm utilizes its resources well, and allocates them efficiently in the pursuit of profitability. Among Mr. Mysliwiec’s professional experiences are two years as internal finance and administration coordinator at Centura Health in Denver, Colorado. During this time, Mr. Mysliwiec assembled and oversaw a $40 million Information Services budget, where he not only successfully kept the division within its parameters, but also orchestrated programs which saved the company several hundred thousand dollars per year.
Hunter Korth, Financial Advisor:
Mr. Korth has had experience in the past that will be beneficial to the company in his role as a financial advisor. After graduating with a bachelors degree in economics from Albion College in 1994, Mr. Korth worked for Merrill Lynch in several different capacities. He initially worked in the corporate options and 401K departments where he advised clients in the creation of options and 401K plans and administered financial advice regarding the plans. Following his tenure in the corporate options and 401K departments, Mr. Korth transitioned to the private client services department in San Francisco. While with private client services, Mr. Korth developed investment plans with strategies tailored to achieve clients’ specific short- and long-term investment objectives and provided comprehensive investment guidance and highly personalized service. During this time, he managed a $9 million dollar portfolio of securities consisting of equities and fixed income products. Mr. Korth is currently a second year MBA student at the University of Notre Dame and is concentrating in finance.
Robin Liu, Director/Advisor of Marketing:
Mr. Liu will be an important player in the growth of HRT. He worked in sales and marketing for nine years and is very familiar with some of the elements involved in sales strategies such as advertising, promotion, and the sales force. His skills in working with emerging markets will be helpful in that he can analyze and understand the results of a market research study. Mr. Liu will be able to relate to the different types of people studied and comprehend their responses by making the company’s product appeal to their particular needs. He has also held several jobs such as project manager, national sales manager, China chief representative, and president and founder for his own trading company. He has demonstrated a high level of achievements by acting on various managerial positions. Mr. Liu will receive his MBA with a concentration on marketing in May of 2001 from the University of Notre Dame.
Financial Plan
Inception Loan: An original loan of $60,000 will be procured for the opening of HRT. At an annualized borrowing rate of 8%, interest payments of $400 will be made monthly.
Production: HRT will employ the following production schedule:
- 2001: 125,000 units (10,416/month).
- 2002: 250,000 units (20,833/month).
- 2003: 375,000 units (31,250/month).
Sales Forecasts: HRT has estimated the following unit sales forecasts:
- 2001: 106,800 units.
- 2002: 252,000 units.
- 2003: 375,000 units.
For simplicity, Price per Unit = $1.50, Cost per Unit = $.55
Salaries: HRT will hire and employ one administrative office manager in 2001, two in 2002, and three in 2003. The first year salary will be $19,800, increasing for inflation at 3% per year, per employee. Therefore, total salaries will be $40,788 in 2002, and $63,018 in 2003.
Rent: HRT will sign a three-year lease at business inception. Terms of this lease will include rent of $600 per month, and will include electricity.
Utilities: Per the schedule found earlier in the business plan, HRT will pay non-electric (included in rent) utilities of $200 per month over the term of the lease.
Equipment: Per the schedule found in the business plan regarding equipment, HRT will invest $5,500 up front for its machinery, to be depreciated straight-line over a useful life of five years. Therefore, yearly depreciation will be $1,100 per year ($92 per month). Also, HRT will equip its firm with office equipment (per schedule in business plan) at a one-time expense of $3,600.
Insurance: HRT will enter into a liability insurance policy at the cost of $2,400 per year.
Advertising: HRT will originally plan to invest 15% of gross sales into advertising expenses. This number may vary over time, but for preliminary financial planning, will be allocated as follows:
- 2001: $24,000.
- 2002: $56,700.
- 2003: $84,375.
Miscellaneous: HRT will reserve a miscellaneous expense account at the rate of 3% of gross sales, amortized evenly over each month, for unforeseen costs.
Taxes: As a Sub-chapter S Corporation, Hair Recycling Technologies pays no corporate tax. Rather, individual income taxes are paid by each owner based on his percentage of stake in the company. For this reason, Hair Recycling Technologies taxes will be $0, and are noted as such for reporting purposes.
10.1 Break-even Analysis
The chart and table below contain the Break-even Analysis for HRT.

10.2 Projected Profit and Loss
The most important assumption in the Projected Profit and Loss statement is the gross margin, which is supposed to increase to 25%. Month-by-month assumptions for profit and loss are included in the appendix.


10.3 Projected Cash Flow
The chart and table below project increasing cash flow throughout the first three years of plan implementation.

10.4 Projected Balance Sheet
The following table projects healthy growth in sales and net worth.
10.5 Business Ratios
The following table contains important business ratios from the Soil Preparation Services industry, as determined by the Standard Industry Classification (SIC) Index.
Several explanations must be made to balance the company’s ratios against the industry averages. First of all is the relative newness of this type of industry, which means that the industry averages reflect companies that have very different products, consumers and overall circumstances. Therefore, there will be substantial differences in the general comparison between HRT and other firms. Furthermore, HRT is a start-up company that is seeking to introduce a new type of product to the market through limited distribution channels. The company is investing significant funds into advertising, and not expecting to see profits for the first two years. This is why the company has a consecutive if diminishing negative net worth during the period covered by this plan. As acquired assets gear up to full production and the marketing efforts generate more sales, this negative net worth will become more comparable to industry averages. Finally, as a start up, the company is seeking ways to maximize profit while reducing the need to invest in significant initial costs. Therefore the ratios of HRT’s assets and liabilities to the industry standard, which reflect more mature, established companies does not match well either.


