
Rose Petal Nursery
Executive Summary
Rose Petal Nursery is dedicated to providing a quality choice for people looking for plant and garden supplies, as well as serving contractors who need a reliable source of products. Our start-up expenses come to $41,500 which includes the cost of the greenhouses ($38,000) and the cost of rent for the land ($1,000). The start-up costs will be financed entirely by Jim and Dan Forester.
We will offer a wide variety of plants, trees, vegetable plants, along with a selection of garden supplies. Most of the plants we sell will be grown in our greenhouses. With a convenient location Rose Petal Nursery intends to successfully market to the residential customer, as well as contractors and renters.
We would like to see a five to ten percent increase in our customer base each year. Our marketing strategy includes providing a knowledgeable staff, affordable prices, a great location, and top notch customer service.
Rose Petal Nursery has been the dream of owners Jim and Dan Forester for many years, and has been a project in the making for the last five years. Jim and Dan will manage all aspects of operations at Rose Petal Nursery. Dan will oversee the staff and be involved with the ordering of merchandise, while Jim will be responsible for the ordering of the garden supplies and tree stock, as well as the maintenance of the greenhouses.
Rose Petal aims to experience a growth rate of 20% in sales for the second year of operation and build upon that as the company grows. With creative marketing, and a quality choice of plants and garden supplies for our customers Rose Petal Nursery intends to make its presence known in the nursery community.

1.1 Objectives
- Maintain an average gross margin at or above 50%.
- Generate an average of $1,000 of sales each business day of each month.
- Realize an annual growth rate of 10% in Year 2.
1.2 Mission
Rose Petal Nursery is dedicated to providing a wide variety of plants and trees in an aesthetic setting. Customer service is extremely important. We want each customer to have a pleasant shopping experience, and it is the intention of our staff to answer questions with expertise and to offer advice when we feel it is needed.
1.3 Keys to Success
The primary keys to success for the company will be based on the following factors:
- Sell products of the highest quality with excellent customer service and support.
- Retain customers to generate repeat purchases and make referrals.
- Continue to expand daily sales by adding to the variety of plants we sell.
- Communicate with our customers through creative advertising.
Company Summary
Rose Petal Nursery is the dream of brothers Jim and Dan Forester, and has been a project in the making for five years. With an opening date of April of this year, Jim and Dan are seeing the dream of operating a nursery come to fruition. Located on the outskirts of Eugene at 35571 Brookside Rd. Rose Petal Nursery will focus on providing quality bedding, hanging,and vegetable plants, along with a variety of potted trees. Our aim is to serve both residential customers and landscaping contractors. We will also have a variety of garden accessories such as ponds, statues, potting soils, fertilizers, and garden tools. Our start-up requirements will be $100,000.
2.1 Start-up Summary
Our start-up requirements come to $100,000 which includes the first month’s rent of the land for our nursery. The regular rental fee is $1,000 a month. The start-up costs will be financed entirely by Jim and Dan Forester.

| Start-up | |
| Requirements | |
| Start-up Expenses | |
| Legal | $500 |
| Brochures | $1,500 |
| Insurance | $500 |
| Rent | $1,000 |
| Expensed Equipment | $38,000 |
| Total Start-up Expenses | $41,500 |
| Start-up Assets | |
| Cash Required | $20,000 |
| Start-up Inventory | $26,500 |
| Other Current Assets | $0 |
| Long-term Assets | $12,000 |
| Total Assets | $58,500 |
| Total Requirements | $100,000 |
| Start-up Funding | |
| Start-up Expenses to Fund | $41,500 |
| Start-up Assets to Fund | $58,500 |
| Total Funding Required | $100,000 |
| Assets | |
| Non-cash Assets from Start-up | $38,500 |
| Cash Requirements from Start-up | $20,000 |
| Additional Cash Raised | $0 |
| Cash Balance on Starting Date | $20,000 |
| Total Assets | $58,500 |
| Liabilities and Capital | |
| Liabilities | |
| Current Borrowing | $0 |
| Long-term Liabilities | $0 |
| Accounts Payable (Outstanding Bills) | $0 |
| Other Current Liabilities (interest-free) | $0 |
| Total Liabilities | $0 |
| Capital | |
| Planned Investment | |
| Jim Forester | $50,000 |
| Dan Forester | $50,000 |
| Additional Investment Requirement | $0 |
| Total Planned Investment | $100,000 |
| Loss at Start-up (Start-up Expenses) | ($41,500) |
| Total Capital | $58,500 |
| Total Capital and Liabilities | $58,500 |
| Total Funding | $100,000 |
2.2 Company Ownership
Jim and Dan Forester are the owners and operators of Rose Petal Nursery. Jim has worked in the nursery industry for over twenty years (with 10 years managing Stoneybrook Nursery). Dan has a degree from Washington State University in agronomy and has worked for the Lane County Extension Agency as a plant specialist advising the local population on the purchase and care of a wide range of plants.
Products
Rose Petal Nursery will offer a wide variety of bedding plants, shrubs, trees, and vegetable plants along with many garden accessories such as fountains, stepping stones, garden tools, fertilizers, and potting soils. Most of the plants will be grown on-site in state-of-the-art greenhouses. Initially though, we will buy full grown plants for our first few months of inventory.
Market Analysis Summary
Rose Petal Nursery target market strategy is based on becoming an attractive choice for homeowners and landscape contractors in the greater Eugene/Springfield region. The target markets we are going to pursue are the residential consumers looking for a wide variety of plants and trees to beautify their residences. Landscape contractors will be attracted by competitive prices and a diverse inventory. People will want to shop at our location because of the superior customer service we will provide. Rose Petal Nursery would like to see a five to ten percent increase in customers annually.
4.1 Market Segmentation
The profile of our customer consists of the following geographic and demographic information:
Geographics
- Our immediate geographic market is the greater Eugene/Springfield metropolitan area with a population of 200,000 people.
- A 100 mile geographic area would want our services, as we become a well known nursery.
- The total target market is estimated at 500,000 people.
Demographics
- Male and Female.
- Married and Single.
- Combined annual income in excess of $50,000.
- Age range of 25 to 80 years, with a median age of 40.
- Own their own houses or townhouses valued at over $150,000.
- Most work out of the home by choice in a variety of work environments.
We know the following regarding the profile of the typical resident of the greater Eugene/Springfield area:
- 50% have lived in the area for 10 or more years.
- 30% are between the ages of 30 and 45 years of age.
- 40% have completed some college.
- 30% are professionals and/or business owners, or managers.
- 60% have children living at home.
- 50% own their own residence.

| Market Analysis | |||||||
| Year 1 | Year 2 | Year 3 | Year 4 | Year 5 | |||
| Potential Customers | Growth | CAGR | |||||
| Residential, Homeowners | 5% | 50,000 | 52,500 | 55,125 | 57,881 | 60,775 | 5.00% |
| Commercial Contractors | 7% | 100 | 107 | 114 | 122 | 131 | 6.98% |
| Renters | 5% | 30,000 | 31,500 | 33,075 | 34,729 | 36,465 | 5.00% |
| Total | 5.00% | 80,100 | 84,107 | 88,314 | 92,732 | 97,371 | 5.00% |
4.2 Target Market Segment Strategy
Our target market is based on becoming a resource for people looking to buy flowers, trees, and garden supplies. Our marketing strategy centers around superior performance in the following areas.
- Customer service
- Large selection and fair pricing
- Quality products
The target markets are separated into three segments; “Residential, Homeowners,” “Commercial Contractors,” and “Renters”. The primary marketing opportunity is selling to these accessible target market segments that focus on the beautification of peoples’ homes and places of business.
Residential, Homeowners — Rose Petal Nursery would like to be an attractive choice for homeowners purchasing plants and garden supplies. With our large and varied selection of plants, trees, and garden supplies it is our aim to give individual attention to every customer and to serve their planting needs. The residential sector has a wide range of income levels, but on average the annual household income of our customers is $50,000.

Commercial Contractors — Commercial contractors are important Rose Petal Nursery customers. A consistent inventory, and providing the large quantities contractors need, is important. With prompt and affordable service, contractors will know that they can count on us to meet their needs in a professional manner. Most of the contracting businesses we will service have an annual revenue of at least $50,000 to over $100,000.
Renters — People who do not own their own homes but need flowers and plants to beautify their living spaces make up an important segment of our target market. Many rentals and even apartment complexes have spaces that renters can use to plant gardens. Household income for this group would be in the range of $20,000 to $50,000.
4.3 Industry Analysis
The nursery business is highly competitive, and it is important to maintain a high level of customer service, offer quality products, and give the consumer a wide variety of choices when shopping for plants and trees. Our approach will be to offer a diverse selection of plants, trees, and garden supplies. Exceptional customer service will be important in meeting the needs of our target markets. Healthy plants will be a top priority, and we will display the plants artistically. Plants are a commodity that will always have a market as people consider them to be very important to have around their residences. There are four other nurseries around the greater Lane County area, and we will have to provide top quality service to be succeed.
4.3.1 Competition and Buying Patterns
Current local competition includes the following:
- Lone Pine Nursery — Locally owned, and selling a limited variety of plants, shrubs, trees, and garden products to the general public. This nursery is seasonal focusing on spring and summer flowers. They have a very pleasant facility in which to shop, but prices are a little more on average than Rose Petal’s with not a very good selection of trees and shrubs.
- McKenzie Nursery — Locally owned, offers a limited selection of plants and shrubs with the main emphasis on providing fresh produce in the summer months. Seasonal “U-pick” strawberries, blueberries, and apples are available on the property. Their prices are competitive but the location is not convenient for a lot of people, as it is 25 miles out of town.
- Green Thumb Nursery — Locally owned, offering a variety of plants and trees, as well as, a large selection of garden supplies. Green Thumb most closely matches what we have to offer when talking about plants and shrubs, but they do not have a large enough inventory to service some of the large contractors in the area.
Rose Petal Nursery will provide competitive pricing for its products, and will guarantee to match competitors’ prices, but exceptional customer service and product knowledge will make us stand out to our target markets. The size of our inventory and the variety of choices our customers will have when choosing flowers, trees, and shrubs will make Rose Petal Nursery an attractive choice. Our location is very convenient, only 5 minutes outside the city limits.
Strategy and Implementation Summary
Our strategy is based on serving our customers with expert service and product knowledge.
Also:
- We are building our marketing plan to reach homeowners, renters, and contractors.
- We focus on satisfying the needs of our customers.
- We focus on providing quality plants at affordable prices.
5.1 Sales Strategy
The primary sales strategy includes these factors:
- Exceptional customer service
- Exceptional product knowledge
- Large and varied inventory
- Convenient location.
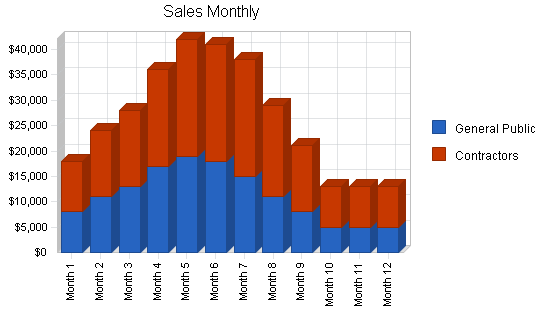
5.1.1 Sales Forecast
The sales forecast is broken down into two main revenue streams: the general public, and contractors. The sales forecast for the upcoming year is based on a modest growth rate for sales. Being a start-up business we are projecting a growth rate of 20%, hoping our advertising will bring in new customers daily.

| Sales Forecast | |||
| Year 1 | Year 2 | Year 3 | |
| Sales | |||
| General Public | $135,000 | $162,000 | $194,400 |
| Contractors | $181,000 | $217,200 | $260,640 |
| Total Sales | $316,000 | $379,200 | $455,040 |
| Direct Cost of Sales | Year 1 | Year 2 | Year 3 |
| Flowers, Trees, Shrubs | $94,800 | $113,760 | $136,512 |
| Garden Supplies | $63,200 | $75,840 | $91,008 |
| Subtotal Direct Cost of Sales | $158,000 | $189,600 | $227,520 |
5.2 Milestones
The milestones chart is accompanied by a table outlining key activities critical to our success.

| Milestones | |||||
| Milestone | Start Date | End Date | Budget | Manager | Department |
| Business Plan | 1/22/2003 | 3/20/2003 | $1,000 | Jim Forester | Management |
| Accounting plan | 2/2/2003 | 2/24/2003 | $500 | Todd Cramer | Accountant |
| Marketing and Advertising | 4/15/2003 | 7/21/2003 | $3,000 | Dan Forester | Management |
| Totals | $4,500 | ||||
5.3 Marketing Strategy
Our marketing strategy is based on becoming an option for contractors and the general public to fill their plant and shrubbery needs. Our marketing strategy is based on superior performance in the following areas:
- Customer service
- Knowledgeable staff
- Affordable prices
- Great location.
5.4 Competitive Edge
Rose Petal Nursery will have one of the most extensive and affordable plant and flower selections in the greater Eugene/Springfield area, and a very knowledgeable staff ready to provide unparallel customer service. Contractors looking for a reliable nursery will find Rose Petal very supportive and easy to work with. The ease and convenience of our location is a very big plus.
Management Summary
Owners Jim and Dan Forester will oversee and manage all aspects of operation at Rose Petal Nursery. Jim will be responsible for the ordering of garden supplies and tree stock as well as the maintenance of the greenhouses. Dan will be responsible for overseeing staff and working with contractors as well as doing some of the ordering of merchandise.
6.1 Personnel Plan
The personnel plan contains two full-time employees and two part-time employees in addition to Jim and Dan Forester. Jim and Dan will both draw $3,500 per month. The two full-time employees will be paid $2,000 per month to begin with and the two part-time employees will make $1,000 a month. Employees will help customers and care for plants as part of their jobs.
| Personnel Plan | |||
| Year 1 | Year 2 | Year 3 | |
| Owners | $84,000 | $88,000 | $92,000 |
| Full-time Employees | $32,000 | $44,000 | $48,000 |
| Part-time Employees | $20,000 | $25,000 | $29,000 |
| Total People | 4 | 5 | 5 |
| Total Payroll | $136,000 | $157,000 | $169,000 |
Financial Plan
The financial plan contains these essential factors:
- A growth rate of 20% in sales for the year 2005, to total in excess of $379,000 in total revenues.
- Average in sales per business day (305 days per year) in excess of $900.00.
Difficulties and Risks
- Slow sales resulting in less-than projected cash flow.
- Overly aggressive and debilitating actions by competitors.
- A parallel entry by a new competitor.
- Sluggish economic conditions.
7.1 Important Assumptions
The following critical assumptions will determine the potential for future success.
- A healthy economy that supports moderate growth in our market.
- Low operating expenses, particularly in the area of buying plants that could be grown on-site.
| General Assumptions | |||
| Year 1 | Year 2 | Year 3 | |
| Plan Month | 1 | 2 | 3 |
| Current Interest Rate | 9.00% | 9.00% | 9.00% |
| Long-term Interest Rate | 7.00% | 7.00% | 7.00% |
| Tax Rate | 25.42% | 25.00% | 25.42% |
| Other | 0 | 0 | 0 |
7.2 Break-even Analysis
The following chart and table summarize our break-even analysis. Our fixed costs will be approximately $14,800 per month at the onset and we expect to reach the break-even point in the third year of operation.

| Break-even Analysis | |
| Monthly Revenue Break-even | $29,767 |
| Assumptions: | |
| Average Percent Variable Cost | 50% |
| Estimated Monthly Fixed Cost | $14,883 |
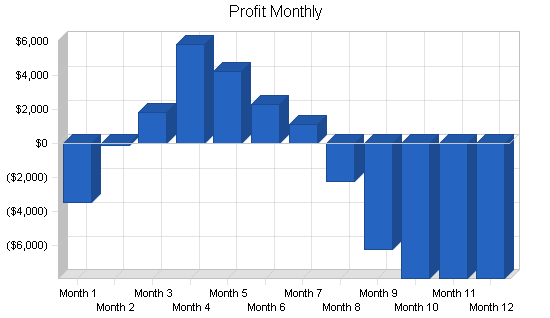
7.3 Projected Profit and Loss
The following represents the projected profit and loss for Rose Petal Nursery based, on sales and expenses, for 2004 and beyond. We are anticipating a steady increase in sales through July. Business is expected to slow during the autumn and winter.


| Pro Forma Profit and Loss | |||
| Year 1 | Year 2 | Year 3 | |
| Sales | $316,000 | $379,200 | $455,040 |
| Direct Cost of Sales | $158,000 | $189,600 | $227,520 |
| Other Costs of Goods | $0 | $0 | $0 |
| Total Cost of Sales | $158,000 | $189,600 | $227,520 |
| Gross Margin | $158,000 | $189,600 | $227,520 |
| Gross Margin % | 50.00% | 50.00% | 50.00% |
| Expenses | |||
| Payroll | $136,000 | $157,000 | $169,000 |
| Sales and Marketing and Other Expenses | $6,000 | $5,000 | $5,000 |
| Depreciation | $0 | $0 | $0 |
| Rent | $12,000 | $0 | $0 |
| Utilities | $3,600 | $4,000 | $4,000 |
| Insurance | $600 | $700 | $800 |
| Payroll Taxes | $20,400 | $23,550 | $25,350 |
| Total Operating Expenses | $178,600 | $190,250 | $204,150 |
| Profit Before Interest and Taxes | ($20,600) | ($650) | $23,370 |
| EBITDA | ($20,600) | ($650) | $23,370 |
| Interest Expense | $0 | $0 | $0 |
| Taxes Incurred | $0 | $0 | $5,940 |
| Net Profit | ($20,600) | ($650) | $17,430 |
| Net Profit/Sales | -6.52% | -0.17% | 3.83% |
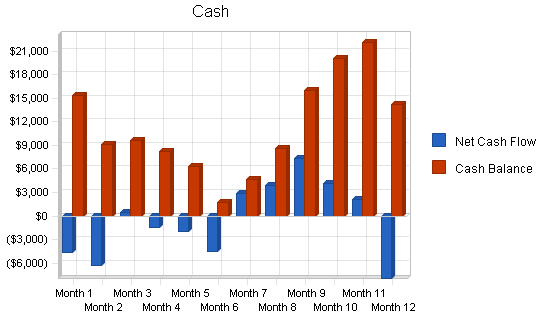
7.4 Projected Cash Flow
The cash flow projections are outlined below. These projections are based on our basic assumptions with revenue generation factors carrying the most significant weight regarding the outcome. We are anticipating that we will have a steadily increasing cash flow as the business continues to grow.
| Pro Forma Cash Flow | |||
| Year 1 | Year 2 | Year 3 | |
| Cash Received | |||
| Cash from Operations | |||
| Cash Sales | $79,000 | $94,800 | $113,760 |
| Cash from Receivables | $217,825 | $280,565 | $336,678 |
| Subtotal Cash from Operations | $296,825 | $375,365 | $450,438 |
| Additional Cash Received | |||
| Sales Tax, VAT, HST/GST Received | $0 | $0 | $0 |
| New Current Borrowing | $0 | $0 | $0 |
| New Other Liabilities (interest-free) | $0 | $0 | $0 |
| New Long-term Liabilities | $0 | $0 | $0 |
| Sales of Other Current Assets | $0 | $0 | $0 |
| Sales of Long-term Assets | $0 | $0 | $0 |
| New Investment Received | $5,000 | $0 | $0 |
| Subtotal Cash Received | $301,825 | $375,365 | $450,438 |
| Expenditures | Year 1 | Year 2 | Year 3 |
| Expenditures from Operations | |||
| Cash Spending | $136,000 | $157,000 | $169,000 |
| Bill Payments | $171,632 | $215,464 | $266,541 |
| Subtotal Spent on Operations | $307,632 | $372,464 | $435,541 |
| Additional Cash Spent | |||
| Sales Tax, VAT, HST/GST Paid Out | $0 | $0 | $0 |
| Principal Repayment of Current Borrowing | $0 | $0 | $0 |
| Other Liabilities Principal Repayment | $0 | $0 | $0 |
| Long-term Liabilities Principal Repayment | $0 | $0 | $0 |
| Purchase Other Current Assets | $0 | $0 | $0 |
| Purchase Long-term Assets | $0 | $0 | $0 |
| Dividends | $0 | $0 | $0 |
| Subtotal Cash Spent | $307,632 | $372,464 | $435,541 |
| Net Cash Flow | ($5,807) | $2,901 | $14,897 |
| Cash Balance | $14,193 | $17,094 | $31,991 |
7.5 Projected Balance Sheet
Rose Petal Nursery’s balance sheet is outlined below.
| Pro Forma Balance Sheet | |||
| Year 1 | Year 2 | Year 3 | |
| Assets | |||
| Current Assets | |||
| Cash | $14,193 | $17,094 | $31,991 |
| Accounts Receivable | $19,175 | $23,010 | $27,612 |
| Inventory | $7,150 | $8,580 | $10,296 |
| Other Current Assets | $0 | $0 | $0 |
| Total Current Assets | $40,518 | $48,684 | $69,899 |
| Long-term Assets | |||
| Long-term Assets | $12,000 | $12,000 | $12,000 |
| Accumulated Depreciation | $0 | $0 | $0 |
| Total Long-term Assets | $12,000 | $12,000 | $12,000 |
| Total Assets | $52,518 | $60,684 | $81,899 |
| Liabilities and Capital | Year 1 | Year 2 | Year 3 |
| Current Liabilities | |||
| Accounts Payable | $9,618 | $18,434 | $22,219 |
| Current Borrowing | $0 | $0 | $0 |
| Other Current Liabilities | $0 | $0 | $0 |
| Subtotal Current Liabilities | $9,618 | $18,434 | $22,219 |
| Long-term Liabilities | $0 | $0 | $0 |
| Total Liabilities | $9,618 | $18,434 | $22,219 |
| Paid-in Capital | $105,000 | $105,000 | $105,000 |
| Retained Earnings | ($41,500) | ($62,100) | ($62,750) |
| Earnings | ($20,600) | ($650) | $17,430 |
| Total Capital | $42,900 | $42,250 | $59,680 |
| Total Liabilities and Capital | $52,518 | $60,684 | $81,899 |
| Net Worth | $42,900 | $42,250 | $59,680 |
7.6 Business Ratios
Business ratios for the years of this plan are shown below. Industry profile ratios based on the Standard Industrial Classification (SIC) Code 5193.02, Flowers and Nursery Stock are shown for comparison.
The following will enable us to keep on track. If we fail in any of these areas, we will need to re-evaluate our business model:
- Gross margins at or above 50%.
- Month-to-month annual comparisons indicate an increase of 15% or greater.
- Do not depend on a credit line to meet cash requirements.
| Ratio Analysis | ||||
| Year 1 | Year 2 | Year 3 | Industry Profile | |
| Sales Growth | 0.00% | 20.00% | 20.00% | 1.22% |
| Percent of Total Assets | ||||
| Accounts Receivable | 36.51% | 37.92% | 33.71% | 30.27% |
| Inventory | 13.61% | 14.14% | 12.57% | 25.69% |
| Other Current Assets | 0.00% | 0.00% | 0.00% | 27.60% |
| Total Current Assets | 77.15% | 80.23% | 85.35% | 83.56% |
| Long-term Assets | 22.85% | 19.77% | 14.65% | 16.44% |
| Total Assets | 100.00% | 100.00% | 100.00% | 100.00% |
| Current Liabilities | 18.31% | 30.38% | 27.13% | 44.32% |
| Long-term Liabilities | 0.00% | 0.00% | 0.00% | 11.33% |
| Total Liabilities | 18.31% | 30.38% | 27.13% | 55.65% |
| Net Worth | 81.69% | 69.62% | 72.87% | 44.35% |
| Percent of Sales | ||||
| Sales | 100.00% | 100.00% | 100.00% | 100.00% |
| Gross Margin | 50.00% | 50.00% | 50.00% | 17.78% |
| Selling, General & Administrative Expenses | 56.52% | 50.17% | 46.15% | 9.07% |
| Advertising Expenses | 0.00% | 0.00% | 0.00% | 0.67% |
| Profit Before Interest and Taxes | -6.52% | -0.17% | 5.14% | 2.13% |
| Main Ratios | ||||
| Current | 4.21 | 2.64 | 3.15 | 1.66 |
| Quick | 3.47 | 2.18 | 2.68 | 0.99 |
| Total Debt to Total Assets | 18.31% | 30.38% | 27.13% | 6.03% |
| Pre-tax Return on Net Worth | -48.02% | -1.54% | 39.16% | 58.71% |
| Pre-tax Return on Assets | -39.22% | -1.07% | 28.54% | 14.61% |
| Additional Ratios | Year 1 | Year 2 | Year 3 | |
| Net Profit Margin | -6.52% | -0.17% | 3.83% | n.a |
| Return on Equity | -48.02% | -1.54% | 29.21% | n.a |
| Activity Ratios | ||||
| Accounts Receivable Turnover | 12.36 | 12.36 | 12.36 | n.a |
| Collection Days | 59 | 27 | 27 | n.a |
| Inventory Turnover | 10.45 | 24.11 | 24.11 | n.a |
| Accounts Payable Turnover | 18.84 | 12.17 | 12.17 | n.a |
| Payment Days | 27 | 23 | 27 | n.a |
| Total Asset Turnover | 6.02 | 6.25 | 5.56 | n.a |
| Debt Ratios | ||||
| Debt to Net Worth | 0.22 | 0.44 | 0.37 | n.a |
| Current Liab. to Liab. | 1.00 | 1.00 | 1.00 | n.a |
| Liquidity Ratios | ||||
| Net Working Capital | $30,900 | $30,250 | $47,680 | n.a |
| Interest Coverage | 0.00 | 0.00 | 0.00 | n.a |
| Additional Ratios | ||||
| Assets to Sales | 0.17 | 0.16 | 0.18 | n.a |
| Current Debt/Total Assets | 18% | 30% | 27% | n.a |
| Acid Test | 1.48 | 0.93 | 1.44 | n.a |
| Sales/Net Worth | 7.37 | 8.98 | 7.62 | n.a |
| Dividend Payout | 0.00 | 0.00 | 0.00 | n.a |
Appendix
| Sales Forecast | |||||||||||||
| Month 1 | Month 2 | Month 3 | Month 4 | Month 5 | Month 6 | Month 7 | Month 8 | Month 9 | Month 10 | Month 11 | Month 12 | ||
| Sales | |||||||||||||
| General Public | 0% | $8,000 | $11,000 | $13,000 | $17,000 | $19,000 | $18,000 | $15,000 | $11,000 | $8,000 | $5,000 | $5,000 | $5,000 |
| Contractors | 0% | $10,000 | $13,000 | $15,000 | $19,000 | $23,000 | $23,000 | $23,000 | $18,000 | $13,000 | $8,000 | $8,000 | $8,000 |
| Total Sales | $18,000 | $24,000 | $28,000 | $36,000 | $42,000 | $41,000 | $38,000 | $29,000 | $21,000 | $13,000 | $13,000 | $13,000 | |
| Direct Cost of Sales | Month 1 | Month 2 | Month 3 | Month 4 | Month 5 | Month 6 | Month 7 | Month 8 | Month 9 | Month 10 | Month 11 | Month 12 | |
| Flowers, Trees, Shrubs | $5,400 | $7,200 | $8,400 | $10,800 | $12,600 | $12,300 | $11,400 | $8,700 | $6,300 | $3,900 | $3,900 | $3,900 | |
| Garden Supplies | $3,600 | $4,800 | $5,600 | $7,200 | $8,400 | $8,200 | $7,600 | $5,800 | $4,200 | $2,600 | $2,600 | $2,600 | |
| Subtotal Direct Cost of Sales | $9,000 | $12,000 | $14,000 | $18,000 | $21,000 | $20,500 | $19,000 | $14,500 | $10,500 | $6,500 | $6,500 | $6,500 | |
| Personnel Plan | |||||||||||||
| Month 1 | Month 2 | Month 3 | Month 4 | Month 5 | Month 6 | Month 7 | Month 8 | Month 9 | Month 10 | Month 11 | Month 12 | ||
| Owners | 0% | $7,000 | $7,000 | $7,000 | $7,000 | $7,000 | $7,000 | $7,000 | $7,000 | $7,000 | $7,000 | $7,000 | $7,000 |
| Full-time Employees | 0% | $0 | $0 | $0 | $0 | $4,000 | $4,000 | $4,000 | $4,000 | $4,000 | $4,000 | $4,000 | $4,000 |
| Part-time Employees | 0% | $2,000 | $2,000 | $2,000 | $2,000 | $2,000 | $3,000 | $3,000 | $2,000 | $2,000 | $0 | $0 | $0 |
| Total People | 3 | 3 | 3 | 3 | 5 | 6 | 6 | 5 | 5 | 4 | 4 | 4 | |
| Total Payroll | $9,000 | $9,000 | $9,000 | $9,000 | $13,000 | $14,000 | $14,000 | $13,000 | $13,000 | $11,000 | $11,000 | $11,000 | |
| General Assumptions | |||||||||||||
| Month 1 | Month 2 | Month 3 | Month 4 | Month 5 | Month 6 | Month 7 | Month 8 | Month 9 | Month 10 | Month 11 | Month 12 | ||
| Plan Month | 1 | 2 | 3 | 4 | 5 | 6 | 7 | 8 | 9 | 10 | 11 | 12 | |
| Current Interest Rate | 9.00% | 9.00% | 9.00% | 9.00% | 9.00% | 9.00% | 9.00% | 9.00% | 9.00% | 9.00% | 9.00% | 9.00% | |
| Long-term Interest Rate | 7.00% | 7.00% | 7.00% | 7.00% | 7.00% | 7.00% | 7.00% | 7.00% | 7.00% | 7.00% | 7.00% | 7.00% | |
| Tax Rate | 30.00% | 25.00% | 25.00% | 25.00% | 25.00% | 25.00% | 25.00% | 25.00% | 25.00% | 25.00% | 25.00% | 25.00% | |
| Other | 0 | 0 | 0 | 0 | 0 | 0 | 0 | 0 | 0 | 0 | 0 | 0 | |
| Pro Forma Profit and Loss | |||||||||||||
| Month 1 | Month 2 | Month 3 | Month 4 | Month 5 | Month 6 | Month 7 | Month 8 | Month 9 | Month 10 | Month 11 | Month 12 | ||
| Sales | $18,000 | $24,000 | $28,000 | $36,000 | $42,000 | $41,000 | $38,000 | $29,000 | $21,000 | $13,000 | $13,000 | $13,000 | |
| Direct Cost of Sales | $9,000 | $12,000 | $14,000 | $18,000 | $21,000 | $20,500 | $19,000 | $14,500 | $10,500 | $6,500 | $6,500 | $6,500 | |
| Other Costs of Goods | $0 | $0 | $0 | $0 | $0 | $0 | $0 | $0 | $0 | $0 | $0 | $0 | |
| Total Cost of Sales | $9,000 | $12,000 | $14,000 | $18,000 | $21,000 | $20,500 | $19,000 | $14,500 | $10,500 | $6,500 | $6,500 | $6,500 | |
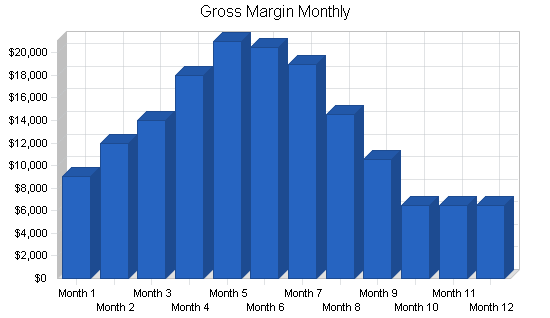
| Gross Margin | $9,000 | $12,000 | $14,000 | $18,000 | $21,000 | $20,500 | $19,000 | $14,500 | $10,500 | $6,500 | $6,500 | $6,500 | |
| Gross Margin % | 50.00% | 50.00% | 50.00% | 50.00% | 50.00% | 50.00% | 50.00% | 50.00% | 50.00% | 50.00% | 50.00% | 50.00% | |
| Expenses | |||||||||||||
| Payroll | $9,000 | $9,000 | $9,000 | $9,000 | $13,000 | $14,000 | $14,000 | $13,000 | $13,000 | $11,000 | $11,000 | $11,000 | |
| Sales and Marketing and Other Expenses | $500 | $500 | $500 | $500 | $500 | $500 | $500 | $500 | $500 | $500 | $500 | $500 | |
| Depreciation | $0 | $0 | $0 | $0 | $0 | $0 | $0 | $0 | $0 | $0 | $0 | $0 | |
| Rent | $1,000 | $1,000 | $1,000 | $1,000 | $1,000 | $1,000 | $1,000 | $1,000 | $1,000 | $1,000 | $1,000 | $1,000 | |
| Utilities | $300 | $300 | $300 | $300 | $300 | $300 | $300 | $300 | $300 | $300 | $300 | $300 | |
| Insurance | 15% | $300 | $0 | $0 | $0 | $0 | $300 | $0 | $0 | $0 | $0 | $0 | $0 |
| Payroll Taxes | 15% | $1,350 | $1,350 | $1,350 | $1,350 | $1,950 | $2,100 | $2,100 | $1,950 | $1,950 | $1,650 | $1,650 | $1,650 |
| Total Operating Expenses | $12,450 | $12,150 | $12,150 | $12,150 | $16,750 | $18,200 | $17,900 | $16,750 | $16,750 | $14,450 | $14,450 | $14,450 | |
| Profit Before Interest and Taxes | ($3,450) | ($150) | $1,850 | $5,850 | $4,250 | $2,300 | $1,100 | ($2,250) | ($6,250) | ($7,950) | ($7,950) | ($7,950) | |
| EBITDA | ($3,450) | ($150) | $1,850 | $5,850 | $4,250 | $2,300 | $1,100 | ($2,250) | ($6,250) | ($7,950) | ($7,950) | ($7,950) | |
| Interest Expense | $0 | $0 | $0 | $0 | $0 | $0 | $0 | $0 | $0 | $0 | $0 | $0 | |
| Taxes Incurred | $0 | $0 | $0 | $0 | $0 | $0 | $0 | $0 | $0 | $0 | $0 | $0 | |
| Net Profit | ($3,450) | ($150) | $1,850 | $5,850 | $4,250 | $2,300 | $1,100 | ($2,250) | ($6,250) | ($7,950) | ($7,950) | ($7,950) | |
| Net Profit/Sales | -19.17% | -0.63% | 6.61% | 16.25% | 10.12% | 5.61% | 2.89% | -7.76% | -29.76% | -61.15% | -61.15% | -61.15% | |
| Pro Forma Cash Flow | |||||||||||||
| Month 1 | Month 2 | Month 3 | Month 4 | Month 5 | Month 6 | Month 7 | Month 8 | Month 9 | Month 10 | Month 11 | Month 12 | ||
| Cash Received | |||||||||||||
| Cash from Operations | |||||||||||||
| Cash Sales | $4,500 | $6,000 | $7,000 | $9,000 | $10,500 | $10,250 | $9,500 | $7,250 | $5,250 | $3,250 | $3,250 | $3,250 | |
| Cash from Receivables | $0 | $450 | $13,650 | $18,100 | $21,200 | $27,150 | $31,475 | $30,675 | $28,275 | $21,550 | $15,550 | $9,750 | |
| Subtotal Cash from Operations | $4,500 | $6,450 | $20,650 | $27,100 | $31,700 | $37,400 | $40,975 | $37,925 | $33,525 | $24,800 | $18,800 | $13,000 | |
| Additional Cash Received | |||||||||||||
| Sales Tax, VAT, HST/GST Received | 0.00% | $0 | $0 | $0 | $0 | $0 | $0 | $0 | $0 | $0 | $0 | $0 | $0 |
| New Current Borrowing | $0 | $0 | $0 | $0 | $0 | $0 | $0 | $0 | $0 | $0 | $0 | $0 | |
| New Other Liabilities (interest-free) | $0 | $0 | $0 | $0 | $0 | $0 | $0 | $0 | $0 | $0 | $0 | $0 | |
| New Long-term Liabilities | $0 | $0 | $0 | $0 | $0 | $0 | $0 | $0 | $0 | $0 | $0 | $0 | |
| Sales of Other Current Assets | $0 | $0 | $0 | $0 | $0 | $0 | $0 | $0 | $0 | $0 | $0 | $0 | |
| Sales of Long-term Assets | $0 | $0 | $0 | $0 | $0 | $0 | $0 | $0 | $0 | $0 | $0 | $0 | |
| New Investment Received | $0 | $0 | $0 | $0 | $5,000 | $0 | $0 | $0 | $0 | $0 | $0 | $0 | |
| Subtotal Cash Received | $4,500 | $6,450 | $20,650 | $27,100 | $36,700 | $37,400 | $40,975 | $37,925 | $33,525 | $24,800 | $18,800 | $13,000 | |
| Expenditures | Month 1 | Month 2 | Month 3 | Month 4 | Month 5 | Month 6 | Month 7 | Month 8 | Month 9 | Month 10 | Month 11 | Month 12 | |
| Expenditures from Operations | |||||||||||||
| Cash Spending | $9,000 | $9,000 | $9,000 | $9,000 | $13,000 | $14,000 | $14,000 | $13,000 | $13,000 | $11,000 | $11,000 | $11,000 | |
| Bill Payments | $115 | $3,697 | $11,133 | $19,557 | $25,633 | $27,920 | $24,053 | $20,985 | $13,185 | $9,707 | $5,697 | $9,950 | |
| Subtotal Spent on Operations | $9,115 | $12,697 | $20,133 | $28,557 | $38,633 | $41,920 | $38,053 | $33,985 | $26,185 | $20,707 | $16,697 | $20,950 | |
| Additional Cash Spent | |||||||||||||
| Sales Tax, VAT, HST/GST Paid Out | $0 | $0 | $0 | $0 | $0 | $0 | $0 | $0 | $0 | $0 | $0 | $0 | |
| Principal Repayment of Current Borrowing | $0 | $0 | $0 | $0 | $0 | $0 | $0 | $0 | $0 | $0 | $0 | $0 | |
| Other Liabilities Principal Repayment | $0 | $0 | $0 | $0 | $0 | $0 | $0 | $0 | $0 | $0 | $0 | $0 | |
| Long-term Liabilities Principal Repayment | $0 | $0 | $0 | $0 | $0 | $0 | $0 | $0 | $0 | $0 | $0 | $0 | |
| Purchase Other Current Assets | $0 | $0 | $0 | $0 | $0 | $0 | $0 | $0 | $0 | $0 | $0 | $0 | |
| Purchase Long-term Assets | $0 | $0 | $0 | $0 | $0 | $0 | $0 | $0 | $0 | $0 | $0 | $0 | |
| Dividends | $0 | $0 | $0 | $0 | $0 | $0 | $0 | $0 | $0 | $0 | $0 | $0 | |
| Subtotal Cash Spent | $9,115 | $12,697 | $20,133 | $28,557 | $38,633 | $41,920 | $38,053 | $33,985 | $26,185 | $20,707 | $16,697 | $20,950 | |
| Net Cash Flow | ($4,615) | ($6,247) | $517 | ($1,457) | ($1,933) | ($4,520) | $2,922 | $3,940 | $7,340 | $4,093 | $2,103 | ($7,950) | |
| Cash Balance | $15,385 | $9,138 | $9,655 | $8,198 | $6,265 | $1,745 | $4,667 | $8,607 | $15,947 | $20,040 | $22,143 | $14,193 | |
| Pro Forma Balance Sheet | |||||||||||||
| Month 1 | Month 2 | Month 3 | Month 4 | Month 5 | Month 6 | Month 7 | Month 8 | Month 9 | Month 10 | Month 11 | Month 12 | ||
| Assets | Starting Balances | ||||||||||||
| Current Assets | |||||||||||||
| Cash | $20,000 | $15,385 | $9,138 | $9,655 | $8,198 | $6,265 | $1,745 | $4,667 | $8,607 | $15,947 | $20,040 | $22,143 | $14,193 |
| Accounts Receivable | $0 | $13,500 | $31,050 | $38,400 | $47,300 | $57,600 | $61,200 | $58,225 | $49,300 | $36,775 | $24,975 | $19,175 | $19,175 |
| Inventory | $26,500 | $17,500 | $13,200 | $15,400 | $19,800 | $23,100 | $22,550 | $20,900 | $15,950 | $11,550 | $7,150 | $7,150 | $7,150 |
| Other Current Assets | $0 | $0 | $0 | $0 | $0 | $0 | $0 | $0 | $0 | $0 | $0 | $0 | $0 |
| Total Current Assets | $46,500 | $46,385 | $53,388 | $63,455 | $75,298 | $86,965 | $85,495 | $83,792 | $73,857 | $64,272 | $52,165 | $48,468 | $40,518 |
| Long-term Assets | |||||||||||||
| Long-term Assets | $12,000 | $12,000 | $12,000 | $12,000 | $12,000 | $12,000 | $12,000 | $12,000 | $12,000 | $12,000 | $12,000 | $12,000 | $12,000 |
| Accumulated Depreciation | $0 | $0 | $0 | $0 | $0 | $0 | $0 | $0 | $0 | $0 | $0 | $0 | $0 |
| Total Long-term Assets | $12,000 | $12,000 | $12,000 | $12,000 | $12,000 | $12,000 | $12,000 | $12,000 | $12,000 | $12,000 | $12,000 | $12,000 | $12,000 |
| Total Assets | $58,500 | $58,385 | $65,388 | $75,455 | $87,298 | $98,965 | $97,495 | $95,792 | $85,857 | $76,272 | $64,165 | $60,468 | $52,518 |
| Liabilities and Capital | Month 1 | Month 2 | Month 3 | Month 4 | Month 5 | Month 6 | Month 7 | Month 8 | Month 9 | Month 10 | Month 11 | Month 12 | |
| Current Liabilities | |||||||||||||
| Accounts Payable | $0 | $3,335 | $10,488 | $18,705 | $24,698 | $27,115 | $23,345 | $20,542 | $12,857 | $9,522 | $5,365 | $9,618 | $9,618 |
| Current Borrowing | $0 | $0 | $0 | $0 | $0 | $0 | $0 | $0 | $0 | $0 | $0 | $0 | $0 |
| Other Current Liabilities | $0 | $0 | $0 | $0 | $0 | $0 | $0 | $0 | $0 | $0 | $0 | $0 | $0 |
| Subtotal Current Liabilities | $0 | $3,335 | $10,488 | $18,705 | $24,698 | $27,115 | $23,345 | $20,542 | $12,857 | $9,522 | $5,365 | $9,618 | $9,618 |
| Long-term Liabilities | $0 | $0 | $0 | $0 | $0 | $0 | $0 | $0 | $0 | $0 | $0 | $0 | $0 |
| Total Liabilities | $0 | $3,335 | $10,488 | $18,705 | $24,698 | $27,115 | $23,345 | $20,542 | $12,857 | $9,522 | $5,365 | $9,618 | $9,618 |
| Paid-in Capital | $100,000 | $100,000 | $100,000 | $100,000 | $100,000 | $105,000 | $105,000 | $105,000 | $105,000 | $105,000 | $105,000 | $105,000 | $105,000 |
| Retained Earnings | ($41,500) | ($41,500) | ($41,500) | ($41,500) | ($41,500) | ($41,500) | ($41,500) | ($41,500) | ($41,500) | ($41,500) | ($41,500) | ($41,500) | ($41,500) |
| Earnings | $0 | ($3,450) | ($3,600) | ($1,750) | $4,100 | $8,350 | $10,650 | $11,750 | $9,500 | $3,250 | ($4,700) | ($12,650) | ($20,600) |
| Total Capital | $58,500 | $55,050 | $54,900 | $56,750 | $62,600 | $71,850 | $74,150 | $75,250 | $73,000 | $66,750 | $58,800 | $50,850 | $42,900 |
| Total Liabilities and Capital | $58,500 | $58,385 | $65,388 | $75,455 | $87,298 | $98,965 | $97,495 | $95,792 | $85,857 | $76,272 | $64,165 | $60,468 | $52,518 |
| Net Worth | $58,500 | $55,050 | $54,900 | $56,750 | $62,600 | $71,850 | $74,150 | $75,250 | $73,000 | $66,750 | $58,800 | $50,850 | $42,900 |

