
Sit n' Caddy
Executive Summary
Garden Crafts Inc. has developed a new product, the Sit N’ Caddy, which it intends to produce and market. Garden Crafts has formulated a mission statement and strategy that will use value, quality, and a conscience in the development mix.
Garden Crafts will be incorporated in the state of Georgia as a Chapter S corporation, and will consist of two stockholders: Rob Kane and Keith Jones. The operational facilities will be located separately from the administration offices. Start-up costs have been projected with the bulk being provided by Mr. John Houseman, former owner of Kustom Kabinets. He has agreed to hold the equipment cost as a private note.
The product, the Sit N’ Caddy, is a combination stool/tool caddy, constructed out of premium grade hardwood. Market research has uncovered several products similar in nature, but none that were wood based and customizable to the degree of the Sit N’ Caddy.
Analysis of several markets points out Home Depot is the largest national retailer in home and garden supplies. This expanding market has experienced constant growth, showing double digit increases over the past three years. With two-thirds of homeowners spending an average of $532 annually on gardening products, this indicates a highly profitable future for Garden Crafts.
Since Home Depot was selected as our initial target for sales, our strategy will revolve around the Merchant that Home Depot uses as their regional buyer. With Home Depot as our sole customer, their merchant pricing system will dictate our sales price. Based on our costs, we have decided that $20 will be the lowest price that we will be willing to accept from Home Depot. With a single product and a standard price, the three-year forecast shows a direct result of the projected 11% growth rate.
Of the $10 cost per unit, it was determined that labor would account for $5 per unit. Rather than pay an hourly rate, it was decided that piece-rate would be the best option for future employees. The corporation will also pay a portion of net profits to the two founders as dividends. The remaining profits will be placed into an aggressive-growth mutual fund as a form of retained earnings.
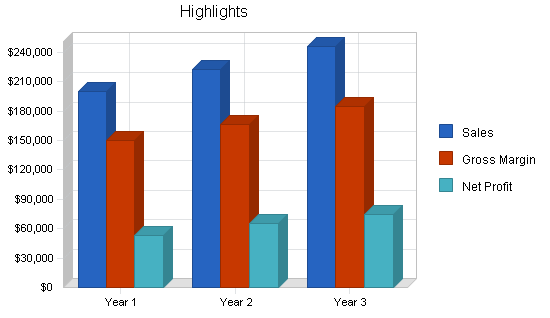
Gross sales figures show an increase over the three-year period, a natural result of our projection of an 11% growth rate. Operating expenses also show an increase, though not in lock-step with the sales trend. The slight deviation occurs from expenses that are prepaid in the first year, as well as some additional expenses that do not occur after the 15th month. Considering that the total first year production run will be sold to Home Depot, the profits for the first year sales are healthy, followed by modest growth in the second and third year. See the Highlights section of this business plan.
In short, Garden Crafts is positioned to reap healthy returns on a minimal investment. Major factors contributing to this success are the knowledge and skills of the founders, a commitment by Home Depot, uniqueness of design, and a continuous growth in the home and garden market.
1.1 Objectives
Objectives for Garden Crafts:
- Design and build a workshop capable of handling a yearly production of 10,000 units of the Sit N’ Caddy.
- Develop a brochure and specification sheet for the Sit N’ Caddy.
- Decrease production costs by increasing design efficiency.
1.2 Mission
Garden Crafts will strive for quality in its production and shipping processes. We intend to create a business based on a single product, the Sit N’ Caddy, a combination garden caddy/gardening stool. We will ensure safe working conditions for all employees, placing this as a priority above our profits.
We intend to use diverse marketing methods to reach a large segment of the gardening population to offer what we feel is a valuable asset to any gardener’s shed. Garden Crafts will also keep an open mind with regards to new methods of production, changes to our product line, and custom orders from interested clients.
We will always keep our profits in mind, but never at the expense of our customers.
1.3 Keys to Success
Our keys to success will be:
- Effective promotions; we can’t sell if we aren’t visible to the gardening enthusiasts.
- Efficiency in production; minimal waste will be a large part of our success.
- Flexibility; this product is designed for gardeners, so when they offer new ideas, we will listen.
- Thinking outside of the box; we will not limit ourselves to a single concept. New opportunities will present themselves and we must watch for, and be open to, them.
Company Summary
Garden Crafts is a small business subchapter S privately-held corporation with sales and production facilities located in Alpharetta, Georgia. Entrepreneur Keith Jones designed the prototype of Sit N’ Caddy, and has joined business forces with Rob Kane to market and produce this unique product The corporation will target its initial annual production at 10,000 units.
Garden Crafts’ sales and administration will be located in a home office shared by Mr. Jones’ Internet mail order business in Alpharetta. Mrs. Jill Jones will handle a majority of these duties.
Production facilities will be housed in an existing wood cabinet shop in Roswell, Georgia. The existing equipment was sold to Garden Crafts by the retiring owner. The building will be rented on a six-month lease with a month-to-month extension. Messrs. Jones and Kane will manufacture the product on a part-time production schedule.
2.1 Company Ownership
The corporate name of Garden Crafts was researched in the Georgia Department of State database, and has been reserved.
Garden Crafts will file articles of subchapter S incorporation in Fulton County, Georgia.
The corporation will have no more than 35 shareholders. It will only have individuals, estates, or certain trusts as shareholders, it will not have nonresident, alien shareholders. It will have only one class of stock.
At that time of filing with the State of Georgia, IRS form 2553 will be filed with approval of the board of directors and shareholders for subchapter S election. The fiscal year will coincide with the calendar year.
The Board of Directors will have the following members:
Mr. Keith Jones of Alpharetta, Ga., Mr. Rob Kane of Marietta, Ga., Ms. Jill Jones of Alpharetta, Ga., Mr. David Hogan CPA of Atlanta, Ga., and Mr. Ted Barner PA of Roswell, Ga.
President and Secretary of the corporation will be Keith Jones of Alpharetta, Georgia, Vice-President and Treasurer will Rob Kane of Marietta, Georgia.
Under the securities laws of Georgia, issuing stock to organizers, officers, and family members are exempt from registration. Hence, under the articles of incorporation, the directors will authorize 1,000 issued shares in Garden Crafts. Mr. Jones will be issued 100 shares (50% ownership), and Mr. Kane will be issued 100 shares (50% ownership). In consideration for each share issued, the shareholder will have a capital requirement of $20. Additional capitalization may be raised by owner’s contribution in return for additional stock, or by loan.
2.2 Start-up Summary
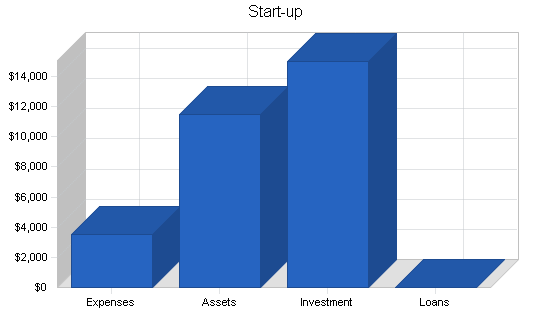
Our total start-up costs are projected in the tables and chart below. The majority of this cost is associated with a note held by Mr. John Houseman, former owner of Kustom Kabinets. He has agreed to sell us the equipment and supplies used in his previous business. The remainder of expenses come from legal, office supplies, insurance, and rent. The building that formerly housed Kustom Kabinets will be leased on a six-month basis with an option to extend.

Capital will also be raised by the sale of stock to the shareholders as outlined in the Company Ownership portion of this plan. Details are shown in the following chart and table.
| Start-up Funding | |
| Start-up Expenses to Fund | $3,500 |
| Start-up Assets to Fund | $11,500 |
| Total Funding Required | $15,000 |
| Assets | |
| Non-cash Assets from Start-up | $11,000 |
| Cash Requirements from Start-up | $500 |
| Additional Cash Raised | $0 |
| Cash Balance on Starting Date | $500 |
| Total Assets | $11,500 |
| Liabilities and Capital | |
| Liabilities | |
| Current Borrowing | $0 |
| Long-term Liabilities | $0 |
| Accounts Payable (Outstanding Bills) | $0 |
| Other Current Liabilities (interest-free) | $0 |
| Total Liabilities | $0 |
| Capital | |
| Planned Investment | |
| John Houseman – Cabinet Shop | $10,000 |
| Keith Jones – Stock Purchase | $2,500 |
| Rob Kane – Stock Purchase | $2,500 |
| Other | $0 |
| Additional Investment Requirement | $0 |
| Total Planned Investment | $15,000 |
| Loss at Start-up (Start-up Expenses) | ($3,500) |
| Total Capital | $11,500 |
| Total Capital and Liabilities | $11,500 |
| Total Funding | $15,000 |
| Start-up | |
| Requirements | |
| Start-up Expenses | |
| Incorporation and Tax Preparation | $380 |
| Stationery | $20 |
| Brochures and Promotional Materials | $200 |
| Consultants | $0 |
| Insurance Premium (First Year) | $500 |
| Rent (First Month) | $800 |
| Security Deposit | $800 |
| Expensed Equipment (First Payment) | $700 |
| Website | $100 |
| Other | $0 |
| Total Start-up Expenses | $3,500 |
| Start-up Assets | |
| Cash Required | $500 |
| Start-up Inventory | $1,000 |
| Other Current Assets | $10,000 |
| Long-term Assets | $0 |
| Total Assets | $11,500 |
| Total Requirements | $15,000 |
2.3 Company Locations and Facilities
Sales and Administration Office: Alpharetta, Georgia
Production facilities: Alpharetta, Georgia
Certified Public Accountant: David Hogan, Ronald Blue & Co. (Atlanta, Ga.)
Legal Counsel: Mr. Ted Barner, PA (Roswell, Ga.)
Products
Garden Crafts has designed a unique product for gardening enthusiasts. The Sit N’ Caddy acts as both a gardening stool and a portable tool box, allowing gardeners to carry their supplies to the garden, then sit in comfort as they weed or plant. This product can be sold as a kit, or completed with a customized finish for larger orders. Crafted from white oak, this item will prove to be as sturdy and useful as it is beautiful.
3.1 Product Description
The Sit N’ Caddy will be primarily available as an easy-to-assemble kit. Materials used in construction will be white oak and treated screws. Attention will be paid to ensure that assembly instructions are clear and concise. The Sit N’ Caddy will stand approximately 12″ tall and have an abundant carrying capacity.
Custom finishes, sizes, and assembly will be available for large orders.
3.2 Sales Literature
Garden Craft will create brochures and specification sheets to facilitate business-to-business sales. The brochure will list the features and benefits to consumers, while the fact sheet will give the retail business necessary information regarding construction, safety, and design.
3.3 Sourcing
Tools & General Equipment:
Hand tools and short-life equipment, such as saw-blades and router bits, will be purchased at Home Depot. An account will be opened with a $5,000 credit limit for these consumables, as well as for any emergency purchases, i.e. the replacement of a table saw.
Product Construction Materials:
Lumber, finishing materials and joining materials, will be purchased through Home Depot. Additional stores in the local area carrying similar products are Lowe’s and Ace Hardware, these will be utilized as well.
3.4 Technology
The Sit N’ Caddy is not covered by any patents or trademarks. This is an item that anyone with a small workshop could duplicate, so patents would not be feasible or necessary. Garden Crafts will depend on the low price gained from buying material in bulk and mass production. Product assembly requires no special knowledge, having been designed for ease and consistency. The materials involved allow for extensive decoration and modification by the customer, allowing for the possibility of bulk sales to fund-raising organizations.
3.5 Future Products
Because of the nature of our workshop, many different products can be fabricated with little extra cost. Additionally, customization for large orders may become feasible in the near future. Since this is a start-up business, it has been decided that the single product, Sit N’ Caddy, will be sufficient until we have determined whether or not our marketing plans are effective.
Market Analysis Summary
Sit N’ Caddy has no direct competition due its unique design and wood construction. For market analysis purposes, research was done on the lawn and garden industry, particularly in the small garden tool sector. Trade publication articles quoting national surveys pointed out the upswing of consumer interest in all sectors.
Garden Craft has decided to sell wholesale only, targeting select retailers. Initially, five segments of the retail industry have been identified: Chain-retailers, single retailers, fundraising organizations, mail order catalogs, and ‘other.’ Based on the ability of chain-retailers to buy in bulk, this segment was analyzed for market strength. Three target categories were identified as most likely to be interested in the Sit N’ Caddy. These categories are home-improvement, garden specialty, and gifts & crafts.
Of these three categories, home-improvement was selected based on the strength of their purchasing power, as well as the rate of growth shown in the industry (See Industry Analysis). Research has noted that Home Depot showed the highest sales volume in lawn and garden supplies among the home-improvement sector, thus providing Garden Craft with it’s initial sales prospect.
Supporting research shows that the definitive market research tool for the lawn and garden industry is the 1998-99 National Gardening Survey published by the National Gardening Association (NGA). This survey provides tables of customers divided by sex, age, education, occupation, race, income, region/section of the country, stage in life, size and type of community, home ownership, and size of household. Portions of the National Gardening Survey that have been published in various lawn and garden trade publications, gardening periodicals, and newspaper articles are used for consumer segmentation, trend analysis, and target market tasks.
4.1 Market Segmentation
The market segmentation focus is directed towards retail stores, rather than individual customer sales.
Major segments identified are:
- Chain retail
- Single store
- Mail order/Internet
- Fundraising organizations
- Other (cross-boundary stores, miscellaneous micro-segments)
Based on research and speculation, the decision was made to target chain retail stores that would offer the largest opportunity for volume sales.
Three categories of chain stores that would fit the product are:
- Home-improvement
- Garden specialty
- Gifts & crafts
In the industry analysis, it was noted that the majority of the 1998 top ten retailers of lawn and garden products were home-improvement stores. Concentrating research efforts in this area, the top three home-improvement retailers were found to be Home Depot, Lowe’s, and Ace Hardware.
Home Depot was selected as the best target due to their dominance in lawn and garden sales. This selection process is noted in the following chart and table.

| Market Analysis | |||||||
| Year 1 | Year 2 | Year 3 | Year 4 | Year 5 | |||
| Potential Customers | Growth | CAGR | |||||
| Magazine Customers | 25% | 700,000 | 875,000 | 1,093,750 | 1,367,188 | 1,708,985 | 25.00% |
| Internet Customers | 75% | 3,000,000 | 5,250,000 | 9,187,500 | 16,078,125 | 28,136,719 | 75.00% |
| Other | 10% | 500,000 | 550,000 | 605,000 | 665,500 | 732,050 | 10.00% |
| Total | 64.26% | 4,200,000 | 6,675,000 | 10,886,250 | 18,110,813 | 30,577,754 | 64.26% |
4.2 Target Market Segment Strategy
The following sections describe the various aspects of the market that will affect the success of the Sit N’ Caddy.
4.2.1 Market Trends
Quoted in the trade publication DSN Retailing Today (August 2000), a buyer for one of the mass merchants said he expected tabletop fountains and water garden accessories to increase in popularity.
Discount Store News mentioned in a 1998 article that small garden tool manufacturers were scaling down the size of their tools to make them easier for women and senior citizens to use.
An horticultural industry expert in 1998 noted that the increase in gardening activity is also tied to housing starts, which are high due to a strong economy. There is also an increase in rework of landscape materials in older neighborhoods.
In 1998, the NGA survey noted that American gardeners were shopping selectively at garden centers for merchandise they couldn’t find at home centers and discount stores. But the principal competitor is the well-run nursery.
4.2.2 Market Needs
Mark Smith, a spokesman for small tool manufacturer Ames-True Temper, noted that people are likely to shop for tools according to a specific task facing them. He said ergonomic features in tools continue to be important, and agreed that fashion has made its way into the garden. As an example, Ames-True Temper is launching two types of pruning tools with translucent handles.
The NGA survey points out that products which make gardening easier hold a particular draw for this group, such as ergonomic hand tools and riding lawn mowers. And people in their 50s spend significantly more money than others on container gardening, water gardens, and tree care.
The 1997 Consumer Expenditure Survey noted that the population of people over 50 have made health issues extremely important. There have been large jumps in spending on vitamins, medications, nutritional supplements, and health foods. Spending on fresh fruits and vegetables by consumers age 45 to 64 is the highest of any age group, gardening has now become an attractive alternative to the supermarket.
4.2.3 Market Growth
The National Gardening Survey points out that consumer interest in gardening remains as strong as ever, with two-thirds of homeowners spending an average of $532 annually on products to spruce up their yards. Purchases grew 11% last year to $33.5 billion. It marked the third straight year of double-digit sales gains.
According to Discount Store News (DSN), 13.8 million families bought cutting tools in 1996, which represents an annual growth rate of 12% over the previous five years. The price range for small tools is between $10-50.
The Scotts Company reports lawn and garden market growth to record levels. Sales in lawn and garden fertilizers plus potting soils have reached near 20%. Baby boomers are spending more on lawn and garden care.
Discount Store News made a recent Internet search, which revealed almost 1,700 gardening catalogs, and numerous online retailers, including Garden Escape, which reported nearly 1,000% growth from December 1996 to December 1997.
An horticultural industry consultant stated in 1998 that industry watchers agree, the biggest driving force in lawn and garden growth has been the emphasis of the big box retailers.
Mass merchants are treating lawn and garden as a real category. He said, “It’s going to continue to grow because of the expertise of the mass marketers.”
4.3 Industry Analysis
With such a robust lawn and garden market, the research director of the NGA expects Spring 2001 sales to surge once again. Products that are sure to be a sales hit next spring include even more decorative accessories and any type of product related to container gardening. Items that make a gardener’s job easier should also be a success, according to the NGA research director.
In 1998, the Santa Fe Springs, California chain store, Fedco, has gone after the casual gardener, rather than compete with Home Depot. During three store remodelings, Fedco doubled the size of the combined patio, lawn, and garden departments.
In 1998, horticulture industry experts noted:
- Wal-Mart has been steadily expanding its lawn and garden department, testing permanent greenhouses and increasing its commitment to the category as it rolls out new stores.
- Target operates a year-round live plant department inside some stores, and Kmart stands to profit from the impending introduction of Martha Stewart lawn and garden products at retail.
- The Martha Stewart line was introduced in 1999, and included annuals, perennials, seeds, pots, tools, and patio furniture.
- Home centers, such as Lowe’s and Home Depot, have come to dominate the market at the expense of traditional nurseries.
4.3.1 Distribution Patterns
Distribution among the chain-retail sector heavily involves the corporate buyer. This company representative determines the need for a product, as well as the quantity needed. Often, deals can be made or broken based on the perceived ability of a company to meet a set quota. Delivery is usually made to a centralized location, then distributed to the retail centers via the company’s own distribution system.
Single-store retail requires distribution to the Point of Sale (POS). The responsibility for this distribution usually falls on the supplier. Consideration must also be given to the quantity shipped, due to the warehousing constraints of a smaller outlet.
Most of the larger fundraiser operations have a centralized inventory system, much like the chain-retail sector. Shipment must be made to a warehouse location in large batches of product.
4.3.2 Industry Participants
Although home centers garner a good share of consumer lawn and garden dollars, retail chain estimates reported by DSN Retailing Today the affiliate publication of National Home Center News showed mass merchants becoming a destination for many shoppers. The top retailers of lawn and garden products last year, based on estimated local sales, in descending order were:
- Home Depot
- Kmart
- Wal-Mart
- Lowe’s
- Target
- Sears
- Frank’s Nursery
- Menard
- Homebase
As for purchase frequency, Wal-Mart grabs the top spot. A survey by the Home Improvement Research Institute, a subsidiary of DSN Retailing Today’s parent company Lebhar-Friedman, showed 20.8% of the respondents had purchased one or more of 15 lawn and garden products at that retailer last year. Home Depot placed second, with 17.6%, Kmart came in fifth, behind Lowe’s and Sears.
4.3.3 Competition and Buying Patterns
Among the retail businesses, competition tends to be less about products of similar nature and more about shelf space. Typical stores have limited display space and devote most of that space to brand name products. Many larger manufacturers offer the merchant some form of incentive, either as a discount, or through the use of promotional materials. In larger stores, with a multitude of offerings, visibility places a big part of customer selection.
One concern among most retail stores is that of supply. The manufacturer must have a system in place to ensure timely deliveries of the expected quota. Failure to fulfill these contracts can result in loss of exposure and loss of customers, and has been listed by the Small Business Administration (SBA) as one of the leading causes of failure among start-up manufacturers.
4.3.4 Main Competitors
Since Garden Crafts has no direct competitors for the Sit N’ Caddy, indirect competition will have to be addressed. Because of the dual nature of the product, both as a tool carrier and as a garden stool, two different types of products must be examined.
First, the garden stool. In a survey of local garden centers, the closest product to the Sit N’ Caddy was a kneepad for gardeners called the AirKnee. This air-filled cushion was found in Lowe’s, sharing shelf space with gardening gloves and other comfort items. This product sells for less than the Sit N’ Caddy, and takes less shelf space. However, it appears to be less sturdy in a garden environment, does not come with any patching materials, and most importantly, is not capable of being customized by the manufacturer or the customer.
Tool carriers come in many different styles and functions, giving us many indirect competitors. By narrowing the search down to those most commonly found in the gardening centers and sections, it was determined that the only types of carriers currently being sold in this area are canvas bags and straw baskets. Typically, these are not brand name items, but products that the retail outlet has either manufactured or bought in bulk with their own logo. These items tend to be less expensive and easier to store. They are not as durable as the Sit N’ Caddy, nor will they typically hold as many tools or supplies. They can be personalized by the customer, or ordered in bulk by the distributor.
Strategy and Implementation Summary
Garden Crafts will sell its entire production of the Sit N’ Caddy to Home Depot. Distribution will occur in select stores within the southeastern district. Marketing will be based on in-store promotions as well as packaging concepts. These promotions will be tied directly to Home Depot sales and promotions.
Garden Crafts has identified several key dates, known as milestones. These milestones are important events that must take place by a certain date. Several of these events will transpire prior to the first day of production, such as the incorporation process and the contract negotiation with Home Depot. Other events, like materials and equipment purchases, will take place when production starts.
5.1 Value Proposition
Research has not yet discovered a direct competitor for the Sit N’ Caddy. The dual purpose of this product gives it added value by combining two distinct and useful functions, each of which can stand on its own in the marketplace. The ability to paint and customize the look of this product will appeal to crafters, while the beauty of it without the paint will appeal to those looking strictly for functionality. Because the product can be shipped unassembled, space and stacking on the retail shelves becomes less of an issue than similar, bulky products.
5.2 Sales Strategy
Since Home Depot was selected as our initial target for sales, our strategy will revolve around the merchant that Home Depot uses as their regional buyer. Initial contact was made with Tiffany Dowling at corporate headquarters. From Ms. Dowling, we expect to receive a submittal package that will detail the documentation needed to submit our product for approval and acceptance.
As part of this approval process, we must sell the merchant on such features as safety, quality of materials, production capacity, and our commitment to Home Depot.
5.2.1 Sales Forecast
With a single product and a standard price, the three-year forecast shows a direct result of the projected 11% growth rate. The following chart gives projections on a monthly basis, and the table provides yearly estimates. The variety in sales comes from the seasonal nature of this type of product.


5.3 Competitive Edge
Our competitive edge is our product’s unique and functional ergonomics, coupled with traditional high-quality furniture workmanship. Sit N’ Caddy can create comfort and utility, while also displaying the aesthetic beauty of a finely crafted decorative wood. The market is flooded with examples of cheap plastic garden stools and tool boxes with limited durability and eye appeal. Sit N’ Caddy is the ideal gift, but can also function as value-added gift packaging for small garden tool products.
5.4 Marketing Strategy
Garden Crafts seeks to be positioned as the best utility garden tool in the retail chain market by offering a top-quality, fair priced, high-value product. Garden Craft Inc. will continue to target its present retail chain market, depending on product demand.
5.4.1 Promotion Strategy
Promotion will be handled in two sections. The first deals with in-store promotions, such as display units or strategic placement. The second section relies on piggy-back promotion in the Home Depot sales flyers.
In-store promotions to be explored are seasonal displays, product partnership with companies such as Scotts or Burpee seeds, cash-register placement, or do-it-yourself (DIY) in-store seminars. Home Depot uses regional merchants who act as account managers. They will be our main contact for this sort of promotion.
Mail-order coupons and piggy-back advertisement will constitute the bulk of our second phase of promotion. These will accompany local sales flyers placed by Home Depot. This section of our promotion plan will probably not be implemented until we cover a large region to justify the expense.
5.4.2 Distribution Strategy
Using Home Depot’s merchant services, distribution for Sit N’ Caddy will be dependent on available shelf space and POS promotion. Each store varies its inventory to fit the climate and customer demand. Garden Crafts will push for placement in those stores with the highest lawn and garden sales.
5.4.3 Marketing Programs
Our marketing strategy is to target the largest player in the home improvement retail chain, since that customer could purchase our entire annual production run. The National Garden Association’s survey estimates 11% of home improvement sales are in lawn and garden products. That figure is estimated to grow by double digit percentages.
Garden Craft Inc. has approached the Home Depot merchant program coordinator at their Atlanta headquarters for application into the program. Once the agreed-upon unit pricing and delivery schedule is finalized, a production schedule can be formulated. November 1, 2000 is the budgeted start-up of the operation.
5.4.4 Positioning Statement
Garden Crafts seeks to achieve preferential positioning for Sit N’ Caddy by having the product sold in the top home improvement retail chain in the country: Home Depot. Customers have developed a trust for Home Depot’s product line quality. Positioning our product in this retail market gives our product’s instant credibility for value.
5.4.5 Pricing Strategy
With Home Depot as our sole customer, pricing is dictated by their merchant pricing system. Based on our costs, we have decided that $20 will be the lowest price that we will be willing to accept from Home Depot.
5.5 Strategic Alliances
With a single customer such as Home Depot, Garden Crafts will be in a promotional partnership. The product will only be sold in Home Depot stores, which means that promotional events by Garden Crafts will have to include information on Home Depot. Because Home Depot is such a large company, Garden Crafts will benefit from the use of the large promotional division of Home Depot. Currently, there are no plans to market to other companies until a general sales trend has been established.
5.6 Milestones
Several of the milestones must be accomplished prior to the first day of business. These include the incorporation process, contract negotiations, and promotional materials.
Milestones that are scheduled for the first day of business are those that generally relate to the construction of the product, such as facilities, materials, and equipment.
The only element scheduled for a date after the business first opens is that of the website development. Since this site will be for informational purposes only, it was decided that it should be designed after the company has been in a productive state for a few months.
Management Summary
Currently, Garden Crafts has only two active personnel. Rob Kane and Keith Jones, co-founders of this company, will evenly split the labor duties as employees. The corporation will also pay a portion of net profits to the two founders as dividends. The remaining profits will be placed into an aggressive-growth mutual fund as a form of retained earnings.
The labor will be paid on a piece-rate method, rather than hourly. This will allow greater control in maintaining costs and efficiency by associating labor directly with product cost, rather than overhead. The only employees planned for at this time are the two founders, who will evenly split the work for a rate of $2.50 per piece produced.
6.1 Management Team
Keith Jones: President. Owned and managed a cabinet shop for six years. Has been involved with several start-up businesses.
Skills brought to this venture are: knowledge of shop functions and woodworking skills, experience with start-up planning, and the idea for the Sit N’ Caddy.
Rob Kane: Vice-President. Twenty-plus years in television news, B.S. in chemistry and business administration.
Knowledge that benefits the business: Experience in dealing with large corporations, previous participation in limited partnerships, strong financial background.
6.2 Management Team Gaps
Currently, only one team member is familiar with the construction of the Sit N’ Caddy, while the other team member controls the finances. A strengths/weakness analysis indicates that cross-training should take place at the earliest time possible. Until both members of management are familiar with all functions within the company, the potential for a loss of operations will exist should one member become incapacitated.
Once the company has progressed far enough to warrant the inclusion of hired help, the management team will also need to ensure proper communication exists between labor and management.
6.3 Personnel Plan
Of the $10 cost per unit, it was determined that labor would account for $5 per unit. Rather than pay on an hourly rate, it was decided that piece-rate would be best option for future employees. The corporation will also pay a portion of net profits to the two founders as dividends. The remaining profits will be placed into an aggressive-growth mutual fund as a form of retained earnings.
Currently, all labor will be done handled by the two founders, Rob Kane and Keith Jones. The piece-rate of $5 will be split evenly between the two until such time as another employee becomes necessary. Any additional employees will be added only when the cost per unit will not be significantly increased. This can occur either by increased efficiency, higher sales growth rates, or by replacing one or both of the founders.
The personnel table shows the projected labor costs for the next three years, based on the piece-rate method at $2.50 per piece.
| Personnel Plan | |||
| Year 1 | Year 2 | Year 3 | |
| Keith Jones | $25,000 | $27,750 | $30,802 |
| Rob Kane | $25,000 | $27,750 | $30,802 |
| Other | $0 | $0 | $0 |
| Total People | 2 | 2 | 2 |
| Total Payroll | $50,000 | $55,500 | $61,604 |
Financial Plan
The financial start-up plan for Garden Crafts is based on a capital contribution by the founding shareholders and the remaining capital produced from a short-term loan by the production facility seller.
The first year sales of the entire production inventory to one client will provide an adequate positive cash flow. The short-term loan will be retired in the second quarter of the second year. With the cost of goods sold and associated overhead matching the annual sales growth of 11%, the corporation projects an increase in net profits.
Proceeds will be distributed between a dividend and the remaining retained earnings parked in a short-term investment fund.
In conclusion, the financial plan appears solid.
7.1 Important Assumptions
Short- and long-term interest rates are an identical 10%. Garden Craft Inc. has agreed to purchase the shop machinery from the previous owner. The monthly payment of principal and interest appears as an expense in the profit and loss statement.
The inventory turnover rate is set at 12, since the production schedule will take into account the peaks and valleys of the seasonal sales forecast. Home Depot expects to receive two large shipments of approximately 3,500 units in April and November, and order in smaller quantities during the remainder of the year to handle inventory shortages.
On the advice of the retained CPA, Garden Craft Inc. will assume a tax liability of 25%.
Direct material costs will be billed to a contractor account at Home Depot. It is estimated that 10% of cash flow will be allocated to expenses.
The principal shareholders of the corporation have provided part of the necessary start-up capital with the balance financed to cover the note on the shop equipment purchase.
| General Assumptions | |||
| Year 1 | Year 2 | Year 3 | |
| Plan Month | 1 | 2 | 3 |
| Current Interest Rate | 10.00% | 10.00% | 10.00% |
| Long-term Interest Rate | 10.00% | 10.00% | 10.00% |
| Tax Rate | 25.42% | 25.00% | 25.42% |
| Other | 0 | 0 | 0 |
7.2 Key Financial Indicators
The indicators include sales, gross margin, operating expenses, inventory turnover, and collection days. The focus of this chart is not on gross amounts, but the changes over the three-year period of each indicator.
The gross sales figures show an increase over the three-year period, a natural result of our projection of an 11% growth rate. The operating expenses also show an increase, though not in lock-step with the sales trend. The slight deviation occurs from expenses that are prepaid in the first year, as well as some additional expenses that do not occur after the 15th month.
The other indicators remain constant, showing little change over the course of the projected three years.

7.3 Break-even Analysis
Break-even costs for this plan are divided into two categories: Per unit and fixed costs. Labor is placed under per unit, since the amount of labor will be directly tied in to the number of units produced. Construction and equipment loan payments, utilities, and administrative costs are calculated under fixed costs.
Since this is a start-up company, the price of the product may be adjusted according to customer demand. Our initial shop capacity should exceed our break-even point by at least a factor of three, allowing for future growth if demand should exceed expectations.

| Break-even Analysis | |
| Monthly Units Break-even | 439 |
| Monthly Revenue Break-even | $8,789 |
| Assumptions: | |
| Average Per-Unit Revenue | $20.00 |
| Average Per-Unit Variable Cost | $5.00 |
| Estimated Monthly Fixed Cost | $6,592 |
7.4 Projected Profit and Loss
Garden Craft has forecasted an annual increase of sales to be 11% over the first three years of the business plan. Considering that the total first year production run will be sold to Home Depot, the profits for the first year over sales are healthy, followed by modest growth in the second and third year.
Retirement of the note for the purchase of shop machinery in the 15th month of operation creates a cash flow debit starting in the 16th month. That money contributes to the increase in the corporation’s net profit margin, and a solid financial future. The retained earnings will be parked in a mutual fund investment until it is determined whether expansion of the corporation is feasible. That decision could come as early as the second year of operation with the exploration of other market segments.


| Pro Forma Profit and Loss | |||
| Year 1 | Year 2 | Year 3 | |
| Sales | $200,000 | $222,000 | $246,420 |
| Direct Cost of Sales | $50,000 | $55,500 | $61,605 |
| Other | $0 | $0 | $0 |
| Total Cost of Sales | $50,000 | $55,500 | $61,605 |
| Gross Margin | $150,000 | $166,500 | $184,815 |
| Gross Margin % | 75.00% | 75.00% | 75.00% |
| Expenses | |||
| Payroll | $50,000 | $55,500 | $61,604 |
| Sales and Marketing and Other Expenses | $1,500 | $400 | $400 |
| Depreciation | $0 | $0 | $0 |
| Equipment Payments | $7,700 | $2,100 | $0 |
| Utilities | $3,600 | $3,600 | $3,600 |
| Insurance | $0 | $500 | $500 |
| Shop Rent | $8,800 | $9,600 | $9,600 |
| Payroll Taxes | $7,500 | $8,325 | $9,241 |
| Other | $0 | $0 | $0 |
| Total Operating Expenses | $79,100 | $80,025 | $84,945 |
| Profit Before Interest and Taxes | $70,900 | $86,475 | $99,870 |
| EBITDA | $70,900 | $86,475 | $99,870 |
| Interest Expense | $0 | $0 | $0 |
| Taxes Incurred | $17,756 | $21,619 | $25,384 |
| Net Profit | $53,144 | $64,856 | $74,487 |
| Net Profit/Sales | 26.57% | 29.21% | 30.23% |
7.5 Projected Cash Flow
A key point to note on the cash flow is the fact that a part of all profits made during one month will be paid as dividends in the following month. This explains the dramatic decrease in cash flow during the month of May. Sales are projected to be very high in the previous month, yet very low in May. However, because of the large amount of profits that were realized in April, a good portion of the cash balance will be lowered when dividends are paid out of the account.
Half of all profits will be placed in a mutual fund with an estimated yield of 15%. This additional income to the company is labeled as Capital Input.
Because the cash balance is always positive, no additional funds or investments will be needed in the first three years.

| Pro Forma Cash Flow | |||
| Year 1 | Year 2 | Year 3 | |
| Cash Received | |||
| Cash from Operations | |||
| Cash Sales | $200,000 | $222,000 | $246,420 |
| Subtotal Cash from Operations | $200,000 | $222,000 | $246,420 |
| Additional Cash Received | |||
| Sales Tax, VAT, HST/GST Received | $0 | $0 | $0 |
| New Current Borrowing | $0 | $0 | $0 |
| New Other Liabilities (interest-free) | $0 | $0 | $0 |
| New Long-term Liabilities | $0 | $0 | $0 |
| Sales of Other Current Assets | $0 | $0 | $0 |
| Sales of Long-term Assets | $0 | $0 | $0 |
| New Investment Received | $0 | $0 | $0 |
| Subtotal Cash Received | $200,000 | $222,000 | $246,420 |
| Expenditures | Year 1 | Year 2 | Year 3 |
| Expenditures from Operations | |||
| Cash Spending | $50,000 | $55,500 | $61,604 |
| Bill Payments | $94,843 | $99,147 | $110,148 |
| Subtotal Spent on Operations | $144,843 | $154,647 | $171,752 |
| Additional Cash Spent | |||
| Sales Tax, VAT, HST/GST Paid Out | $0 | $0 | $0 |
| Principal Repayment of Current Borrowing | $0 | $0 | $0 |
| Other Liabilities Principal Repayment | $0 | $0 | $0 |
| Long-term Liabilities Principal Repayment | $0 | $0 | $0 |
| Purchase Other Current Assets | $0 | $0 | $0 |
| Purchase Long-term Assets | $0 | $0 | $0 |
| Dividends | $0 | $0 | $0 |
| Subtotal Cash Spent | $144,843 | $154,647 | $171,752 |
| Net Cash Flow | $55,157 | $67,353 | $74,668 |
| Cash Balance | $55,657 | $123,010 | $197,678 |
7.6 Projected Balance Sheet
Among the items in the Assets section of the Balance Sheet, only Cash shows any major change, doubling itself each year. Because liabilities do not demonstrate much change in the three year period, Cash has the greatest impact on Net Worth, giving it an upward trend. Again, because previously projected cash balances are all positive for the first three years, no changes to Liabilities are scheduled or anticipated.
| Pro Forma Balance Sheet | |||
| Year 1 | Year 2 | Year 3 | |
| Assets | |||
| Current Assets | |||
| Cash | $55,657 | $123,010 | $197,678 |
| Inventory | $4,400 | $4,884 | $5,421 |
| Other Current Assets | $10,000 | $10,000 | $10,000 |
| Total Current Assets | $70,057 | $137,894 | $213,099 |
| Long-term Assets | |||
| Long-term Assets | $0 | $0 | $0 |
| Accumulated Depreciation | $0 | $0 | $0 |
| Total Long-term Assets | $0 | $0 | $0 |
| Total Assets | $70,057 | $137,894 | $213,099 |
| Liabilities and Capital | Year 1 | Year 2 | Year 3 |
| Current Liabilities | |||
| Accounts Payable | $5,413 | $8,394 | $9,112 |
| Current Borrowing | $0 | $0 | $0 |
| Other Current Liabilities | $0 | $0 | $0 |
| Subtotal Current Liabilities | $5,413 | $8,394 | $9,112 |
| Long-term Liabilities | $0 | $0 | $0 |
| Total Liabilities | $5,413 | $8,394 | $9,112 |
| Paid-in Capital | $15,000 | $15,000 | $15,000 |
| Retained Earnings | ($3,500) | $49,644 | $114,500 |
| Earnings | $53,144 | $64,856 | $74,487 |
| Total Capital | $64,644 | $129,500 | $203,987 |
| Total Liabilities and Capital | $70,057 | $137,894 | $213,099 |
| Net Worth | $64,644 | $129,500 | $203,987 |
7.7 Business Ratios
The table below contains important business ratios for the wood products industry, as determined by the Standard Industry Classification (SIC) Index, 2499.
| Ratio Analysis | ||||
| Year 1 | Year 2 | Year 3 | Industry Profile | |
| Sales Growth | 0.00% | 11.00% | 11.00% | 2.50% |
| Percent of Total Assets | ||||
| Inventory | 6.28% | 3.54% | 2.54% | 30.30% |
| Other Current Assets | 14.27% | 7.25% | 4.69% | 16.40% |
| Total Current Assets | 100.00% | 100.00% | 100.00% | 67.90% |
| Long-term Assets | 0.00% | 0.00% | 0.00% | 32.10% |
| Total Assets | 100.00% | 100.00% | 100.00% | 100.00% |
| Current Liabilities | 7.73% | 6.09% | 4.28% | 33.10% |
| Long-term Liabilities | 0.00% | 0.00% | 0.00% | 13.50% |
| Total Liabilities | 7.73% | 6.09% | 4.28% | 46.60% |
| Net Worth | 92.27% | 93.91% | 95.72% | 53.40% |
| Percent of Sales | ||||
| Sales | 100.00% | 100.00% | 100.00% | 100.00% |
| Gross Margin | 75.00% | 75.00% | 75.00% | 28.80% |
| Selling, General & Administrative Expenses | 48.41% | 45.79% | 44.60% | 15.40% |
| Advertising Expenses | 0.75% | 0.00% | 0.00% | 0.40% |
| Profit Before Interest and Taxes | 35.45% | 38.95% | 40.53% | 5.50% |
| Main Ratios | ||||
| Current | 12.94 | 16.43 | 23.39 | 2.08 |
| Quick | 12.13 | 15.85 | 22.79 | 0.96 |
| Total Debt to Total Assets | 7.73% | 6.09% | 4.28% | 46.60% |
| Pre-tax Return on Net Worth | 109.68% | 66.78% | 48.96% | 11.40% |
| Pre-tax Return on Assets | 101.20% | 62.71% | 46.87% | 21.40% |
| Additional Ratios | Year 1 | Year 2 | Year 3 | |
| Net Profit Margin | 26.57% | 29.21% | 30.23% | n.a |
| Return on Equity | 82.21% | 50.08% | 36.52% | n.a |
| Activity Ratios | ||||
| Inventory Turnover | 8.13 | 11.96 | 11.96 | n.a |
| Accounts Payable Turnover | 18.52 | 12.17 | 12.17 | n.a |
| Payment Days | 27 | 25 | 29 | n.a |
| Total Asset Turnover | 2.85 | 1.61 | 1.16 | n.a |
| Debt Ratios | ||||
| Debt to Net Worth | 0.08 | 0.06 | 0.04 | n.a |
| Current Liab. to Liab. | 1.00 | 1.00 | 1.00 | n.a |
| Liquidity Ratios | ||||
| Net Working Capital | $64,644 | $129,500 | $203,987 | n.a |
| Interest Coverage | 0.00 | 0.00 | 0.00 | n.a |
| Additional Ratios | ||||
| Assets to Sales | 0.35 | 0.62 | 0.86 | n.a |
| Current Debt/Total Assets | 8% | 6% | 4% | n.a |
| Acid Test | 12.13 | 15.85 | 22.79 | n.a |
| Sales/Net Worth | 3.09 | 1.71 | 1.21 | n.a |
| Dividend Payout | 0.00 | 0.00 | 0.00 | n.a |
Appendix
| Sales Forecast | |||||||||||||
| Month 1 | Month 2 | Month 3 | Month 4 | Month 5 | Month 6 | Month 7 | Month 8 | Month 9 | Month 10 | Month 11 | Month 12 | ||
| Unit Sales | |||||||||||||
| Sit N’ Caddy | 0% | 100 | 500 | 500 | 700 | 1,700 | 2,000 | 200 | 100 | 1,000 | 1,200 | 1,200 | 800 |
| Other | 0% | 0 | 0 | 0 | 0 | 0 | 0 | 0 | 0 | 0 | 0 | 0 | 0 |
| Total Unit Sales | 100 | 500 | 500 | 700 | 1,700 | 2,000 | 200 | 100 | 1,000 | 1,200 | 1,200 | 800 | |
| Unit Prices | Month 1 | Month 2 | Month 3 | Month 4 | Month 5 | Month 6 | Month 7 | Month 8 | Month 9 | Month 10 | Month 11 | Month 12 | |
| Sit N’ Caddy | $20.00 | $20.00 | $20.00 | $20.00 | $20.00 | $20.00 | $20.00 | $20.00 | $20.00 | $20.00 | $20.00 | $20.00 | |
| Other | $0.00 | $0.00 | $0.00 | $0.00 | $0.00 | $0.00 | $0.00 | $0.00 | $0.00 | $0.00 | $0.00 | $0.00 | |
| Sales | |||||||||||||
| Sit N’ Caddy | $2,000 | $10,000 | $10,000 | $14,000 | $34,000 | $40,000 | $4,000 | $2,000 | $20,000 | $24,000 | $24,000 | $16,000 | |
| Other | $0 | $0 | $0 | $0 | $0 | $0 | $0 | $0 | $0 | $0 | $0 | $0 | |
| Total Sales | $2,000 | $10,000 | $10,000 | $14,000 | $34,000 | $40,000 | $4,000 | $2,000 | $20,000 | $24,000 | $24,000 | $16,000 | |
| Direct Unit Costs | Month 1 | Month 2 | Month 3 | Month 4 | Month 5 | Month 6 | Month 7 | Month 8 | Month 9 | Month 10 | Month 11 | Month 12 | |
| Sit N’ Caddy | 0.00% | $5.00 | $5.00 | $5.00 | $5.00 | $5.00 | $5.00 | $5.00 | $5.00 | $5.00 | $5.00 | $5.00 | $5.00 |
| Other | 0.00% | $0.00 | $0.00 | $0.00 | $0.00 | $0.00 | $0.00 | $0.00 | $0.00 | $0.00 | $0.00 | $0.00 | $0.00 |
| Direct Cost of Sales | |||||||||||||
| Sit N’ Caddy | $500 | $2,500 | $2,500 | $3,500 | $8,500 | $10,000 | $1,000 | $500 | $5,000 | $6,000 | $6,000 | $4,000 | |
| Other | $0 | $0 | $0 | $0 | $0 | $0 | $0 | $0 | $0 | $0 | $0 | $0 | |
| Subtotal Direct Cost of Sales | $500 | $2,500 | $2,500 | $3,500 | $8,500 | $10,000 | $1,000 | $500 | $5,000 | $6,000 | $6,000 | $4,000 | |
| Personnel Plan | |||||||||||||
| Month 1 | Month 2 | Month 3 | Month 4 | Month 5 | Month 6 | Month 7 | Month 8 | Month 9 | Month 10 | Month 11 | Month 12 | ||
| Keith Jones | 0% | $250 | $1,250 | $1,250 | $1,750 | $4,250 | $5,000 | $500 | $250 | $2,500 | $3,000 | $3,000 | $2,000 |
| Rob Kane | 0% | $250 | $1,250 | $1,250 | $1,750 | $4,250 | $5,000 | $500 | $250 | $2,500 | $3,000 | $3,000 | $2,000 |
| Other | 0% | $0 | $0 | $0 | $0 | $0 | $0 | $0 | $0 | $0 | $0 | $0 | $0 |
| Total People | 2 | 2 | 2 | 2 | 2 | 2 | 2 | 2 | 2 | 2 | 2 | 2 | |
| Total Payroll | $500 | $2,500 | $2,500 | $3,500 | $8,500 | $10,000 | $1,000 | $500 | $5,000 | $6,000 | $6,000 | $4,000 | |
| General Assumptions | |||||||||||||
| Month 1 | Month 2 | Month 3 | Month 4 | Month 5 | Month 6 | Month 7 | Month 8 | Month 9 | Month 10 | Month 11 | Month 12 | ||
| Plan Month | 1 | 2 | 3 | 4 | 5 | 6 | 7 | 8 | 9 | 10 | 11 | 12 | |
| Current Interest Rate | 10.00% | 10.00% | 10.00% | 10.00% | 10.00% | 10.00% | 10.00% | 10.00% | 10.00% | 10.00% | 10.00% | 10.00% | |
| Long-term Interest Rate | 10.00% | 10.00% | 10.00% | 10.00% | 10.00% | 10.00% | 10.00% | 10.00% | 10.00% | 10.00% | 10.00% | 10.00% | |
| Tax Rate | 30.00% | 25.00% | 25.00% | 25.00% | 25.00% | 25.00% | 25.00% | 25.00% | 25.00% | 25.00% | 25.00% | 25.00% | |
| Other | 0 | 0 | 0 | 0 | 0 | 0 | 0 | 0 | 0 | 0 | 0 | 0 | |
| Pro Forma Profit and Loss | |||||||||||||
| Month 1 | Month 2 | Month 3 | Month 4 | Month 5 | Month 6 | Month 7 | Month 8 | Month 9 | Month 10 | Month 11 | Month 12 | ||
| Sales | $2,000 | $10,000 | $10,000 | $14,000 | $34,000 | $40,000 | $4,000 | $2,000 | $20,000 | $24,000 | $24,000 | $16,000 | |
| Direct Cost of Sales | $500 | $2,500 | $2,500 | $3,500 | $8,500 | $10,000 | $1,000 | $500 | $5,000 | $6,000 | $6,000 | $4,000 | |
| Other | $0 | $0 | $0 | $0 | $0 | $0 | $0 | $0 | $0 | $0 | $0 | $0 | |
| Total Cost of Sales | $500 | $2,500 | $2,500 | $3,500 | $8,500 | $10,000 | $1,000 | $500 | $5,000 | $6,000 | $6,000 | $4,000 | |
| Gross Margin | $1,500 | $7,500 | $7,500 | $10,500 | $25,500 | $30,000 | $3,000 | $1,500 | $15,000 | $18,000 | $18,000 | $12,000 | |
| Gross Margin % | 75.00% | 75.00% | 75.00% | 75.00% | 75.00% | 75.00% | 75.00% | 75.00% | 75.00% | 75.00% | 75.00% | 75.00% | |
| Expenses | |||||||||||||
| Payroll | $500 | $2,500 | $2,500 | $3,500 | $8,500 | $10,000 | $1,000 | $500 | $5,000 | $6,000 | $6,000 | $4,000 | |
| Sales and Marketing and Other Expenses | $0 | $500 | $0 | $0 | $500 | $500 | $0 | $0 | $0 | $0 | $0 | $0 | |
| Depreciation | $0 | $0 | $0 | $0 | $0 | $0 | $0 | $0 | $0 | $0 | $0 | $0 | |
| Equipment Payments | $0 | $700 | $700 | $700 | $700 | $700 | $700 | $700 | $700 | $700 | $700 | $700 | |
| Utilities | $300 | $300 | $300 | $300 | $300 | $300 | $300 | $300 | $300 | $300 | $300 | $300 | |
| Insurance | $0 | $0 | $0 | $0 | $0 | $0 | $0 | $0 | $0 | $0 | $0 | $0 | |
| Shop Rent | $0 | $800 | $800 | $800 | $800 | $800 | $800 | $800 | $800 | $800 | $800 | $800 | |
| Payroll Taxes | 15% | $75 | $375 | $375 | $525 | $1,275 | $1,500 | $150 | $75 | $750 | $900 | $900 | $600 |
| Other | $0 | $0 | $0 | $0 | $0 | $0 | $0 | $0 | $0 | $0 | $0 | $0 | |
| Total Operating Expenses | $875 | $5,175 | $4,675 | $5,825 | $12,075 | $13,800 | $2,950 | $2,375 | $7,550 | $8,700 | $8,700 | $6,400 | |
| Profit Before Interest and Taxes | $625 | $2,325 | $2,825 | $4,675 | $13,425 | $16,200 | $50 | ($875) | $7,450 | $9,300 | $9,300 | $5,600 | |
| EBITDA | $625 | $2,325 | $2,825 | $4,675 | $13,425 | $16,200 | $50 | ($875) | $7,450 | $9,300 | $9,300 | $5,600 | |
| Interest Expense | $0 | $0 | $0 | $0 | $0 | $0 | $0 | $0 | $0 | $0 | $0 | $0 | |
| Taxes Incurred | $188 | $581 | $706 | $1,169 | $3,356 | $4,050 | $13 | ($219) | $1,863 | $2,325 | $2,325 | $1,400 | |
| Net Profit | $438 | $1,744 | $2,119 | $3,506 | $10,069 | $12,150 | $38 | ($656) | $5,588 | $6,975 | $6,975 | $4,200 | |
| Net Profit/Sales | 21.88% | 17.44% | 21.19% | 25.04% | 29.61% | 30.38% | 0.94% | -32.81% | 27.94% | 29.06% | 29.06% | 26.25% | |
| Pro Forma Cash Flow | |||||||||||||
| Month 1 | Month 2 | Month 3 | Month 4 | Month 5 | Month 6 | Month 7 | Month 8 | Month 9 | Month 10 | Month 11 | Month 12 | ||
| Cash Received | |||||||||||||
| Cash from Operations | |||||||||||||
| Cash Sales | $2,000 | $10,000 | $10,000 | $14,000 | $34,000 | $40,000 | $4,000 | $2,000 | $20,000 | $24,000 | $24,000 | $16,000 | |
| Subtotal Cash from Operations | $2,000 | $10,000 | $10,000 | $14,000 | $34,000 | $40,000 | $4,000 | $2,000 | $20,000 | $24,000 | $24,000 | $16,000 | |
| Additional Cash Received | |||||||||||||
| Sales Tax, VAT, HST/GST Received | 0.00% | $0 | $0 | $0 | $0 | $0 | $0 | $0 | $0 | $0 | $0 | $0 | $0 |
| New Current Borrowing | $0 | $0 | $0 | $0 | $0 | $0 | $0 | $0 | $0 | $0 | $0 | $0 | |
| New Other Liabilities (interest-free) | $0 | $0 | $0 | $0 | $0 | $0 | $0 | $0 | $0 | $0 | $0 | $0 | |
| New Long-term Liabilities | $0 | $0 | $0 | $0 | $0 | $0 | $0 | $0 | $0 | $0 | $0 | $0 | |
| Sales of Other Current Assets | $0 | $0 | $0 | $0 | $0 | $0 | $0 | $0 | $0 | $0 | $0 | $0 | |
| Sales of Long-term Assets | $0 | $0 | $0 | $0 | $0 | $0 | $0 | $0 | $0 | $0 | $0 | $0 | |
| New Investment Received | $0 | $0 | $0 | $0 | $0 | $0 | $0 | $0 | $0 | $0 | $0 | $0 | |
| Subtotal Cash Received | $2,000 | $10,000 | $10,000 | $14,000 | $34,000 | $40,000 | $4,000 | $2,000 | $20,000 | $24,000 | $24,000 | $16,000 | |
| Expenditures | Month 1 | Month 2 | Month 3 | Month 4 | Month 5 | Month 6 | Month 7 | Month 8 | Month 9 | Month 10 | Month 11 | Month 12 | |
| Expenditures from Operations | |||||||||||||
| Cash Spending | $500 | $2,500 | $2,500 | $3,500 | $8,500 | $10,000 | $1,000 | $500 | $5,000 | $6,000 | $6,000 | $4,000 | |
| Bill Payments | $52 | $1,744 | $6,952 | $5,472 | $8,522 | $20,884 | $18,915 | $1,952 | $1,781 | $5,636 | $12,088 | $10,844 | |
| Subtotal Spent on Operations | $552 | $4,244 | $9,452 | $8,972 | $17,022 | $30,884 | $19,915 | $2,452 | $6,781 | $11,636 | $18,088 | $14,844 | |
| Additional Cash Spent | |||||||||||||
| Sales Tax, VAT, HST/GST Paid Out | $0 | $0 | $0 | $0 | $0 | $0 | $0 | $0 | $0 | $0 | $0 | $0 | |
| Principal Repayment of Current Borrowing | $0 | $0 | $0 | $0 | $0 | $0 | $0 | $0 | $0 | $0 | $0 | $0 | |
| Other Liabilities Principal Repayment | $0 | $0 | $0 | $0 | $0 | $0 | $0 | $0 | $0 | $0 | $0 | $0 | |
| Long-term Liabilities Principal Repayment | $0 | $0 | $0 | $0 | $0 | $0 | $0 | $0 | $0 | $0 | $0 | $0 | |
| Purchase Other Current Assets | $0 | $0 | $0 | $0 | $0 | $0 | $0 | $0 | $0 | $0 | $0 | $0 | |
| Purchase Long-term Assets | $0 | $0 | $0 | $0 | $0 | $0 | $0 | $0 | $0 | $0 | $0 | $0 | |
| Dividends | $0 | $0 | $0 | $0 | $0 | $0 | $0 | $0 | $0 | $0 | $0 | $0 | |
| Subtotal Cash Spent | $552 | $4,244 | $9,452 | $8,972 | $17,022 | $30,884 | $19,915 | $2,452 | $6,781 | $11,636 | $18,088 | $14,844 | |
| Net Cash Flow | $1,448 | $5,756 | $548 | $5,028 | $16,978 | $9,116 | ($15,915) | ($452) | $13,219 | $12,364 | $5,912 | $1,156 | |
| Cash Balance | $1,948 | $7,704 | $8,252 | $13,280 | $30,259 | $39,375 | $23,460 | $23,007 | $36,226 | $48,590 | $54,501 | $55,657 | |
| Pro Forma Balance Sheet | |||||||||||||
| Month 1 | Month 2 | Month 3 | Month 4 | Month 5 | Month 6 | Month 7 | Month 8 | Month 9 | Month 10 | Month 11 | Month 12 | ||
| Assets | Starting Balances | ||||||||||||
| Current Assets | |||||||||||||
| Cash | $500 | $1,948 | $7,704 | $8,252 | $13,280 | $30,259 | $39,375 | $23,460 | $23,007 | $36,226 | $48,590 | $54,501 | $55,657 |
| Inventory | $1,000 | $1,500 | $2,750 | $2,750 | $3,850 | $9,350 | $11,000 | $10,000 | $9,500 | $5,500 | $6,600 | $6,600 | $4,400 |
| Other Current Assets | $10,000 | $10,000 | $10,000 | $10,000 | $10,000 | $10,000 | $10,000 | $10,000 | $10,000 | $10,000 | $10,000 | $10,000 | $10,000 |
| Total Current Assets | $11,500 | $13,448 | $20,454 | $21,002 | $27,130 | $49,609 | $60,375 | $43,460 | $42,507 | $51,726 | $65,190 | $71,101 | $70,057 |
| Long-term Assets | |||||||||||||
| Long-term Assets | $0 | $0 | $0 | $0 | $0 | $0 | $0 | $0 | $0 | $0 | $0 | $0 | $0 |
| Accumulated Depreciation | $0 | $0 | $0 | $0 | $0 | $0 | $0 | $0 | $0 | $0 | $0 | $0 | $0 |
| Total Long-term Assets | $0 | $0 | $0 | $0 | $0 | $0 | $0 | $0 | $0 | $0 | $0 | $0 | $0 |
| Total Assets | $11,500 | $13,448 | $20,454 | $21,002 | $27,130 | $49,609 | $60,375 | $43,460 | $42,507 | $51,726 | $65,190 | $71,101 | $70,057 |
| Liabilities and Capital | Month 1 | Month 2 | Month 3 | Month 4 | Month 5 | Month 6 | Month 7 | Month 8 | Month 9 | Month 10 | Month 11 | Month 12 | |
| Current Liabilities | |||||||||||||
| Accounts Payable | $0 | $1,510 | $6,773 | $5,202 | $7,824 | $20,234 | $18,850 | $1,897 | $1,601 | $5,232 | $11,721 | $10,658 | $5,413 |
| Current Borrowing | $0 | $0 | $0 | $0 | $0 | $0 | $0 | $0 | $0 | $0 | $0 | $0 | $0 |
| Other Current Liabilities | $0 | $0 | $0 | $0 | $0 | $0 | $0 | $0 | $0 | $0 | $0 | $0 | $0 |
| Subtotal Current Liabilities | $0 | $1,510 | $6,773 | $5,202 | $7,824 | $20,234 | $18,850 | $1,897 | $1,601 | $5,232 | $11,721 | $10,658 | $5,413 |
| Long-term Liabilities | $0 | $0 | $0 | $0 | $0 | $0 | $0 | $0 | $0 | $0 | $0 | $0 | $0 |
| Total Liabilities | $0 | $1,510 | $6,773 | $5,202 | $7,824 | $20,234 | $18,850 | $1,897 | $1,601 | $5,232 | $11,721 | $10,658 | $5,413 |
| Paid-in Capital | $15,000 | $15,000 | $15,000 | $15,000 | $15,000 | $15,000 | $15,000 | $15,000 | $15,000 | $15,000 | $15,000 | $15,000 | $15,000 |
| Retained Earnings | ($3,500) | ($3,500) | ($3,500) | ($3,500) | ($3,500) | ($3,500) | ($3,500) | ($3,500) | ($3,500) | ($3,500) | ($3,500) | ($3,500) | ($3,500) |
| Earnings | $0 | $438 | $2,181 | $4,300 | $7,806 | $17,875 | $30,025 | $30,063 | $29,406 | $34,994 | $41,969 | $48,944 | $53,144 |
| Total Capital | $11,500 | $11,938 | $13,681 | $15,800 | $19,306 | $29,375 | $41,525 | $41,563 | $40,906 | $46,494 | $53,469 | $60,444 | $64,644 |
| Total Liabilities and Capital | $11,500 | $13,448 | $20,454 | $21,002 | $27,130 | $49,609 | $60,375 | $43,460 | $42,507 | $51,726 | $65,190 | $71,101 | $70,057 |
| Net Worth | $11,500 | $11,938 | $13,681 | $15,800 | $19,306 | $29,375 | $41,525 | $41,562 | $40,906 | $46,494 | $53,469 | $60,444 | $64,644 |


