
Trestle Creek Cabinets
Executive Summary
Trestle Creek Cabinets will be formed as a cabinet company specializing in custom cabinets for the high-end residential, resort, and commercial market. Its founders have extensive experience in the construction and cabinet industry. Trestle Creek Cabinets will operate under the umbrella of Trestle Creek, Inc., a construction company sharing staff, office space, and administration costs. However, for the purpose of business planning, we are treating Trestle Creek Cabinets as a separate company.
Over some years of being involved with the construction of luxury homes, the company owners have seen a need for a cabinet line with a broad selection of design choices, high-end finishes, along with top of the line organization, customer service, and quality. Trestle Creek Cabinets will meet those customers needs. Building a strong market position in the high-end residential, resort, and commercial development segments, the company projects revenues to grow substantially between FY1 and FY3. By maintaining an average gross margin of over 25%, the company estimates handsome net profits by FY3.
The company owners have provided the capital to cover the start-up expenses. The company currently seeks a 3-year commercial loan to cover the operating expenses.
1.1 Objectives
The company objectives are:
- To be a top cabinet supplier to luxury homes in the regional market.
- Revenues to more than double Year1 levels by the end of Year2.
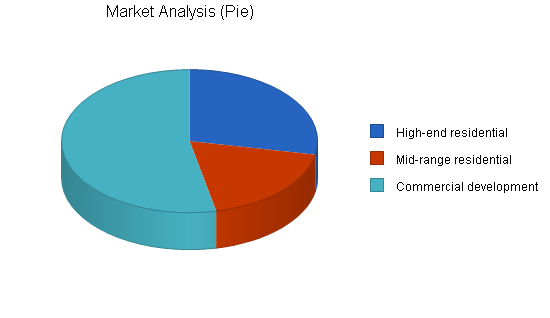
- Aim to have 70% of sales in high-end residential customer segment.
- 20% of sales in mid-range residential customer segment.
- 10% of sales in commercial development segment.
- To have a showroom within 3 months in a prominent retail space.
1.2 Mission
To deliver a high-quality product, on time and within budget while also providing a fast, error free ordering system.

Company Summary
Trestle Creek Cabinets is a new company that will provide expertise and quality in the cabinet supplier market while meeting the demanding organizational, scheduling, and quality needs of architects, owners, and construction professionals.
2.1 Start-up Summary
Total start-up expenses, including tools, software, stationery, and related expensesare shown below. Two co-owners, Martin Kribs and Brent Palmer, will provide the bulk of the start-up financing. At the same time, the company plans to receive a 3-year commercial loan facility, which will help meet the cash flow requirements.

| Start-up | |
| Requirements | |
| Start-up Expenses | |
| Business Cards | $100 |
| Drill Press | $1,916 |
| Cabinet Jacks | $713 |
| Kitchen Builder Software | $2,495 |
| Lateral File | $236 |
| Sign | $1,154 |
| Seat Cushions | $338 |
| Phone Transfer | $64 |
| First/Last/ Deposit | $2,400 |
| Marketing | $4,430 |
| Level Package | $1,005 |
| Sure Trak Software | $499 |
| Estimating Data Base | $2,200 |
| Software Lease Buyout | $7,092 |
| Total Start-up Expenses | $24,642 |
| Start-up Assets | |
| Cash Required | $89,299 |
| Other Current Assets | $14,478 |
| Long-term Assets | $0 |
| Total Assets | $103,777 |
| Total Requirements | $128,419 |
| Start-up Funding | |
| Start-up Expenses to Fund | $24,642 |
| Start-up Assets to Fund | $103,777 |
| Total Funding Required | $128,419 |
| Assets | |
| Non-cash Assets from Start-up | $14,478 |
| Cash Requirements from Start-up | $89,299 |
| Additional Cash Raised | $0 |
| Cash Balance on Starting Date | $89,299 |
| Total Assets | $103,777 |
| Liabilities and Capital | |
| Liabilities | |
| Current Borrowing | $0 |
| Long-term Liabilities | $40,000 |
| Accounts Payable (Outstanding Bills) | $0 |
| Other Current Liabilities (interest-free) | $0 |
| Total Liabilities | $40,000 |
| Capital | |
| Planned Investment | |
| Martin Kribs | $75,265 |
| Brent Palmer | $13,154 |
| Other | $0 |
| Additional Investment Requirement | $0 |
| Total Planned Investment | $88,419 |
| Loss at Start-up (Start-up Expenses) | ($24,642) |
| Total Capital | $63,777 |
| Total Capital and Liabilities | $103,777 |
| Total Funding | $128,419 |
Products
Our product is essentially made with two main components.
- The boxes and shelves will be ordered from two different suppliers (Cab Parts, Scheers), and will be delivered in kitset form. They can be finished with custom veneers.
- The doors, panels, and drawer fronts will come from four different suppliers: Bergmeyer Manufacturing, Homestead Woods, Decore, and Southwest Door Company. We will have 4-6 custom designs, with unlimited different custom finishes, available from Bergmeyer Manufacturing. The other suppliers will provide their stock products.
Market Analysis Summary
Trestle Creek Cabinets will be focusing on architects, owners, and contractors in the regional area who are involved in high-end residential, resort, and commercial development segments.
In 2000, a total of 219 new residential homes worth $168 million were constructed in the Teton County, WY. If we take an average of $40,000 per kitchen, (probably conservative), and multiply that by the 219 homes, that gives us a total of $8,760,000 in kitchens installed for the year. We plan to acquire 4-5% of the market share of this residential segment in our first year. We do not think this is unreachable, especially in a still growing market.
Teton County, Idaho has great potential as three new resort developments, Teton Springs Golf & Fishing Club, Grand Targhee Resort Expansion, and Teton Country Club, come on line.
The following table outlines to total market potential of the three major customer segments in the Teton County.
4.1 Target Market Segment Strategy
Trestle Creek Cabinets will be focusing on contacting contractors and architects that deal with the luxury home market. Making ourselves known to these entities will generate some strong leads, along with getting personal recommendations to the home owners.
There are plans to upgrade office space to a showroom in a high visibility location. This will give us exposure to new home builders that are looking for our product.
| Market Analysis | |||||||
| Year 1 | Year 2 | Year 3 | Year 4 | Year 5 | |||
| Potential Customers | Growth | CAGR | |||||
| High-end residential | 3% | 5,260 | 5,418 | 5,581 | 5,748 | 5,920 | 3.00% |
| Mid-range residential | 5% | 3,500 | 3,675 | 3,859 | 4,052 | 4,255 | 5.00% |
| Commercial development | 7% | 10,000 | 10,700 | 11,449 | 12,250 | 13,108 | 7.00% |
| Total | 5.55% | 18,760 | 19,793 | 20,889 | 22,050 | 23,283 | 5.55% |
4.2 Industry Analysis
There are two main types of cabinet suppliers in the industry.
- Resellers of complete cabinet sets using stock items where the cabinets turn up completely built. Usually have no shop facilities but do have show rooms.
- Custom shops with full, in-house fabrication facilities. They are usually very product orientated and under-perform with customer support.
Trestle Creek Cabinets can provide high volume work, superior project management, and excellent quality while maintaining a low overhead.
4.2.1 Competition and Buying Patterns
The high-end cabinet market understands the concept of service and support, and is more likely to pay for it when the offering is clearly stated.
There are many competitors in the local market. Although each of them deliver a quality product, we feel they fail to deliver a full turnkey package. There are four factors that govern the cost of all kitchen projects: Scope, Product, Design, and Services. Most people mistakenly think that the size of the project and the choice of brand name products will make for the best results. But it is the design and a company’s services that will have the greatest impact on the quality and value of the customers investment.
Strategy and Implementation Summary
Teton County, Wyoming and Idaho are experiencing steady growth in the high-end residential markets and there is a general consensus of continued growth in the area. Taking part in this growth, while providing attention to the design development, ordering process, project management, and installation will put us on the road to success.
5.1 Competitive Edge
Our competitive edge is our ability to provide high volumes and flexibility in style, while maintaining a quality product backed by excellent service.
5.2 Sales Strategy
Our sales strategy is to make ourselves known through mailings, print advertising, and personal contact to architects and contractors who are primarily involved with the design/construction of commercial development and luxury homes.
Having a showroom will be a sales tool in itself. A showroom will give us exposure to the general public, new arrivals to the area, and construction professionals.
5.2.1 Sales Forecast
The following table shows projected cabinet sales. As the company gets established in the market, we anticipate strong sales growth over the next three years.


| Sales Forecast | |||
| Year 1 | Year 2 | Year 3 | |
| Sales | |||
| Cabinets | $442,000 | $1,000,000 | $1,500,000 |
| Other | $0 | $0 | $0 |
| Total Sales | $442,000 | $1,000,000 | $1,500,000 |
| Direct Cost of Sales | Year 1 | Year 2 | Year 3 |
| Cabinets | $301,600 | $725,000 | $1,087,500 |
| Other | $0 | $0 | $0 |
| Subtotal Direct Cost of Sales | $301,600 | $725,000 | $1,087,500 |
5.3 Milestones
The accompanying table lists important program milestones, with dates and managers in charge, and budgets for each. The milestone schedule indicates our emphasis on planning for implementation.
| Milestones | |||||
| Milestone | Start Date | End Date | Budget | Manager | Department |
| Business Plan | 1/15/2001 | 1/31/2001 | $2,000 | Brent & Marty | Marketing |
| Online Research | 1/15/2001 | 1/19/2001 | $350 | Brent | Marketing |
| Open Accounts with Suppliers | 1/15/2001 | 1/26/2001 | $350 | Brent | Web |
| Door Research | 1/15/2001 | 1/26/2001 | $500 | Brent & Marty | Web |
| Design Doors | 1/15/2001 | 1/26/2001 | $450 | Marty | Department |
| Order Sample Doors | 1/22/2001 | 2/1/2001 | $1,000 | Marty | Department |
| Design Sales Literature | 1/22/2001 | 1/31/2001 | $1,000 | Brent & Marty | Department |
| Print Sales Literature | 2/1/2001 | 2/7/2001 | $300 | Brent | Department |
| Make Industry Contacts | 1/15/2001 | 2/28/2001 | $1,000 | Marty & Brent | Department |
| Showroom Feasability Study | 1/25/2001 | 1/31/2001 | $1,000 | Marty & Brent | Department |
| Totals | $7,950 | ||||
Management Summary
Martin Kribs, President, has 20 years of construction experience, from general contracting, construction management, and having his own cabinet business.
Brent Palmer, V. President, has three years of construction experience and spent the last six years in management within the hospitality industry.
As the company grows, we will take on an administration/showroom assistant.
6.1 Personnel Plan
This table shows salaries for the whole company. Salary increases are kept to a minimum to help the growth of the company. An administrative assistant will be hired later in the year.
Monthly details for this year can be found in the appendix.
| Personnel Plan | |||
| Year 1 | Year 2 | Year 3 | |
| Martin Kribs | $24,000 | $38,000 | $45,000 |
| Brent Palmer | $24,000 | $35,000 | $40,000 |
| Carpenters | $18,000 | $60,000 | $85,000 |
| Administration Assistant | $12,000 | $24,000 | $25,000 |
| Total People | 4 | 6 | 7 |
| Total Payroll | $78,000 | $157,000 | $195,000 |
Financial Plan
Below are the initial financial goals for the company:
- Obtain an operating line of credit from a financial institution.
- Finance growth through retained earnings.
- Operate on a 25-30% gross margin.
The financial plan for Trestle Creek Cabinets is outlined in the following sections.
7.1 Important Assumptions
The financial plan depends on important assumptions, most of which are shown in the following table as annual assumptions.
| General Assumptions | |||
| Year 1 | Year 2 | Year 3 | |
| Plan Month | 1 | 2 | 3 |
| Current Interest Rate | 10.00% | 10.00% | 10.00% |
| Long-term Interest Rate | 10.00% | 10.00% | 10.00% |
| Tax Rate | 16.25% | 15.00% | 16.25% |
| Other | 0 | 0 | 0 |
7.2 Break-even Analysis
As the business settles in and start-up/showroom costs are met, average monthly operating costs will increase and then stabilize. The average per unit price is for a 24″ base unit. This table shows we need to sell 16 units or 32 lineal feet of cabinets a month to break even.

| Break-even Analysis | |
| Monthly Revenue Break-even | $38,806 |
| Assumptions: | |
| Average Percent Variable Cost | 68% |
| Estimated Monthly Fixed Cost | $12,327 |
7.3 Projected Profit and Loss
Our projected profit and loss is shown in the following table.
| Pro Forma Profit and Loss | |||
| Year 1 | Year 2 | Year 3 | |
| Sales | $442,000 | $1,000,000 | $1,500,000 |
| Direct Cost of Sales | $301,600 | $725,000 | $1,087,500 |
| Other | $0 | $0 | $0 |
| Total Cost of Sales | $301,600 | $725,000 | $1,087,500 |
| Gross Margin | $140,400 | $275,000 | $412,500 |
| Gross Margin % | 31.76% | 27.50% | 27.50% |
| Expenses | |||
| Payroll | $78,000 | $157,000 | $195,000 |
| Sales and Marketing and Other Expenses | $45,680 | $44,600 | $61,000 |
| Depreciation | $0 | $0 | $0 |
| Utilities | $3,000 | $4,000 | $5,000 |
| Insurance | $1,140 | $1,300 | $1,500 |
| Rent | $8,400 | $9,000 | $12,000 |
| Payroll Taxes | $11,700 | $23,550 | $29,250 |
| Other | $0 | $0 | $0 |
| Total Operating Expenses | $147,920 | $239,450 | $303,750 |
| Profit Before Interest and Taxes | ($7,520) | $35,550 | $108,750 |
| EBITDA | ($7,520) | $35,550 | $108,750 |
| Interest Expense | $4,000 | $3,336 | $1,937 |
| Taxes Incurred | $0 | $4,832 | $17,357 |
| Net Profit | ($11,520) | $27,382 | $89,456 |
| Net Profit/Sales | -2.61% | 2.74% | 5.96% |
7.4 Projected Cash Flow
We do not expect to have major problems with cash flow as most of our contracts will require a 50% deposit upon signing.

| Pro Forma Cash Flow | |||
| Year 1 | Year 2 | Year 3 | |
| Cash Received | |||
| Cash from Operations | |||
| Cash Sales | $110,500 | $250,000 | $375,000 |
| Cash from Receivables | $281,813 | $687,272 | $1,068,792 |
| Subtotal Cash from Operations | $392,313 | $937,272 | $1,443,792 |
| Additional Cash Received | |||
| Sales Tax, VAT, HST/GST Received | $0 | $0 | $0 |
| New Current Borrowing | $0 | $0 | $0 |
| New Other Liabilities (interest-free) | $0 | $0 | $0 |
| New Long-term Liabilities | $0 | $0 | $0 |
| Sales of Other Current Assets | $0 | $0 | $0 |
| Sales of Long-term Assets | $0 | $0 | $0 |
| New Investment Received | $0 | $0 | $0 |
| Subtotal Cash Received | $392,313 | $937,272 | $1,443,792 |
| Expenditures | Year 1 | Year 2 | Year 3 |
| Expenditures from Operations | |||
| Cash Spending | $78,000 | $157,000 | $195,000 |
| Bill Payments | $349,852 | $774,249 | $1,182,673 |
| Subtotal Spent on Operations | $427,852 | $931,249 | $1,377,673 |
| Additional Cash Spent | |||
| Sales Tax, VAT, HST/GST Paid Out | $0 | $0 | $0 |
| Principal Repayment of Current Borrowing | $0 | $0 | $0 |
| Other Liabilities Principal Repayment | $0 | $0 | $0 |
| Long-term Liabilities Principal Repayment | $0 | $13,289 | $14,681 |
| Purchase Other Current Assets | $0 | $0 | $0 |
| Purchase Long-term Assets | $0 | $0 | $0 |
| Dividends | $0 | $0 | $0 |
| Subtotal Cash Spent | $427,852 | $944,538 | $1,392,354 |
| Net Cash Flow | ($35,539) | ($7,266) | $51,438 |
| Cash Balance | $53,759 | $46,494 | $97,932 |
7.5 Projected Balance Sheet
The balance sheet shows a healthy growth of net worth and a strong financial position.
| Pro Forma Balance Sheet | |||
| Year 1 | Year 2 | Year 3 | |
| Assets | |||
| Current Assets | |||
| Cash | $53,759 | $46,494 | $97,932 |
| Accounts Receivable | $49,688 | $112,415 | $168,623 |
| Other Current Assets | $14,478 | $14,478 | $14,478 |
| Total Current Assets | $117,925 | $173,387 | $281,033 |
| Long-term Assets | |||
| Long-term Assets | $0 | $0 | $0 |
| Accumulated Depreciation | $0 | $0 | $0 |
| Total Long-term Assets | $0 | $0 | $0 |
| Total Assets | $117,925 | $173,387 | $281,033 |
| Liabilities and Capital | Year 1 | Year 2 | Year 3 |
| Current Liabilities | |||
| Accounts Payable | $25,668 | $67,037 | $99,908 |
| Current Borrowing | $0 | $0 | $0 |
| Other Current Liabilities | $0 | $0 | $0 |
| Subtotal Current Liabilities | $25,668 | $67,037 | $99,908 |
| Long-term Liabilities | $40,000 | $26,711 | $12,030 |
| Total Liabilities | $65,668 | $93,748 | $111,938 |
| Paid-in Capital | $88,419 | $88,419 | $88,419 |
| Retained Earnings | ($24,642) | ($36,162) | ($8,780) |
| Earnings | ($11,520) | $27,382 | $89,456 |
| Total Capital | $52,257 | $79,639 | $169,095 |
| Total Liabilities and Capital | $117,925 | $173,387 | $281,033 |
| Net Worth | $52,257 | $79,639 | $169,095 |
7.6 Business Ratios
The following table contains important ratios for the woodworking industry, as determined by the Standard Industry Classification (SIC) Code, #1751, .
| Ratio Analysis | ||||
| Year 1 | Year 2 | Year 3 | Industry Profile | |
| Sales Growth | 0.00% | 126.24% | 50.00% | 7.90% |
| Percent of Total Assets | ||||
| Accounts Receivable | 42.13% | 64.83% | 60.00% | 35.00% |
| Other Current Assets | 12.28% | 8.35% | 5.15% | 30.30% |
| Total Current Assets | 100.00% | 100.00% | 100.00% | 71.50% |
| Long-term Assets | 0.00% | 0.00% | 0.00% | 28.50% |
| Total Assets | 100.00% | 100.00% | 100.00% | 100.00% |
| Current Liabilities | 21.77% | 38.66% | 35.55% | 42.70% |
| Long-term Liabilities | 33.92% | 15.41% | 4.28% | 14.30% |
| Total Liabilities | 55.69% | 54.07% | 39.83% | 57.00% |
| Net Worth | 44.31% | 45.93% | 60.17% | 43.00% |
| Percent of Sales | ||||
| Sales | 100.00% | 100.00% | 100.00% | 100.00% |
| Gross Margin | 31.76% | 27.50% | 27.50% | 31.60% |
| Selling, General & Administrative Expenses | 34.37% | 24.76% | 21.45% | 16.70% |
| Advertising Expenses | 1.27% | 0.80% | 1.00% | 0.50% |
| Profit Before Interest and Taxes | -1.70% | 3.56% | 7.25% | 3.40% |
| Main Ratios | ||||
| Current | 4.59 | 2.59 | 2.81 | 1.64 |
| Quick | 4.59 | 2.59 | 2.81 | 1.28 |
| Total Debt to Total Assets | 55.69% | 54.07% | 39.83% | 57.00% |
| Pre-tax Return on Net Worth | -22.04% | 40.45% | 63.17% | 7.50% |
| Pre-tax Return on Assets | -9.77% | 18.58% | 38.01% | 17.40% |
| Additional Ratios | Year 1 | Year 2 | Year 3 | |
| Net Profit Margin | -2.61% | 2.74% | 5.96% | n.a |
| Return on Equity | -22.04% | 34.38% | 52.90% | n.a |
| Activity Ratios | ||||
| Accounts Receivable Turnover | 6.67 | 6.67 | 6.67 | n.a |
| Collection Days | 58 | 39 | 46 | n.a |
| Accounts Payable Turnover | 14.63 | 12.17 | 12.17 | n.a |
| Payment Days | 27 | 21 | 25 | n.a |
| Total Asset Turnover | 3.75 | 5.77 | 5.34 | n.a |
| Debt Ratios | ||||
| Debt to Net Worth | 1.26 | 1.18 | 0.66 | n.a |
| Current Liab. to Liab. | 0.39 | 0.72 | 0.89 | n.a |
| Liquidity Ratios | ||||
| Net Working Capital | $92,257 | $106,350 | $181,125 | n.a |
| Interest Coverage | -1.88 | 10.66 | 56.14 | n.a |
| Additional Ratios | ||||
| Assets to Sales | 0.27 | 0.17 | 0.19 | n.a |
| Current Debt/Total Assets | 22% | 39% | 36% | n.a |
| Acid Test | 2.66 | 0.91 | 1.13 | n.a |
| Sales/Net Worth | 8.46 | 12.56 | 8.87 | n.a |
| Dividend Payout | 0.00 | 0.00 | 0.00 | n.a |
Appendix
| Sales Forecast | |||||||||||||
| Month 1 | Month 2 | Month 3 | Month 4 | Month 5 | Month 6 | Month 7 | Month 8 | Month 9 | Month 10 | Month 11 | Month 12 | ||
| Sales | |||||||||||||
| Cabinets | 0% | $0 | $0 | $42,000 | $12,500 | $80,000 | $30,000 | $50,000 | $55,000 | $60,000 | $45,000 | $37,500 | $30,000 |
| Other | 0% | $0 | $0 | $0 | $0 | $0 | $0 | $0 | $0 | $0 | $0 | $0 | $0 |
| Total Sales | $0 | $0 | $42,000 | $12,500 | $80,000 | $30,000 | $50,000 | $55,000 | $60,000 | $45,000 | $37,500 | $30,000 | |
| Direct Cost of Sales | Month 1 | Month 2 | Month 3 | Month 4 | Month 5 | Month 6 | Month 7 | Month 8 | Month 9 | Month 10 | Month 11 | Month 12 | |
| Cabinets | $0 | $0 | $0 | $9,000 | $57,600 | $21,000 | $36,000 | $41,500 | $48,000 | $36,000 | $30,000 | $22,500 | |
| Other | $0 | $0 | $0 | $0 | $0 | $0 | $0 | $0 | $0 | $0 | $0 | $0 | |
| Subtotal Direct Cost of Sales | $0 | $0 | $0 | $9,000 | $57,600 | $21,000 | $36,000 | $41,500 | $48,000 | $36,000 | $30,000 | $22,500 | |
| Personnel Plan | |||||||||||||
| Month 1 | Month 2 | Month 3 | Month 4 | Month 5 | Month 6 | Month 7 | Month 8 | Month 9 | Month 10 | Month 11 | Month 12 | ||
| Martin Kribs | 0% | $2,000 | $2,000 | $2,000 | $2,000 | $2,000 | $2,000 | $2,000 | $2,000 | $2,000 | $2,000 | $2,000 | $2,000 |
| Brent Palmer | 0% | $2,000 | $2,000 | $2,000 | $2,000 | $2,000 | $2,000 | $2,000 | $2,000 | $2,000 | $2,000 | $2,000 | $2,000 |
| Carpenters | 0% | $1,500 | $1,500 | $1,500 | $1,500 | $1,500 | $1,500 | $1,500 | $1,500 | $1,500 | $1,500 | $1,500 | $1,500 |
| Administration Assistant | 0% | $0 | $0 | $0 | $0 | $0 | $0 | $2,000 | $2,000 | $2,000 | $2,000 | $2,000 | $2,000 |
| Total People | 3 | 3 | 3 | 3 | 3 | 3 | 4 | 4 | 4 | 4 | 4 | 4 | |
| Total Payroll | $5,500 | $5,500 | $5,500 | $5,500 | $5,500 | $5,500 | $7,500 | $7,500 | $7,500 | $7,500 | $7,500 | $7,500 | |
| General Assumptions | |||||||||||||
| Month 1 | Month 2 | Month 3 | Month 4 | Month 5 | Month 6 | Month 7 | Month 8 | Month 9 | Month 10 | Month 11 | Month 12 | ||
| Plan Month | 1 | 2 | 3 | 4 | 5 | 6 | 7 | 8 | 9 | 10 | 11 | 12 | |
| Current Interest Rate | 10.00% | 10.00% | 10.00% | 10.00% | 10.00% | 10.00% | 10.00% | 10.00% | 10.00% | 10.00% | 10.00% | 10.00% | |
| Long-term Interest Rate | 10.00% | 10.00% | 10.00% | 10.00% | 10.00% | 10.00% | 10.00% | 10.00% | 10.00% | 10.00% | 10.00% | 10.00% | |
| Tax Rate | 30.00% | 15.00% | 15.00% | 15.00% | 15.00% | 15.00% | 15.00% | 15.00% | 15.00% | 15.00% | 15.00% | 15.00% | |
| Other | 0 | 0 | 0 | 0 | 0 | 0 | 0 | 0 | 0 | 0 | 0 | 0 | |
| Pro Forma Profit and Loss | |||||||||||||
| Month 1 | Month 2 | Month 3 | Month 4 | Month 5 | Month 6 | Month 7 | Month 8 | Month 9 | Month 10 | Month 11 | Month 12 | ||
| Sales | $0 | $0 | $42,000 | $12,500 | $80,000 | $30,000 | $50,000 | $55,000 | $60,000 | $45,000 | $37,500 | $30,000 | |
| Direct Cost of Sales | $0 | $0 | $0 | $9,000 | $57,600 | $21,000 | $36,000 | $41,500 | $48,000 | $36,000 | $30,000 | $22,500 | |
| Other | $0 | $0 | $0 | $0 | $0 | $0 | $0 | $0 | $0 | $0 | $0 | $0 | |
| Total Cost of Sales | $0 | $0 | $0 | $9,000 | $57,600 | $21,000 | $36,000 | $41,500 | $48,000 | $36,000 | $30,000 | $22,500 | |
| Gross Margin | $0 | $0 | $42,000 | $3,500 | $22,400 | $9,000 | $14,000 | $13,500 | $12,000 | $9,000 | $7,500 | $7,500 | |
| Gross Margin % | 0.00% | 0.00% | 100.00% | 28.00% | 28.00% | 30.00% | 28.00% | 24.55% | 20.00% | 20.00% | 20.00% | 25.00% | |
| Expenses | |||||||||||||
| Payroll | $5,500 | $5,500 | $5,500 | $5,500 | $5,500 | $5,500 | $7,500 | $7,500 | $7,500 | $7,500 | $7,500 | $7,500 | |
| Sales and Marketing and Other Expenses | $1,150 | $1,150 | $21,646 | $1,800 | $5,184 | $1,550 | $5,150 | $2,150 | $1,550 | $1,400 | $1,400 | $1,550 | |
| Depreciation | $0 | $0 | $0 | $0 | $0 | $0 | $0 | $0 | $0 | $0 | $0 | $0 | |
| Utilities | $250 | $250 | $250 | $250 | $250 | $250 | $250 | $250 | $250 | $250 | $250 | $250 | |
| Insurance | $95 | $95 | $95 | $95 | $95 | $95 | $95 | $95 | $95 | $95 | $95 | $95 | |
| Rent | $700 | $700 | $700 | $700 | $700 | $700 | $700 | $700 | $700 | $700 | $700 | $700 | |
| Payroll Taxes | 15% | $825 | $825 | $825 | $825 | $825 | $825 | $1,125 | $1,125 | $1,125 | $1,125 | $1,125 | $1,125 |
| Other | $0 | $0 | $0 | $0 | $0 | $0 | $0 | $0 | $0 | $0 | $0 | $0 | |
| Total Operating Expenses | $8,520 | $8,520 | $29,016 | $9,170 | $12,554 | $8,920 | $14,820 | $11,820 | $11,220 | $11,070 | $11,070 | $11,220 | |
| Profit Before Interest and Taxes | ($8,520) | ($8,520) | $12,984 | ($5,670) | $9,846 | $80 | ($820) | $1,680 | $780 | ($2,070) | ($3,570) | ($3,720) | |
| EBITDA | ($8,520) | ($8,520) | $12,984 | ($5,670) | $9,846 | $80 | ($820) | $1,680 | $780 | ($2,070) | ($3,570) | ($3,720) | |
| Interest Expense | $333 | $333 | $333 | $333 | $333 | $333 | $333 | $333 | $333 | $333 | $333 | $333 | |
| Taxes Incurred | $0 | $0 | $0 | $0 | $0 | $0 | $0 | $0 | $0 | $0 | $0 | $0 | |
| Net Profit | ($8,853) | ($8,853) | $12,651 | ($6,003) | $9,513 | ($253) | ($1,153) | $1,347 | $447 | ($2,403) | ($3,903) | ($4,053) | |
| Net Profit/Sales | 0.00% | 0.00% | 30.12% | -48.03% | 11.89% | -0.84% | -2.31% | 2.45% | 0.74% | -5.34% | -10.41% | -13.51% | |
| Pro Forma Cash Flow | |||||||||||||
| Month 1 | Month 2 | Month 3 | Month 4 | Month 5 | Month 6 | Month 7 | Month 8 | Month 9 | Month 10 | Month 11 | Month 12 | ||
| Cash Received | |||||||||||||
| Cash from Operations | |||||||||||||
| Cash Sales | $0 | $0 | $10,500 | $3,125 | $20,000 | $7,500 | $12,500 | $13,750 | $15,000 | $11,250 | $9,375 | $7,500 | |
| Cash from Receivables | $0 | $0 | $0 | $1,050 | $30,763 | $11,063 | $58,750 | $23,000 | $37,625 | $41,375 | $44,625 | $33,563 | |
| Subtotal Cash from Operations | $0 | $0 | $10,500 | $4,175 | $50,763 | $18,563 | $71,250 | $36,750 | $52,625 | $52,625 | $54,000 | $41,063 | |
| Additional Cash Received | |||||||||||||
| Sales Tax, VAT, HST/GST Received | 0.00% | $0 | $0 | $0 | $0 | $0 | $0 | $0 | $0 | $0 | $0 | $0 | $0 |
| New Current Borrowing | $0 | $0 | $0 | $0 | $0 | $0 | $0 | $0 | $0 | $0 | $0 | $0 | |
| New Other Liabilities (interest-free) | $0 | $0 | $0 | $0 | $0 | $0 | $0 | $0 | $0 | $0 | $0 | $0 | |
| New Long-term Liabilities | $0 | $0 | $0 | $0 | $0 | $0 | $0 | $0 | $0 | $0 | $0 | $0 | |
| Sales of Other Current Assets | $0 | $0 | $0 | $0 | $0 | $0 | $0 | $0 | $0 | $0 | $0 | $0 | |
| Sales of Long-term Assets | $0 | $0 | $0 | $0 | $0 | $0 | $0 | $0 | $0 | $0 | $0 | $0 | |
| New Investment Received | $0 | $0 | $0 | $0 | $0 | $0 | $0 | $0 | $0 | $0 | $0 | $0 | |
| Subtotal Cash Received | $0 | $0 | $10,500 | $4,175 | $50,763 | $18,563 | $71,250 | $36,750 | $52,625 | $52,625 | $54,000 | $41,063 | |
| Expenditures | Month 1 | Month 2 | Month 3 | Month 4 | Month 5 | Month 6 | Month 7 | Month 8 | Month 9 | Month 10 | Month 11 | Month 12 | |
| Expenditures from Operations | |||||||||||||
| Cash Spending | $5,500 | $5,500 | $5,500 | $5,500 | $5,500 | $5,500 | $7,500 | $7,500 | $7,500 | $7,500 | $7,500 | $7,500 | |
| Bill Payments | $112 | $3,353 | $4,037 | $23,488 | $14,736 | $63,646 | $25,383 | $43,737 | $46,350 | $51,648 | $39,703 | $33,658 | |
| Subtotal Spent on Operations | $5,612 | $8,853 | $9,537 | $28,988 | $20,236 | $69,146 | $32,883 | $51,237 | $53,850 | $59,148 | $47,203 | $41,158 | |
| Additional Cash Spent | |||||||||||||
| Sales Tax, VAT, HST/GST Paid Out | $0 | $0 | $0 | $0 | $0 | $0 | $0 | $0 | $0 | $0 | $0 | $0 | |
| Principal Repayment of Current Borrowing | $0 | $0 | $0 | $0 | $0 | $0 | $0 | $0 | $0 | $0 | $0 | $0 | |
| Other Liabilities Principal Repayment | $0 | $0 | $0 | $0 | $0 | $0 | $0 | $0 | $0 | $0 | $0 | $0 | |
| Long-term Liabilities Principal Repayment | $0 | $0 | $0 | $0 | $0 | $0 | $0 | $0 | $0 | $0 | $0 | $0 | |
| Purchase Other Current Assets | $0 | $0 | $0 | $0 | $0 | $0 | $0 | $0 | $0 | $0 | $0 | $0 | |
| Purchase Long-term Assets | $0 | $0 | $0 | $0 | $0 | $0 | $0 | $0 | $0 | $0 | $0 | $0 | |
| Dividends | $0 | $0 | $0 | $0 | $0 | $0 | $0 | $0 | $0 | $0 | $0 | $0 | |
| Subtotal Cash Spent | $5,612 | $8,853 | $9,537 | $28,988 | $20,236 | $69,146 | $32,883 | $51,237 | $53,850 | $59,148 | $47,203 | $41,158 | |
| Net Cash Flow | ($5,612) | ($8,853) | $963 | ($24,813) | $30,526 | ($50,584) | $38,367 | ($14,487) | ($1,225) | ($6,523) | $6,797 | ($96) | |
| Cash Balance | $83,687 | $74,834 | $75,797 | $50,984 | $81,511 | $30,927 | $69,294 | $54,807 | $53,582 | $47,059 | $53,855 | $53,759 | |
| Pro Forma Balance Sheet | |||||||||||||
| Month 1 | Month 2 | Month 3 | Month 4 | Month 5 | Month 6 | Month 7 | Month 8 | Month 9 | Month 10 | Month 11 | Month 12 | ||
| Assets | Starting Balances | ||||||||||||
| Current Assets | |||||||||||||
| Cash | $89,299 | $83,687 | $74,834 | $75,797 | $50,984 | $81,511 | $30,927 | $69,294 | $54,807 | $53,582 | $47,059 | $53,855 | $53,759 |
| Accounts Receivable | $0 | $0 | $0 | $31,500 | $39,825 | $69,063 | $80,500 | $59,250 | $77,500 | $84,875 | $77,250 | $60,750 | $49,688 |
| Other Current Assets | $14,478 | $14,478 | $14,478 | $14,478 | $14,478 | $14,478 | $14,478 | $14,478 | $14,478 | $14,478 | $14,478 | $14,478 | $14,478 |
| Total Current Assets | $103,777 | $98,165 | $89,312 | $121,775 | $105,287 | $165,051 | $125,905 | $143,022 | $146,785 | $152,935 | $138,787 | $129,083 | $117,925 |
| Long-term Assets | |||||||||||||
| Long-term Assets | $0 | $0 | $0 | $0 | $0 | $0 | $0 | $0 | $0 | $0 | $0 | $0 | $0 |
| Accumulated Depreciation | $0 | $0 | $0 | $0 | $0 | $0 | $0 | $0 | $0 | $0 | $0 | $0 | $0 |
| Total Long-term Assets | $0 | $0 | $0 | $0 | $0 | $0 | $0 | $0 | $0 | $0 | $0 | $0 | $0 |
| Total Assets | $103,777 | $98,165 | $89,312 | $121,775 | $105,287 | $165,051 | $125,905 | $143,022 | $146,785 | $152,935 | $138,787 | $129,083 | $117,925 |
| Liabilities and Capital | Month 1 | Month 2 | Month 3 | Month 4 | Month 5 | Month 6 | Month 7 | Month 8 | Month 9 | Month 10 | Month 11 | Month 12 | |
| Current Liabilities | |||||||||||||
| Accounts Payable | $0 | $3,242 | $3,242 | $23,054 | $12,570 | $62,821 | $23,928 | $42,198 | $44,615 | $50,318 | $38,573 | $32,773 | $25,668 |
| Current Borrowing | $0 | $0 | $0 | $0 | $0 | $0 | $0 | $0 | $0 | $0 | $0 | $0 | $0 |
| Other Current Liabilities | $0 | $0 | $0 | $0 | $0 | $0 | $0 | $0 | $0 | $0 | $0 | $0 | $0 |
| Subtotal Current Liabilities | $0 | $3,242 | $3,242 | $23,054 | $12,570 | $62,821 | $23,928 | $42,198 | $44,615 | $50,318 | $38,573 | $32,773 | $25,668 |
| Long-term Liabilities | $40,000 | $40,000 | $40,000 | $40,000 | $40,000 | $40,000 | $40,000 | $40,000 | $40,000 | $40,000 | $40,000 | $40,000 | $40,000 |
| Total Liabilities | $40,000 | $43,242 | $43,242 | $63,054 | $52,570 | $102,821 | $63,928 | $82,198 | $84,615 | $90,318 | $78,573 | $72,773 | $65,668 |
| Paid-in Capital | $88,419 | $88,419 | $88,419 | $88,419 | $88,419 | $88,419 | $88,419 | $88,419 | $88,419 | $88,419 | $88,419 | $88,419 | $88,419 |
| Retained Earnings | ($24,642) | ($24,642) | ($24,642) | ($24,642) | ($24,642) | ($24,642) | ($24,642) | ($24,642) | ($24,642) | ($24,642) | ($24,642) | ($24,642) | ($24,642) |
| Earnings | $0 | ($8,853) | ($17,707) | ($5,056) | ($11,059) | ($1,547) | ($1,800) | ($2,953) | ($1,607) | ($1,160) | ($3,563) | ($7,467) | ($11,520) |
| Total Capital | $63,777 | $54,923 | $46,070 | $58,721 | $52,717 | $62,230 | $61,977 | $60,823 | $62,170 | $62,617 | $60,213 | $56,310 | $52,257 |
| Total Liabilities and Capital | $103,777 | $98,165 | $89,312 | $121,775 | $105,287 | $165,051 | $125,905 | $143,022 | $146,785 | $152,935 | $138,787 | $129,083 | $117,925 |
| Net Worth | $63,777 | $54,923 | $46,070 | $58,721 | $52,717 | $62,230 | $61,977 | $60,823 | $62,170 | $62,617 | $60,213 | $56,310 | $52,257 |


