
Poppi Designs
Executive Summary
Poppi Designs is an importer of Italian furniture serving New York. The business was originally incorporated in N.Y. over 10 years ago and has undergone various changes in business strategy. The refined model is to import a wide range of Italian furniture and sell primarily to designers and unfinished furniture retail stores. The company has two principals, Kate Jackson located in N.Y., and Luca de Febonio located in Rome, Italy.
The Concept
Recognizing that the market for good furniture is quite competitive using the larger furniture retailers, Poppi will minimize the competition by targeting specific niches, generally focusing on out-of-the-way locations that are not served by the larger furniture superstores. By leveraging Luca’s location and expertise in Italy, Poppi Designs will be able to have control of the entire importation process. In Italy, Luca will serve as not only as a principal of Poppi, but also as the agent.
Poppi Designs has three keys to success. The first is establishing a high quality, high value relationship with its vendors and customers. The second key is to ensure reliable and timely delivery of their products. The last key to success is reliable administration of the organization.
Poppi is set up as a home-based business with additional warehouse space. This will be the most cost effective arrangement yet provide the requisite amount of service and support.
The Market
Poppi Designs will target three market segments. The first, that currently comprises 80% of their business, is specialty retailers. This segment is growing at 2% and there are 16 potential customers. This is a more competitive niche and through targeted marketing, Poppi will begin to reduce their dependence on this segment. The second segment is designers, that also have a 2% annual growth, with 44 potential customers. The last targeted niche is unfinished furniture retailers growing at 2% with a potential market of 50 participants.
The market is based less on brand equity of the manufacturer and more on the actual product and the service provider. It is very important to the customer to touch and feel the product. The salesperson is also instrumental in the transaction. These realities are beneficial to Poppi as they can pick and choose from a variety of manufacturers instead of being able to sell products from only known companies.
The Sales Strategy
Key to the sales strategy is direct sales calls on all market segments targeted in this plan with the exception of interior designers. These sales calls need to be made by the owner, Kate Jackson, by virtue of her background and knowledge of the products and competitors. Experience has proven that the more time she devotes to sales, the more sales result. A full-time team member needs to be found and added as soon as possible. Without this person, too much of Kate’s time is deflected away from her major task of selling.
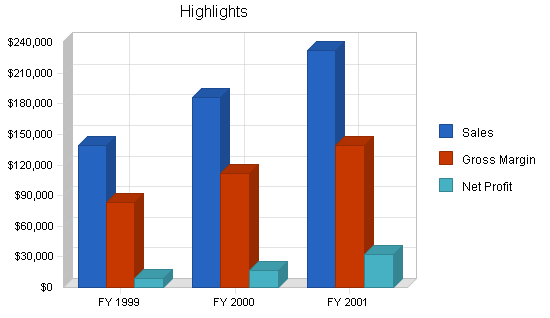
Poppi Designs, through its well-focused business strategy will achieve profitability by month two. Conservative forecasts indicate that sales will be almost double from year one to year three. Net profits will be commensurate.
1.1 Objectives
The objectives of Poppi Designs are:
- To put in place adequate, and reliable, administrative machinery, allowing the owner to spend her time selling and maintaining major accounts.
- To concentrate Poppi’s efforts on several selected market sectors that have been researched and found promising.
- To improve the reliability and timeliness of shipments from Italy.
1.2 Mission
Poppi’s mission is to supply certain market niches for chairs and other furniture items which are, for a variety of reasons, not well served by the large domestic manufacturers. The owner of Poppi Designs utilizes her interior design background, her experience in the furniture retail market, as well as her contacts in Italy to tailor her products to the needs of these market niches.
1.3 Keys to Success
The keys to success in Poppi Designs’ business are:
- Offering items of a high quality-value relationship which are not available everywhere. This is essential for maintaining the niche market sectors mentioned in the mission statement.
- Reliable and timely deliveries. Poppi must make good on its delivery promises. Because of the nature of doing business in Italy, this requires long-range planning in scheduling orders, taking into account Italian holidays and business practices.
- A reliable administration that is ready to serve customers, prepare accurate billing, follow-up on orders and other documentation, and maintain a close watch on expenses and collection of accounts receivable.
Company Summary
Poppi Designs is a bare-bones importer of furniture from Italy, with minimal overhead, and a limited number of niche markets in New England. After an attempt in the early 90’s to compete with the “Big Boys,” with a showroom in High Point, North Carolina, Poppi has settled on a more localized out-reach to market segments that for one reason or another are not well-served by either the large domestic manufacturers, or the large New York import houses. Poppi capitalizes on the owner’s background in interior design for serving segments which are more closely connected to designer clientele than main stream furniture retailers.
2.1 Company Ownership
Poppi Designs was incorporated in the state of New York. The company’s ownership is shared equally between Kate Jackson of Wenham, New York and Luca de Febonio of Rome, Italy. Kate had 20 years of experience in the design field and knowledge of the U.S. market. Senor de Febonio had 25 years experience in the manufacturing of furniture in Italy and shipping to the U.S. market. Ms. Jackson, as president, secretary and treasurer, is responsible for the daily management, sales, and development of the company. Sr. de Febonio is responsible for the manufacturing, quality control, and shipping of the goods from Italy until they reach the U.S.
2.2 Company History
Originally Poppi established a showroom in High Point, N.C. which is the furniture buying capital of the U.S. These showrooms are opened only two times a year, for two weeks only. At these times, buyers attend the market to purchase. Due to the economics of the country at the time, Poppi was not successful in this venture.
As the country rebound, the furniture business did not return to its old way of doing business. It was becoming a global market with more competition. It became obvious that Poppi could not continue with its present plan and had to find a niche of its own in which to promote its products. The decisions were made to pull back its emphasis on the national market and focus more on a smaller geographic region, as well as to concentrate on only certain segments of that regional market (see Market Strategy).
A third conclusion reached, as a result of the High Point experience, was the need to warehouse. Customers were becoming less and less willing to wait for product. Last year Poppi began warehousing, this became the turning point of the company: since then sales have steadily increased.

| Past Performance | |||
| FY 1996 | FY 1997 | FY 1998 | |
| Sales | $114,541 | $102,946 | $120,000 |
| Gross Margin | $54,653 | $29,229 | $45,000 |
| Gross Margin % | 47.71% | 28.39% | 37.50% |
| Operating Expenses | $56,349 | $34,192 | $40,000 |
| Collection Period (days) | 0 | 0 | 0 |
| Inventory Turnover | 5.00 | 5.00 | 6.00 |
| Balance Sheet | |||
| FY 1996 | FY 1997 | FY 1998 | |
| Current Assets | |||
| Cash | $0 | $0 | $13,000 |
| Accounts Receivable | $0 | $0 | $9,600 |
| Inventory | $0 | $0 | $11,764 |
| Other Current Assets | $0 | $0 | $21,000 |
| Total Current Assets | $0 | $0 | $55,364 |
| Long-term Assets | |||
| Long-term Assets | $0 | $0 | $3,000 |
| Accumulated Depreciation | $0 | $0 | $3,000 |
| Total Long-term Assets | $0 | $0 | $0 |
| Total Assets | $0 | $0 | $55,364 |
| Current Liabilities | |||
| Accounts Payable | $0 | $0 | $4,000 |
| Current Borrowing | $0 | $0 | $0 |
| Other Current Liabilities (interest free) | $0 | $0 | $15,000 |
| Total Current Liabilities | $0 | $0 | $19,000 |
| Long-term Liabilities | $0 | $0 | $180,000 |
| Total Liabilities | $0 | $0 | $199,000 |
| Paid-in Capital | $0 | $0 | $10,000 |
| Retained Earnings | $0 | $0 | ($153,636) |
| Earnings | $0 | $0 | $0 |
| Total Capital | $0 | $0 | ($143,636) |
| Total Capital and Liabilities | $0 | $0 | $55,364 |
| Other Inputs | |||
| Payment Days | 0 | 0 | 0 |
| Sales on Credit | $0 | $0 | $0 |
| Receivables Turnover | 0.00 | 0.00 | 0.00 |

2.3 Company Locations and Facilities
Poppi works out of the home of its owner. Warehouse space is shared with its primary finishers in Plainview, New York where a small showroom is provided by the finishers, Flair Finishers.
Products
Poppi Designs’ product line is rather extensive, amounting to over 200 items including, chairs, stools, dressers, book shelves, mirrors, screens, side tables, dining tables, lounges, etc. Because of the large quantity of items and styles, it is not feasible to stock all these items, however, any of these items can be purchased from Poppi by special order. Because of the long lead time between ordering and arrival of the goods, Poppi has found that it must concentrate on a limited number of items which suit the targeted market sectors, and to try to keep a stock in these items ready for immediate delivery.
3.1 Competitive Comparison
Probably the most notable competitor seen in retail outlets of the type targeted by Poppi Designs is from Chapman International. The Chapman catalog is excellent and in color. All items in the catalog are available immediately, unfinished, from stock in Delaware. Below is a price comparison:
| Chapman Item | Raw | Finished | Premium Finish | Poppi Item | Raw | Finished |
| Renaissance “A” | $197 | $235 | $270 | 156A | $202 | $264 |
| Renaissance “S” | $165 | $195 | $220 | 155S | $177 | $234 |
| Splat Side | $132 | $150 | $175 | 152S | $150 | $206 |
| Celestial “S” | $127 | $145 | $170 | 150S | $191 | $247 |
| Celestial “A” | $162 | $190 | $225 | 151A | $219 | $281 |
The finished prices listed above for Chapman include their standard finish which is applied in Italy. For a finish which Chapman calls “Premium” (giving a distressed or antique look) an additional $25 (for side chair) or $35 (arm chair) is charged. This additional charge should be considered when comparing the level of Poppi finish work.
Taking this into consideration, Poppi’s prices for the items mentioned above are higher than Chapman’s. It should be mentioned that only the Renaissance approaches a close comparison. The other two compared models of Chapman, although roughly similar when viewed from a distance, are far less substantial when examined up close. The Chapman chairs weigh much less and have very little carving work when compared to Poppi’s chairs.
Competitiveness from point of view of price is an important factor and looms larger once the retailer’s margin has been tacked on. The price difference in respect to Chapman should not be a problem for Poppi, given the higher quality of Poppi’s chairs. However, pricing is only one aspect of competition. Chapman has an excellent color catalog and all items contained in it are readily available from stock kept in Delaware. Some market sectors might be expected to lean in Chapman direction if Poppi has problems delivering in a timely manner. “Timely deliveries” has been underscored in the “Objectives” section of this plan.
A price comparison was also performed for unfinished chairs targeted for the designer market. The two major New York furniture import houses (Columbia and Atlantic) were chosen for comparison purposes. The item compared here is in all three cases the identical chair, most probably produced in the same factory in Italy:
Columbia’s Item#382S and 382A ……… $255 and $283 respectively (raw)
Atlantic’s Item#7616S & A ……………..$275 and $295 respectively (raw)
Poppi Designs’ equivalent………………………………….$217 and $290 (raw)
Comparing prices on a finished basis is a bit more difficult because of the wide range of finish options, but Poppi’s finished, upholstered price of $417 and $490 for the side and arm chair respectively compares with Columbia’s prices of $448 and $482 and Atlantic’s prices of $490-605 (depending on type of finish) for the side and $525-645 for the arm chair.
3.2 Sourcing
Poppi Designs’ products are imported from Italy through an agent who receives a 7% commission. This agent, Luca de Febonio is a 50% owner of Poppi Designs, and their relationship is long-standing. The agent is responsible for arranging production schedules with the various local factories and handles all matters that arise until the point when goods are ready for shipment. Payment is made by Poppi directly to the producing factories at the prevailing exchange rate for Italian Lira.
Market Analysis Summary
Poppi Designs has learned by experience that it needs to target several market niches to be successful. Poppi has identified three promising areas: Specialty Retail, Designers, and Unfinished Furniture Retailers. The first group accounts for nearly 80% of present sales. Reliance on this group will decrease somewhat as a result of increased efforts in marketing the other two customer groups.
4.1 Market Segmentation
According to U.S. government statistics there are over 17,000 outlets selling furniture nation-wide. Briefly stated, these outlets fall into the following categories:
- High-end. High-end furniture outlets carry furniture produced by the top manufacturers home-based either in High Point, North Carolina or elsewhere in the South. These companies have a network of dealers throughout the country who are chosen based on the high image of the outlet. Some outlets represent the manufacturer exclusively. It is not unusual to find a dining chair in these outlets priced to sell at $1,200.
- Middle Range. A step down from the first category are furniture outlets, such as Veralum’s Furniture, that sell furniture which is targeted to up-market buyers, but not the top rung. A dining chair from one of these outlets might cost between $600-$800.
- Mass Merchandisers such as ** or ** must carry lines with broad appeal, and high volume. This furniture is still sourced from large factories mostly in the South, but quality is lower and so are the prices. A dining chair from one of these outlets would sell in the $300 range.
- Low-end. Chairs sold from these outlets would have virtually no hand work. The chairs are likely to need re-gluing a few years later, and much of the furniture requires some assembly on the part of the purchaser. A chair from these outlets would sell for under $200.
- Unfinished Furniture Outlets. These are varied: many are manufacturers who only sell their own products, others take on items from other manufacturers to round out the line, and others only sell unfinished furniture but offer the option to have the finishing done by them. Quality can vary. Some are very low end, others like to have a better price variety.
- Specialty Retailers. These include certain specialty retailers who combine antiques and reproductions to obtain an unusual offering which cannot be price-shopped. These retail outlets are small and must have healthy mark-ups to survive. They would avoid items that could be readily found at larger retailers who work on thinner margins. This market sector represents Poppi’s biggest volume.
- Designer Market. Designers have difficulty making money on furniture. Taking clients to pick out chairs from retailers at the design center or elsewhere does not result in big commissions for the designer. What some designers do is to buy unfinished chairs (often via the major New York import houses) and then have a refinisher and an upholsterer complete the work. In this manner the designer can insure a larger profit for himself and the customer gets a quality chair which cannot be price-shopped easily.
The last three mentioned market sectors – Unfinished Furniture Outlets, Specialty Retailers, and Designers – are the ones most attractive to Poppi’s products. Each of these market segments are expected to grow at a steady rate of 2% per year. The table below summarizes the total market potential for Poppi for the years 1998-2001.
** Deleted for confidentiality.

| Market Analysis | |||||||
| 1998 | 1999 | 2000 | 2001 | 2002 | |||
| Potential Customers | Growth | CAGR | |||||
| Unfinished Furniture Retailers | 2% | 16 | 16 | 16 | 16 | 16 | 0.00% |
| Specialty Retailers | 2% | 44 | 45 | 46 | 47 | 48 | 2.20% |
| Interior Designers | 2% | 50 | 51 | 52 | 53 | 54 | 1.94% |
| Other | 1% | 10 | 10 | 10 | 10 | 10 | 0.00% |
| Total | 1.63% | 120 | 122 | 124 | 126 | 128 | 1.63% |
4.2 Target Market Segment Strategy
Due to the limited resources available to Poppi Designs, the company will avoid the middle- and high-end furniture segments that it cannot profitably reach. By specifically focusing its marketing efforts on the underserved segments of Designer and Unfinished Furniture markets, Poppi will diversify its customer base. This will help the company to reduce its current sole reliance on the Specialty Retail segment. Established connections with the Italian manufacturers of high quality furniture will help the company to source rarely available products, which are in strong demand by the sought customer segments.
4.2.1 Market Needs
Customer needs across the three segments described in Target Market Segment Strategy are similar in the sense that each customer segment seeks high quality furniture supply sources that will help add value to the retail consumers. Unfinished furniture outlets require furniture that may be either finished by the ‘do-it-yourselfers’ or by the store’s on-site finishers. In both cases, the furniture will help sell such retailers other high-margin products and services. Designer stores require quality unfinished furniture that can easily be finished by the outsourced finishers or upholsterers. Like with many other products, designer stores can then add hefty premiums to leverage their brand identity through perceived product uniqueness. Finally, the Specialty Retailers that are currently the core customer segment for Poppi, have shown the need for antique-looking furniture that appeals for their clientele. This need can be met by applying special finishes to the Poppi’s products.
4.3 Industry Analysis
As mentioned in the Market Segmentation section, the market areas most attractive to Poppi Designs are:
- Unfinished Furniture Outlets
The outlets listed below are all located within an hour or so drive from Poppi’s offices. Poppi’s chairs are normally imported from Italy in unfinished form. This is because it is too cumbersome to maintain a stock of all the possible finishes that might be desired. Also, shipping is complicated if the chairs are shipped finished, as packaging to protect the finish would be needed and that reduces the quantity that can be placed into the container. Since the landed products are unfinished, marketing certain select sellers of unfinished furniture makes sense:
** Specific company names have been deleted for confidentiality purposes. - Specialty Retailers
These retailers usually do not have very large showrooms. They usually combine an assortment of antiques bought at auctions or estate sales which include cupboards, corner cabinets, farm house tables, hope chests, etc., as well as some reproductions. Unlike many brand names these items can not be price shopped easily. Below is a listing of this type of outlet located within an hour’s drive of Boston:
** Specific company names have been deleted for confidentiality purposes.
4.3.1 Industry Participants
The major players in the furniture business are the large manufacturers headquartered in High Point, North Carolina and elsewhere, primarily in the South. There are also many local manufacturers that are much smaller and usually specialize in a particular wood or a particular style. The more important outlets for Poppi’s products do not usually carry the domestic products coming out of the South. This is because these outlets need to have larger margins to survive and thus need to avoid products that are found everywhere. For these specialty outlets, smaller importers are often preferred who can offer a more unique line. Chapman, for example, is a maker of furniture in Italy. Katrina’s Heritage is another supplier that targets this same specialty retail segment. Some of these retailers do their own importing and make frequent buying trips to Europe or rely on buyers located there. Poppi’s products are solid pieces, heavier than most, with more hand carving work.
4.3.2 Distribution Patterns
For the vast majority of furniture outlets, furniture is not supplied off the showroom floor, but instead must be ordered. The customer will be shown a chart of standard finishes, make his choice, as well as his choice of fabric, make a down-payment and then wait at least eight weeks to receive the ordered furniture. Large institutional buyers such as hotels would negotiate directly with the furniture manufacturer. The larger manufacturers have regional representatives who will call on major outlets and large direct buyers.
Poppi Designs’ distribution plan is to sell directly to the design trade , who pay list price, as well as offer two tiers of discounts when selling to small and large retailers. Arranging the sale of full container loads directly to big buyers is also considered.
4.3.3 Competition and Buying Patterns
Brand names are of little, if any, importance. The key to the buying decision on the part of the consumer is the salesman and the chair being in front of the buyer. As has been pointed out in the Competitive Analysis section there are other chairs with similar appearance as those supplied by Poppi which are less expensive. It is essential that the salesman point out the salient features and selling points favoring Poppi’s chairs (weight–i.e. stability, strength, etc.). The re-gluing of a chair several years down the road can be a very costly exercise. Unless a salesman mentions the likelihood of this happening in the case of a lighter chair, the consumer is not apt to consider it. Most importantly, Poppi’s chairs must be available in the retail outlet. Whatever chairs the outlet carries are going to be sold. Many of the specialty outlets targeted in the Market Strategy section carry chairs from only one supplier.
4.3.4 Main Competitors
The most frequently seen competitor selling to Poppi Designs’ prime targeted outlets is Chapman. As was pointed out elsewhere in the business plan, Chapman products are produced in Italy, which has a better reputation for delivery reliability. The chairs (unlike Poppi’s chairs) come from one factory. These products are imported by a firm in Delaware which enjoys a full-color catalog of excellent quality published by Chapman. More importantly the importer carries every catalog item in stock. The Chapman chairs are, however, inferior in quality to those of Poppi’s suppliers in terms of weight, strength of construction, as well as the degree of hand-carving detail.
Strategy and Implementation Summary
Poppi Designs will pursue a differentiation strategy by offering a specific line of solid, hand-carved furniture to the selected customer segments in the limited geographic areas. Such sales of both finished and unfinished high-quality and high-margin furniture that appeals to the Specialty Retail, Designer, and Unfinished Furniture customer segments will be mostly achieved through the direct sales channel handled by Kate Jackson.
5.1 Competitive Edge
To further entrench in its niche market, Poppi will utilize its established connections with the Italian manufacturers of high-quality furniture, which provide the company an opportunity to offer unique products in the selected U.S. markets. Further, the company will utilize unique industry experience and superb selling skills of it co-owner, Kate Jackson, to achieve the desired sales penetration.
5.2 Marketing Strategy
The following sections illuminate the pricing, promotion and distribution strategies for Poppi Designs.
5.2.1 Pricing Strategy
The present pricing structure for Poppi’s products is to charge list price to the designer segment of the market. The designer segment of the market is typically making purchases which are time-sensitive and in small quantities.
We will allow a 12% discount to both of the Retail segment (Specialty Retailers and Unfinished Furniture Retailers). For a full container, or very large orders, Poppi offers a 36% discount off of the list price.
5.2.2 Promotion Strategy
Brand identity is not a key issue with consumers. Direct mail is planned in the form of post card-sized mailings. A copy of one is included in the appendix. These have proved useful in identifying interested interior designers, as these individuals cannot economically be called upon in person.
Since getting Poppi Designs’ chairs into an outlet is the toughest hurdle, some promotional strategy should be devised to help along the retailer’s initial decision to try carrying Poppi’s products. For the first 60 days, the retailer might be given an arm chair free for every five side chairs purchased. Once the outlet carries Poppi’s chairs, and the sales persons have been properly instructed concerning the chairs’ sales features, re-ordering seems to proceed along smoothly unassisted.
For the unfinished furniture outlets, attaching a tag with a photo of a suggested finish might be very useful to encourage sales in this segment. Step-by-step instructions to achieve this finished look in the photo by “do-it-yourselfers” could be made available. Naming a local refinisher who will do the work at an agreed reasonable price might be another option for the “do-it-yourselfer” who couldn’t get around to it.
5.2.3 Distribution Strategy
At the present time, Poppi Designs plans only one level between itself and the consumer. In most cases this will be the retailer. Some thought has been given to selling directly to the consumer via classified ads in mail-order publications, but this proposal requires further study.
5.3 Sales Strategy
Key to the sales strategy is direct sales calls on all market segments targeted in this plan with the exception of interior designers. These sales calls need to be made by the owner, Kate Jackson, by virtue of her background and knowledge of the products and competitors. Experience has proven that the more time she devotes to sales, the more sales result. A full-time team member needs to be found and added as soon as possible. Without this person, too much of Kate’s time is deflected away from her major task of selling.
Forty-four specialty retailers have been identified, as well as 16 unfinished furniture retailers. With proper geographical planning and appointment scheduling handled by a competent team member, three or four sales calls could be achieved in a day. This would mean that Kate could pay a visit to all 60 prime prospects over a three week period.
5.3.1 Sales Forecast
For purposes of projections, the most popular chair (#155) was used with a landed cost of $78.43. Sales prices used are recent sales prices for this chair ($157 to retailers, $178 to the design trade, and $114 wholesale). Although various chairs and other pieces of furniture will be imported, it is assumed that the profit spread realized with chair #155 will be maintained. The weighted average sales price is $154.80. Sales are all assumed to be on an unfinished basis. Although much of sales are expected to be on a finished basis, we have assumed that the added sales price for finishing will merely be paid out to Poppi’s refinishers who perform the work. A similar comment applies in respect to upholstery.
Sales projections reflect reasonable success from Poppi’s marketing efforts explained earlier. It is assumed that these efforts will result in unit sales of chairs of 900, 1200, and 1500 in years 1998, 1999, and 2000 respectively. Monthly unit sales in 1998 will gradually grow from 65 monthly (April-July) to 90 units by January 1999. It is further assumed that sales will continue to reflect historical experience in respect to discounts. Eighty percent of sales will go to retailers, with 10 percent each to wholesalers and the design trade.


| Sales Forecast | |||
| FY 1999 | FY 2000 | FY 2001 | |
| Sales | |||
| Retailer Sales | $113,040 | $150,720 | $188,400 |
| Designer Sales | $16,020 | $21,360 | $26,700 |
| Wholesale | $10,260 | $13,680 | $17,100 |
| Other | $0 | $0 | $0 |
| Total Sales | $139,320 | $185,760 | $232,200 |
| Direct Cost of Sales | FY 1999 | FY 2000 | FY 2001 |
| Retailer Sales | $45,216 | $60,288 | $75,360 |
| Designer Sales | $6,408 | $8,544 | $10,680 |
| Wholesale | $4,104 | $5,472 | $6,840 |
| Other | $0 | $0 | $0 |
| Subtotal Direct Cost of Sales | $55,728 | $74,304 | $92,880 |
5.4 Strategic Alliances
As a result of the several years spent at High Point, North Carolina, Poppi Designs has recently developed alliances with showrooms at the design centers in both Columbus, Ohio and New York. Both of these showrooms will begin to display Poppi chairs in May of 1998.
Poppi has also established an alliance with Mercator Upholstery in Boston. Mercator services the high-end design trade with upholstered chairs, etc. Mercator has agreed to set aside space within their upholstery facilities to display Poppi chairs. This will help designers and their clients to reach a decision on chair selection which will result in a rather unique product (specially selected upholstery treatments and fabric on a chair frame not found in every retail outlet). This is just the kind of alliance that is perfectly suited to Poppi products. Attempts will be made to increase this type of alliance with other upholsterers (such as Hondius Upholstery which also caters to the design trade).
Management Summary
The management of Poppi Designs is made up of the owner and one other member who still needs to be added. This plan calls for the owner to concentrate efforts firstly on sales. The many administrative functions of Poppi would become the primary focus of the other team member.
6.1 Management Team Gaps
As mentioned earlier in this plan, a team member needs to be found and trained soon. This person’s functions listed below should allow Kate to concentrate on new sales, maintenance of existing accounts, and devising company strategy and policies.
New team member duties:
- Entering and and maintaining day-to-day financial entries into the computerized accounts set up by Poppi’s accountant. Balancing checkbook and reconciling bank statements.
- Invoicing, billing, and expediting over the phone past-due accounts.
- Organizing all paperwork related to orders place for shipments from Italy.
- Preparing the landed coast for each imported item following the format provided.
- Answering phones from customers and dealing with inquiries. Close contact with kate by pager/cell phone so that customers can feel that Kate is always reachable.
6.2 Personnel Plan
Poppi Designs’ sales targets can only be reached if the owner’s time is freed up to spend virtually 100% of her time selling to new customers and managing the accounts she has already sold to. This means that a capable individual must be added as soon as possible to handle the administration.
| Personnel Plan | |||
| FY 1999 | FY 2000 | FY 2001 | |
| Admin. Assist. | $19,992 | $24,000 | $24,000 |
| Owner | $24,000 | $30,000 | $35,000 |
| Other | $0 | $0 | $0 |
| Total People | 2 | 2 | 2 |
| Total Payroll | $43,992 | $54,000 | $59,000 |
Financial Plan
It is assumed that the owner’s private resources will be sufficient to finance any monthly cash-flow shortage. However, it would be advisable to establish a bank relationship as soon as possible. Sales could very well increase at a much sharper rate than assumed in these conservative projections. Sharper sales will result in a greater need for funds in support of inventory and receivables. An over-draft line of credit of $15,000-20,000 would be an excellent cushion to fall back on.
7.1 Important Assumptions
Payroll burden is calculated at 12.65% made up of 7.65% social security, 2% unemployment, and 3% worker’s compensation. Payables are assumed to reach levels equal to one month’s operating expenses. Accounts receivable are assumed to be 45 days, although sales terms are net 30 and some sales require some payment in advance.
Inventory turnover reflects the fact that containers carrying 200 chairs (400 if a 40 ft. container) cause peaks and valleys in inventory. Inventory levels have been calculated monthly by deducting that month’s projected sales and adding inventory of new stocks when sales projections indicate a new container filled with chairs should arrive to prevent a stock-out.
| General Assumptions | |||
| FY 1999 | FY 2000 | FY 2001 | |
| Plan Month | 1 | 2 | 3 |
| Current Interest Rate | 0.00% | 0.00% | 0.00% |
| Long-term Interest Rate | 0.00% | 0.00% | 0.00% |
| Tax Rate | 25.42% | 25.00% | 25.42% |
| Other | 0 | 0 | 0 |
7.2 Key Financial Indicators
The following chart outlines our key financial indicators for fiscal years 1996-2001.

7.3 Break-even Analysis
Our break-even analysis is summarized by the following chart and table.

| Break-even Analysis | |
| Monthly Revenue Break-even | $9,979 |
| Assumptions: | |
| Average Percent Variable Cost | 40% |
| Estimated Monthly Fixed Cost | $5,987 |
7.4 Projected Profit and Loss
There are many factors to include when determining a projected profit and loss statement, these are included in the following table.


| Pro Forma Profit and Loss | |||
| FY 1999 | FY 2000 | FY 2001 | |
| Sales | $139,320 | $185,760 | $232,200 |
| Direct Cost of Sales | $55,728 | $74,304 | $92,880 |
| Other | $0 | $0 | $0 |
| Total Cost of Sales | $55,728 | $74,304 | $92,880 |
| Gross Margin | $83,592 | $111,456 | $139,320 |
| Gross Margin % | 60.00% | 60.00% | 60.00% |
| Expenses | |||
| Payroll | $43,992 | $54,000 | $59,000 |
| Sales and Marketing and Other Expenses | $17,320 | $17,320 | $17,320 |
| Depreciation | $0 | $0 | $0 |
| Leased Equipment | $0 | $0 | $0 |
| Utilities (Telephone) | $6,000 | $6,000 | $6,000 |
| Insurance (Liability/Fire) | $1,500 | $1,500 | $1,500 |
| Rent (Warehouse) | $0 | $4,800 | $4,800 |
| Payroll Taxes | $3,036 | $6,199 | $7,464 |
| Agent Commission | $0 | $0 | $0 |
| Other | $0 | $0 | $0 |
| Total Operating Expenses | $71,848 | $89,819 | $96,084 |
| Profit Before Interest and Taxes | $11,744 | $21,638 | $43,237 |
| EBITDA | $11,744 | $21,638 | $43,237 |
| Interest Expense | $0 | $0 | $0 |
| Taxes Incurred | $2,786 | $5,409 | $10,989 |
| Net Profit | $8,958 | $16,228 | $32,247 |
| Net Profit/Sales | 6.43% | 8.74% | 13.89% |
7.5 Projected Cash Flow
Our projected cash flow is outlined in the following chart and table.

| Pro Forma Cash Flow | |||
| FY 1999 | FY 2000 | FY 2001 | |
| Cash Received | |||
| Cash from Operations | |||
| Cash Sales | $0 | $0 | $0 |
| Cash from Receivables | $128,486 | $178,949 | $225,389 |
| Subtotal Cash from Operations | $128,486 | $178,949 | $225,389 |
| Additional Cash Received | |||
| Sales Tax, VAT, HST/GST Received | $0 | $0 | $0 |
| New Current Borrowing | $0 | $0 | $0 |
| New Other Liabilities (interest-free) | $0 | $0 | $0 |
| New Long-term Liabilities | $5,000 | $0 | $0 |
| Sales of Other Current Assets | $21,000 | $0 | $0 |
| Sales of Long-term Assets | $0 | $0 | $0 |
| New Investment Received | $0 | $0 | $0 |
| Subtotal Cash Received | $154,486 | $178,949 | $225,389 |
| Expenditures | FY 1999 | FY 2000 | FY 2001 |
| Expenditures from Operations | |||
| Cash Spending | $43,992 | $54,000 | $59,000 |
| Bill Payments | $76,502 | $116,146 | $140,907 |
| Subtotal Spent on Operations | $120,494 | $170,146 | $199,907 |
| Additional Cash Spent | |||
| Sales Tax, VAT, HST/GST Paid Out | $0 | $0 | $0 |
| Principal Repayment of Current Borrowing | $0 | $0 | $0 |
| Other Liabilities Principal Repayment | $0 | $0 | $0 |
| Long-term Liabilities Principal Repayment | $12,000 | $12,000 | $12,000 |
| Purchase Other Current Assets | $0 | $0 | $0 |
| Purchase Long-term Assets | $0 | $0 | $0 |
| Dividends | $0 | $0 | $0 |
| Subtotal Cash Spent | $132,494 | $182,146 | $211,907 |
| Net Cash Flow | $21,992 | ($3,197) | $13,482 |
| Cash Balance | $34,992 | $31,795 | $45,277 |
7.6 Projected Balance Sheet
The table below outlines the projected balance sheet.
| Pro Forma Balance Sheet | |||
| FY 1999 | FY 2000 | FY 2001 | |
| Assets | |||
| Current Assets | |||
| Cash | $34,992 | $31,795 | $45,277 |
| Accounts Receivable | $20,434 | $27,245 | $34,056 |
| Inventory | $6,130 | $8,173 | $10,217 |
| Other Current Assets | $0 | $0 | $0 |
| Total Current Assets | $61,556 | $67,213 | $89,550 |
| Long-term Assets | |||
| Long-term Assets | $3,000 | $3,000 | $3,000 |
| Accumulated Depreciation | $3,000 | $3,000 | $3,000 |
| Total Long-term Assets | $0 | $0 | $0 |
| Total Assets | $61,556 | $67,213 | $89,550 |
| Liabilities and Capital | FY 1999 | FY 2000 | FY 2001 |
| Current Liabilities | |||
| Accounts Payable | $8,234 | $9,664 | $11,753 |
| Current Borrowing | $0 | $0 | $0 |
| Other Current Liabilities | $15,000 | $15,000 | $15,000 |
| Subtotal Current Liabilities | $23,234 | $24,664 | $26,753 |
| Long-term Liabilities | $173,000 | $161,000 | $149,000 |
| Total Liabilities | $196,234 | $185,664 | $175,753 |
| Paid-in Capital | $10,000 | $10,000 | $10,000 |
| Retained Earnings | ($153,636) | ($144,678) | ($128,450) |
| Earnings | $8,958 | $16,228 | $32,247 |
| Total Capital | ($134,678) | ($118,450) | ($86,203) |
| Total Liabilities and Capital | $61,556 | $67,213 | $89,550 |
| Net Worth | ($134,678) | ($118,450) | ($86,203) |
7.7 Business Ratios
Poppi’s ratios can be seen in the table below. NAICS code 423210, Furniture Merchant Wholesalers, was used for Industry Profile comparisons.
| Ratio Analysis | ||||
| FY 1999 | FY 2000 | FY 2001 | Industry Profile | |
| Sales Growth | 16.10% | 33.33% | 25.00% | 6.12% |
| Percent of Total Assets | ||||
| Accounts Receivable | 33.20% | 40.53% | 38.03% | 26.55% |
| Inventory | 9.96% | 12.16% | 11.41% | 40.47% |
| Other Current Assets | 0.00% | 0.00% | 0.00% | 20.71% |
| Total Current Assets | 100.00% | 100.00% | 100.00% | 87.73% |
| Long-term Assets | 0.00% | 0.00% | 0.00% | 12.27% |
| Total Assets | 100.00% | 100.00% | 100.00% | 100.00% |
| Current Liabilities | 37.75% | 36.69% | 29.88% | 35.88% |
| Long-term Liabilities | 281.04% | 239.54% | 166.39% | 10.04% |
| Total Liabilities | 318.79% | 276.23% | 196.26% | 45.92% |
| Net Worth | -218.79% | -176.23% | -96.26% | 54.08% |
| Percent of Sales | ||||
| Sales | 100.00% | 100.00% | 100.00% | 100.00% |
| Gross Margin | 60.00% | 60.00% | 60.00% | 13.68% |
| Selling, General & Administrative Expenses | 40.25% | 46.58% | 43.37% | 5.84% |
| Advertising Expenses | 4.31% | 3.23% | 2.58% | 0.69% |
| Profit Before Interest and Taxes | 8.43% | 11.65% | 18.62% | 1.61% |
| Main Ratios | ||||
| Current | 2.65 | 2.73 | 3.35 | 2.22 |
| Quick | 2.39 | 2.39 | 2.97 | 0.98 |
| Total Debt to Total Assets | 318.79% | 276.23% | 196.26% | 50.20% |
| Pre-tax Return on Net Worth | -8.72% | -18.27% | -50.16% | 5.00% |
| Pre-tax Return on Assets | 19.08% | 32.19% | 48.28% | 10.03% |
| Additional Ratios | FY 1999 | FY 2000 | FY 2001 | |
| Net Profit Margin | 6.43% | 8.74% | 13.89% | n.a |
| Return on Equity | 0.00% | 0.00% | 0.00% | n.a |
| Activity Ratios | ||||
| Accounts Receivable Turnover | 6.82 | 6.82 | 6.82 | n.a |
| Collection Days | 44 | 47 | 48 | n.a |
| Inventory Turnover | 10.30 | 10.39 | 10.10 | n.a |
| Accounts Payable Turnover | 9.80 | 12.17 | 12.17 | n.a |
| Payment Days | 29 | 28 | 27 | n.a |
| Total Asset Turnover | 2.26 | 2.76 | 2.59 | n.a |
| Debt Ratios | ||||
| Debt to Net Worth | 0.00 | 0.00 | 0.00 | n.a |
| Current Liab. to Liab. | 0.12 | 0.13 | 0.15 | n.a |
| Liquidity Ratios | ||||
| Net Working Capital | $38,322 | $42,550 | $62,797 | n.a |
| Interest Coverage | 0.00 | 0.00 | 0.00 | n.a |
| Additional Ratios | ||||
| Assets to Sales | 0.44 | 0.36 | 0.39 | n.a |
| Current Debt/Total Assets | 38% | 37% | 30% | n.a |
| Acid Test | 1.51 | 1.29 | 1.69 | n.a |
| Sales/Net Worth | 0.00 | 0.00 | 0.00 | n.a |
| Dividend Payout | 0.00 | 0.00 | 0.00 | n.a |
Appendix
| Sales Forecast | |||||||||||||
| Apr | May | Jun | Jul | Aug | Sep | Oct | Nov | Dec | Jan | Feb | Mar | ||
| Sales | |||||||||||||
| Retailer Sales | 0% | $8,164 | $8,164 | $8,164 | $8,164 | $8,792 | $8,792 | $8,792 | $10,048 | $10,048 | $11,304 | $11,304 | $11,304 |
| Designer Sales | 0% | $1,157 | $1,157 | $1,157 | $1,157 | $1,246 | $1,246 | $1,246 | $1,424 | $1,424 | $1,602 | $1,602 | $1,602 |
| Wholesale | 0% | $741 | $741 | $741 | $741 | $798 | $798 | $798 | $912 | $912 | $1,026 | $1,026 | $1,026 |
| Other | 0% | $0 | $0 | $0 | $0 | $0 | $0 | $0 | $0 | $0 | $0 | $0 | $0 |
| Total Sales | $10,062 | $10,062 | $10,062 | $10,062 | $10,836 | $10,836 | $10,836 | $12,384 | $12,384 | $13,932 | $13,932 | $13,932 | |
| Direct Cost of Sales | Apr | May | Jun | Jul | Aug | Sep | Oct | Nov | Dec | Jan | Feb | Mar | |
| Retailer Sales | 40% | $3,266 | $3,266 | $3,266 | $3,266 | $3,517 | $3,517 | $3,517 | $4,019 | $4,019 | $4,522 | $4,522 | $4,522 |
| Designer Sales | 40% | $463 | $463 | $463 | $463 | $498 | $498 | $498 | $570 | $570 | $641 | $641 | $641 |
| Wholesale | 40% | $296 | $296 | $296 | $296 | $319 | $319 | $319 | $365 | $365 | $410 | $410 | $410 |
| Other | 40% | $0 | $0 | $0 | $0 | $0 | $0 | $0 | $0 | $0 | $0 | $0 | $0 |
| Subtotal Direct Cost of Sales | $4,025 | $4,025 | $4,025 | $4,025 | $4,334 | $4,334 | $4,334 | $4,954 | $4,954 | $5,573 | $5,573 | $5,573 | |
| Personnel Plan | |||||||||||||
| Apr | May | Jun | Jul | Aug | Sep | Oct | Nov | Dec | Jan | Feb | Mar | ||
| Admin. Assist. | 0% | $1,666 | $1,666 | $1,666 | $1,666 | $1,666 | $1,666 | $1,666 | $1,666 | $1,666 | $1,666 | $1,666 | $1,666 |
| Owner | 0% | $2,000 | $2,000 | $2,000 | $2,000 | $2,000 | $2,000 | $2,000 | $2,000 | $2,000 | $2,000 | $2,000 | $2,000 |
| Other | 0% | $0 | $0 | $0 | $0 | $0 | $0 | $0 | $0 | $0 | $0 | $0 | $0 |
| Total People | 2 | 2 | 2 | 2 | 2 | 2 | 2 | 2 | 2 | 2 | 2 | 2 | |
| Total Payroll | $3,666 | $3,666 | $3,666 | $3,666 | $3,666 | $3,666 | $3,666 | $3,666 | $3,666 | $3,666 | $3,666 | $3,666 | |
| General Assumptions | |||||||||||||
| Apr | May | Jun | Jul | Aug | Sep | Oct | Nov | Dec | Jan | Feb | Mar | ||
| Plan Month | 1 | 2 | 3 | 4 | 5 | 6 | 7 | 8 | 9 | 10 | 11 | 12 | |
| Current Interest Rate | 0.00% | 0.00% | 0.00% | 0.00% | 0.00% | 0.00% | 0.00% | 0.00% | 0.00% | 0.00% | 0.00% | 0.00% | |
| Long-term Interest Rate | 0.00% | 0.00% | 0.00% | 0.00% | 0.00% | 0.00% | 0.00% | 0.00% | 0.00% | 0.00% | 0.00% | 0.00% | |
| Tax Rate | 30.00% | 25.00% | 25.00% | 25.00% | 25.00% | 25.00% | 25.00% | 25.00% | 25.00% | 25.00% | 25.00% | 25.00% | |
| Other | 0 | 0 | 0 | 0 | 0 | 0 | 0 | 0 | 0 | 0 | 0 | 0 | |
| Pro Forma Profit and Loss | |||||||||||||
| Apr | May | Jun | Jul | Aug | Sep | Oct | Nov | Dec | Jan | Feb | Mar | ||
| Sales | $10,062 | $10,062 | $10,062 | $10,062 | $10,836 | $10,836 | $10,836 | $12,384 | $12,384 | $13,932 | $13,932 | $13,932 | |
| Direct Cost of Sales | $4,025 | $4,025 | $4,025 | $4,025 | $4,334 | $4,334 | $4,334 | $4,954 | $4,954 | $5,573 | $5,573 | $5,573 | |
| Other | $0 | $0 | $0 | $0 | $0 | $0 | $0 | $0 | $0 | $0 | $0 | $0 | |
| Total Cost of Sales | $4,025 | $4,025 | $4,025 | $4,025 | $4,334 | $4,334 | $4,334 | $4,954 | $4,954 | $5,573 | $5,573 | $5,573 | |
| Gross Margin | $6,037 | $6,037 | $6,037 | $6,037 | $6,502 | $6,502 | $6,502 | $7,430 | $7,430 | $8,359 | $8,359 | $8,359 | |
| Gross Margin % | 60.00% | 60.00% | 60.00% | 60.00% | 60.00% | 60.00% | 60.00% | 60.00% | 60.00% | 60.00% | 60.00% | 60.00% | |
| Expenses | |||||||||||||
| Payroll | $3,666 | $3,666 | $3,666 | $3,666 | $3,666 | $3,666 | $3,666 | $3,666 | $3,666 | $3,666 | $3,666 | $3,666 | |
| Sales and Marketing and Other Expenses | $4,610 | $1,610 | $610 | $1,610 | $610 | $1,610 | $610 | $1,610 | $610 | $1,610 | $610 | $1,610 | |
| Depreciation | $0 | $0 | $0 | $0 | $0 | $0 | $0 | $0 | $0 | $0 | $0 | $0 | |
| Leased Equipment | $0 | $0 | $0 | $0 | $0 | $0 | $0 | $0 | $0 | $0 | $0 | $0 | |
| Utilities (Telephone) | $500 | $500 | $500 | $500 | $500 | $500 | $500 | $500 | $500 | $500 | $500 | $500 | |
| Insurance (Liability/Fire) | $0 | $0 | $1,500 | $0 | $0 | $0 | $0 | $0 | $0 | $0 | $0 | $0 | |
| Rent (Warehouse) | $0 | $0 | $0 | $0 | $0 | $0 | $0 | $0 | $0 | $0 | $0 | $0 | |
| Payroll Taxes | 13% | $253 | $253 | $253 | $253 | $253 | $253 | $253 | $253 | $253 | $253 | $253 | $253 |
| Agent Commission | 7% | $0 | $0 | $0 | $0 | $0 | $0 | $0 | $0 | $0 | $0 | $0 | $0 |
| Other | $0 | $0 | $0 | $0 | $0 | $0 | $0 | $0 | $0 | $0 | $0 | $0 | |
| Total Operating Expenses | $9,029 | $6,029 | $6,529 | $6,029 | $5,029 | $6,029 | $5,029 | $6,029 | $5,029 | $6,029 | $5,029 | $6,029 | |
| Profit Before Interest and Taxes | ($2,992) | $8 | ($492) | $8 | $1,473 | $473 | $1,473 | $1,401 | $2,401 | $2,330 | $3,330 | $2,330 | |
| EBITDA | ($2,992) | $8 | ($492) | $8 | $1,473 | $473 | $1,473 | $1,401 | $2,401 | $2,330 | $3,330 | $2,330 | |
| Interest Expense | $0 | $0 | $0 | $0 | $0 | $0 | $0 | $0 | $0 | $0 | $0 | $0 | |
| Taxes Incurred | ($898) | $2 | ($123) | $2 | $368 | $118 | $368 | $350 | $600 | $583 | $833 | $583 | |
| Net Profit | ($2,094) | $6 | ($369) | $6 | $1,104 | $354 | $1,104 | $1,051 | $1,801 | $1,748 | $2,498 | $1,748 | |
| Net Profit/Sales | -20.81% | 0.06% | -3.67% | 0.06% | 10.19% | 3.27% | 10.19% | 8.49% | 14.54% | 12.54% | 17.93% | 12.54% | |
| Pro Forma Cash Flow | |||||||||||||
| Apr | May | Jun | Jul | Aug | Sep | Oct | Nov | Dec | Jan | Feb | Mar | ||
| Cash Received | |||||||||||||
| Cash from Operations | |||||||||||||
| Cash Sales | $0 | $0 | $0 | $0 | $0 | $0 | $0 | $0 | $0 | $0 | $0 | $0 | |
| Cash from Receivables | $6,400 | $8,566 | $10,062 | $10,062 | $10,062 | $10,475 | $10,836 | $10,836 | $11,662 | $12,384 | $13,210 | $13,932 | |
| Subtotal Cash from Operations | $6,400 | $8,566 | $10,062 | $10,062 | $10,062 | $10,475 | $10,836 | $10,836 | $11,662 | $12,384 | $13,210 | $13,932 | |
| Additional Cash Received | |||||||||||||
| Sales Tax, VAT, HST/GST Received | 0.00% | $0 | $0 | $0 | $0 | $0 | $0 | $0 | $0 | $0 | $0 | $0 | $0 |
| New Current Borrowing | $0 | $0 | $0 | $0 | $0 | $0 | $0 | $0 | $0 | $0 | $0 | $0 | |
| New Other Liabilities (interest-free) | $0 | $0 | $0 | $0 | $0 | $0 | $0 | $0 | $0 | $0 | $0 | $0 | |
| New Long-term Liabilities | $5,000 | $0 | $0 | $0 | $0 | $0 | $0 | $0 | $0 | $0 | $0 | $0 | |
| Sales of Other Current Assets | $21,000 | $0 | $0 | $0 | $0 | $0 | $0 | $0 | $0 | $0 | $0 | $0 | |
| Sales of Long-term Assets | $0 | $0 | $0 | $0 | $0 | $0 | $0 | $0 | $0 | $0 | $0 | $0 | |
| New Investment Received | $0 | $0 | $0 | $0 | $0 | $0 | $0 | $0 | $0 | $0 | $0 | $0 | |
| Subtotal Cash Received | $32,400 | $8,566 | $10,062 | $10,062 | $10,062 | $10,475 | $10,836 | $10,836 | $11,662 | $12,384 | $13,210 | $13,932 | |
| Expenditures | Apr | May | Jun | Jul | Aug | Sep | Oct | Nov | Dec | Jan | Feb | Mar | |
| Expenditures from Operations | |||||||||||||
| Cash Spending | $3,666 | $3,666 | $3,666 | $3,666 | $3,666 | $3,666 | $3,666 | $3,666 | $3,666 | $3,666 | $3,666 | $3,666 | |
| Bill Payments | $4,149 | $4,429 | $3,469 | $6,475 | $6,390 | $6,420 | $6,791 | $6,142 | $8,300 | $6,993 | $9,152 | $7,793 | |
| Subtotal Spent on Operations | $7,815 | $8,095 | $7,135 | $10,141 | $10,056 | $10,086 | $10,457 | $9,808 | $11,966 | $10,659 | $12,818 | $11,459 | |
| Additional Cash Spent | |||||||||||||
| Sales Tax, VAT, HST/GST Paid Out | $0 | $0 | $0 | $0 | $0 | $0 | $0 | $0 | $0 | $0 | $0 | $0 | |
| Principal Repayment of Current Borrowing | $0 | $0 | $0 | $0 | $0 | $0 | $0 | $0 | $0 | $0 | $0 | $0 | |
| Other Liabilities Principal Repayment | $0 | $0 | $0 | $0 | $0 | $0 | $0 | $0 | $0 | $0 | $0 | $0 | |
| Long-term Liabilities Principal Repayment | $1,000 | $1,000 | $1,000 | $1,000 | $1,000 | $1,000 | $1,000 | $1,000 | $1,000 | $1,000 | $1,000 | $1,000 | |
| Purchase Other Current Assets | $0 | $0 | $0 | $0 | $0 | $0 | $0 | $0 | $0 | $0 | $0 | $0 | |
| Purchase Long-term Assets | $0 | $0 | $0 | $0 | $0 | $0 | $0 | $0 | $0 | $0 | $0 | $0 | |
| Dividends | $0 | $0 | $0 | $0 | $0 | $0 | $0 | $0 | $0 | $0 | $0 | $0 | |
| Subtotal Cash Spent | $8,815 | $9,095 | $8,135 | $11,141 | $11,056 | $11,086 | $11,457 | $10,808 | $12,966 | $11,659 | $13,818 | $12,459 | |
| Net Cash Flow | $23,585 | ($528) | $1,927 | ($1,079) | ($994) | ($611) | ($621) | $28 | ($1,305) | $725 | ($608) | $1,473 | |
| Cash Balance | $36,585 | $36,057 | $37,984 | $36,905 | $35,911 | $35,300 | $34,679 | $34,708 | $33,403 | $34,128 | $33,520 | $34,992 | |
| Pro Forma Balance Sheet | |||||||||||||
| Apr | May | Jun | Jul | Aug | Sep | Oct | Nov | Dec | Jan | Feb | Mar | ||
| Assets | Starting Balances | ||||||||||||
| Current Assets | |||||||||||||
| Cash | $13,000 | $36,585 | $36,057 | $37,984 | $36,905 | $35,911 | $35,300 | $34,679 | $34,708 | $33,403 | $34,128 | $33,520 | $34,992 |
| Accounts Receivable | $9,600 | $13,262 | $14,758 | $14,758 | $14,758 | $15,532 | $15,893 | $15,893 | $17,441 | $18,163 | $19,711 | $20,434 | $20,434 |
| Inventory | $11,764 | $7,739 | $4,714 | $4,427 | $4,427 | $4,768 | $4,768 | $4,768 | $5,449 | $5,449 | $6,130 | $6,130 | $6,130 |
| Other Current Assets | $21,000 | $0 | $0 | $0 | $0 | $0 | $0 | $0 | $0 | $0 | $0 | $0 | $0 |
| Total Current Assets | $55,364 | $57,586 | $55,529 | $57,169 | $56,090 | $56,210 | $55,960 | $55,340 | $57,597 | $57,015 | $59,969 | $60,083 | $61,556 |
| Long-term Assets | |||||||||||||
| Long-term Assets | $3,000 | $3,000 | $3,000 | $3,000 | $3,000 | $3,000 | $3,000 | $3,000 | $3,000 | $3,000 | $3,000 | $3,000 | $3,000 |
| Accumulated Depreciation | $3,000 | $3,000 | $3,000 | $3,000 | $3,000 | $3,000 | $3,000 | $3,000 | $3,000 | $3,000 | $3,000 | $3,000 | $3,000 |
| Total Long-term Assets | $0 | $0 | $0 | $0 | $0 | $0 | $0 | $0 | $0 | $0 | $0 | $0 | $0 |
| Total Assets | $55,364 | $57,586 | $55,529 | $57,169 | $56,090 | $56,210 | $55,960 | $55,340 | $57,597 | $57,015 | $59,969 | $60,083 | $61,556 |
| Liabilities and Capital | Apr | May | Jun | Jul | Aug | Sep | Oct | Nov | Dec | Jan | Feb | Mar | |
| Current Liabilities | |||||||||||||
| Accounts Payable | $4,000 | $4,317 | $3,253 | $6,262 | $6,177 | $6,193 | $6,588 | $5,863 | $8,070 | $6,686 | $8,893 | $7,509 | $8,234 |
| Current Borrowing | $0 | $0 | $0 | $0 | $0 | $0 | $0 | $0 | $0 | $0 | $0 | $0 | $0 |
| Other Current Liabilities | $15,000 | $15,000 | $15,000 | $15,000 | $15,000 | $15,000 | $15,000 | $15,000 | $15,000 | $15,000 | $15,000 | $15,000 | $15,000 |
| Subtotal Current Liabilities | $19,000 | $19,317 | $18,253 | $21,262 | $21,177 | $21,193 | $21,588 | $20,863 | $23,070 | $21,686 | $23,893 | $22,509 | $23,234 |
| Long-term Liabilities | $180,000 | $184,000 | $183,000 | $182,000 | $181,000 | $180,000 | $179,000 | $178,000 | $177,000 | $176,000 | $175,000 | $174,000 | $173,000 |
| Total Liabilities | $199,000 | $203,317 | $201,253 | $203,262 | $202,177 | $201,193 | $200,588 | $198,863 | $200,070 | $197,686 | $198,893 | $196,509 | $196,234 |
| Paid-in Capital | $10,000 | $10,000 | $10,000 | $10,000 | $10,000 | $10,000 | $10,000 | $10,000 | $10,000 | $10,000 | $10,000 | $10,000 | $10,000 |
| Retained Earnings | ($153,636) | ($153,636) | ($153,636) | ($153,636) | ($153,636) | ($153,636) | ($153,636) | ($153,636) | ($153,636) | ($153,636) | ($153,636) | ($153,636) | ($153,636) |
| Earnings | $0 | ($2,094) | ($2,088) | ($2,457) | ($2,451) | ($1,346) | ($992) | $113 | $1,164 | $2,965 | $4,712 | $7,210 | $8,958 |
| Total Capital | ($143,636) | ($145,730) | ($145,724) | ($146,093) | ($146,087) | ($144,982) | ($144,628) | ($143,523) | ($142,472) | ($140,671) | ($138,924) | ($136,426) | ($134,678) |
| Total Liabilities and Capital | $55,364 | $57,586 | $55,529 | $57,169 | $56,090 | $56,210 | $55,960 | $55,340 | $57,597 | $57,015 | $59,969 | $60,083 | $61,556 |
| Net Worth | ($143,636) | ($145,730) | ($145,724) | ($146,093) | ($146,087) | ($144,982) | ($144,628) | ($143,523) | ($142,472) | ($140,671) | ($138,924) | ($136,426) | ($134,678) |


