
Evergreen Life Memorial Center
Executive Summary
Ceremonial practices around death, as practiced by U.S. funeral homes, are leaving a growing segment of the population feeling poorly served. This plan outlines the strategy by which the Evergreen Life Memorial Center (the Center) will define and dominate a new category of funeral provider in AnyCounty, Oregon. It also details how the financing it acquires will be used toward this end.
The Center will be formed as an LLC in the Anytown metropolitan area. It will be solely owned by Stan Peters, an experienced funeral home director and embalmer, active in nonprofit and community activities.
Establishment of the Evergreen Life Memorial Center will provide Anytown and the surrounding area with a way for people to celebrate the life of the individual when it ends and for the living to gather social support to bring closure and move ahead with their lives. Its cornerstone will be the use of a reception area for social gatherings after the funeral that will foster human connection and uplifting remembrance. This is the way the aging segment of Baby Boomers is showing it prefers. This facility will also be the basis of its strategy of community involvement to rapidly develop the reputation the Center needs to attract business in a way that benefits the charities it supports as well. Digitized photos will be used for the reception as well as on our website to extend the celebration of the individual’s life beyond the funeral.
Based on recent average prices nationwide, the Center has the potential of attaining its market share of $768,213 within four years. At the Center’s current prices, its market share is worth $841,412. The industry average gross margin for a funeral home is 62.5 percent. The funding of $225,000 requested in this plan is projected to result in an annual net profit of approximately $194,000 in the Center’s fourth year of operation, with subsequent increases annually due to inflation.
With the establishment of the Evergreen Life Memorial Center, those who lose someone to death will for the first time in our era be integrated into the community of life instead of stigmatized and marginalized. There will be a new center for community involvement. And for the first time, the Boomer generation will be able to go out the way it lived.
1.1 Objectives
The Evergreen Life Memorial Center provides celebration of an individual’s life and social support to bring closure and move ahead with living. The Center will develop by Year 4, a reputation as the uplifting place for locally prominent persons of the Baby Boom generation to celebrate their lives when they end.
In order to achieve this, the Center will create facilities that bring families and communities together in a way that celebrates the life of the deceased and renews bonds of social support.
Digitized photos and films of the deceased will be available in the reception room and on our website.
These facilities will be available free to a number of nonprofit organizations in which the owner, Stan Peters, will be involved. This will:
- Tie the Center into the community of the living and develop positive associations.
- Develop a strong reputation by creating community events in the Center which the local media will want to publicize.
- Serve the owner’s interest in helping others and improving the community.
Stan Peters will make himself available for a leadership position starting a local chapter of a nonprofit that helps children with life-threatening diseases, such as the Make-A-Wish Foundation.
The Center will provide a funeral planning guide for estate attorneys to give to their clients.
These efforts will be supported by a publicity campaign in order to be the first in people’s minds with this new category of funeral provider. Evergreen Life Memorial Center, “People remembering people.”
1.2 Mission
The mission of the Evergreen Life Memorial Center is to bring people together to celebrate life when it ends and to move on with living. The Center will have facilities that bring families and communities together to remember the life of the deceased and renew bonds of social support. The Center’s facilities will be a focus of nonprofit energies to make the community a better place to live.
1.3 Keys to Success
Since 71 percent of people choose a funeral home on the basis of reputation, the key to success is quickly establishing a reputation for this new category as the uplifting place for Baby Boomers to celebrate life when they die.
The Center’s cornerstone will be its reception facilities, which will promote uplifting interactions with people after the funeral and be used for nonprofit organizations. This will make the Center uplifting, connect it to the community, provide the basis for publicity, and make it a center for the living.
The reception room and website will feature digital photos and films of the persons whose lives are being celebrated. This web presence will increase the Center’s exposure by letting people participate in the celebration of life after the funeral and reception are over.
Providing the greatest choice of quality caskets will make the Center the place to celebrate the lives of locally prominent persons. This will foster publicity and further promote our reputation.
Company Summary
Evergreen Life Memorial Center will be a new type of funeral home provider. It will provide a celebration of life when an individual dies and gather social support for the living to bring closure and move on. This will be made possible by providing reception facilities after the funeral where people can gather for refreshments in an uplifting environment surrounded by digitized photos and films of the life being celebrated. The facilities will include intimate gathering areas for people who want to break off from the larger activities, and private meeting rooms with couches and chairs. These facilities will also be available for the use of nonprofits, further integrating the Center into the community.
This combination of life celebration and social support is the way people of the Baby Boom generation are demonstrating they want to go out. Boomers are currently directly involved in making choices about their parents’ funerals, and are in the leading edge of a demographic bulge that is beginning to experience more funerals itself. Funerals for Boomers are expected to increase dramatically until the annual number of funerals by 2040 will nearly double from its current levels.
The Center will be located in a former church building in central Eugene or in a small community closely adjoined to Eugene and unserved by funeral homes. The ideal facility will contain evergreen trees, helping the Center to live up to its name.
2.1 Company Ownership
Evergreen Life Memorial Center will be a limited liability company (LLC) owned entirely by Stan Peters. Stan Peters is a professional funeral director and embalmer with 10 years experience and a B.S. in funeral science. He chose funeral science because he was interested in the biological sciences and wanted to make a difference to people in time of need. He has been active in a number of nonprofit organizations, including a California chapter of the Make-A-Wish Foundation.
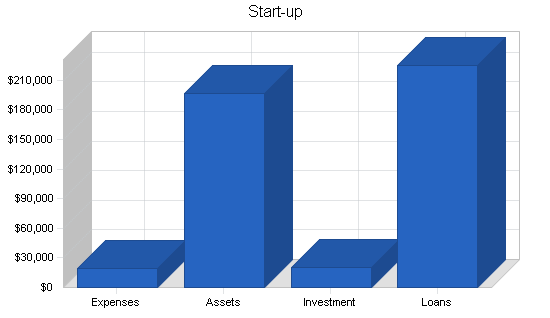
2.2 Start-up Summary
Our start-up requirements come to $216,700, including start-up expenses of $19,700 and assets totaling $197,000. The funding requested of $245,000 plus the owners investment will also provide $90,000 cash for working capital.

The assets to be purchased with this funding include $27,000 of current assets and $80,000 of long-term assets.
Current assets are in the form of $20,000 for display caskets and a $7,000 for display urns, as well as embalming chemicals and supplies.
Long-term capital outlays for which funding is sought are:
| Building Improvements (inc. Permits) | $20,000 |
| Reception Room Furnishings | 15,000 |
| Crematory Equipment | 15,000 |
| Refrigeration Unit | 5,000 |
| Embalming Equipment | 15,000 |
| Computer | 5,000 |
| Software | 5,000 |
| Total Capital Expenditures | $80,000 |
A church structure will be sought for purchase in the Anytown area for an estimated price of $400,000. A down payment of $80,000 will be financed directly by the owner’s family and is not included in this business plan. Mortgage payments are included as operating expenses.
Detailed start-up expenses are included in the following table and chart.
| Start-up | |
| Requirements | |
| Start-up Expenses | |
| Inserted Row | $0 |
| Licenses | $500 |
| Legal | $500 |
| Stationery etc. | $1,500 |
| Insurance | $1,000 |
| Mortgage Payments (First Month) | $3,200 |
| Corporate Identity and Website | $8,000 |
| Other | $5,000 |
| Total Start-up Expenses | $19,700 |
| Start-up Assets | |
| Cash Required | $90,000 |
| Other Current Assets | $27,000 |
| Long-term Assets | $80,000 |
| Total Assets | $197,000 |
| Total Requirements | $216,700 |
Products and Services
Evergreen Life Memorial Center is a place to celebrate the life of the departed and to bolster support systems for those who must live without them. The Center will provide services that are demanded by the Baby Boom generation who wants to celebrate the life of the individual together, rather than endure a morbid and stilted experience. In order to accomplish this, the Center will offer facilities and services that are for the living and for the community, not marginalized from it.
The Center’s cornerstone product will be use of the Reception Facility. Funerals bring people together who haven’t seen each other in years, even decades. In traditional services, people meet for a few hours and then they’re gone. The Center will capture the opportunity to bring people together, to celebrate life and to re-form the lines of support for those who live. To accomplish this, the Center will offer:
- A reception hall where meals and refreshments may be catered.
- Electronic presentation and projection of photos and films of the deceased, also available on our website.
- Soft background music selected by the family, if requested.
- Discreet areas where small groups may form for intimate discussions.
- Two rooms with couches and chairs for private meetings.
- A children’s playroom, supervised if requested.
- Easy wheelchair accessibility.
Use of the Chapel for funeral services.
Professional Services of the Director and staff. There will be one person who will guide the family through the entire process.
Caskets and Urns. The Center will offer the largest selection of caskets and urns of any funeral home in the area. Large funeral homes usually have corporate agreements with one of the top three casket companies: Batesville, York or Aurora. Many other funeral homes are given incentives to sell only one line of casket, although federal law prohibits funeral homes from not accepting any casket the customer wants. The Center will offer the complete line of Batesville and York caskets, for people who want the industry standard caskets. Batesville alone accounts for 45 percent of caskets sold in the U.S. To differentiate the Center and to bolster its market position as the place for people who want a different kind of funeral, the Center will supplement its offerings with caskets more interesting and diverse than the mass-produced caskets generally offered, including:
- Legacy Custom Caskets. These are handcrafted caskets made with the finest materials that give an impressive appearance, for those funerals where only the best will do.
- Cowboy’s Last Ride. Generally an unfinished, pine casket with a denim or horse blanket liner. “A fitting end for someone who spent his life caring for God’s creatures and land.”
- Specialized metal and fiberglass caskets with emblems painted on the inside for people belonging to firefighting, police, military and fraternal organizations.
- Other specialty caskets with unique features that emphasize the individuality of the deceased.
- A selection of low-cost caskets by independent providers.
Remembrance Products, including paper and electronic products to celebrate the life of the deceased. Digital photographs and films will be used during the reception and posted on our website, if desired.
Transportation, including use of hearse. Limousines will be contracted, if desired.
Refrigeration is required for viewing of the body beyond 72 hours after death if there is no embalming. With the growing demand for cremation and increasing environmental sensitivity about the chemicals involved in embalming, we expect a greater use of refrigeration in the future.
Embalming services. Embalming has been a traditionally assumed service, but consumers are mandated by federal law to be advised that it’s not required, except in certain rare cases. Embalming allowed funerals with viewing to take place more than 72 hours after death without noticeable decomposition. It is still the industry standard, and will be available at the Center.
Cremation services. Cremation services are the fastest growing segment of the death care industry.
Market Analysis Summary
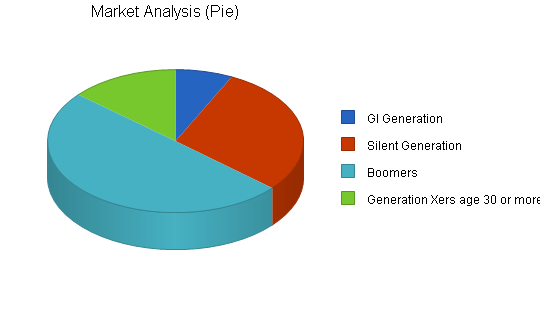
Defining who the customer is for a funeral home is complicated. Relatively few people pre-arrange their funerals while they’re alive, leaving most of the decisions to surviving family members. This becomes a complicated decision made by the person’s surviving spouse, if there is one, and the children of the deceased over the age of 30.
We have segmented the market in terms of the four generations that are over age 30 who form the active decision-making market. The four generations are the GI Generation (age 79 or older as of 2003), the Silent Generation (age 58 to 78), the Baby Boomers (age 39-57) and the portion of Generation X (age 23-38) that is over 30.
A new funeral home that was like all the others could not compete effectively for the most active market, the Silent Generation, against the reputations of long-established funeral homes in the area. The Center will be the first to appeal specifically to the tastes of the huge Baby Boom Generation for funerals that are about celebrating life rather than feeling morbid about death.
Targeting this market with this unique offering will not only attract Baby Boomers for their own funerals and those that they choose for their parents, it will also attract a significant percentage of the Silent Generation that has shown a propensity to spend money on itself and that likes to think young. It will further poise the Center for tremendous growth as the mortality rate of Boomers increases over the next 35 years.
4.1 Market Segmentation
The market is divided according to those who make the purchasing decisions regarding funerals. The market segments for the Center are divided by the generations of decision-makers over age 30.
- The GI Generation (born 1901-1924) This generation is age 79 or older as of 2003. This is the most active market. Its mortality rate is about 12 percent per year but it makes up only 3.9 percent of Lane County. Because the rate of dementia is high among this group, if funeral arrangements haven’t been pre-arranged, it’s likely their Baby Boomer children are making the arrangements.
- The Silent Generation (born 1925-1945). This is the age segment probably most marketed by existing funeral homes. It’s mortality rate is 2 percent per year, and it’s the generation that generally has the most money. It has been called the Silent Generation because it was sandwiched between the heroic GI Generation that fought World War II (now sometimes called “The Greatest Generation,” and the explosive Baby Boom Generation (also called the “Me Generation”). Many of the Silent Generation have been strongly influenced by the cultural revolution of the Baby Boom Generation. Widows are 67 percent of surviving spouses in this age group because their husbands generally die first. This relatively wealthy generation has always been financially conservative, but at this point, is more willing to splurge. It is currently driving the high-end motorhome market. This generation is 58 to 78 as of 2003 and composes 15.9 percent of the local population.
- Boomers (The post World War II “baby boom generation” born 1946 through 1964.) Members of this generation are increasingly involved in funeral decisions as their parents, spouses or children die. This age cohort is currently age 39-57, as of 2003, and comprises 27.2 percent of the Eugene-Springfield MSA, and over half of the demographic that makes funeral decisions. This is nearly twice the number of the Silent Generation cohort. Its mortality rate is currently only 0.3 percent, but is poised to grow rapidly over the next 35 years. It also makes many of the decisions for older and younger cohorts.
- Generation X (1965-1980) This is the youngest cohort to make funeral decisions, with only members of this generation age 30 or older included as a market segment. Generation X members over the age of 30 comprise only 7.9 percent of Lane County, its mortality rate is low and it probably has the least input into the decisions about funerals. This generation challenges authority, is environmentally and socially concerned and watches its health. It’s more interested in quality time and peace of mind than in materialism. The members of this cohort age 30 to 38 makes up 7.5 percent of the MSA.
The Eugene-Springfield MSA conforms closely with the geographical boundaries of Lane County. Over two-thirds of the population of Lane County lives in Anytown metropolitan area.
| Market Analysis | |||||||
| Year 1 | Year 2 | Year 3 | Year 4 | Year 5 | |||
| Potential Customers | Growth | CAGR | |||||
| GI Generation | -12% | 12,650 | 11,081 | 9,707 | 8,503 | 7,449 | -12.40% |
| Silent Generation | -2% | 51,618 | 50,586 | 49,574 | 48,583 | 47,611 | -2.00% |
| Boomers | 0% | 87,984 | 87,720 | 87,457 | 87,195 | 86,933 | -0.30% |
| Generation Xers age 30 or more | 10% | 24,128 | 26,541 | 29,195 | 32,115 | 35,327 | 10.00% |
| Total | 0.13% | 176,380 | 175,928 | 175,933 | 176,396 | 177,320 | 0.13% |
4.2 Target Market Segment Strategy
The target market for the Center is the Baby Boom generation. It comprises over 50 percent of those of age to make funeral decisions in Lane County. The Silent Generation, for which more traditional funeral homes are competing, comprises 29 percent of the funeral decision makers. The GI Generation is over age 79 and its decisions are likely to be made by younger generations, including Boomers.
Baby Boomers, children of the post-war Baby Boom born 1946 through 1964, have changed business and culture from the time they were born. First the diaper business enjoyed the boom, then schools were rapidly built for them. In the years 1976 to 1980, the price of homes began to dramatically increase as this age cohort began to turn 30 and settled down. Now in middle age, Boomers are increasingly involved in making funeral choices for their elderly parents. As this generation approaches age 60, it is expected to dramatically increase the number of deaths over the next 35 years.
While the Baby Boom generation has been a boon for many businesses because of its numbers, it has also changed popular culture. It has been called the “Me generation” because it honors the individual. The trend toward more individualized funerals has already been widely noted in the industry.
The Baby Boom Generation is demonstrating a demand for more individualized funerals with more of a sense of celebration. Our strategy is to target this generation by appealing to its tastes. Just as Pepsi-Cola experienced in the 1960s when it targeted this generation, we believe we’ll draw more people from the Silent Generation who “think young” than we would by being just another traditional funeral home. The Silent Generation is showing a propensity to splurge, and we’ll offer greater opportunity to splurge on their funerals than more traditional providers.
Some 71 percent of people choose a funeral home by reputation. The Center would not be able to compete on the basis of reputation compared to funeral homes that have operated in the area for generations, or those that used to be run by families but have been bought by chains. In order to create a reputation rapidly, the Center will stimulate community involvement that brings people to the reception facility and generates publicity. It will draw the attention of those who want to celebrate life rather than host a morbid proceeding, and will create a new category of funeral provider which it will dominate.
Capturing this market will also put the Center in position for long-term growth as the Baby Boom Generation experiences mortality. The number of U.S. deaths is expected to increase at a rate of 11.3 percent over the first decade of the 21st century, reaching 2,634,000 deaths for the year 2010. The rate of deaths is projected to increase each subsequent decade until it peaks at 18.1 percent growth for the decade ending 2040. In that year, 4.1 million deaths are projected.
4.3 Service Business Analysis
When someone dies, there are relatively few alternatives available to people to take care of the remains and to bring closure.
- Funeral homes usually provide the following services:
- Funeral service, often with viewing because some people need to see the body to psychologically accept that the individual has died.
- Embalming is necessary if the funeral will take place more than 72 hours after death, especially if there is a viewing, unless it is refrigerated.
- Preparation of the remains for viewing.
- Transportation of the body to the funeral home and to the gravesite.
- Funeral products, including caskets, urns and remembrance products.
- Immediate burial, performed without a service.
- Cremation, with or without a service.
- Cremation specialists, offering immediate cremation without a service that’s performed by a funeral director. If a service is desired, it may be performed in a church or other spiritual setting, or even outdoors, with or without clergy.
Some 75 percent of people nationwide choose burials that usually involve the services of a funeral home.
4.3.1 Competition and Buying Patterns
According to a 2002 survey by the National Funeral Directors Association, the most common reason for choosing a funeral home are location (78 percent of respondents), reputation (71 percent) and that it previously served the family (70 percent). Only 36 percent cited price, suggesting that for those who choose funeral services, price sensitivity is relatively moderate. Some 23 percent said they selected the funeral home because it was suggested by a friend, and seven percent by clergy, but only 11 percent said it was from advertising.
The survey underscores why the funeral industry is a very staid and conservative one. Location and reputation are everything for people choosing a funeral home. Some of the most successful funeral homes have been operated by the same family for generations. Some chain operations have bought up such funeral homes and have used the family reputation after it is no longer owned by the family. The power of reputation is such that many people appear unaware of the change of ownership, or their perception is unaffected by it.
In metropolitan Anytown, there are ten funeral homes, serving over two-thirds of the population of Lane County. There are four additional funeral homes serving small communities in the county.
There has been a steady growth in the market for cremation. In 1990, 17 percent of deaths resulted in cremations nationwide, according to the Cremation Association of North America. By 2000, the percentage had grown to 26.6 percent. This reflected a 71 percent increase in the number of cremations. In Anytown there are three providers specializing in immediate cremations
Strategy and Implementation Summary
Being staid and traditional has helped funeral homes in this area that have been in the same family for generations to develop solid reputations. The Center cannot compete on the basis of being just another staid, conservative funeral home. It will succeed by quickly developing a reputation for being unique, offering something that a largest segment of the decision-making market is beginning to demand and that traditional funeral homes are not positioned to provide.
Traditional funeral homes have not been structured to meet the need for social support the living need to move forward and to complete the process of grief by coming to acceptance. The Center will be structured around the need that Baby Boomers are expressing to gather social support and to celebrate life.
5.1 Competitive Edge
The Evergreen Life Memorial Center is the first of a new category of funeral providers in the Anytown area. The Center provides celebration of the individual and social support to bring closure and move ahead with life. It will be the place for the Boomer generation to celebrate life when it ends because it will be more uplifting and social than traditional funeral homes. It will thus live up to its slogan, “People remembering people.”
There are three purposes of a funeral:
- Bringing closure. Sociologists and anthropologists note that death rituals such as wakes, funerals and burials are important ways of of acknowledging that death has really occurred. This is necessary so people can move toward completing the grief process by coming to acceptance. According to the Batesville Casket Company, “The funeral is about mental health and healing.”
- Social support. Sociologists also say that these rituals help resolve guilt, anger and relationships. It’s common for people to have feelings of regrets for what they did or didn’t do during the deceased individual’s life. For those attending the funeral, and especially for those choosing the kind of funeral to have, it’s the last opportunity to do the right thing for the deceased. The funeral is also a time to gather social support for the survivors. Social support can reduce stress and solve practical problems. When someone dies, it leaves a whole in the fabric of a social system that needs to be filled.
- Celebration. While traditionally funerals have been considered somber affairs, people are increasingly demanding more of a sense of celebration for the life of the departed. The funeral is an acknowledgement that the individual is gone, and may have been all that was needed when families lived close together. Since family’s generally live far apart in modern society, a celebration is an opportunity for people who haven’t seen each other in years to interact. It’s a time for people to lightly reflect on the gift that person gave us by being among us. Refreshments lighten the mood and are a way of sharing. Pictures of the deceased help bring out memories and stories. There is laughter as well as tears, sometimes anger, so private spaces to meet in small groups are important.
These three purposes: closure, social support and celebration are the ultimate products of the Evergreen Life Memorial Center. Traditional funeral homes have provided the rituals to bring closure, but have not provided the social support that is needed in modern times for the living to move forward and to complete the process of grief by coming to acceptance. The Center will be structured around the need for people to gather social support.
Traditional funeral homes are somber and morbid places people are afraid to go to. Funeral homes that are staid and conservative will not be preferred by the “Pepsi generation,” which laughed at parodies of such homes in the television series The Munsters. The Center will be a place of celebration actively involved in people’s lives that people will want to go to.
5.2 Marketing Strategy
Because reputation is the key to success of a funeral home, the focus of the Center will be to quickly establish a reputation as the place for celebrating life when it ends in the way baby boomers want to be remembered.
This will be accomplished by hosting nonprofit activities that gather wide publicity. Stan Peters, the owner, will take a leading position in forming a local chapter of an organization like the Make-A-Wish Foundation, which makes dreams come true for children with terminal illnesses. The death of a child is the hardest thing for nearly anyone to take, including funeral directors. The recreation and meeting rooms of the Center will be available for the free use of nonprofit organizations that the owner is personally excited about. A public relations firm will be used to orchestrate the maximum exposure for the Center, its activities and the charities it promotes. This will bring the Center into the life of the community and give it a reputation for caring and for celebrating life.
The choice of location will support this focus. The Center will be sited within the metropolitan area where over two-thirds of the Lane County population lives. The ideal location would be the purchase of a church with a chapel and recreation room, with a stand of Ponderosa pine or Douglas fir in the front and back to bolster its Evergreen brand.
5.3 Sales Strategy
Sales will be accomplished through implementing the sales process and the employment of a full-time sales professional in year three. During the first two years, the sales process will be implemented by the owner who will document procedures and training manuals.
The job of the sales professional will be to:
- Prospect and Qualify. The professional sales staff will be directly involved in networking the organization through a sales referral group, the Chamber of Commerce, and active participation in nonprofit causes that he or she is excited about. Pre-need business will be promoted though networking and through speech opportunities. Estate attorneys will be networked as well with a pamphlet we will present, How to Plan a Funeral that Celebrates Life. He or she will be a good listener, honing in on what the prospect really wants, including the price the prospect expects to pay.
- Presentation. How to Plan a Funeral that Celebrates Life will be our outside medium for presentation. Inside, the salesperson will begin the presentation by featuring our chapel and reception areas. Showing how the reception area works will be the most important selling point for letting us help celebrate the life of the deceased. The salesperson will make it clear that the Center is not the least expensive funeral home, but the most unique. The Center will have a room for displaying the most interesting collection of caskets in Oregon. Everything from a pine box with denim liner to top-of-the-line, handcrafted, glossy custom caskets suitable for a state funeral. The salesperson will narrow the choices for the prospect down to three, based on what the prospect indicated he or she wants.
- Proposal. The salesperson will write up a proposal according to the prospect’s choice that’s within his or her budget. The prospect will already be aware that the Center is not the price leader, and what the reasons are for paying more with us.
- Close. The salesperson will give a soft close, gently asking for the business by saying something like, “Why don’t we just do this?”
The sales professional will not be commissioned in order to avoid hard sells, but will be compensated with a base pay that would be considered moderate for salary plus commissions of a good salesperson in this market. In addition, he or she may receive profit sharing based on the overall growth of the business.
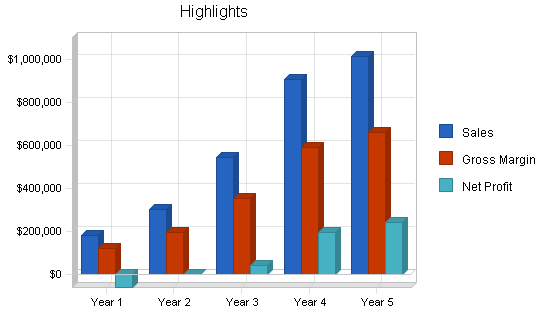
5.3.1 Sales Forecast
Sales forecasts are conservatively based on market share projections and the standard business growth curve.
There were 2,859 deaths in the Anytown MSA (closely equivalent to Lane County) in 2004. About 75 percent of deaths result in funerals nationwide. At the average 2003 price of $5,374, this means the funeral market in Lane County is worth $11,523,200.
Since there are currently 14 funeral homes in Lane County, and there will be 15 when the Center opens, the average market share will be $768,213 in 2003 dollars. The average price of funerals at the Center will be a little higher. We project the average funeral at Evergreen Memorial Center will be $5,884, broken down as follows:
- Professional Services $1249
- Staff $140
- Use of Reception Room $495
- Use of Chapel $375
- Dressing & Grooming $115
- Casket $1590
- Burial Vault $250
- Remembrance Products $330
- Transportation $915
- Total Avg. Funeral $5884
The average market share measured in the number of funerals per year will be 143 funerals a year. Our total sales for the first year are projected at one-fifth of the average market share, or about 29 funerals at our average funeral price of $5,884. Businesses start slowly and, if they capture a niche, will then grow quickly. The sales projections are based on sales of one funeral for each of the first four months, followed by two funerals a month for two months. After that, one additional funeral is added each month for the first year.
For the second year, sales grow to one-third market share with 48 funerals for the year. In year three, it becomes 3/5 of average market share at 86 funerals. In the fourth year, we acquire our full market share and our optimal level of sales with 143 funerals based on our current prices and death statistics. The 12 percent growth shown in FY 2010 merely shows revenues on optimal sales of 143 funerals catching up with inflation from the previous four-year period, assumed at three percent per year.
The Cost of Goods Sold percentage of 35 percent is based on industry averages according to trade literature.
Sales of Immediate Cremations are projected according to market share of Lane County deaths that do not result in funerals (25 percent) multiplied times our average price. Our average price of an immediate cremation is as follows:
-
Cremation $1250
-
Remembrance Products $370
-
Bronze Urn $155
-
Total Cremation $1775
In order to secure these goals, the Center will develop publicity that will draw Baby Boomers because of its leadership in nonprofit causes and its unique reception facilities, offering individualized celebration and social support. A public relations firm will be retained to promote the Center. The sales staff will network and become involved in the community to bring in business. Finally, the sales program will effectively capture the business these activities bring in.


| Sales Forecast | |||||
| Year 1 | Year 2 | Year 3 | Year 4 | Year 5 | |
| Sales | |||||
| Funeral Products & Services | $170,665 | $280,471 | $504,847 | $841,412 | $942,381 |
| Direct Cremations | $12,425 | $22,265 | $40,078 | $66,796 | $74,812 |
| Total Sales | $183,090 | $302,736 | $544,925 | $908,208 | $1,017,193 |
| Direct Cost of Sales | Year 1 | Year 2 | Year 3 | Year 4 | Year 5 |
| Funeral Products & Services | $59,733 | $98,165 | $176,696 | $294,494 | $329,833 |
| Direct Cremations | $4,349 | $8,349 | $14,027 | $23,379 | $26,184 |
| Subtotal Direct Cost of Sales | $64,082 | $106,514 | $190,724 | $317,873 | $356,018 |
5.4 Milestones
The following table lists important program milestones, with dates and managers in charge, and budgets for each. The milestone schedule indicates our emphasis on planning for implementation. The most important programs are nonprofit activities to quickly establish our reputation as part of the community. These efforts were described in detail in previous sections.

| Milestones | |||||
| Milestone | Start Date | End Date | Budget | Manager | Department |
| Make Offer on Church | 2/1/2005 | 3/20/2005 | $0 | Stan Peters | Owner |
| Acquire Funding | 2/1/2005 | 3/1/2005 | $0 | Stan Peters | Owner |
| Corporate Identity | 3/1/2005 | 5/1/2005 | $4,000 | Marketing | Contractor |
| Develop Website | 3/1/2005 | 5/1/2005 | $4,000 | Marketing | Contractor |
| Permits & Licenses | 3/1/2005 | 4/1/2005 | $1,000 | Stan Peters | Staff |
| Purchase Church | 3/20/2005 | 4/1/2005 | $0 | Stan Peters | Owner |
| Building Improvements | 4/10/2005 | 6/1/2005 | $19,000 | Construction | Contractor |
| Furnishings | 4/10/2005 | 6/1/2005 | $10,000 | Interior Design | Contractor |
| Network with Nonprofits | 4/1/2005 | 6/30/2005 | $200 | Stan Peters | Sales |
| Begin Local Nonprofit Chapter | 5/1/2005 | 6/7/2005 | $200 | Stan Peters | Owner |
| Setup Embalming Room | 5/1/2005 | 6/1/2005 | $200 | Stan Peters | Owner |
| Lease Hearse | 5/1/2005 | 6/1/2005 | $200 | Stan Peters | Staff |
| Setup Casket Showroom | 5/1/2005 | 6/1/2005 | $2,000 | Stan Peters | Sales |
| Audio-Visual System | 5/1/2005 | 6/1/2005 | $5,000 | A-V Systems | Contractor |
| Start Publicity Campaign | 5/20/2005 | 6/30/2005 | $2,000 | Marketing | Contractor |
| Begin Hosting Nonprofit Events | 6/1/2005 | 6/3/2005 | $500 | Stan Peters | Sales |
| Totals | $48,300 | ||||
Web Plan Summary
Our website will be an integral part of our market effort to the computer savvy Baby Boom generation. It will also help fulfill our mission in celebrating the life of the individual online as well as in person, and by promoting our nonprofit work that ties us into the life of the community. These uses of the website will bring more people to the site and increase its marketing potential.
6.1 Website Marketing Strategy
Our target market is active on the Internet, and this fact will be fully employed in the strategy to attract Baby Boomers. The Center’s website will be used in a number of ways that both add value to the client and the community and increase the number of people seeking the website. These are described in detail in the following section.
Digitized pictures and films of the life being celebrated will be offered on our website as well as in the reception room. This will allow people who are unable to attend the funeral to share in the remembrance and celebration of the individual’s life. The website will solicit memories about the individual to be added to the site. The use of the website will allow the social support gathered in person during the funeral and reception to carry on after the ceremonies are over and expanded to people who couldn’t come.
Our website will be a most effective marketing tool by also serving as an intrinsic part of the Center’s activities. The website will host photos and memories of people whose families use our facilities. The website will also host our nonprofit activities and copies of articles about the Center and an online newsletter produced by our public relations firm. This will give exposure, not only to the nonprofits we support, but also the Center itself.
6.2 Development Requirements
The Evergreen Life Memorial Center’s website will be initially developed and hosted by our public relations firm, which will host the site and provide the technical back end. The firm will then train the owner and staff in how to add content on a regular basis.
The website will be an integral part of the function of the Center. The Center’s competitive edge is celebration of life, and the use of digitized photos and films will be used in the reception room for this purpose. But these photos and films will also be available on our website if the family wishes. People will be asked to write their remembrances during the reception, and these may be posted on the website. The family will be given the free use of a portion of our website for a year. The family may also choose to make some or all of this part of the website available only to people with a code in order to maintain privacy.
Providing this capability on the website will allow the family to:
- Keep the remembrance celebration going beyond the funeral
- Allow people to participate who were unable to attend the funeral
- Allow people to download images they don’t have
- Allow people to continue to share remembrances by email
- Allow the family to continue to gather social support.
Providing this capability will also aid in marketing the Center because it will cause people to actively seek out our website.
The nonprofit causes that the Center supports will also be hosted on our website. In a later phase, a directory of websites of community nonprofit organizations will be maintained on the website as well. This will make the Center a virtual as well as actual charitable center of the community.
The website will show illustrations of our facility and will motivate people who come across the website, because of a funeral or a nonprofit purpose, to want to use the Center in time of need
Management Summary
The Center’s management is comprised of an experienced funeral director and embalmer who has been active in the management of funeral homes for 10 years.
A policy manual and job descriptions have been developed and are ready for implementation. It is assumed that during the first two years of operation, sales will be low as the Center builds its reputation. The personnel plan calls for the owner to perform sales and administrative functions personally, with some help from family members who are also experienced in the funeral home industry. Staffing is ready to be implemented as soon as sales demand it.
This business is designed to be responsive to client’s needs while running lean and simply.
7.1 Personnel Plan
The personnel plan is as follows:
- The owner will be the funeral director,embalmer and cremator. During the first two years, he will also serve as salesperson and administrator. His needs are $60,000 per year. After the first fiscal year, all salaries will increase three percent per year.
- The salesperson will fulfill the marketing and sales plan and will be actively involved in nonprofit activities. Salary will begin at $31,830 in year three, increasing annually at three percent.
- The administrative assistant will work half-time beginning year three at $13.42 per hour, taking care of bookkeeping, invoicing, bill paying, payroll and other administrative matters. Beginning July 2007 these hours will double to a full-time position.
- Beginning with one half-time staff member July 2007 and expanding in July 2008 to two, the staff members will drive the hearse for pick-ups and for caravans to burial locations. They will assist in funerals and help the funeral director and clients as needed. The first staff position will begin half-time at $13,200 annually, increasing to full-time in July 2008 with at three percent annual raise. The second staff position will begin July 2008 at $25,750, increasing three percent per year.
| Personnel Plan | |||||
| Year 1 | Year 2 | Year 3 | Year 4 | Year 5 | |
| Owner | $60,000 | $61,800 | $63,654 | $65,564 | $67,531 |
| Salesperson | $0 | $0 | $31,830 | $32,785 | $33,768 |
| Administrative Assistant | $0 | $0 | $13,688 | $28,195 | $29,040 |
| Staff Member | $0 | $13,200 | $53,000 | $54,600 | $56,235 |
| Total People | 1 | 2 | 5 | 5 | 5 |
| Total Payroll | $60,000 | $75,000 | $162,172 | $181,144 | $186,574 |
Financial Plan
This financial plan is based on acquiring a loan for $225,000 secured by the owner’s home. The owner will provide $20,000 of start-up investment personally as well as $80,000 down payment for purchasing a church or similar building.
The Center will achieve profitability in just over two years and reach annual net profit of approximately $196,000 in the Center’s fourth year of operation, with subsequent increases annually due to inflation. These figures are conservative because they anticipate a slow market penetration as the Center builds its reputation and reaches full market share in year four.
8.1 Start-up Funding
Our start-up expenses of $19,700 and asset purchases of $197,000 are to be financed partially by the direct owner investment of $20,000 and financing in the amount of $225,000. The details are included in the following table and chart.
| Start-up Funding | |
| Start-up Expenses to Fund | $19,700 |
| Start-up Assets to Fund | $197,000 |
| Total Funding Required | $216,700 |
| Assets | |
| Non-cash Assets from Start-up | $117,000 |
| Cash Requirements from Start-up | $90,000 |
| Additional Cash Raised | $28,300 |
| Cash Balance on Starting Date | $118,300 |
| Total Assets | $235,300 |
| Liabilities and Capital | |
| Liabilities | |
| Current Borrowing | $225,000 |
| Long-term Liabilities | $0 |
| Other Current Liabilities (interest-free) | $0 |
| Total Liabilities | $225,000 |
| Capital | |
| Planned Investment | |
| Owner | $20,000 |
| Investor | $0 |
| Additional Investment Requirement | $0 |
| Total Planned Investment | $20,000 |
| Loss at Start-up (Start-up Expenses) | ($19,700) |
| Total Capital | $300 |
| Total Capital and Liabilities | $225,300 |
| Total Funding | $245,000 |
8.2 Important Assumptions
The financial plan assumes interest rates at eight percent raising to 10 percent by 2010. The key underlying assumptions are:
- A continuing slow-growth economy, without major recession.
- The Baby Boom Generation will continue the trend of demanding more personalized funerals.
- The competition will begin offering more personalized services as they see our success, but by then we will have positioned ourselves as the personalized services market leader.
8.3 Break-even Analysis
For our break-even analysis, we assume first-year fixed expenses of $13,606 per month, which includes our full payroll, mortgage payments, utilities and an estimation of other running costs. Payroll alone, during the first year, is only $5,000 per month.
Industry standard margins of 65 percent are assumed.
The initial break-even point is realized in March of 2006 with sales of only four funerals a month.

| Break-even Analysis | |
| Monthly Revenue Break-even | $20,932 |
| Assumptions: | |
| Average Percent Variable Cost | 35% |
| Estimated Monthly Fixed Cost | $13,606 |
8.4 Projected Profit and Loss
While profitability is realized in March 2006, the second fiscal year shows a slight profit margin because of the need to hire staff and train them ahead of the growth curve. When first hiring staff, it is anticipated that for the first few months, the time it takes to train each employee may exceed the amount of time it would take for the owner to just “do it himself.” However, having staff in place and ready to make good on the promises of service we make in all our marketing efforts is critical to our growth strategy.
Month-by-month assumptions for profit and loss are included in the appendix.


| Pro Forma Profit and Loss | |||||
| Year 1 | Year 2 | Year 3 | Year 4 | Year 5 | |
| Sales | $183,090 | $302,736 | $544,925 | $908,208 | $1,017,193 |
| Direct Cost of Sales | $64,082 | $106,514 | $190,724 | $317,873 | $356,018 |
| Other Costs of Sales | $0 | $0 | $0 | $0 | $0 |
| Total Cost of Sales | $64,082 | $106,514 | $190,724 | $317,873 | $356,018 |
| Gross Margin | $119,009 | $196,222 | $354,201 | $590,335 | $661,175 |
| Gross Margin % | 65.00% | 64.82% | 65.00% | 65.00% | 65.00% |
| Expenses | |||||
| Payroll | $60,000 | $75,000 | $162,172 | $181,144 | $186,574 |
| Marketing/Promotion | $24,000 | $24,000 | $24,000 | $24,000 | $24,000 |
| Depreciation | $12,672 | $12,672 | $12,672 | $12,672 | $12,672 |
| Mortgage Payments | $38,400 | $38,400 | $38,400 | $38,400 | $38,400 |
| Utilities | $3,600 | $3,600 | $3,600 | $3,600 | $3,600 |
| Insurance | $1,200 | $1,200 | $1,200 | $1,200 | $1,200 |
| Payroll Taxes | $9,000 | $11,250 | $24,326 | $27,172 | $27,986 |
| Auto Expenses | $12,000 | $12,000 | $12,000 | $12,000 | $12,000 |
| Supplies | $2,400 | $2,600 | $3,000 | $3,000 | $3,000 |
| Total Operating Expenses | $163,272 | $180,722 | $281,370 | $303,187 | $309,432 |
| Profit Before Interest and Taxes | ($44,264) | $15,500 | $72,831 | $287,148 | $351,743 |
| EBITDA | ($31,592) | $28,172 | $85,503 | $299,820 | $364,415 |
| Interest Expense | $16,180 | $12,960 | $10,800 | $7,020 | $3,600 |
| Taxes Incurred | $0 | $762 | $18,609 | $84,038 | $104,443 |
| Net Profit | ($60,443) | $1,778 | $43,422 | $196,090 | $243,700 |
| Net Profit/Sales | -33.01% | 0.59% | 7.97% | 21.59% | 23.96% |
8.5 Projected Cash Flow
A cash reserve is built into the plan to allow for unforeseen contingencies. Our minimum credit line available projected during this five-year period is over $45,000.
The company’s estimated cash flow analysis is outlined in the following table.

| Pro Forma Cash Flow | |||||
| Year 1 | Year 2 | Year 3 | Year 4 | Year 5 | |
| Cash Received | |||||
| Cash from Operations | |||||
| Cash Sales | $183,090 | $302,736 | $544,925 | $908,208 | $1,017,193 |
| Subtotal Cash from Operations | $183,090 | $302,736 | $544,925 | $908,208 | $1,017,193 |
| Additional Cash Received | |||||
| Sales Tax, VAT, HST/GST Received | $0 | $0 | $0 | $0 | $0 |
| New Current Borrowing | $0 | $0 | $0 | $0 | $0 |
| New Other Liabilities (interest-free) | $0 | $0 | $0 | $0 | $0 |
| New Long-term Liabilities | $0 | $0 | $0 | $0 | $0 |
| Sales of Other Current Assets | $0 | $0 | $0 | $0 | $0 |
| Sales of Long-term Assets | $0 | $0 | $0 | $0 | $0 |
| New Investment Received | $0 | $0 | $0 | $0 | $0 |
| Subtotal Cash Received | $183,090 | $302,736 | $544,925 | $908,208 | $1,017,193 |
| Expenditures | Year 1 | Year 2 | Year 3 | Year 4 | Year 5 |
| Expenditures from Operations | |||||
| Cash Spending | $230,862 | $288,286 | $488,831 | $699,446 | $760,821 |
| Subtotal Spent on Operations | $230,862 | $288,286 | $488,831 | $699,446 | $760,821 |
| Additional Cash Spent | |||||
| Sales Tax, VAT, HST/GST Paid Out | $0 | $0 | $0 | $0 | $0 |
| Principal Repayment of Current Borrowing | $42,000 | $42,000 | $42,000 | $42,000 | $42,000 |
| Other Liabilities Principal Repayment | $0 | $0 | $0 | $0 | $0 |
| Long-term Liabilities Principal Repayment | $0 | $0 | $0 | $0 | $0 |
| Purchase Other Current Assets | $0 | $0 | $0 | $0 | $0 |
| Purchase Long-term Assets | $0 | $0 | $0 | $0 | $0 |
| Dividends | $0 | $0 | $0 | $0 | $0 |
| Subtotal Cash Spent | $272,862 | $330,286 | $530,831 | $741,446 | $802,821 |
| Net Cash Flow | ($89,772) | ($27,550) | $14,094 | $166,762 | $214,372 |
| Cash Balance | $28,529 | $979 | $15,073 | $181,834 | $396,207 |
8.6 Projected Balance Sheet
The table below presents the balance sheet for the Evergreen Life Memorial Center. This table reflects dramatic growth in net worth, reaching nearly $425,000 in FY 2010. Our Projected Balance Sheet shows we will not have any difficulty meeting our debt obligations so long as our revenue projections are met.
| Pro Forma Balance Sheet | |||||
| Year 1 | Year 2 | Year 3 | Year 4 | Year 5 | |
| Assets | |||||
| Current Assets | |||||
| Cash | $28,529 | $979 | $15,073 | $181,834 | $396,207 |
| Other Current Assets | $27,000 | $27,000 | $27,000 | $27,000 | $27,000 |
| Total Current Assets | $55,529 | $27,979 | $42,073 | $208,834 | $423,207 |
| Long-term Assets | |||||
| Long-term Assets | $80,000 | $80,000 | $80,000 | $80,000 | $80,000 |
| Accumulated Depreciation | $12,672 | $25,344 | $38,016 | $50,688 | $63,360 |
| Total Long-term Assets | $67,328 | $54,656 | $41,984 | $29,312 | $16,640 |
| Total Assets | $122,857 | $82,635 | $84,057 | $238,146 | $439,847 |
| Liabilities and Capital | Year 1 | Year 2 | Year 3 | Year 4 | Year 5 |
| Current Liabilities | |||||
| Current Borrowing | $183,000 | $141,000 | $99,000 | $57,000 | $15,000 |
| Other Current Liabilities | $0 | $0 | $0 | $0 | $0 |
| Subtotal Current Liabilities | $183,000 | $141,000 | $99,000 | $57,000 | $15,000 |
| Long-term Liabilities | $0 | $0 | $0 | $0 | $0 |
| Total Liabilities | $183,000 | $141,000 | $99,000 | $57,000 | $15,000 |
| Paid-in Capital | $20,000 | $20,000 | $20,000 | $20,000 | $20,000 |
| Retained Earnings | ($19,700) | ($80,143) | ($78,365) | ($34,943) | $161,146 |
| Earnings | ($60,443) | $1,778 | $43,422 | $196,090 | $243,700 |
| Total Capital | ($60,143) | ($58,365) | ($14,943) | $181,146 | $424,847 |
| Total Liabilities and Capital | $122,857 | $82,635 | $84,057 | $238,146 | $439,847 |
| Net Worth | ($60,144) | ($58,365) | ($14,943) | $181,146 | $424,847 |
8.7 Business Ratios
This is a more profitably run business than average in its industry because of our value-added services, slightly higher prices and lean operation.
Sales expenses are constant throughout the five-year period. While they are a high percentage in the early years against lower sales, they are low after maturity because nonprofit activities will provide more than adequate publicity that will reduce advertising expenses.
The ratios for long-term liabilities do not reflect the loan for real estate purchase, which is not included as part of this plan.
The company’s projected business ratios are provided in the table below. The final column, Industry Profile, shows significant ratios for the funeral service industry for comparison.
| Ratio Analysis | ||||||
| Year 1 | Year 2 | Year 3 | Year 4 | Year 5 | Industry Profile | |
| Sales Growth | 0.00% | 65.35% | 80.00% | 66.67% | 12.00% | 6.63% |
| Percent of Total Assets | ||||||
| Other Current Assets | 21.98% | 32.67% | 32.12% | 11.34% | 6.14% | 40.70% |
| Total Current Assets | 45.20% | 33.86% | 50.05% | 87.69% | 96.22% | 60.97% |
| Long-term Assets | 54.80% | 66.14% | 49.95% | 12.31% | 3.78% | 39.03% |
| Total Assets | 100.00% | 100.00% | 100.00% | 100.00% | 100.00% | 100.00% |
| Current Liabilities | 148.95% | 170.63% | 117.78% | 23.93% | 3.41% | 22.29% |
| Long-term Liabilities | 0.00% | 0.00% | 0.00% | 0.00% | 0.00% | 21.95% |
| Total Liabilities | 148.95% | 170.63% | 117.78% | 23.93% | 3.41% | 44.24% |
| Net Worth | -48.95% | -70.63% | -17.78% | 76.07% | 96.59% | 55.76% |
| Percent of Sales | ||||||
| Sales | 100.00% | 100.00% | 100.00% | 100.00% | 100.00% | 100.00% |
| Gross Margin | 65.00% | 64.82% | 65.00% | 65.00% | 65.00% | 100.00% |
| Selling, General & Administrative Expenses | 98.01% | 64.23% | 57.03% | 43.41% | 41.04% | 74.74% |
| Advertising Expenses | 0.00% | 0.00% | 0.00% | 0.00% | 0.00% | 0.91% |
| Profit Before Interest and Taxes | -24.18% | 5.12% | 13.37% | 31.62% | 34.58% | 2.66% |
| Main Ratios | ||||||
| Current | 0.30 | 0.20 | 0.42 | 3.66 | 28.21 | 1.85 |
| Quick | 0.30 | 0.20 | 0.42 | 3.66 | 28.21 | 1.43 |
| Total Debt to Total Assets | 148.95% | 170.63% | 117.78% | 23.93% | 3.41% | 56.96% |
| Pre-tax Return on Net Worth | 100.50% | -4.35% | -415.11% | 154.64% | 81.95% | 3.83% |
| Pre-tax Return on Assets | -49.20% | 3.07% | 73.80% | 117.63% | 79.15% | 8.90% |
| Additional Ratios | Year 1 | Year 2 | Year 3 | Year 4 | Year 5 | |
| Net Profit Margin | -33.01% | 0.59% | 7.97% | 21.59% | 23.96% | n.a |
| Return on Equity | 0.00% | 0.00% | 0.00% | 108.25% | 57.36% | n.a |
| Activity Ratios | ||||||
| Accounts Payable Turnover | 8.98 | 12.17 | 12.17 | 12.17 | 12.17 | n.a |
| Total Asset Turnover | 1.49 | 3.66 | 6.48 | 3.81 | 2.31 | n.a |
| Debt Ratios | ||||||
| Debt to Net Worth | 0.00 | 0.00 | 0.00 | 0.31 | 0.04 | n.a |
| Current Liab. to Liab. | 1.00 | 1.00 | 1.00 | 1.00 | 1.00 | n.a |
| Liquidity Ratios | ||||||
| Net Working Capital | ($127,472) | ($113,021) | ($56,927) | $151,834 | $408,207 | n.a |
| Interest Coverage | -2.74 | 1.20 | 6.74 | 40.90 | 97.71 | n.a |
| Additional Ratios | ||||||
| Assets to Sales | 0.67 | 0.27 | 0.15 | 0.26 | 0.43 | n.a |
| Current Debt/Total Assets | 149% | 171% | 118% | 24% | 3% | n.a |
| Acid Test | 0.30 | 0.20 | 0.42 | 3.66 | 28.21 | n.a |
| Sales/Net Worth | 0.00 | 0.00 | 0.00 | 5.01 | 2.39 | n.a |
| Dividend Payout | 0.00 | 0.00 | 0.00 | 0.00 | 0.00 | n.a |
8.8 Long-term Plan
The long-term plan is for the Evergreen Life Memorial Center to achieve market share and hold it. This will be an expanding market over the next 35 years as the Baby Boom generation nearly doubles mortality rates from 11 percent per decade to over 18 percent by 2040. Keeping up with this growth, plus population increases in the Lane County area, will provide plenty of business for the Center for generations to come.
Appendix
| Sales Forecast | |||||||||||||
| Month 1 | Month 2 | Month 3 | Month 4 | Month 5 | Month 6 | Month 7 | Month 8 | Month 9 | Month 10 | Month 11 | Month 12 | ||
| Sales | |||||||||||||
| Funeral Products & Services | $5,884 | $5,884 | $5,884 | $5,884 | $11,768 | $11,768 | $11,768 | $17,652 | $17,682 | $23,536 | $23,535 | $29,420 | |
| Direct Cremations | $0 | $0 | $0 | $1,775 | $0 | $1,775 | $0 | $1,775 | $1,775 | $1,775 | $1,775 | $1,775 | |
| Total Sales | $5,884 | $5,884 | $5,884 | $7,659 | $11,768 | $13,543 | $11,768 | $19,427 | $19,457 | $25,311 | $25,310 | $31,195 | |
| Direct Cost of Sales | Month 1 | Month 2 | Month 3 | Month 4 | Month 5 | Month 6 | Month 7 | Month 8 | Month 9 | Month 10 | Month 11 | Month 12 | |
| Funeral Products & Services | $2,059 | $2,059 | $2,059 | $2,059 | $4,119 | $4,119 | $4,119 | $6,178 | $6,189 | $8,238 | $8,237 | $10,297 | |
| Direct Cremations | $0 | $0 | $0 | $621 | $0 | $621 | $0 | $621 | $621 | $621 | $621 | $621 | |
| Subtotal Direct Cost of Sales | $2,059 | $2,059 | $2,059 | $2,681 | $4,119 | $4,740 | $4,119 | $6,799 | $6,810 | $8,859 | $8,859 | $10,918 | |
| Personnel Plan | |||||||||||||
| Month 1 | Month 2 | Month 3 | Month 4 | Month 5 | Month 6 | Month 7 | Month 8 | Month 9 | Month 10 | Month 11 | Month 12 | ||
| Owner | 3% | $5,000 | $5,000 | $5,000 | $5,000 | $5,000 | $5,000 | $5,000 | $5,000 | $5,000 | $5,000 | $5,000 | $5,000 |
| Salesperson | 3% | $0 | $0 | $0 | $0 | $0 | $0 | $0 | $0 | $0 | $0 | $0 | $0 |
| Administrative Assistant | 3% | $0 | $0 | $0 | $0 | $0 | $0 | $0 | $0 | $0 | $0 | $0 | $0 |
| Staff Member | 3% | $0 | $0 | $0 | $0 | $0 | $0 | $0 | $0 | $0 | $0 | $0 | $0 |
| Total People | 1 | 1 | 1 | 1 | 1 | 1 | 1 | 1 | 1 | 1 | 1 | 1 | |
| Total Payroll | $5,000 | $5,000 | $5,000 | $5,000 | $5,000 | $5,000 | $5,000 | $5,000 | $5,000 | $5,000 | $5,000 | $5,000 | |
| Pro Forma Profit and Loss | |||||||||||||
| Month 1 | Month 2 | Month 3 | Month 4 | Month 5 | Month 6 | Month 7 | Month 8 | Month 9 | Month 10 | Month 11 | Month 12 | ||
| Sales | $5,884 | $5,884 | $5,884 | $7,659 | $11,768 | $13,543 | $11,768 | $19,427 | $19,457 | $25,311 | $25,310 | $31,195 | |
| Direct Cost of Sales | $2,059 | $2,059 | $2,059 | $2,681 | $4,119 | $4,740 | $4,119 | $6,799 | $6,810 | $8,859 | $8,859 | $10,918 | |
| Other Costs of Sales | $0 | $0 | $0 | $0 | $0 | $0 | $0 | $0 | $0 | $0 | $0 | $0 | |
| Total Cost of Sales | $2,059 | $2,059 | $2,059 | $2,681 | $4,119 | $4,740 | $4,119 | $6,799 | $6,810 | $8,859 | $8,859 | $10,918 | |
| Gross Margin | $3,825 | $3,825 | $3,825 | $4,978 | $7,649 | $8,803 | $7,649 | $12,628 | $12,647 | $16,452 | $16,452 | $20,277 | |
| Gross Margin % | 65.00% | 65.00% | 65.00% | 65.00% | 65.00% | 65.00% | 65.00% | 65.00% | 65.00% | 65.00% | 65.00% | 65.00% | |
| Expenses | |||||||||||||
| Payroll | $5,000 | $5,000 | $5,000 | $5,000 | $5,000 | $5,000 | $5,000 | $5,000 | $5,000 | $5,000 | $5,000 | $5,000 | |
| Marketing/Promotion | $2,000 | $2,000 | $2,000 | $2,000 | $2,000 | $2,000 | $2,000 | $2,000 | $2,000 | $2,000 | $2,000 | $2,000 | |
| Depreciation | $1,056 | $1,056 | $1,056 | $1,056 | $1,056 | $1,056 | $1,056 | $1,056 | $1,056 | $1,056 | $1,056 | $1,056 | |
| Mortgage Payments | $3,200 | $3,200 | $3,200 | $3,200 | $3,200 | $3,200 | $3,200 | $3,200 | $3,200 | $3,200 | $3,200 | $3,200 | |
| Utilities | $300 | $300 | $300 | $300 | $300 | $300 | $300 | $300 | $300 | $300 | $300 | $300 | |
| Insurance | $100 | $100 | $100 | $100 | $100 | $100 | $100 | $100 | $100 | $100 | $100 | $100 | |
| Payroll Taxes | 15% | $750 | $750 | $750 | $750 | $750 | $750 | $750 | $750 | $750 | $750 | $750 | $750 |
| Auto Expenses | 15% | $1,000 | $1,000 | $1,000 | $1,000 | $1,000 | $1,000 | $1,000 | $1,000 | $1,000 | $1,000 | $1,000 | $1,000 |
| Supplies | $200 | $200 | $200 | $200 | $200 | $200 | $200 | $200 | $200 | $200 | $200 | $200 | |
| Total Operating Expenses | $13,606 | $13,606 | $13,606 | $13,606 | $13,606 | $13,606 | $13,606 | $13,606 | $13,606 | $13,606 | $13,606 | $13,606 | |
| Profit Before Interest and Taxes | ($9,781) | ($9,781) | ($9,781) | ($8,628) | ($5,957) | ($4,803) | ($5,957) | ($978) | ($959) | $2,846 | $2,846 | $6,671 | |
| EBITDA | ($8,725) | ($8,725) | ($8,725) | ($7,572) | ($4,901) | ($3,747) | ($4,901) | $78 | $97 | $3,902 | $3,902 | $7,727 | |
| Interest Expense | $1,477 | $1,453 | $1,430 | $1,407 | $1,383 | $1,360 | $1,337 | $1,313 | $1,290 | $1,267 | $1,243 | $1,220 | |
| Taxes Incurred | $0 | $0 | $0 | $0 | $0 | $0 | $0 | $0 | $0 | $0 | $0 | $0 | |
| Net Profit | ($11,258) | ($11,235) | ($11,211) | ($10,034) | ($7,340) | ($6,163) | ($7,293) | ($2,292) | ($2,249) | $1,579 | $1,602 | $5,451 | |
| Net Profit/Sales | -191.33% | -190.94% | -190.54% | -131.01% | -62.37% | -45.51% | -61.98% | -11.80% | -11.56% | 6.24% | 6.33% | 17.47% | |
| Pro Forma Cash Flow | |||||||||||||
| Month 1 | Month 2 | Month 3 | Month 4 | Month 5 | Month 6 | Month 7 | Month 8 | Month 9 | Month 10 | Month 11 | Month 12 | ||
| Cash Received | |||||||||||||
| Cash from Operations | |||||||||||||
| Cash Sales | $5,884 | $5,884 | $5,884 | $7,659 | $11,768 | $13,543 | $11,768 | $19,427 | $19,457 | $25,311 | $25,310 | $31,195 | |
| Subtotal Cash from Operations | $5,884 | $5,884 | $5,884 | $7,659 | $11,768 | $13,543 | $11,768 | $19,427 | $19,457 | $25,311 | $25,310 | $31,195 | |
| Additional Cash Received | |||||||||||||
| Sales Tax, VAT, HST/GST Received | 0.00% | $0 | $0 | $0 | $0 | $0 | $0 | $0 | $0 | $0 | $0 | $0 | $0 |
| New Current Borrowing | $0 | $0 | $0 | $0 | $0 | $0 | $0 | $0 | $0 | $0 | $0 | $0 | |
| New Other Liabilities (interest-free) | $0 | $0 | $0 | $0 | $0 | $0 | $0 | $0 | $0 | $0 | $0 | $0 | |
| New Long-term Liabilities | $0 | $0 | $0 | $0 | $0 | $0 | $0 | $0 | $0 | $0 | $0 | $0 | |
| Sales of Other Current Assets | $0 | $0 | $0 | $0 | $0 | $0 | $0 | $0 | $0 | $0 | $0 | $0 | |
| Sales of Long-term Assets | $0 | $0 | $0 | $0 | $0 | $0 | $0 | $0 | $0 | $0 | $0 | $0 | |
| New Investment Received | $0 | $0 | $0 | $0 | $0 | $0 | $0 | $0 | $0 | $0 | $0 | $0 | |
| Subtotal Cash Received | $5,884 | $5,884 | $5,884 | $7,659 | $11,768 | $13,543 | $11,768 | $19,427 | $19,457 | $25,311 | $25,310 | $31,195 | |
| Expenditures | Month 1 | Month 2 | Month 3 | Month 4 | Month 5 | Month 6 | Month 7 | Month 8 | Month 9 | Month 10 | Month 11 | Month 12 | |
| Expenditures from Operations | |||||||||||||
| Cash Spending | $16,086 | $16,063 | $16,039 | $16,637 | $18,052 | $18,650 | $18,005 | $20,663 | $20,650 | $22,676 | $22,652 | $24,688 | |
| Subtotal Spent on Operations | $16,086 | $16,063 | $16,039 | $16,637 | $18,052 | $18,650 | $18,005 | $20,663 | $20,650 | $22,676 | $22,652 | $24,688 | |
| Additional Cash Spent | |||||||||||||
| Sales Tax, VAT, HST/GST Paid Out | $0 | $0 | $0 | $0 | $0 | $0 | $0 | $0 | $0 | $0 | $0 | $0 | |
| Principal Repayment of Current Borrowing | $3,500 | $3,500 | $3,500 | $3,500 | $3,500 | $3,500 | $3,500 | $3,500 | $3,500 | $3,500 | $3,500 | $3,500 | |
| Other Liabilities Principal Repayment | $0 | $0 | $0 | $0 | $0 | $0 | $0 | $0 | $0 | $0 | $0 | $0 | |
| Long-term Liabilities Principal Repayment | $0 | $0 | $0 | $0 | $0 | $0 | $0 | $0 | $0 | $0 | $0 | $0 | |
| Purchase Other Current Assets | $0 | $0 | $0 | $0 | $0 | $0 | $0 | $0 | $0 | $0 | $0 | $0 | |
| Purchase Long-term Assets | $0 | $0 | $0 | $0 | $0 | $0 | $0 | $0 | $0 | $0 | $0 | $0 | |
| Dividends | $0 | $0 | $0 | $0 | $0 | $0 | $0 | $0 | $0 | $0 | $0 | $0 | |
| Subtotal Cash Spent | $19,586 | $19,563 | $19,539 | $20,137 | $21,552 | $22,150 | $21,505 | $24,163 | $24,150 | $26,176 | $26,152 | $28,188 | |
| Net Cash Flow | ($13,702) | ($13,679) | ($13,655) | ($12,478) | ($9,784) | ($8,607) | ($9,737) | ($4,736) | ($4,693) | ($865) | ($842) | $3,007 | |
| Cash Balance | $104,598 | $90,919 | $77,264 | $64,785 | $55,001 | $46,394 | $36,657 | $31,921 | $27,228 | $26,364 | $25,522 | $28,529 | |
| Pro Forma Balance Sheet | |||||||||||||
| Month 1 | Month 2 | Month 3 | Month 4 | Month 5 | Month 6 | Month 7 | Month 8 | Month 9 | Month 10 | Month 11 | Month 12 | ||
| Assets | Starting Balances | ||||||||||||
| Current Assets | |||||||||||||
| Cash | $118,300 | $104,598 | $90,919 | $77,264 | $64,785 | $55,001 | $46,394 | $36,657 | $31,921 | $27,228 | $26,364 | $25,522 | $28,529 |
| Other Current Assets | $27,000 | $27,000 | $27,000 | $27,000 | $27,000 | $27,000 | $27,000 | $27,000 | $27,000 | $27,000 | $27,000 | $27,000 | $27,000 |
| Total Current Assets | $145,300 | $131,598 | $117,919 | $104,264 | $91,785 | $82,001 | $73,394 | $63,657 | $58,921 | $54,228 | $53,364 | $52,522 | $55,529 |
| Long-term Assets | |||||||||||||
| Long-term Assets | $80,000 | $80,000 | $80,000 | $80,000 | $80,000 | $80,000 | $80,000 | $80,000 | $80,000 | $80,000 | $80,000 | $80,000 | $80,000 |
| Accumulated Depreciation | $0 | $1,056 | $2,112 | $3,168 | $4,224 | $5,280 | $6,336 | $7,392 | $8,448 | $9,504 | $10,560 | $11,616 | $12,672 |
| Total Long-term Assets | $80,000 | $78,944 | $77,888 | $76,832 | $75,776 | $74,720 | $73,664 | $72,608 | $71,552 | $70,496 | $69,440 | $68,384 | $67,328 |
| Total Assets | $225,300 | $210,542 | $195,807 | $181,096 | $167,561 | $156,721 | $147,058 | $136,265 | $130,473 | $124,724 | $122,804 | $120,906 | $122,857 |
| Liabilities and Capital | Month 1 | Month 2 | Month 3 | Month 4 | Month 5 | Month 6 | Month 7 | Month 8 | Month 9 | Month 10 | Month 11 | Month 12 | |
| Current Liabilities | |||||||||||||
| Current Borrowing | $225,000 | $221,500 | $218,000 | $214,500 | $211,000 | $207,500 | $204,000 | $200,500 | $197,000 | $193,500 | $190,000 | $186,500 | $183,000 |
| Other Current Liabilities | $0 | $0 | $0 | $0 | $0 | $0 | $0 | $0 | $0 | $0 | $0 | $0 | $0 |
| Subtotal Current Liabilities | $225,000 | $221,500 | $218,000 | $214,500 | $211,000 | $207,500 | $204,000 | $200,500 | $197,000 | $193,500 | $190,000 | $186,500 | $183,000 |
| Long-term Liabilities | $0 | $0 | $0 | $0 | $0 | $0 | $0 | $0 | $0 | $0 | $0 | $0 | $0 |
| Total Liabilities | $225,000 | $221,500 | $218,000 | $214,500 | $211,000 | $207,500 | $204,000 | $200,500 | $197,000 | $193,500 | $190,000 | $186,500 | $183,000 |
| Paid-in Capital | $20,000 | $20,000 | $20,000 | $20,000 | $20,000 | $20,000 | $20,000 | $20,000 | $20,000 | $20,000 | $20,000 | $20,000 | $20,000 |
| Retained Earnings | ($19,700) | ($19,700) | ($19,700) | ($19,700) | ($19,700) | ($19,700) | ($19,700) | ($19,700) | ($19,700) | ($19,700) | ($19,700) | ($19,700) | ($19,700) |
| Earnings | $0 | ($11,258) | ($22,493) | ($33,704) | ($43,739) | ($51,079) | ($57,242) | ($64,535) | ($66,827) | ($69,076) | ($67,496) | ($65,894) | ($60,443) |
| Total Capital | $300 | ($10,958) | ($22,193) | ($33,404) | ($43,439) | ($50,779) | ($56,942) | ($64,235) | ($66,527) | ($68,776) | ($67,196) | ($65,594) | ($60,143) |
| Total Liabilities and Capital | $225,300 | $210,542 | $195,807 | $181,096 | $167,561 | $156,721 | $147,058 | $136,265 | $130,473 | $124,724 | $122,804 | $120,906 | $122,857 |
| Net Worth | $300 | ($10,958) | ($22,193) | ($33,404) | ($43,439) | ($50,779) | ($56,942) | ($64,235) | ($66,527) | ($68,776) | ($67,196) | ($65,594) | ($60,144) |

