
Bauman's Frozen Custard
Executive Summary
Bauman’s Frozen Custard and Italian Ice will be a scoop shop located on a busy street in downtown Eugene, Oregon. Bauman’s is a start-up shop and has long-term presence plans in the Eugene/Springfield market. Along with a $15,000 investment by Matthew Bauman, Bauman’s Frozen Custard hopes to initially make a successful effort to secure start up financing through a combination of investment and debt to establish the location.
Bauman’s is looking to bring Frozen Custard and Italian Ice to the Eugene market, where the product is currently unavailable. The company’s initial offerings will be a mixture of rich, creamy Frozen Custard and bright, sweet Italian Ice in a selection of sizes. Through selective marketing we intend to create a loyal customer base that will see Bauman’s Frozen Custard and Italian Ice as a high-class, yet affordable scoop shop with a prestigious product offering.
We predict our first year sales will reach approximately $66,000 and climb to over $90,000 by the end of the second year. Despite an initial loss in year one, we expect to become profitable by year two without endangering our cash reserves. According to our marketing research, these sales should be easily attainable by even a start up scoop shop. Our overall financial model is conservative and it emphasizes long-term opportunities in the local market over quick returns favored by hip new restaurants with short life spans in bigger cities.

1.1 Mission
To create the finest quality all natural frozen custard and Italian ice with a commitment to incorporating the freshest, richest, and creamiest ingredients into a world class product.
To meet the highest standards of excellence with superb service and product offerings in a friendly, sparkling, and soothing atmosphere.
To actively seek out and respond to the needs of our customers.
1.2 Objectives
The objectives of Bauman’s Frozen Custard and Italian Ice are to:
- Achieve more than $65,000 in sales during the first year of operations.
- Increase annual sales in the second year by 30% or more over the initial year.
- Make sure at least one out of every five people within 10 blocks of our store is aware of the unique flavor benefits Frozen Custard has over traditional ice cream within our first six (6) months of operations.
- Establish the business as the premier Frozen Custard store in Eugene.
1.3 Keys to Success
Bauman’s keys to success will include:
- Presenting a high level of quality in its product line.
- Maintaining and growing relationships with customers to generate new and repeat sales.
- Significant spending in grass roots marketing.
- Innovating new product offerings that will differentiate us from our competition.
Company Summary
Bauman’s Frozen Custard and Italian Ice will purchase frozen custard mix and Italian Ice base from a distributor in Pennsylvania. We will use a frozen custard freezer to quickly freeze the custard product into a premium, dense and creamy frozen dessert. We will feature vanilla and chocolate flavors each day plus one or two additional flavors of the day.
The Italian ice base mix will be made into approximately 30 various flavors using flavor concentrate from a distributor in Salem, Oregon. The Italian Ice will then be frozen in a specialty machine known as a batch freezer. It will then be stored in a display case at a high enough temperature to keep the product in a “liquid frozen” state.
The finished products will be sold from a retail outlet in downtown Eugene, Oregon. We have selected the Aurora building on the corner of East 11th Avenue and Oak Street. This is a new building and we will be leasing 1,055 square feet at a price of $1.00 per square foot/month. We have chosen this location because it meets our criteria (set forth below) and includes a generous offer of $15 per square foot that will be allocated to our business lease-hold improvement costs. This will significantly help us reduce costs associated with starting this business.
The Aurora building provides Bauman’s Frozen Custard and Italian Ice with a prime location in the downtown sector. We will be positioned between the University of Oregon campus and the West Eugene neighborhoods. Our location is 9 blocks from the campus Ben and Jerry’s, 8 blocks from the nearest Dairy Queen, and 3 blocks from the Pearl Street Ice Cream Parlour. The Aurora building offers Bauman’s Frozen Custard and Italian Ice the following requirements suggested by another owner of a frozen custard shop:
- Optimum size: 800-1,000 square feet.
- Traffic Count: 15,000 daily vehicle count is preferred.
- Demographics: Typically 25,000 people in a three (3) mile radius.
- Must be able to be approved for walk-up window service.
- Signage: Trademark back-lit awnings and dome signs required.
- Parking: Ideally the site will have clearly visible parking in excess of 20 spaces.
On a recent Friday evening between the hours of 8:30-9:30pm, we observed 462 cars, 18 cyclists, 6 buses, and 96 pedestrians on East 11th Avenue. This number is half of the estimated traffic flow past our location, as Oak Street has just as much traffic flow. The Aurora building, then, would have an estimated count exceeding 18,000 vehicles per day. This provides Bauman’s Frozen Custard and Italian Ice with a prime, highly visible location in downtown Eugene.
Our customers are primarily young people ages 18-25, and families who have pre-teen children. These individuals seek out flavorful sweet treats. Currently Bauman’s Frozen Custard and Italian Ice is in the beginning of its planning stages. The company will be organized as a closely-held LLC with a majority of the ownership retained by the founder and primary investor.
The company is seeking to raise approximately $70,000 in loans and another $10,000 from private investors, with $15,000 invested by Matthew Bauman, for start-up purposes.
2.1 Start-up Summary
To start up this business, we expect to incur short-term debt of $5,000 to cover initial inventory and other expenses for the first three months. We also anticipate the need for a long-term loan of $70,000 to cover equipment and fixtures costs. We also expect to incur $675 worth of legal expenses based on the cost of forming the LLC and other legal liability issues.
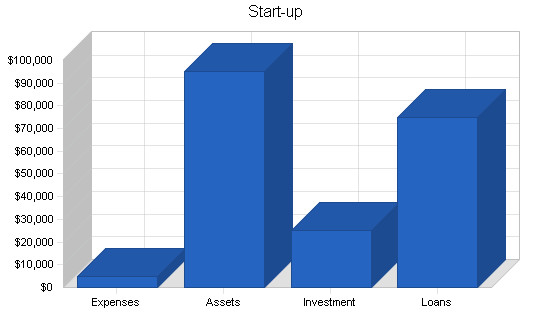
| Start-up Funding | |
| Start-up Expenses to Fund | $5,062 |
| Start-up Assets to Fund | $94,938 |
| Total Funding Required | $100,000 |
| Assets | |
| Non-cash Assets from Start-up | $70,120 |
| Cash Requirements from Start-up | $24,818 |
| Additional Cash Raised | $0 |
| Cash Balance on Starting Date | $24,818 |
| Total Assets | $94,938 |
| Liabilities and Capital | |
| Liabilities | |
| Current Borrowing | $5,000 |
| Long-term Liabilities | $70,000 |
| Accounts Payable (Outstanding Bills) | $0 |
| Other Current Liabilities (interest-free) | $0 |
| Total Liabilities | $75,000 |
| Capital | |
| Planned Investment | |
| Matthew Bauman | $15,000 |
| Investor 2 | $10,000 |
| Other | $0 |
| Additional Investment Requirement | $0 |
| Total Planned Investment | $25,000 |
| Loss at Start-up (Start-up Expenses) | ($5,062) |
| Total Capital | $19,938 |
| Total Capital and Liabilities | $94,938 |
| Total Funding | $100,000 |
| Start-up | |
| Requirements | |
| Start-up Expenses | |
| Legal | $675 |
| Stationery etc. | $250 |
| Brochures | $0 |
| Consultants | $550 |
| Insurance | $282 |
| Rent | $2,105 |
| Research and Development | $1,200 |
| Expensed Equipment | $0 |
| Other | $0 |
| Total Start-up Expenses | $5,062 |
| Start-up Assets | |
| Cash Required | $24,818 |
| Start-up Inventory | $320 |
| Other Current Assets | $0 |
| Long-term Assets | $69,800 |
| Total Assets | $94,938 |
| Total Requirements | $100,000 |
2.2 Company Ownership
The company will be owned by Matthew Bauman and one or two additional partners. Bauman will contribute $15,000 and the other investor(s) will contribute a combined additional $10,000. This will keep the majority of the equity in the company under Bauman’s control. A buy/sell agreement will be established with the other investors when the Limited Liability Corporation (LLC) is formed, to allow an exit strategy for one or all of the investors.

Products
Bauman’s will sell premium fresh-made Frozen Custard and Italian Ice. Frozen Custard is a natural, wholesome, frozen dairy product. It differs from ice cream in both taste and texture. Currently, the popular product known as Frozen Custard in the Midwest and on the East Coast is not available in Oregon. There are a handful of small businesses in Oregon that sell a product they call “frozen custard,” but this is not true Frozen Custard. Our product will be unique to the Pacific Northwest.
Customers can choose their flavor of frozen custard (vanilla, chocolate, and one or two additional daily flavors) and then choose to have it mixed with their choice of Italian ice flavors (over 30 flavors offered daily). Then they can enjoy their desserts in a warm, relaxing atmosphere similar to an upscale coffee house.
Frozen Custard has…
- Rich Flavor because it is made with an Egg Base
- Less Fat and Sugar than Most Premium Ice Creams
- Smoother and Creamier Texture (no ice crystals as in ice cream or ice milk.)
- Old-Fashioned Homemade Taste (made fresh every day.)
- Greater Density (less air whipped in, so it’s much more filling than soft serve.)
Italian Ice is…
- A Fruit-flavored ice mix with a smooth texture (very small ice crystals)
- A Sweet and Fat Free frozen product
- Made without Dairy or Egg products
- Made with Real Fruit Concentrate
- The Consistency of a Slushie
Both Frozen Custard and Italian Ice are lower in fat and sugar contents than other premium ice creams available on the market. Our product is creamier and smoother in texture than ice cream, and it is the only product available as hard serve from a soft-serve machine. This is because Frozen Custard is made using a unique machine called a batch freezer. This freezer pumps less air into the mix as it is rapidly being frozen. The final product is dense, smooth, and creamy.
Our product bases will be purchased from a company in Pennsylvania. We have contacted them about supplying us with products. They offer premade frozen custard base, to which Bauman’s Frozen Custard and Italian Ice will then add flavorings and freeze in our specialty equipment. The Italian ice base mix arrives as a flavorless mix. We will add flavor concentrate from a company in Salem, Oregon that specializes in manufacturing fruit flavor concentrates from fresh seasonal fruit. We will offer at least 30 unique Italian Ice flavors each day. They will be frozen in a batch freezer and then stored in a display case at a temperature between 15-26 degrees Fahrenheit. This allows the Italian Ice to remain in a “liquid frozen” state similar to a slushie.
Market Analysis Summary
The market we will engage in is the Eugene-Springfield metropolitan area. The specific market we will serve consists of a 25 square block radius around our scoop shop and includes the university student population and those primarily within walking distance of the shop in downtown Eugene. The overall age demographics of the population break down as follows:
- 13% over 65
- 25% between 45 and 64
- 28% between 25 and 44
- 12% between 18 and 24
- 23% of the population is under 18
The total population of the Eugene-Springfield metropolitan area is 316,000 people, of which 157,000 are female and 159,000 are male. Married-couple families make up close to 50% of the population, while people living alone make up an additional 33%.
Our local market has a mixed educational background – about half have a college degree or higher. While most people (72%) drive to work, the high concentration of downtown business and parking garages ensures steady foot traffic past our location. Median annual household income (including single people) is roughly $33,000, and 63% of the population lives in single unit structures (houses). These numbers tell us that we are situated in a relatively educated, affluent area of the state, in a destination area of town.
Within this population, we are focusing on two separate groups with different needs: 18-24 year olds, including students at the local university, and “first families” – young adults (25-35) with children under 13.
18-24 year olds have disposable incomes which they tend to spend on immediate gratification items, especially when those products have a prestige or individuality value. The population around the downtown area is highly populated by the 18-24 age demographic. We will also target “first families” (see above). They have limited entertainment dollars to spend each year, and our company can offer them some family bonding time for approximately $15, versus $30 to $40 for dinner or a movie. In both of these groups, we will aggressively target young women, who tend to brand loyalty in food choices, and often turn to indulgence foods in times of stress or celebration.
4.1 Market Segmentation
The potential customer groups for Bauman’s Frozen Custard and Italian Ice are:
18-24 Year Olds
Our market research indicates about 38,000 potential customers in the Eugene-Springfield area who are within this age range. The target customer is going to be a part of the “town and gown” niche: half college students and half local residents. They have a tendency to spend more than they can afford on prestige products.
First Families
These are the grown children of the baby boomer population having children of their own. Most of their children are not yet teens. By targeting this group, we can not only generate a large volume of immediate business, but also create long term customers in the children. We also have found that families are eating out at ice cream and frozen yogurt shops more, because such places are often cheaper than other restaurants, allowing a parent to feed the family for under $15. We are conservatively estimating the population size as half of the local household population with children under 18. Because the average family size is 2.92 people per household, we estimate that population of all potential people in the household population to be 55,852. We do expect some overlap between 18-24 year olds and the first families population.
Other
Our downtown location and increasing customer base will probably draw in customers outside of our targeted groups, including those attending the Saturday market, coming downtown to shop, or attending plays or musical events. We conservatively estimate this third market segment at about 3,160 people (1% of the total local population).

| Market Analysis | |||||||
| Year 1 | Year 2 | Year 3 | Year 4 | Year 5 | |||
| Potential Customers | Growth | CAGR | |||||
| 18-24 Year Olds | 3% | 38,040 | 39,181 | 40,356 | 41,567 | 42,814 | 3.00% |
| First Families | 4% | 55,852 | 58,086 | 60,410 | 62,826 | 65,339 | 4.00% |
| Other | 1% | 3,160 | 3,192 | 3,224 | 3,256 | 3,288 | 1.00% |
| Total | 3.52% | 97,052 | 100,459 | 103,989 | 107,649 | 111,441 | 3.52% |
4.2 Target Market Segment Strategy
The 18-24 year olds go out for ice cream more than any other age group. Within the 18-24 year old group, the “town and gown” niche is very important, because they heavily populate the area surrounding the store’s location. They are reachable through music, specifically R&B, and they prefer prestige products, which matches our choice of product offering.
The “first families” were chosen because they are a growing population, both numerically and in their choice to go out for ice cream more often. They are an easy group to market to because their lifestyle is very specific. They all have young children, so tactics that are geared towards markets that relate to children or to the children themselves may prove highly effective in generating trial and sales.
We plan to reach the first families through their children. Bauman’s Frozen Custard and Italian Ice will sponsor a little league ball team and offer the players a free Frozen Custard on days they win a game. This will draw them and their families into the store.
We will also invite local elementary schools to come and tour our facilities. We will teach the children how we make frozen custard and Italian ice. We will let each child make their own creation and hope they enjoy their time at our scoop shop so much, that they convince their parents to bring them back.
4.3 Industry Analysis
The frozen dessert industry experienced sales of more than $20.7 billion last year, with $13 billion of that on “away from home desserts.”
The frozen dessert market is expected to grow by seven percent each year through 2008. There are several existing competitors in the community, including: Pearl Street Ice Cream Parlour, Dairy Queen, Ben and Jerry’s Homemade, Cold Stone Creamery, and Prince Pückler’s. The competitors consist of both national franchises and locally owned stores. Each store has a unique product that allows it to differentiate itself from others within the marketplace. Bauman’s Frozen Custard and Italian Ice will also feature several unique products that will allow us to differentiate our product from those currently available in the market. The following is a breakdown of the ice cream industry on a national basis:
Consumption
- Total U.S. production of ice cream and related frozen desserts in 2001 amounted to more than 1.6 billion gallons, which translates to about 23 quarts per person. Source: USDA
- In 2001, total U.S. sales of ice cream and frozen desserts reached $20.7 billion. Of that total, $13 billion was spent on “away from home” frozen dessert purchases (scoop shops, food service and other retail sales outlets). Source: 2002 Latest Scoop
- Ice cream and related frozen desserts are consumed by more than 90% of households in the United States. Source: ACNielsen
- According to 2001 supermarket volume sales, regular ice cream accounts for the largest share of the frozen dessert market, with 80% of purchases. Reduced-fat, light, low fat and nonfat ice cream account for 11% of the market, followed by sherbet (4.5%), frozen yogurt (4%), and sorbet (0.5%). Source: Information Resources Inc. (IRI)
- Based on 2001 supermarket sales of ice cream, the top five individual flavors in the United States are: vanilla (28%), chocolate (8%), neapolitan (7%), butter pecan (4.5%), and chocolate chip (3.5%). Source: Information Resources Inc. (IRI)
Production
- The United States leads the world in annual production of ice cream and related frozen desserts, at more than 1.6 billion gallons in 2001. Source: USDA
Sales
- Based on supermarket statistics in 2001, ice cream volume sales by quality segment were: super premium (3.5%), premium (51.5%) and regular (45%). Source: IRI
Trends
- In recent years, the ice cream and frozen dessert industry has seen significant growth. Much of this growth has come in the premium and super-premium ice cream category. Bauman’s Frozen Custard and Italian Ice will serve products that fall into the premium ice cream category. Premium and super-premium products are typically found at scoop shops similar to Cold Stone Creamery, Ben and Jerry’s and Prince Pücklers.
- Many ice cream manufacturers have opened specialty scoop shops in recent years as a way to increase profits. These shops allow businesses to charge more for their product then selling wholesale to grocery stores.
- Manufacturers have developed lines of premium and super-premium products that have significantly higher profit margins than standard ice cream products.
- In recent years, there has been a significant move towards allowing customers to create their own product combinations. Customization allows customers to make the product more personal, and tailored to their specific desires.
4.3.1 Competition and Buying Patterns
In the frozen dessert industry, consumers make purchasing choices for a number of reasons. Perceived quality of product is essential for consumers going out to eat, because of the price premium they must pay. A gallon of generic (or even name-brand) ice cream in the grocery store will cost about as much as servings for one or two people at a scoop shop. Most of our competitors have emphasized the high quality of their products to justify their prices. Others, like Dairy Queen, tout convenience and low price, but they are able to do this because they offer many other products, as well.
Consumers going out for a frozen dessert want consistent quality, a particular ambience (which varies by market segment), and, recently, a statement about their individuality through their food choices. Ben and Jerry’s has responded to these needs with appeals to socially and environmentally conscious production; Cold Stone Creamery offers unparalleled “just for you” customization and service; Baskin Robbins’ famous “31 flavors” comes from the vast array of choice consumers demand.
Among the Eugene/Springfield population, many consumers have consistently shown a committment to local brands and locally-made products over national brands and chains. In the local frozen dessert market, Prince Pückler’s has benefited from this preference by making its ice cream in the store from high-quality local ingredients. We will play up the “made-daily-in-our-shop” aspects of both of our products, as well as the fact that we are locally owned and operated by people invested in the community.
We anticipate that our target markets will also be concerned with quality and individuality, but in different ways. The 18-24 year olds are looking for good tasting, prestige products. The price premium, in this case, is an advantage. More particularly, as a former student, I have observed that university students are constantly seeking “new” quaint, high-quality local businesses which offer unique products their peers have not already adopted en masse. Our frozen custards and Italian ices are just different enough from standard premium ice creams that they will be familiar, yet “new.” These consumers want a place where they can socialize comfortably with each other, and can be seen by their peers in a trendy place. They want to maximize product customization to emphasize their sense of individuality, within comfortable parameters; new combinations of familiar flavors work well with this group.
The young families in our targeted market are cost-conscious, and often health conscious. Eugene has an unusually high number of bikers, joggers, runners, and outdoor sports enthusiasts. The lower fat and sugar content of our products will appeal to young parents seeking a “treat” for themselves and their children that doesn’t come with a hefty price tag or unhealthy empty calories. These consumers want a family-friendly place where spills and drips are not a catastrophe, but with a comfortable atmosphere a bit more upscale than most fast food stores. They want comfortable, familiar flavors for their children, who crave predictability, and more adventurous flavor and ingredient options for themselves.
4.3.2 Competitors
Bauman’s Frozen Custard and Italian Ice faces approximately 15 competitors in the Eugene area. The top competition comes from several national chain stores that have years of experience and significant brand recognition as well as several locally based competitors. In spite of all the competition, each of these scoop shops remains profitable and open year-round.
National Competitors in the Local Market
- Ben and Jerry’s
- Cold Stone Creamery
- Dairy Queen
- Baskin-Robbins
- “TCBY” Yogurt
- All American Ice Cream
Many of these national chains have strong brand recognition and their products are known for consistent quality. Several of these competitors have been in the Eugene area for over 20 years. In recent years, there has been a trend for the national ice cream manufacturers to open more scoop shops as a way to increase profitability. Each of these competitors has a unique product that differentiates them from their competition.
Cold Stone Creamery had only 5 stores in 1995 when they began offering franchises. Today they have over 800 outlets with an additional 500 in the works. Cold Stone has one retail store in Eugene, Oregon. Cold Stone Creamery offers customers the opportunity to create their own dessert. Customers select their favorite flavor of ice cream and then choose which toppings they would like mixed in. The entire process happens right before the customer on a giant slab of frozen marble. The trend of customizing creations has been a very successful strategy for Cold Stone Creamery. This allows them to charge a premium for this customization: their prices range from $3.00-$4.50.
Dairy Queen is set apart from other competition because they do not focus their business solely on ice cream related products. They offer a full line of burgers, fries, and other fast food menu items. The full menu line allows customers the eat dinner and have dessert while at the same location. This also helps offset the seasonality of ice cream products, during the winter months.
Ben and Jerry’s Homemade has seen average annual growth of 13.3% in recent years. Begun in 1978 with a $12,000 investment, their 1998 sales exceeded $209 million. Ben and Jerry’s has two retail stores in Eugene, and they sell their pints via grocery outlets nationwide.
Baskin-Robbins is a retail franchise chain that has over 2,500 domestic retail outlets as well as 2,400 stores internationally. There are 4 locations in the Eugene/Springfield area.
Local Competitors
- Prince Pückler’s
- Pearl Street Ice Cream Parlour
Both of these local shops have a strong following of local supporters. The Pearl Street Ice Cream Parlour has been in Eugene since 1968. It offers customers an old-fashioned ice cream parlour feel. They also have a broad menu of food items.
Prince Pückler’s is a locally owned ice cream manufacturer that sells products at several locations around Eugene/Springfield. Prince Pückler’s and the Pearl Street Parlour offer their customers a nostalgic feel due to their long history in Eugene. Prince Pückler’s prides itself on homemade ice cream and is very popular among Eugene residents, who have a commitment to supporting local businesses.
Strategy and Implementation Summary
Bauman’s Frozen Custard and Italian Ice will succeed in the Eugene market by selling a unique, fresh, high quality product that exceeds the customer expectations. We will focus on the local market, targeting two specific market segments, in an attempt to achieve the best reputation in our segment. We will strive to increase brand awareness among our target market during our first year of operation as a way to become part of their evoked set. When a member of our target market decides they want a frozen treat, we want to be the first name they think of.
Our most important competitive edge is our unique product offering, not found elsewhere in our market. Our goal is to maintain product consistency so that every time a customer comes into our store, they receive the same high quality, great tasting frozen treat.
However, consumers will only know how great our products are when they come in and sample them!
Once a customer has walked in the door of a scoop shop, he or she has probably already decided to purchase a dessert. However, the ambience, clarity of signage, quality of service, and product quality determine whether that choice will be repeated. Our marketing strategy is focused on the first task – getting our customers in the door, any way we can. Our sales strategy is focused on making their experience so enjoyable that they return again and again, bringing friends and relatives with them.
5.1 Competitive Edge
Bauman’s Frozen Custard’s has two competitive edges:
- Rich and creamy, high class, low fat, frozen desserts.
- Our friendly, neighborly approach to customers.
Both of these selling points will help us to achieve our overall goals of a steady customer base with repeat sales. Our focus on personalized attention to our customers, and involvement in local events and clubs, will set us apart from our competition.
5.2 Milestones
The following table lists important project milestones to be undertaken before the business opens, during the start-up period, and immediately after opening the doors. The table lists the dates and managers in charge, and budgets for each milestone. The milestone schedule indicates our emphasis on planning for implementation.
We have several key steps that need to be resolved before we can move ahead with the planning of this business. We need to run several trial taste tests to finalize our product recipes and determine what flavors are most popular. We also need to raise awareness among potential investors by presenting our business plan and updating them on the progress we have made towards opening. During this time, we will be working with a local design firm to develop a company logo, our signage, and product packaging (cups, napkins, etc..).
We will then hire a close friend who has a degree in marketing/graphic arts to develop several newspaper advertisements designed to appeal to our target market. We will use the advertisements to generate brand awareness over our first three months of operations. Eighteen days after opening the scoop shop, we will begin our “Grand Opening” ad campaign. This is designed to inform our target market that our doors are open. This campaign will run for approximately 2 months.

| Milestones | |||||
| Milestone | Start Date | End Date | Budget | Manager | Department |
| Frozen Custard Taste Tests | 8/1/2004 | 9/25/2004 | $150 | MB | ProDev |
| Italian Ice Taste Tests | 8/1/2004 | 10/25/2004 | $150 | MB | ProDev |
| Business Logo/Sign Development | 1/1/2005 | 1/30/2005 | $400 | MB | Marketing |
| Investment Campaign | 8/15/2004 | 2/10/2005 | $200 | MB | Admin |
| Product Packaging | 12/10/2004 | 3/10/2005 | $200 | MB | Marketing |
| Design Advertisements | 1/20/2005 | 3/30/2005 | $250 | MB | Marketing |
| Open Doors | 4/1/2005 | 4/1/2005 | $0 | MB | Marketing |
| Grand Opening Ad Campaign | 4/18/2005 | 6/18/2005 | $2,000 | MB | Marketing |
| Brand Awareness Campaign | 4/10/2005 | 7/20/2005 | $1,100 | MB | Marketing |
| Targeted Ad Campaigns | 5/15/2005 | 10/31/2005 | $4,000 | MB | Marketing |
| Totals | $8,450 | ||||
5.3 Marketing Strategy
Bauman’s Frozen Custard will use multiple methods to approach its target markets. Since our most difficult task will be attracting customers for that first tasting, we have a two-tiered approach. First, a mass mailing campaign will create customer awareness and generate trial. This will include coupons and our “Grand Opening” offer: with a coupon, your first dessert at Bauman’s in April or May is free. The initial cost of this offer will be more than offset by repeat sales later. After this initial campaign, our marketing strategy will focus on our two target markets separately.
For 18-24 year olds, Bauman’s will distribute flyers on campus and at the bus station. We will also seek permission to place fliers on the doors of apartment rentals and apartment complexes. To further reach the “Town and Gown” niche of this market, we will purchase radio ads on specific radio stations that feature R&B music.
To reach the “first families” more effectively, we plan to sponsor events and help out with local elementary schools and after school activities. Such plans include: sponsoring a little league team; offering a tour of the shop to elementary school students; and giving coupons and promotional information to the children to bring their families in.
All of these marketing campaigns will be supplemented by ongoing “brand awareness” campaigns, with advertisements in the local paper, interviews with the college newspaper (as the owner is a graduate), and fliers posted at popular local events. We will highlight our community service involvements as part of our “good neighbor” approach to doing business in this area.
5.4 Sales Strategy
Our sales strategy focuses first on providing the highest quality products and services to our target customers. Once a customer enters our store, it is our job to make sure their experience with us is enjoyable. Product offerings and prices will be clearly posted behind the counter, and scoopers will be educated about the ingredients and processes involved in each one, so they can answer any and all customer questions. Customers can taste any product before choosing. “Flavors of the day” will rotate throughout the entire set of flavor options, and we will keep a running tally of flavor choices, correlated with weather patterns for the day, to determine customer favorites. (While many customers may prefer mango to banana, we will certainly sell more on sunny days than rainy ones.)
In addition, our seating area will be comfortable, clean, and attractive, with booster seats available. Our restroom will include a changing table, which young families will appreciate. Customers can help themselves to free water from a container on the side of the counter.
We will initially offer three sizes: 5oz., 7oz., 9oz. sized cups. Prices will be based on size, with a 5oz serving priced at $2.00, the 7oz. $2.50, and the 9oz. at $3.00. There will be additional topping options at $0.35 each, thus increasing the sale price.
5.4.1 Sales Forecast
Our sales will largely be determined by foot traffic in the area, the season of the year, and current weather conditions. We estimate first year sales of approximately $66,840, $97,760 in the second year, and $113,402 in the third year following this plan.
These sales forecasts are based on several real world observations. On a rainy Friday afternoon in May, we observed 25 people an hour, make a purchase from one of our future competitors located in a mall. During a weekend evening in May, we observed 40 people an hour, make a purchase at an ice cream shop in Eugene, OR. We chose to use the first observation (25) and cut it in half for the approximate number of hourly customers we would have after being in business for several months. We also assumed that there would be a 60% increase in summer month sales over winter month sales. This information was given to us by the manager of a local ice cream store chain.
Bauman’s Frozen Custard and Italian Ice plans to have a soft start, inviting only family and friends over for the first few weeks. This will help the owners get experience in managing a scoop shop and help them be better prepared for the summer rush. Because we have little brand recognition, initial sales beyond that are predicted to be low, averaging less than half of the observed hourly rate over the year and less than a third of the observed rate during the start up months. We expect our sales to follow a seasonal trend, peaking out in July (the first year we assumed to still be building a customer base) and reaching a low in December and January.
For the second year, we expect to see a total 46% increase in sales due to a normal annual sales volume, and the dramatic difference between the monthly average of the startup months and their counterparts in the second year. In the third year, we expect a more conservative 16% increase in sales revenues.
Our sales forecast assumes a 10% increase in costs over the next year due to the increase in dairy product and sugar prices, which is a reasonable assumption given the current market data.

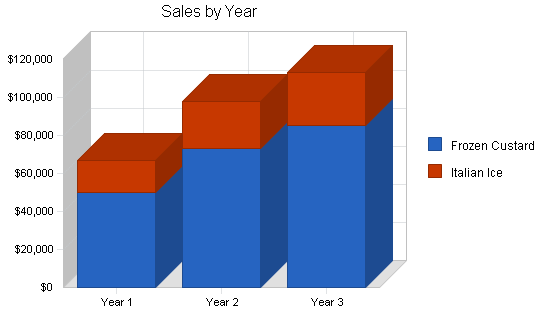
| Sales Forecast | |||
| Year 1 | Year 2 | Year 3 | |
| Sales | |||
| Frozen Custard | $50,130 | $73,320 | $85,051 |
| Italian Ice | $16,710 | $24,440 | $28,350 |
| Total Sales | $66,840 | $97,760 | $113,402 |
| Direct Cost of Sales | Year 1 | Year 2 | Year 3 |
| Frozen Custard | $13,034 | $19,063 | $21,263 |
| Italian Ice | $4,345 | $6,354 | $7,088 |
| Subtotal Direct Cost of Sales | $17,378 | $25,418 | $28,350 |
Management Summary
Matthew Bauman has a strong entrepreneurial spirit and he is prepared to invest a great deal of time and effort over the coming years to make Bauman’s Frozen Custard and Italian Ice a successful business venture. The owner has an outside income source and does not expect to see returns on his initial investment until year four. Mr. Bauman shall act as the store manager, with the other owners acting as assistant managers. They shall be responsible for hiring and supervising part time help that will be hired as needed, throughout the year. Additional assistance is acquired on a part-time basis and/or through the use of consultants, specifically in legal matters. The owner, Matthew Bauman, has close family connections with many consultants who can advise the business.
Matthew Bauman will graduate from the University of Oregon in July, 2004 with a Bachelors of Science in Business Administration. He will have a concentration in Entrepreneurial Business. He also studied architecture, prior to becoming a business major. In June of 2000, Matthew Bauman graduated from Chemeketa Community College with an Associates of Arts Oregon Transfer degree.
Mr. Bauman has previously worked at a start-up pizzeria in his home town. He accepted the job to learn more about starting up an independent, small business and learn the ropes. This year, he started his own race management company. As a long time runner, Mr. Bauman saw a need for a quality, efficient race management company to host local road races. His company will host their first race in September 2004. He has also volunteered as an assistant Cross Country coach at Kennedy High School in Mount Angel, OR.
Matthew Bauman’s interest in Frozen Custard was sparked when he first tasted it back in 1997 in St. Louis, Missouri. Since that date, he has been extensively researching the product, talking with other scoop shop owners, and testing recipes. Mr. Bauman has several mentors in the ice cream/frozen dessert industry across the country, and often calls upon them for advice.
6.1 Personnel Plan
We expect seasonal hiring of part time employees. Because we will offer no benefits to our employees, full time employees will not be hired (nor are they necessary through the first year.)
We foresee hiring two or three part-time employees besides the two or three owners to begin working in May. Our two or three employees will share hours during the week because we expect to have a paid employee work an average of 5 hours per day for 7 days per week. We will pay wages of $7.10 per hour which is slightly above minimum wage. Matthew Bauman will contribute his time as store manager, with other owner(s) substituting him when needed.
In May, we expect to be open 68 hours per week. This is our summer hourly schedule. In winter months, we expect to have a paid employee work only 15 hours per week. During the winter months (December, January, and February) we expect to be open 52 hours per week.
| Personnel Plan | |||
| Year 1 | Year 2 | Year 3 | |
| Part-time employees | $8,094 | $11,837 | $12,784 |
| Owner – Matthew Bauman | $0 | $0 | $0 |
| Other Owner(s) | $12,000 | $12,000 | $18,000 |
| Total People | 3 | 4 | 4 |
| Total Payroll | $20,094 | $23,837 | $30,784 |
Financial Plan
Bauman’s Frozen Custard expects to raise $70,000 in long-term debt with $25,000 from the owners. A short term loan of $5,000 will be used to maintain a level of cash necessary to maintain expected inventory levels and to buy additional inventory should sales be higher than expected. The long-term debt will be paid back over the next ten years. No other immediate financing needs are expected.
With sales increasing from $66,000 the first year to over $113,000 by year three, Bauman’s Custard will begin to turn a net profit early in year two, and increase net worth in years two and three after initial decreases.
7.1 Important Assumptions
One important assumption is the initial sales projections. We made this estimate by taking an assumed hourly average observed at a local ice cream shop. We then drastically cut the number to reflect seasonality, our unknown brand name, and reduced foot traffic. These estimates are extremely conservative, and we expect actual sales to surpass them almost immediately.
We assumed the borrowing rate at 4.08% for the short term and 5.20% for the long term and an increase of 1.00% per year for the next two years in the interest rate due to a recovering economy. We also assumed initial investment in equipment and fixtures at $69,800.
| General Assumptions | |||
| Year 1 | Year 2 | Year 3 | |
| Plan Month | 1 | 2 | 3 |
| Current Interest Rate | 4.08% | 5.08% | 6.08% |
| Long-term Interest Rate | 5.20% | 6.20% | 7.20% |
| Tax Rate | 0.00% | 30.00% | 30.00% |
| Other | 0 | 0 | 0 |
7.2 Break-even Analysis
The break-even analysis shows that Bauman’s Frozen Custard has sufficient sales strength to remain viable. Our break-even point is $7,058 per month. We estimate our average sales price at $2.50, which is an approximate sale price for a medium-size dessert at our retail outlet. This translates in the break-even unit sales of 2,823 per month. Our sales forecast for the first year calls for an average of 2,228 units per month. This was calculated by total yearly sales ($66,840), divided by 12 months, divided by average sale price per customer ($2.50). However, in the second year we expect to sell, on average, 435 more units a month than our break even point. This will allow Bauman’s Frozen Custard and Italian Ice to increase the net worth of the business after our initial year of operations.

| Break-even Analysis | |
| Monthly Revenue Break-even | $6,719 |
| Assumptions: | |
| Average Percent Variable Cost | 26% |
| Estimated Monthly Fixed Cost | $4,972 |
7.3 Projected Profit and Loss
Over the first year we expect to incur a loss of $16,753. This will largely be due to the losses during the start up months and recurring payroll and other expenses. Over the next year we expect to see a more stable and sustainable profit level of $3,337, and in the third year we expect our profits to grow to $6,396. This is based on our estimation that sales will grow by 46% over the second year. This occurs because of the increase in brand awareness of the company, our continuous advertising campaign, and 8% annual industry growth over all.


| Pro Forma Profit and Loss | |||
| Year 1 | Year 2 | Year 3 | |
| Sales | $66,840 | $97,760 | $113,402 |
| Direct Cost of Sales | $17,378 | $25,418 | $28,350 |
| Other Costs of Goods | $0 | $0 | $0 |
| Total Cost of Sales | $17,378 | $25,418 | $28,350 |
| Gross Margin | $49,462 | $72,342 | $85,051 |
| Gross Margin % | 74.00% | 74.00% | 75.00% |
| Expenses | |||
| Payroll | $20,094 | $23,837 | $30,784 |
| Sales and Marketing and Other Expenses | $8,150 | $4,800 | $4,800 |
| Depreciation | $4,668 | $4,668 | $4,668 |
| Rent | $12,660 | $12,913 | $13,171 |
| Utilities | $12,400 | $12,400 | $12,400 |
| Insurance | $1,692 | $1,692 | $1,692 |
| Payroll Taxes | $0 | $0 | $0 |
| Other | $0 | $0 | $0 |
| Total Operating Expenses | $59,664 | $60,311 | $67,516 |
| Profit Before Interest and Taxes | ($10,202) | $12,032 | $17,535 |
| EBITDA | ($5,534) | $16,700 | $22,203 |
| Interest Expense | $3,536 | $3,689 | $3,780 |
| Taxes Incurred | $0 | $2,503 | $4,127 |
| Net Profit | ($13,739) | $5,840 | $9,629 |
| Net Profit/Sales | -20.55% | 5.97% | 8.49% |
7.4 Projected Cash Flow
Bauman’s Frozen Custard and Italian Ice expects to manage cash flow over the first year with the assistance of retained earnings and cash reserves from our short-term loan of $5,000.This financing is required to assist in covering unforseen expenses and help us through seasonal fluctuations in customers. We expect to finance our long-term assets with a $70,000 long-term loan, on which we expect to make monthly payments over the next ten years. During 2005-06, we will incur a loss in cash flow as long as our expenses exceed our revenues.
We estimate that our business will be cash flow positive in our second and third year. We expect second year cash flow to be approximately $646, and $4,162 our third year.

| Pro Forma Cash Flow | |||
| Year 1 | Year 2 | Year 3 | |
| Cash Received | |||
| Cash from Operations | |||
| Cash Sales | $66,840 | $97,760 | $113,402 |
| Subtotal Cash from Operations | $66,840 | $97,760 | $113,402 |
| Additional Cash Received | |||
| Sales Tax, VAT, HST/GST Received | $0 | $0 | $0 |
| New Current Borrowing | $0 | $0 | $0 |
| New Other Liabilities (interest-free) | $0 | $0 | $0 |
| New Long-term Liabilities | $0 | $0 | $0 |
| Sales of Other Current Assets | $0 | $0 | $0 |
| Sales of Long-term Assets | $0 | $0 | $0 |
| New Investment Received | $0 | $0 | $0 |
| Subtotal Cash Received | $66,840 | $97,760 | $113,402 |
| Expenditures | Year 1 | Year 2 | Year 3 |
| Expenditures from Operations | |||
| Cash Spending | $20,094 | $23,837 | $30,784 |
| Bill Payments | $52,681 | $63,756 | $68,288 |
| Subtotal Spent on Operations | $72,775 | $87,593 | $99,072 |
| Additional Cash Spent | |||
| Sales Tax, VAT, HST/GST Paid Out | $0 | $0 | $0 |
| Principal Repayment of Current Borrowing | $5,000 | $0 | $0 |
| Other Liabilities Principal Repayment | $0 | $0 | $0 |
| Long-term Liabilities Principal Repayment | $7,000 | $7,000 | $7,000 |
| Purchase Other Current Assets | $0 | $0 | $0 |
| Purchase Long-term Assets | $0 | $0 | $0 |
| Dividends | $0 | $0 | $0 |
| Subtotal Cash Spent | $84,775 | $94,593 | $106,072 |
| Net Cash Flow | ($17,935) | $3,167 | $7,329 |
| Cash Balance | $6,883 | $10,050 | $17,379 |
7.5 Projected Balance Sheet
As stated earlier, the owners emphasize long-term growth in the business value over short-term returns. Our projected balance sheet shows a decrease in net worth over the first year to $3,185 from $19,938 at startup. However, starting from the second year, our net worth steadily increases to $6,522 and by the end of the third year we expect the value of the firm to increase to $12,919. With the present financial projections we will be careful in keeping costs to a minimum without making sacrifices to product quality. It will not be necessary for Bauman’s Frozen Custard and Italian Ice to purchase more assets, because our machinery has at least a twenty (20) year life span and will have production capacity that exceeds our needs.
| Pro Forma Balance Sheet | |||
| Year 1 | Year 2 | Year 3 | |
| Assets | |||
| Current Assets | |||
| Cash | $6,883 | $10,050 | $17,379 |
| Inventory | $1,922 | $2,811 | $3,135 |
| Other Current Assets | $0 | $0 | $0 |
| Total Current Assets | $8,805 | $12,861 | $20,514 |
| Long-term Assets | |||
| Long-term Assets | $69,800 | $69,800 | $69,800 |
| Accumulated Depreciation | $4,668 | $9,336 | $14,004 |
| Total Long-term Assets | $65,132 | $60,464 | $55,796 |
| Total Assets | $73,937 | $73,325 | $76,310 |
| Liabilities and Capital | Year 1 | Year 2 | Year 3 |
| Current Liabilities | |||
| Accounts Payable | $4,738 | $5,285 | $5,642 |
| Current Borrowing | $0 | $0 | $0 |
| Other Current Liabilities | $0 | $0 | $0 |
| Subtotal Current Liabilities | $4,738 | $5,285 | $5,642 |
| Long-term Liabilities | $63,000 | $56,000 | $49,000 |
| Total Liabilities | $67,738 | $61,285 | $54,642 |
| Paid-in Capital | $25,000 | $25,000 | $25,000 |
| Retained Earnings | ($5,062) | ($18,801) | ($12,961) |
| Earnings | ($13,739) | $5,840 | $9,629 |
| Total Capital | $6,200 | $12,039 | $21,668 |
| Total Liabilities and Capital | $73,937 | $73,325 | $76,310 |
| Net Worth | $6,200 | $12,039 | $21,668 |
7.6 Business Ratios
Our gross margin is significantly above the industry average (Frozen Custard Industry SIC 2024.0201). We believe this is because a large part of this industry involves manufacturers who produce large quantities using economies of scale. As a scoop shop, Bauman’s Frozen Custard and Italian Ice can command a higher price per gallon than wholesale manufacturers, but more costs are incurred in terms of man hours and marketing expenses.
| Ratio Analysis | ||||
| Year 1 | Year 2 | Year 3 | Industry Profile | |
| Sales Growth | 0.00% | 46.26% | 16.00% | 1.21% |
| Percent of Total Assets | ||||
| Inventory | 2.60% | 3.83% | 4.11% | 14.83% |
| Other Current Assets | 0.00% | 0.00% | 0.00% | 19.26% |
| Total Current Assets | 11.91% | 17.54% | 26.88% | 52.51% |
| Long-term Assets | 88.09% | 82.46% | 73.12% | 47.49% |
| Total Assets | 100.00% | 100.00% | 100.00% | 100.00% |
| Current Liabilities | 6.41% | 7.21% | 7.39% | 25.80% |
| Long-term Liabilities | 85.21% | 76.37% | 64.21% | 25.21% |
| Total Liabilities | 91.62% | 83.58% | 71.61% | 51.01% |
| Net Worth | 8.38% | 16.42% | 28.39% | 48.99% |
| Percent of Sales | ||||
| Sales | 100.00% | 100.00% | 100.00% | 100.00% |
| Gross Margin | 74.00% | 74.00% | 75.00% | 21.95% |
| Selling, General & Administrative Expenses | 77.60% | 60.27% | 58.61% | 13.02% |
| Advertising Expenses | 0.00% | 0.00% | 0.00% | 1.44% |
| Profit Before Interest and Taxes | -15.26% | 12.31% | 15.46% | 2.11% |
| Main Ratios | ||||
| Current | 1.86 | 2.43 | 3.64 | 1.74 |
| Quick | 1.45 | 1.90 | 3.08 | 1.05 |
| Total Debt to Total Assets | 91.62% | 83.58% | 71.61% | 53.74% |
| Pre-tax Return on Net Worth | -221.61% | 69.29% | 63.48% | 8.09% |
| Pre-tax Return on Assets | -18.58% | 11.38% | 18.03% | 17.49% |
| Additional Ratios | Year 1 | Year 2 | Year 3 | |
| Net Profit Margin | -20.55% | 5.97% | 8.49% | n.a |
| Return on Equity | -221.61% | 48.51% | 44.44% | n.a |
| Activity Ratios | ||||
| Inventory Turnover | 10.23 | 10.74 | 9.54 | n.a |
| Accounts Payable Turnover | 12.12 | 12.17 | 12.17 | n.a |
| Payment Days | 27 | 28 | 29 | n.a |
| Total Asset Turnover | 0.90 | 1.33 | 1.49 | n.a |
| Debt Ratios | ||||
| Debt to Net Worth | 10.93 | 5.09 | 2.52 | n.a |
| Current Liab. to Liab. | 0.07 | 0.09 | 0.10 | n.a |
| Liquidity Ratios | ||||
| Net Working Capital | $4,068 | $7,576 | $14,872 | n.a |
| Interest Coverage | -2.89 | 3.26 | 4.64 | n.a |
| Additional Ratios | ||||
| Assets to Sales | 1.11 | 0.75 | 0.67 | n.a |
| Current Debt/Total Assets | 6% | 7% | 7% | n.a |
| Acid Test | 1.45 | 1.90 | 3.08 | n.a |
| Sales/Net Worth | 10.78 | 8.12 | 5.23 | n.a |
| Dividend Payout | 0.00 | 0.00 | 0.00 | n.a |
Appendix
| Sales Forecast | |||||||||||||
| Month 1 | Month 2 | Month 3 | Month 4 | Month 5 | Month 6 | Month 7 | Month 8 | Month 9 | Month 10 | Month 11 | Month 12 | ||
| Sales | |||||||||||||
| Frozen Custard | 0% | $840 | $2,550 | $3,570 | $5,610 | $6,630 | $6,120 | $4,830 | $4,410 | $3,315 | $3,315 | $3,900 | $5,040 |
| Italian Ice | 0% | $280 | $850 | $1,190 | $1,870 | $2,210 | $2,040 | $1,610 | $1,470 | $1,105 | $1,105 | $1,300 | $1,680 |
| Total Sales | $1,120 | $3,400 | $4,760 | $7,480 | $8,840 | $8,160 | $6,440 | $5,880 | $4,420 | $4,420 | $5,200 | $6,720 | |
| Direct Cost of Sales | Month 1 | Month 2 | Month 3 | Month 4 | Month 5 | Month 6 | Month 7 | Month 8 | Month 9 | Month 10 | Month 11 | Month 12 | |
| Frozen Custard | $218 | $663 | $928 | $1,459 | $1,724 | $1,591 | $1,256 | $1,147 | $862 | $862 | $1,014 | $1,310 | |
| Italian Ice | $73 | $221 | $309 | $486 | $575 | $530 | $419 | $382 | $287 | $287 | $338 | $437 | |
| Subtotal Direct Cost of Sales | $291 | $884 | $1,238 | $1,945 | $2,298 | $2,122 | $1,674 | $1,529 | $1,149 | $1,149 | $1,352 | $1,747 | |
| Personnel Plan | |||||||||||||
| Month 1 | Month 2 | Month 3 | Month 4 | Month 5 | Month 6 | Month 7 | Month 8 | Month 9 | Month 10 | Month 11 | Month 12 | ||
| Part-time employees | 0% | $0 | $994 | $994 | $994 | $994 | $994 | $426 | $426 | $426 | $426 | $426 | $994 |
| Owner – Matthew Bauman | 0% | $0 | $0 | $0 | $0 | $0 | $0 | $0 | $0 | $0 | $0 | $0 | $0 |
| Other Owner(s) | 0% | $1,000 | $1,000 | $1,000 | $1,000 | $1,000 | $1,000 | $1,000 | $1,000 | $1,000 | $1,000 | $1,000 | $1,000 |
| Total People | 2 | 3 | 3 | 3 | 3 | 3 | 3 | 3 | 3 | 3 | 3 | 3 | |
| Total Payroll | $1,000 | $1,994 | $1,994 | $1,994 | $1,994 | $1,994 | $1,426 | $1,426 | $1,426 | $1,426 | $1,426 | $1,994 | |
| General Assumptions | |||||||||||||
| Month 1 | Month 2 | Month 3 | Month 4 | Month 5 | Month 6 | Month 7 | Month 8 | Month 9 | Month 10 | Month 11 | Month 12 | ||
| Plan Month | 1 | 2 | 3 | 4 | 5 | 6 | 7 | 8 | 9 | 10 | 11 | 12 | |
| Current Interest Rate | 4.08% | 4.08% | 4.08% | 4.08% | 4.08% | 4.08% | 4.08% | 4.08% | 4.08% | 4.08% | 4.08% | 4.08% | |
| Long-term Interest Rate | 5.20% | 5.20% | 5.20% | 5.20% | 5.20% | 5.20% | 5.20% | 5.20% | 5.20% | 5.20% | 5.20% | 5.20% | |
| Tax Rate | 30.00% | 30.00% | 30.00% | 30.00% | 30.00% | 30.00% | 30.00% | 30.00% | 30.00% | 30.00% | 30.00% | 30.00% | |
| Other | 0 | 0 | 0 | 0 | 0 | 0 | 0 | 0 | 0 | 0 | 0 | 0 | |
| Pro Forma Profit and Loss | |||||||||||||
| Month 1 | Month 2 | Month 3 | Month 4 | Month 5 | Month 6 | Month 7 | Month 8 | Month 9 | Month 10 | Month 11 | Month 12 | ||
| Sales | $1,120 | $3,400 | $4,760 | $7,480 | $8,840 | $8,160 | $6,440 | $5,880 | $4,420 | $4,420 | $5,200 | $6,720 | |
| Direct Cost of Sales | $291 | $884 | $1,238 | $1,945 | $2,298 | $2,122 | $1,674 | $1,529 | $1,149 | $1,149 | $1,352 | $1,747 | |
| Other Costs of Goods | $0 | $0 | $0 | $0 | $0 | $0 | $0 | $0 | $0 | $0 | $0 | $0 | |
| Total Cost of Sales | $291 | $884 | $1,238 | $1,945 | $2,298 | $2,122 | $1,674 | $1,529 | $1,149 | $1,149 | $1,352 | $1,747 | |
| Gross Margin | $829 | $2,516 | $3,522 | $5,535 | $6,542 | $6,038 | $4,766 | $4,351 | $3,271 | $3,271 | $3,848 | $4,973 | |
| Gross Margin % | 74.00% | 74.00% | 74.00% | 74.00% | 74.00% | 74.00% | 74.00% | 74.00% | 74.00% | 74.00% | 74.00% | 74.00% | |
| Expenses | |||||||||||||
| Payroll | $1,000 | $1,994 | $1,994 | $1,994 | $1,994 | $1,994 | $1,426 | $1,426 | $1,426 | $1,426 | $1,426 | $1,994 | |
| Sales and Marketing and Other Expenses | $1,000 | $1,000 | $1,000 | $1,000 | $800 | $800 | $800 | $350 | $350 | $350 | $350 | $350 | |
| Depreciation | $389 | $389 | $389 | $389 | $389 | $389 | $389 | $389 | $389 | $389 | $389 | $389 | |
| Rent | $1,055 | $1,055 | $1,055 | $1,055 | $1,055 | $1,055 | $1,055 | $1,055 | $1,055 | $1,055 | $1,055 | $1,055 | |
| Utilities | $900 | $1,100 | $1,300 | $1,500 | $1,500 | $1,200 | $1,000 | $800 | $700 | $700 | $800 | $900 | |
| Insurance | $141 | $141 | $141 | $141 | $141 | $141 | $141 | $141 | $141 | $141 | $141 | $141 | |
| Payroll Taxes | 15% | $0 | $0 | $0 | $0 | $0 | $0 | $0 | $0 | $0 | $0 | $0 | $0 |
| Other | $0 | $0 | $0 | $0 | $0 | $0 | $0 | $0 | $0 | $0 | $0 | $0 | |
| Total Operating Expenses | $4,485 | $5,679 | $5,879 | $6,079 | $5,879 | $5,579 | $4,811 | $4,161 | $4,061 | $4,061 | $4,161 | $4,829 | |
| Profit Before Interest and Taxes | ($3,656) | ($3,163) | ($2,357) | ($544) | $663 | $459 | ($45) | $190 | ($790) | ($790) | ($313) | $144 | |
| EBITDA | ($3,267) | ($2,774) | ($1,968) | ($155) | $1,052 | $848 | $344 | $579 | ($401) | ($401) | $76 | $533 | |
| Interest Expense | $316 | $312 | $309 | $305 | $301 | $297 | $293 | $289 | $285 | $281 | $277 | $273 | |
| Taxes Incurred | $0 | $0 | $0 | $0 | $0 | $0 | $0 | $0 | $0 | $0 | $0 | $0 | |
| Net Profit | ($3,973) | ($3,475) | ($2,665) | ($848) | $362 | $163 | ($338) | ($99) | ($1,075) | ($1,071) | ($590) | ($129) | |
| Net Profit/Sales | -354.70% | -102.22% | -55.99% | -11.34% | 4.09% | 1.99% | -5.25% | -1.68% | -24.32% | -24.23% | -11.35% | -1.92% | |
| Pro Forma Cash Flow | |||||||||||||
| Month 1 | Month 2 | Month 3 | Month 4 | Month 5 | Month 6 | Month 7 | Month 8 | Month 9 | Month 10 | Month 11 | Month 12 | ||
| Cash Received | |||||||||||||
| Cash from Operations | |||||||||||||
| Cash Sales | $1,120 | $3,400 | $4,760 | $7,480 | $8,840 | $8,160 | $6,440 | $5,880 | $4,420 | $4,420 | $5,200 | $6,720 | |
| Subtotal Cash from Operations | $1,120 | $3,400 | $4,760 | $7,480 | $8,840 | $8,160 | $6,440 | $5,880 | $4,420 | $4,420 | $5,200 | $6,720 | |
| Additional Cash Received | |||||||||||||
| Sales Tax, VAT, HST/GST Received | 0.00% | $0 | $0 | $0 | $0 | $0 | $0 | $0 | $0 | $0 | $0 | $0 | $0 |
| New Current Borrowing | $0 | $0 | $0 | $0 | $0 | $0 | $0 | $0 | $0 | $0 | $0 | $0 | |
| New Other Liabilities (interest-free) | $0 | $0 | $0 | $0 | $0 | $0 | $0 | $0 | $0 | $0 | $0 | $0 | |
| New Long-term Liabilities | $0 | $0 | $0 | $0 | $0 | $0 | $0 | $0 | $0 | $0 | $0 | $0 | |
| Sales of Other Current Assets | $0 | $0 | $0 | $0 | $0 | $0 | $0 | $0 | $0 | $0 | $0 | $0 | |
| Sales of Long-term Assets | $0 | $0 | $0 | $0 | $0 | $0 | $0 | $0 | $0 | $0 | $0 | $0 | |
| New Investment Received | $0 | $0 | $0 | $0 | $0 | $0 | $0 | $0 | $0 | $0 | $0 | $0 | |
| Subtotal Cash Received | $1,120 | $3,400 | $4,760 | $7,480 | $8,840 | $8,160 | $6,440 | $5,880 | $4,420 | $4,420 | $5,200 | $6,720 | |
| Expenditures | Month 1 | Month 2 | Month 3 | Month 4 | Month 5 | Month 6 | Month 7 | Month 8 | Month 9 | Month 10 | Month 11 | Month 12 | |
| Expenditures from Operations | |||||||||||||
| Cash Spending | $1,000 | $1,994 | $1,994 | $1,994 | $1,994 | $1,994 | $1,426 | $1,426 | $1,426 | $1,426 | $1,426 | $1,994 | |
| Bill Payments | $147 | $4,419 | $4,630 | $5,307 | $6,715 | $6,448 | $5,388 | $4,456 | $3,988 | $3,531 | $3,545 | $4,106 | |
| Subtotal Spent on Operations | $1,147 | $6,413 | $6,624 | $7,301 | $8,709 | $8,442 | $6,814 | $5,882 | $5,414 | $4,957 | $4,971 | $6,100 | |
| Additional Cash Spent | |||||||||||||
| Sales Tax, VAT, HST/GST Paid Out | $0 | $0 | $0 | $0 | $0 | $0 | $0 | $0 | $0 | $0 | $0 | $0 | |
| Principal Repayment of Current Borrowing | $417 | $417 | $417 | $417 | $417 | $417 | $417 | $417 | $417 | $417 | $417 | $417 | |
| Other Liabilities Principal Repayment | $0 | $0 | $0 | $0 | $0 | $0 | $0 | $0 | $0 | $0 | $0 | $0 | |
| Long-term Liabilities Principal Repayment | $583 | $583 | $583 | $583 | $583 | $583 | $583 | $583 | $583 | $583 | $583 | $583 | |
| Purchase Other Current Assets | $0 | $0 | $0 | $0 | $0 | $0 | $0 | $0 | $0 | $0 | $0 | $0 | |
| Purchase Long-term Assets | $0 | $0 | $0 | $0 | $0 | $0 | $0 | $0 | $0 | $0 | $0 | $0 | |
| Dividends | $0 | $0 | $0 | $0 | $0 | $0 | $0 | $0 | $0 | $0 | $0 | $0 | |
| Subtotal Cash Spent | $2,147 | $7,413 | $7,624 | $8,301 | $9,709 | $9,442 | $7,814 | $6,882 | $6,414 | $5,957 | $5,971 | $7,100 | |
| Net Cash Flow | ($1,027) | ($4,013) | ($2,864) | ($821) | ($869) | ($1,282) | ($1,374) | ($1,002) | ($1,994) | ($1,537) | ($771) | ($380) | |
| Cash Balance | $23,791 | $19,778 | $16,914 | $16,093 | $15,223 | $13,941 | $12,567 | $11,565 | $9,572 | $8,035 | $7,264 | $6,883 | |
| Pro Forma Balance Sheet | |||||||||||||
| Month 1 | Month 2 | Month 3 | Month 4 | Month 5 | Month 6 | Month 7 | Month 8 | Month 9 | Month 10 | Month 11 | Month 12 | ||
| Assets | Starting Balances | ||||||||||||
| Current Assets | |||||||||||||
| Cash | $24,818 | $23,791 | $19,778 | $16,914 | $16,093 | $15,223 | $13,941 | $12,567 | $11,565 | $9,572 | $8,035 | $7,264 | $6,883 |
| Inventory | $320 | $1,029 | $1,145 | $1,361 | $2,139 | $2,528 | $2,334 | $1,842 | $1,682 | $1,532 | $1,383 | $1,487 | $1,922 |
| Other Current Assets | $0 | $0 | $0 | $0 | $0 | $0 | $0 | $0 | $0 | $0 | $0 | $0 | $0 |
| Total Current Assets | $25,138 | $24,820 | $20,923 | $18,275 | $18,232 | $17,752 | $16,275 | $14,409 | $13,247 | $11,104 | $9,418 | $8,751 | $8,805 |
| Long-term Assets | |||||||||||||
| Long-term Assets | $69,800 | $69,800 | $69,800 | $69,800 | $69,800 | $69,800 | $69,800 | $69,800 | $69,800 | $69,800 | $69,800 | $69,800 | $69,800 |
| Accumulated Depreciation | $0 | $389 | $778 | $1,167 | $1,556 | $1,945 | $2,334 | $2,723 | $3,112 | $3,501 | $3,890 | $4,279 | $4,668 |
| Total Long-term Assets | $69,800 | $69,411 | $69,022 | $68,633 | $68,244 | $67,855 | $67,466 | $67,077 | $66,688 | $66,299 | $65,910 | $65,521 | $65,132 |
| Total Assets | $94,938 | $94,231 | $89,945 | $86,908 | $86,476 | $85,607 | $83,741 | $81,486 | $79,935 | $77,403 | $75,328 | $74,272 | $73,937 |
| Liabilities and Capital | Month 1 | Month 2 | Month 3 | Month 4 | Month 5 | Month 6 | Month 7 | Month 8 | Month 9 | Month 10 | Month 11 | Month 12 | |
| Current Liabilities | |||||||||||||
| Accounts Payable | $0 | $4,265 | $4,455 | $5,083 | $6,499 | $6,268 | $5,239 | $4,322 | $3,870 | $3,413 | $3,409 | $3,943 | $4,738 |
| Current Borrowing | $5,000 | $4,583 | $4,167 | $3,750 | $3,333 | $2,917 | $2,500 | $2,083 | $1,667 | $1,250 | $833 | $417 | $0 |
| Other Current Liabilities | $0 | $0 | $0 | $0 | $0 | $0 | $0 | $0 | $0 | $0 | $0 | $0 | $0 |
| Subtotal Current Liabilities | $5,000 | $8,849 | $8,621 | $8,833 | $9,832 | $9,185 | $7,739 | $6,405 | $5,537 | $4,663 | $4,243 | $4,360 | $4,738 |
| Long-term Liabilities | $70,000 | $69,417 | $68,833 | $68,250 | $67,667 | $67,083 | $66,500 | $65,917 | $65,333 | $64,750 | $64,167 | $63,583 | $63,000 |
| Total Liabilities | $75,000 | $78,265 | $77,455 | $77,083 | $77,499 | $76,268 | $74,239 | $72,322 | $70,870 | $69,413 | $68,409 | $67,943 | $67,738 |
| Paid-in Capital | $25,000 | $25,000 | $25,000 | $25,000 | $25,000 | $25,000 | $25,000 | $25,000 | $25,000 | $25,000 | $25,000 | $25,000 | $25,000 |
| Retained Earnings | ($5,062) | ($5,062) | ($5,062) | ($5,062) | ($5,062) | ($5,062) | ($5,062) | ($5,062) | ($5,062) | ($5,062) | ($5,062) | ($5,062) | ($5,062) |
| Earnings | $0 | ($3,973) | ($7,448) | ($10,113) | ($10,961) | ($10,600) | ($10,437) | ($10,775) | ($10,873) | ($11,949) | ($13,020) | ($13,610) | ($13,739) |
| Total Capital | $19,938 | $15,966 | $12,490 | $9,825 | $8,977 | $9,339 | $9,502 | $9,163 | $9,065 | $7,990 | $6,919 | $6,329 | $6,200 |
| Total Liabilities and Capital | $94,938 | $94,231 | $89,945 | $86,908 | $86,476 | $85,607 | $83,741 | $81,486 | $79,935 | $77,403 | $75,328 | $74,272 | $73,937 |
| Net Worth | $19,938 | $15,966 | $12,490 | $9,825 | $8,977 | $9,339 | $9,502 | $9,163 | $9,065 | $7,990 | $6,919 | $6,329 | $6,200 |

