
Franchise Sub Shop
Executive Summary
The purpose of this business plan is to secure additional, long-term funding to open a QSR (Quick Service Retail) franchise in Ashland, Oregon. The owners of the company are willing to invest $30,000, and assume over $110,000 in short-term liability to secure the funding for inventory, and early operations. The SBA 504 loan we seek is in the amount of $200,000, and if approved, will be amortized to 10 years.
The franchiser, “The Sub Shop Corp.,” is one of the fastest growing franchises in North America. Sales last year topped $800,000,000. The chain is positioned somewhere between traditional fast food restaurants, and sit-down restaurants. This segment of the market is attuned to the health benefits of their eating habits, are more conscious of their buying habits than the general population, and more importantly, they have higher incomes and are willing to pay more for a better fast food choice. Our goal is to be that choice in the Ashland Metro area.
To succeed with our goal, and to encourage a healthy lifestyle, we will sponsor local sporting events, and give 3% of profits to local charities. We will build roots into the community. We will also market our products with local businesses, the famous Shakespearean Festival, to local hotels, and offer catering services through local party supply stores and through close ties to local hotel managers and executives.
Our primary goal for this plan is that it help us secure this $200,000 SBA loan. Once we have done that, our goal will be to build value for our constituents, ourselves, our employees, our customers, and the community. We see these goals as being consistent with the goals the SBA expects of itself and its guarantors.
1.1 Objectives
Our first objective is to open the Franchise restaurant four months from the day that our site is confirmed by the realtor. Our site was confirmed in April, therefore our goal is to be up and running by August. Our P&L and Balance Sheet all begin in August. Start-up costs between April and August may be found in the Start-up Summary Section.
The Sub Shop will turn a profit by the beginning of our second fiscal year of operations.
We will pay down our $200,000 SBA loan to $180,000 by the end of year one.
Repeat customers will constitute 70% of our overall business by the end of year one. We will track customer habits and loyalty through a local marketing research firm, and publish the results of these findings to our employees once a quarter.
Net Profit for year one will be 21%.
1.2 Mission
Our mission is to bring to market the tastiest and healthiest fast food in Ashland, at a slight cost premium over other fast food restaurants. Our high standards of quality and cleanliness will establish our reputation as the cleanest fast food restaurant in Ashland.
Our community is as important to us as making a profit. We will devote 2% of profits to a local women’s shelter, and 1% to a local environmental conservation fund. This company is founded on the concept that good works and good deeds not only serve the needs of the community, but will also keep our company healthy and committed to the success of its customers.
1.3 Keys to Success
The most important key to success is our location. It is very important that our location live up to our expectations, and is convenient to as many potential customers as possible. As stipulated by the franchise agreement, our “Type A – Profile 1” location must contain a minimum of 6,000 customers within a four block radius (or five minute walk time). The pedestrian traffic must be adequate and the lunch habits of the customers must be conducive to eating out.
Another key to success lies with our ability to execute our plan. If we neglect one or more aspects of our plan, whether that is our numbers, our employees, our cleaning and food standards, or our commitment to customers, we will not succeed and thrive.
Company Summary
“The Sub Shop” Corporation franchises, and sometimes owns and operates quick-service Italian-style sub sandwich shops called, appropriately, “The Sub Shop” subs.
The Sub Shop’s upscale concept fits a niche between fast food and fine dining–offering the customer the best benefits of both segments. The company provides the convenience of fast food with rapid response times, affordability, as well as carry-out and home meal replacement options. The Sub Shop also offers a fresher and tastier alternative to typical fried fast food products such as hamburgers and french fries.
The Sub Shop’s concept was born in the kitchen of a popular Italian sit-down restaurant called Gianni’s. The goal of the original owner was to provide great Italian food in a clean, urban environment, and at a reasonable price. After two years as Gianni’s, the owner changed the name to The Sub Shop and began selling subs and soup to go. In 1993, the company expanded to two stores and sales tripled. Financing was secured in December of 1993, and the company became a local Franchise, then a national Franchise. Now with 53 stores in 23 states and four countries, The Sub Shop has taken the Fast Food segment by storm by producing a better product than its competitors, and at a moderately low price.
2.1 Company Ownership
Ninety-seven percent of the restaurant belongs to Walsh and Walsh LLC. The company was formed in Oregon in 1995, and is owned by Jack William Walsh and his father Luke Walsh. Luke owns 77% and Jack owns 30% of Walsh and Walsh LLC. The remaining 3% is held by Lisa McKewan, Store Manager.
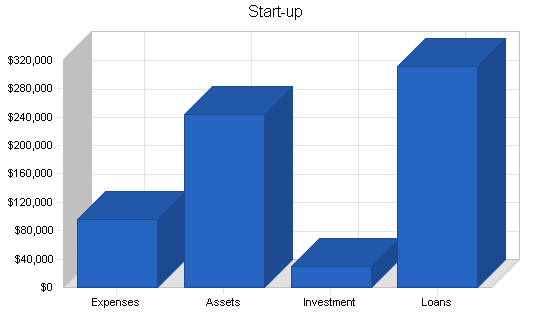
2.2 Start-up Summary
The start-up table shows a summary of our overall start-up costs. The highest initial outlay is for the franchise fee. This is required to launch the franchise. After paying our Franchise fee, our only liability to the franchise will be the 7% cost of sales, and 2.2% advertising charge. Normally the franchise fee would be paid in interest accruing installments, but we decided to forego this to keep the books as clean as possible and to reduce the possibility of a “parent/child” conflict between our company and the constituents.
Cash requirements for start-up are $19,700, and most of this will sit in a zero interest bearing, highly liquid bank account. The first month our change in accounts payable will top $61,000, so we need this $19,700 in case sales are not what we expected. If sales are 30% off projected, this $19,700 will help us gather enough cash to pay off our accounts payable within 30 days. The principles will invest a combined $30,000 to start-up the franchise. We expect that the majority of this will be paid back to the owners within two years of operations, in the form of dividends. This investment makes up over 8% of the total start-up requirements for the company. The remainder consists of one $65,000 short-term interest bearing, unsecured personal loan, one $15,980 interest-free “First Card Visa” 0% promotional loan, and a $200,000 long-term loan guaranteed by the SBA 504 program. The term of the expected loan is 10 years.

The SBA loan that we are seeking will be secured via the pre-appraised market value of the land and property, as well as the improvements to be made on the property through 2001. The estimated net market value of the property following all improvements is approximately $320,000.
| Start-up | |
| Requirements | |
| Start-up Expenses | |
| Business License | $180 |
| Refrigerator/Freezer | $5,500 |
| Building Improvements | $35,000 |
| Franchise Fee | $45,000 |
| 3% Loan Originition Fee | $7,800 |
| Insurance | $1,500 |
| Research and development | $1,500 |
| Total Start-up Expenses | $96,480 |
| Start-up Assets | |
| Cash Required | $19,700 |
| Start-up Inventory | $15,800 |
| Other Current Assets | $4,000 |
| Long-term Assets | $205,000 |
| Total Assets | $244,500 |
| Total Requirements | $340,980 |
| Start-up Funding | |
| Start-up Expenses to Fund | $96,480 |
| Start-up Assets to Fund | $244,500 |
| Total Funding Required | $340,980 |
| Assets | |
| Non-cash Assets from Start-up | $224,800 |
| Cash Requirements from Start-up | $19,700 |
| Additional Cash Raised | $0 |
| Cash Balance on Starting Date | $19,700 |
| Total Assets | $244,500 |
| Liabilities and Capital | |
| Liabilities | |
| Current Borrowing | $65,000 |
| Long-term Liabilities | $200,000 |
| Accounts Payable (Outstanding Bills) | $30,000 |
| Other Current Liabilities (interest-free) | $15,980 |
| Total Liabilities | $310,980 |
| Capital | |
| Planned Investment | |
| Luke Walsh | $15,000 |
| Jack Walsh | $15,000 |
| Additional Investment Requirement | $0 |
| Total Planned Investment | $30,000 |
| Loss at Start-up (Start-up Expenses) | ($96,480) |
| Total Capital | ($66,480) |
| Total Capital and Liabilities | $244,500 |
| Total Funding | $340,980 |
2.3 Company Locations and Facilities
The company will be located between Oak St. and Water St. on Highway 99 in Ashland, Oregon. It is the busiest shopping district in Ashland, and is very close to world famous Lithia Park, also a bustling tourist destination. The building will be decorated like many of the merchants along this thoroughfare; as would befit a former 19th century gold-mining town.
Products
We will offer a large variety of Submarine sandwiches, salads, soups, chili, chips, cookies, and sodas. The sandwiches are made with The Sub Shop’s unique sweet mustard sauce and each loaf of bread is made fresh daily. The bread is toasted for every order and the soups are made daily.
3.1 Product Description
All of our sandwiches are available for customization. In addition, customers will love the fresh, toasted bread, and the freshly sliced meats and cheeses.
Below is a short list of some of the subs we will market, the rest of the products are broken down by unit sales in the sales forecast table:
German Snack: Italian Salami, Bologna, Roast Beef, Tomato, Onion, Bell Pepper, Cheese, Vinegar & Oil and Salt & Pepper upon request.
Swiss Delight: Cheeses (3), Tomato, Onion, Bell Pepper, Cheese, Vinegar & Oil and Salt & Pepper upon request.
Spanish Conqueror: Cheeses (2), White Meat Chicken, Jalapeno Sauce, Tomato, Onion, Bell Pepper, Conqueror & Oil and Salt & Pepper upon request.
American Suburban: PB&J.
American Urban: Tofu, Onions, Tomatoes, Cucumber, Carrot, and two Cheeses.
American Traditional: Angus Beef, American Cheese, Lettuce, Tomato, with a 1/4 slice Kosher Pickle.
3.2 Competitive Comparison
Our competition consists of on-campus sandwich shops, fast food restaurants, and downtown eateries. There are three SubSub Sandwich shops in the Ashland metro area, and 10 fast food restaurants. Our competition will be fierce, but our specialized sub sandwiches will set us apart from the competition, as will our focus on healthy, yet tasty fast food. SubSub has emphasized the benefits of their healthy sandwiches, yet their sandwich bread is often tasteless and stale, they don’t toast their bread, they don’t use a special sauce, and their production facilities are rarely clean enough to make dining in their restaurant an appetizing venture.
The other fast food restaurants in Ashland will offer a more serious challenge: How do we position ourselves so that people know food is both healthy AND tasty. Many people who eat fast food burgers and fries are not concerned with the health benefits of such activities, but rather, the way the food tastes. To be competitive, our sales literature and promotions will make it clear that our products are tastier than any greasy hamburger, yet will provide a fun, guilt-free eating experience.
3.3 Sales Literature
Our sales literature consists of menus supplied by The Sub Shop and custom flyers designed in-house. The custom flyers will offer catering prices, explain the difference between our lunch specials and those of our competitors, and show our hours of operation. We will place the catering and lunch service flyers strategically near Oregon Shakespearean theatre events, park events, with local businesses, and in Jackson County community centers.
3.4 Sourcing
The Sub Shop Corp. will provide the supplies necessary for operation. Due to bulk buying by The Sub Shop Corp., and our standardized franchise-based supply line, our purchasing costs will be 10% below similar costs incurred by a non-Franchise restaurant and our payment days average 45 instead of the industry median of 30 days.
To maintain a conservative financial perspective, we have not built this 10% discount into our cost of goods in the Profit and Loss Statement. We have calculated cost of goods as a flat 35% of sales, an average for our industry. We will update these amounts with real figures once we have three months of purchase history. We expect to revise our sourcing costs down by at least 10% in November.
3.5 Technology
We will take advantage of the latest technology in order to speed our business processes and develop more efficient operations. In planning for the launch, we have purchased three copies of Business Plan Pro software. Each principle has been given a segment of the plan to work on. Jack is in charge of writing all franchise-specific topics, Luke is in charge of generating and explaining the numbers, and Susan is responsible for all operations-specific topics. Each person synchronizes their machine with the secureplan.com secure server, making the most recent version of the business plan available at all times on the Web.
In addition to using technology to establish the business model and methodology, we also use technology for day-to-day operations. The Sub Shop Corp. supplies us with the latest in ordering equipment, including a merchant credit and debit card account, number verification, inventory management software and timeclock (HR) software. Each employee is given a cell phone for personal use, and in exchange for this relatively inexpensive benefit, they are expected to work flexible hours, and respond when called in to replace an employee that is sick, or otherwise not available for their shift.
Technology is also used for routine maintenance and sustainable operations. The company uses only biodegradable soaps and cleaning supplies, and encourages all employees and customers to recycle plastic, glass, and cardboard items. We view these options in sustainability as being tied directly to advances in technology. For instance, as wind and solar power become available through the local utility, we will opt to source through those options.
3.6 Future Products
The product mix is determined by corporate (biodegradable). Future product suggestions are welcome by corporate, and if approved, may become part of the product mix.
Market Analysis Summary
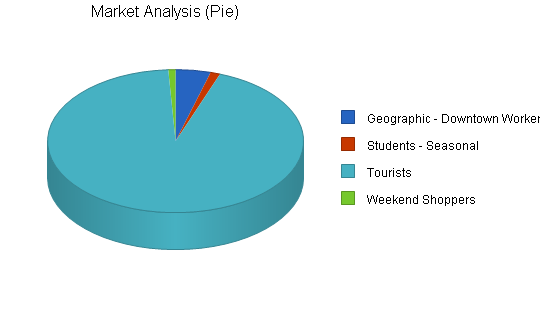
Our market consists of both tourists, downtown workers, and students from Southern Oregon University. Over 362,000 tourists visit Ashland each year–100,000 for the Shakespearean Festival and 262,000 for other recreational/shopping activities. Tourist make up the largest segment of our target market, at about 85% of the total market for our products. There are about 18,000 people living and working in Ashland. If we can convince just 15% of those people to buy our sandwiches twice a month, we’ll sell 65,000 sandwiches to that market alone in 2001. Add that amount to 20% of all tourists to the Ashland area, and those two segments alone will buy 138,000 meals.
In addition, demographics have shifted in recent years from traditional households (two parents with children) to more non-traditional households; as a result, many adults feel they have less free time. Consumers report that they are eating out more often in order to free up time normally spent cooking, and use that time to enjoy their families and to take advantage of other leisure activities.
From the Ashland Chamber of Commerce:
Ashland (pop. 18,560) has built its economy on a resource base of timber, favorable climate, attractive landscape, cultural attractions, a well-educated labor force and education. In addition, Ashland’s location off Interstate 5 and the Southern Pacific Railroad, and its proximity to the Rogue Valley International-Medford Airport, give it market access that is more favorable than usual for a rural town. To offset the risk that comes with dependence on one economic sector, the City of Ashland and the Chamber of Commerce encourage the diversification of markets. Establishment of light manufacturing firms with value-added components, sophisticated services catering to a geographically dispersed clientele, and retailing targeted to local residents are especially encouraged. The Oregon Shakespeare Festival attracts more than 100,000 visitors annually. And because Ashland is considered a “destination” city, an additional 258,427 people visit here for its other attractions such as recreation, shopping and sightseeing. Ashland, while widely known for the nine-month Shakespeare Festival, is also the location of the only federally funded wildlife forensics lab and research facility in the country. Southern Oregon University plays a large part in Ashland’s economic health, with approximately 5,130 students, 576 faculty, 207 staff, 26 temps and 691 student employees.
The City of Ashland’s population over the last four years has averaged 1.4% growth and is not expected to deviate from that rate The City of Ashland’s “official population projections” show a 19,995 population projection for the year 2,005. Over the 10-year period 1995-2005, a total of 2,010 new residents to Ashland are expected. The City of Ashland’s average household size is 2.22 (1990) persons per unit (12) compared to the average household size of 2.34 in 1980.
4.1 Market Segmentation
The largest market is tourists. Our next largest target market consists of downtown workers. Weekend shoppers and students who work or visit downtown make up the remaining two percent of the total market.
| Market Analysis | |||||||
| Year 1 | Year 2 | Year 3 | Year 4 | Year 5 | |||
| Potential Customers | Growth | CAGR | |||||
| Geographic – Downtown Workers and Students | 2% | 17,000 | 17,255 | 17,514 | 17,777 | 18,044 | 1.50% |
| Students – Seasonal | 3% | 4,700 | 4,841 | 4,986 | 5,136 | 5,290 | 3.00% |
| Tourists | 9% | 362,000 | 394,580 | 430,092 | 468,800 | 510,992 | 9.00% |
| Weekend Shoppers | 2% | 3,500 | 3,553 | 3,606 | 3,660 | 3,715 | 1.50% |
| Total | 8.57% | 387,200 | 420,229 | 456,198 | 495,373 | 538,041 | 8.57% |
4.2 Target Market Segment Strategy
Downtown Workers:
We will target downtown workers through local businesses, advertising, event sponsorship, and word of mouth advertising.
Students:
Ashland has a seasonal student population of around 4,700. We expect to reach students through campus activities and marketing, as well as by sponsoring special student events.
Tourists:
Over 100,000 tourists will visit the Oregon Shakespearean Festival in 2001. Approximately 262,000 people will visit Ashland for it’s premier recreational activities. We will reach tourists at the time they visit Ashland. Most tourists aren’t thinking, “Where am I going to find good, inexpensive lunches?” when they plan their trips because they know fast food venues are abundant everywhere in America. The strategy will be to stand out from the other venues available on the street, and letting people know our food is relatively inexpensive, but without degrading the premium ambience of shopping in Downtown Ashland.
Weekend Shoppers:
Weekend shoppers come from Medford to shop for clothes, gifts, and crafts in downtown Ashland. Over 40,000 people live and work in Medford, and we predict that at least 8% of those people will at some point shop in Downtown Ashland.
4.2.1 Market Needs
There are two market needs we are attempting to fill. First, there’s a need for a fast food restaurant that produces tasty fast food, at a low cost, in a clean environment. There are many people, considered in the traditional sense to be “Middle Class” and above who will not set foot inside a fast food restaurant due to a) the restaurant’s lack of cleanliness and b) the relative poverty and despair displayed by the people working in these fast food restaurants.
To fill the needs of these customers, we will market products that appeal to their healthy lifestyles, their taste buds, and their sense of “place.” In addition, our food line, tables, floors, and counters will be cleaned constantly throughout the day, and we will maintain a very high standard of cleanliness.
4.2.2 Market Trends
The market for fast food is becoming more demanding. While fast food chains such as D-Lite and others in the mid-1980s failed in their attempt to market low calorie fast food, since the 90’s, some companies have found that healthy fast food pays off. Garden burgers have become prevalent at many fast food restaurants, and even some fast food burger franchises are beginning to offer gardenburgers, and other soy alternatives.
While marketing fast food only as “healthy” would be corporate suicide, there is a trend towards quality in both food and ambiance. As mentioned in the Market Needs topic, many people are heading for restaurants that offer fast food at a slightly higher price, but at a much higher quality, and delivered by employees who do not feel degraded or otherwise fatalistic about their role at work. While the latter issue may be debated by intellectuals in Management 410 B-school courses or readers of the current bestselling book, “Fast Food Nation,” the fact remains that American society will continue to want more for less. If we pursue the niche of customers that reside between the bargain-hunters and the spendthrifts, and of those, the ones that are repulsed by standard fast food practices, lack of cleanliness, and the total lack ambiance inherent to most fast food restaurants, we will do a brisk business.
Consumers spend about 46% of their food budget on eating out.
4.2.3 Market Growth
The National Restaurant Association predicts that the QSR market will grow slightly slower than the overall market for food services. This is due to reduced discretionary income, and recessionary economic pressures in 2000 and 2001. The overall growth rate in the fast food business is expected to be 4.4% in 2001. Growth in catering services is expected to be at around 6.5%. Based on the fact that only about 20% of our sales will be generated from catering services, and that our franchise resides in the QSR sub-market of the fast food market, a slower growing market during a recession, we have pegged our overall market growth rate at a weighted 4.82%. However, because of the faster than average growth of the Ashland area, and the increase in tourism in Jackson County over the last few years, we have estimated that our potential customer base will grow at a healthy 8.57% clip.
4.3 Industry Analysis
Food service industry sales will reach an estimated $30 billion in 2010, or over 3% of Gross Domestic Product. Within this industry, the QSR (Quick Service Restaurant) segment represents over 2/3 of total traffic and over half of restaurant sales. QSRs are defined by the industry primarily based upon menu item, with the burger and pizza sub-segments accounting for over half of total QSR sales. QSR sales are estimated to reach $15 billion by 2010.
4.3.1 Industry Participants
The industry is composed of several large brand-name restaurants, and a large number of local fast food chains. Depending on where you look in any given year, 4-5 new fast food outlets may open and close their doors. The industry is always changing and is a highly competitive arena where staying power and customer loyalty is difficult to acquire. The participants in the Ashland market include Burger King, McDonald’s, Taco Bell, Taco Time. In the QSR market, Blimpie, Subway, and several local sub-shops are industry participants most likely to compete directly with The Sub Shop.
4.3.2 Distribution Patterns
We distribute our products direct to customers, both through retail and through our catering service. We don’t rely on a channel of resellers or distributors to get our products into the hands of consumers.
4.3.3 Competition and Buying Patterns
The fast-food business is based largely on the impulsive choice of consumers. Many people buy their business lunch, lunch, or family dinners at a fast food restaurant, and those fast food restaurants offer not necessarily the best selection, but the most reliable menu and the fastest order completion time. Customers will try other fast food restaurants, and shop around, but the majority of their fast food purchases are from one of their favorite fast food or QSR restaurants. Our goal is to capture those customers, and to build loyalty to the product through purchase punch cards, consistent daily specials, and a direct mail list.
4.3.4 Main Competitors
Our main competitors are the major national fast food franchises. SubSub is our largest competitor, with 12,868 franchises in the U.S. alone.
SubSub licenses franchises throughout the nation, and offers two locations in the Ashland Metro area. McDonald’s only has one store in the Ashland area.
SubSub contributes to the growth in our market by advocating for healthy eating habits via online, TV, and radio advertising. They are our largest competitor, yet they also contribute to the nationwide growth of the healthy food segment of this market. We can count on them to bring people into our stores, and will target their local operations through direct mail flyers that offer specials to customer that bring in their SubSub 10-sandwich punch cards.
Strategy and Implementation Summary
Our #1 strategy is to focus on our customer experience. Our success hinges on whether customers receive what we promise them, and are pleased enough to come back for more. Our KISS (Keep it Simple Stupid) approach will be successful only if we don’t distract ourselves from the core business of making good sandwiches fast, and of treating the customers as if they are special.
As with any business model in the new millennium, we must adapt our strategy to the customer and market trends, while maintaining consistency of brand and message. This is a challenge for any business in any industry because the nature of business will always, and has always determined that the best strategy with the most resources behind it will survive. This millennium has proved to be very successful in growing this market, and of supporting it’s franchises.
5.1 Strategy Pyramid
|
Build Customer Loyalty and Word-of-Mouth (WOM) Buzz |
|||
|
Punch Card System |
Community Event Sponsorship |
Store Ambiance |
|
|
10 Sandwiches, 11th Free |
10K Jackson County Run |
Toys for Tots |
European Prints, Furniture |
5.2 Value Proposition
Our value proposition is that we offer high-quality, healthy fast food at a reasonable price. Our facilities are clean and our food is tastier than that of our competitors. The ambiance of our facilities contribute to customers’ desire to eat their meals in a comfortable, healthy environment.
5.3 Competitive Edge
We have a competitive edge in regards to the overall quality and differentiation of our products, and in the cleanliness and ambiance of our seating area. Our sandwiches, soups, etc. are all of the finest quality, and have been refined through taste-tests sponsored by The Sub Shop Corporate. Our seating area will be clean, the murals and prints on the wall will feature airy Italian landscape and European lifestyle motifs. The walls will be painted a rich yellow color, the tables and chairs are a rich walnut color, and the floor will consist of high-quality tile.
We will differentiate our food from SubSub’s in regards to taste, quality of bread and contents, attentiveness to customers, and overall experience. We will build off of SubSub’s national marketing strategy so that we gain from their conversion of burger eaters to sandwich eaters, but alternately prove that we are more responsive to customers and offer better fare than SubSub franchises.
5.4 Marketing Strategy
Our Marketing Strategy is to reach the largest amount of tourists, residents, and students for the least amount of money.
Our strategy will focus on three solid points:
- Building customer loyalty.
- Extending the franchise brand locally.
- Develop local word-of-mouth advertising (buzz).
5.4.1 Positioning Statement
For people looking for a fast, friendly, and tasty lunch, we produce a quick meal. Our seating area will be clean and the overall ambiance of the place will be pleasing to the senses. The food will be good and the service, friendly and fast.
5.4.2 Pricing Strategy
Our pricing strategy is different for different customers. Prices to retail customers will be fixed by the chairs, and based on a relative cost of living indicator. Retail prices will be competitive at about $6 for the average meal. This is about 30% above McDonald’s and Burger King prices, but only about 15% above the average price of a SubSub sandwich. Customers are simply willing to pay more for healthy, flavorful food served in a clean, comfortable environment.
Our highest margins will come from our catering services and large sub products. We will focus on expanding this segment of the market as soon and as aggressively as possible.
5.4.3 Promotion Strategy
The chairs will promote our products on the national level. In order to reach our local customers, and build loyalty, we will offer special mid-day promotions, sponsor local community events, advertise in the local classified paper, and our President will become a leading figure and spokesman in the community.
Our strategy is to focus on promoting the business through local PR efforts, rather than paid advertising.
5.4.4 Distribution Strategy
We plan to distribute our products direct to customers, without the use of a separate channel of distributors.
5.4.5 Marketing Programs
Our marketing programs will include customer-centric appeals to switch from the competition, build loyalty, provide cost value to the customers, and build word of mouth marketing.
Here’s a list of the sales and marketing programs we intend to implement within the next 15 months:
- Five daily in-store regular specials, at least 15% off one particular sandwich item.
- A direct mail coupon offering 50% off your first sandwich when you bring in a stamped SubSub card and sign up for our coupon mailing list.
- High profile sponsorship of two local sporting or charity events.
- 20% off a menu item when you bring in your Oregon Shakespeare festival ticket stub.
- Free delivery to any of the local hotels (market only through hotels), and offer to pay hotels a slotting fee.
We may institute more programs as we see fit. This list of programs is aggressive when compared to the local marketing done by our competitors, so this should give us an early advantage as long as we can keep cash balance and sales numbers up.
5.5 Milestones
The following table shows important milestones for the franchise Sub Shop.
| Milestones | |||||
| Milestone | Start Date | End Date | Budget | Manager | Department |
| Shakespeare Festival Ticket Stub Promotion | 6/1/2001 | 10/31/2001 | $700 | Luke | Department |
| 50% off Coupon – Preparation and Distribution | 6/1/2001 | 7/25/2001 | $400 | Jack | Department |
| Sponsorship of “Pear Blossom Run” | 2/1/2002 | 2/5/2002 | $600 | Jack | Department |
| Establish Menus in Hotels – Slotting | 5/1/2001 | 7/1/2001 | $2,000 | Lisa | Department |
| Devise Specials Schedule and Logistics | 7/1/2001 | 7/31/2001 | $100 | Luke | Department |
| Wrap-up Menu, Special Offers | 7/1/2001 | 7/25/2001 | $0 | Luke | Department |
| Complete Interior Decor | 7/1/2001 | 7/15/2001 | $0 | Jack | Department |
| Hire and Train Employees | 7/1/2001 | 7/31/2001 | $1,200 | Lisa | Department |
| Other | 1/1/2001 | 1/1/2001 | $0 | Manager | Department |
| Totals | $5,000 | ||||
5.6 Sales Strategy
Our sales strategy will be to reach the largest amount of Jackson county residents and tourists with consistent value-added incentives to purchase our products and visit our restaurant. In this industry, and especially as a franchise, our marketing programs are almost indistinguishable from our sales programs. The indistinguishable handles a lot of the national and regional marketing, and we just pay our fee to have it done. Our flexibility will lie in our ability to push the boundaries of freedom the indistinguishable has given us, and to take advantage of opportunities to differentiate ourselves on sales by sale level.
5.6.1 Sales Programs
Here’s a list of the sales and marketing programs we intend to implement within the next 15 months:
- Five daily in-store regular specials, at least 15% off one particular sandwich item.
- A direct mail coupon offering 50% off your first sandwich when you bring in a stamped SubSub card and sign up for our coupon mailing list.
- High profile sponsorship of two local sporting or charity events.
- 20% off a menu item when you bring in your Oregon Shakespeare festival ticket stub.
- Free delivery to any of the local hotels (market only through hotels), and offer to pay hotels a slotting fee.
We may institute more programs as we see fit. This list of programs is aggressive when compared to the local marketing done by our competitors, so this should give us an early advantage as long as we can keep cash balance and sales numbers up.
5.6.2 Sales Forecast
The majority of our revenue will be generated through medium subs and cookies/desserts. The breakdown by product is below.
| Sales Forecast | |||||
| Year 1 | Year 2 | Year 3 | Year 4 | Year 5 | |
| Unit Sales | |||||
| Large Subs | 19,024 | 20,926 | 23,019 | 25,321 | 27,853 |
| Medium Subs | 139,508 | 153,458 | 168,804 | 185,685 | 204,253 |
| Small Subs | 50,730 | 55,803 | 61,383 | 67,522 | 74,274 |
| Entree Salads | 19,024 | 20,926 | 23,019 | 25,321 | 27,853 |
| Side Salads | 15,219 | 16,741 | 18,415 | 20,256 | 22,282 |
| Chips | 38,048 | 41,852 | 46,037 | 50,641 | 55,705 |
| Party Subs and/or Trays | 254 | 279 | 307 | 338 | 371 |
| Desserts | 16,487 | 18,136 | 19,950 | 21,945 | 24,139 |
| Cookies and Desserts | 63,413 | 69,754 | 76,729 | 84,402 | 92,842 |
| Soups and Chili | 17,756 | 19,531 | 21,484 | 23,633 | 25,996 |
| Drinks | 50,729 | 55,803 | 61,383 | 67,522 | 74,274 |
| Total Unit Sales | 430,189 | 473,210 | 520,530 | 572,584 | 629,842 |
| Unit Prices | Year 1 | Year 2 | Year 3 | Year 4 | Year 5 |
| Large Subs | $7.10 | $7.10 | $7.10 | $7.10 | $7.10 |
| Medium Subs | $5.10 | $5.10 | $5.10 | $5.10 | $5.10 |
| Small Subs | $3.89 | $3.89 | $3.89 | $3.89 | $3.89 |
| Entree Salads | $5.10 | $5.10 | $5.10 | $5.10 | $5.10 |
| Side Salads | $1.59 | $1.59 | $1.59 | $1.59 | $1.59 |
| Chips | $0.89 | $0.89 | $0.89 | $0.89 | $0.89 |
| Party Subs and/or Trays | $22.00 | $22.00 | $22.00 | $22.00 | $22.00 |
| Desserts | $1.49 | $1.49 | $1.49 | $1.49 | $1.49 |
| Cookies and Desserts | $1.39 | $1.39 | $1.39 | $1.39 | $1.39 |
| Soups and Chili | $1.89 | $1.89 | $1.89 | $1.89 | $1.89 |
| Drinks | $0.99 | $0.99 | $0.99 | $0.99 | $0.99 |
| Sales | |||||
| Large Subs | $135,069 | $148,576 | $163,433 | $179,776 | $197,754 |
| Medium Subs | $711,488 | $782,637 | $860,901 | $946,991 | $1,041,690 |
| Small Subs | $197,340 | $217,074 | $238,781 | $262,659 | $288,925 |
| Entree Salads | $97,021 | $106,723 | $117,396 | $129,135 | $142,049 |
| Side Salads | $24,198 | $26,618 | $29,280 | $32,208 | $35,429 |
| Chips | $33,862 | $37,249 | $40,973 | $45,071 | $49,578 |
| Party Subs and/or Trays | $5,580 | $6,138 | $6,752 | $7,427 | $8,170 |
| Desserts | $24,566 | $27,023 | $29,725 | $32,697 | $35,967 |
| Cookies and Desserts | $88,143 | $96,958 | $106,654 | $117,319 | $129,051 |
| Soups and Chili | $33,558 | $36,914 | $40,605 | $44,666 | $49,132 |
| Drinks | $50,222 | $55,245 | $60,769 | $66,847 | $73,531 |
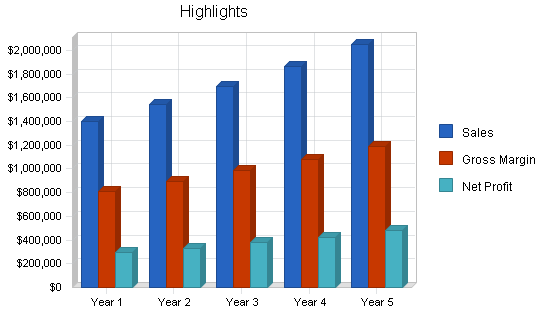
| Total Sales | $1,401,048 | $1,541,154 | $1,695,269 | $1,864,796 | $2,051,276 |
| Direct Unit Costs | Year 1 | Year 2 | Year 3 | Year 4 | Year 5 |
| Large Subs | $2.49 | $2.49 | $2.49 | $2.49 | $2.49 |
| Medium Subs | $1.79 | $1.79 | $1.79 | $1.79 | $1.79 |
| Small Subs | $1.36 | $1.36 | $1.36 | $1.36 | $1.36 |
| Entree Salads | $1.79 | $1.79 | $1.79 | $1.79 | $1.79 |
| Side Salads | $0.56 | $0.56 | $0.56 | $0.56 | $0.56 |
| Chips | $0.31 | $0.31 | $0.31 | $0.31 | $0.31 |
| Party Subs and/or Trays | $7.70 | $7.70 | $7.70 | $7.70 | $7.70 |
| Desserts | $0.52 | $0.52 | $0.52 | $0.52 | $0.52 |
| Cookies and Desserts | $0.49 | $0.49 | $0.49 | $0.49 | $0.49 |
| Soups and Chili | $0.66 | $0.66 | $0.66 | $0.66 | $0.66 |
| Drinks | $0.35 | $0.35 | $0.35 | $0.35 | $0.35 |
| Direct Cost of Sales | |||||
| Large Subs | $47,274 | $52,001 | $57,202 | $62,922 | $69,214 |
| Medium Subs | $249,021 | $273,923 | $301,315 | $331,447 | $364,592 |
| Small Subs | $69,069 | $75,976 | $83,573 | $91,931 | $101,124 |
| Entree Salads | $33,957 | $37,353 | $41,088 | $45,197 | $49,717 |
| Side Salads | $8,469 | $9,316 | $10,248 | $11,273 | $12,400 |
| Chips | $11,852 | $13,037 | $14,341 | $15,775 | $17,352 |
| Party Subs and/or Trays | $1,953 | $2,148 | $2,363 | $2,600 | $2,860 |
| Desserts | $8,598 | $9,458 | $10,404 | $11,444 | $12,588 |
| Cookies and Desserts | $30,850 | $33,935 | $37,329 | $41,062 | $45,168 |
| Soups and Chili | $11,745 | $12,920 | $14,212 | $15,633 | $17,196 |
| Drinks | $17,755 | $19,531 | $21,484 | $23,633 | $25,996 |
| Subtotal Direct Cost of Sales | $490,544 | $539,599 | $593,559 | $652,915 | $718,206 |
5.7 Strategic Alliances
The fast-food business is based largely on the impulsive choice of consumers. Many people buy their business lunch, lunch, or family dinners at a fast food restaurant, and those fast food restaurants offer not necessarily the best selection, but the most reliable menu and the fastest order completion time. Customers will try other fast food restaurants, and shop around, but the majority of their fast food purchases are made through one retailer. Our goal is to capture those customers, and to build loyalty to the product through purchase punch cards, consistent daily specials, and a direct mail list.
Management Summary
Our managers are also owners. We want our managers to take a personal stake in the success of the company, and for that reason we have given them a share of any profits they generate.
Specific information about each manager is available in the following plan topics.
6.1 Personnel Plan
Most of our employees will come from the University of Southern Oregon in Ashland. They will be part-time students and will not need healthcare benefits or 401K benefits. This will hold our payroll burden to less than 8% of total payroll.
The store will hold an annual rafting trip and picnic on the Illinois River each summer. This “team building” exercise will come out of the marketing budget. Please see the Profit and Loss table for details.
Our employees will be respected, and will wear a company polo or sweatshirt, not a tight-fitting, artificial fiber, company-mandated jumpsuit. Our employees will be paid more (in salary & benefits) than employees at most other fast food restaurants will be given tuition reimbursements, thereby making them more empowered, and more content workers. In this way, we will meet the needs of our market, and differentiate our company from the myriad of fast food behemoths, who’s primary goal is to churn out worthless, tasteless food in a degraded facility and by degraded employees.
| Personnel Plan | |||||
| Year 1 | Year 2 | Year 3 | Year 4 | Year 5 | |
| Assistant Manager | $32,400 | $34,344 | $36,405 | $38,589 | $40,904 |
| Store Manager | $44,400 | $47,064 | $49,888 | $52,881 | $56,054 |
| Student Help (PT) | $16,320 | $17,299 | $18,337 | $19,437 | $20,604 |
| Student Help (PT) | $16,320 | $17,299 | $18,337 | $19,437 | $20,604 |
| Student Help (PT) | $16,320 | $17,299 | $18,337 | $19,437 | $20,604 |
| Student Help (PT) | $16,320 | $17,299 | $18,337 | $19,437 | $20,604 |
| Student Help (PT) | $16,320 | $17,229 | $18,337 | $19,437 | $20,604 |
| Total People | 7 | 8 | 10 | 12 | 12 |
| Total Payroll | $158,400 | $167,834 | $177,978 | $188,657 | $199,977 |
6.2 Organizational Structure
The organizational structure is very flat. While it’s important that our manager on duty is clearly in charge, we will not belittle our employees through rankism that disempowers them from taking initiative. Our manage on duty will have the final say regarding all decisions, yet we have trained her to teach the employees how to react to customer issues on their own and respond based on their knowledge of company policy, and when that fails them, their common sense. Fortunately all of the people we have lined up for our open positions appear to have an abundant supply of common sense.
6.3 Management Team
The management team has a combined 30 years of experience in the food service industry, with 15 years of delicatessen experience.
Luke Walsh, the owner, owned and managed a deli in downtown Portland, OR for 15 years. During this period, he turned the deli into a full-service convenience mart, added a dining area, and increase the menu from 10 items when launched, to over 100 items prior to his exit from the company. Luke sold the company to a husband/wife entrepreneur team in 1994 for $2 million, and has been living off personal investments and other ventures for the last seven years. Luke received his MBA from Portland State University in 1998, and earned his BA in finance from the University of Oregon in 1989.
Lisa McKewan, Store Manager, has a BA in Psychology, and worked for over 15 years as manager of the The Greentree Restaurant in Ashland. This restaurant is known for its friendly waitstaff, diverse and award-winning menu, outdoor seating, and excellent service. Lisa turned The Greentree Restaurant from a small, 600 sq. ft deli, to a full-service restaurant. She helped the owners find investors, and helped write the marketing and business expansion plan. She managed the day-to-day operations of the business, trained and hired all waitstaff, set the menu, and managed all advertising spending. Lisa will assume the Store Manager position in title, a step down for her, but in exchange for being flexible in this regard, she will receive 4% ownership in the company. Once the owner has moved out of day-to-day operations, presumably around year three of operations, Lisa will receive another 2% of the company as stipulated by her employment contract.
6.4 Management Team Gaps
The only gap we face is the fact that none of us have run a franchise business. Since both Lisa and Luke have experience running a sole proprietorship, and non-franchised restaurant, our experience will more than compensate for the increased “hand-holding” that comes with owning a franchise.
Due to the limited number of people managing the restaurant, our goals may not be met if we were to lose a manager or owner. We have drawn up a legal contingency plan with a $1 million policy on the owner to prevent this from disrupting the business. We have also allowed for a cash balance that would allow for a recruitment bonus to another Store Manager if Lisa were to leave for any reason.
Financial Plan
Our financial plan is available in the following chapters. Our numbers are based on past experience, knowledge of the industry, growth expectations for the fast food sector nationwide, and common sense.
7.1 Long-term Plan
Our long-term plan includes expansion into the Medford market in year two, followed by healthy dividend payouts in years three through five. Our goal is to build a business out of two franchises, and run each franchise as a profit center for the purpose of building wealth for employees, the community, and the Walsh family.
7.2 Important Assumptions
The SBA 504 loan program stipulates that loans for the purpose of purchasing and improving small business real estate will not exceed 7.5%. The loan is pegged to the 10 year treasury note +1.7%. The current rate for the US Treasury Note is 5.13%, so our estimated long-term loan rate will be about 7%.
The tax rate includes the Oregon State Revenue Tax, currently at 6.6% of NET revenue. We have prorated the assumptive state tax rate to 4.6% due to the fact that this tax is levied on NET revenue, not GROSS. The Federal tax rate average for our net revenue is expected to average 31%. Thus, or assumed total tax rate for this table is 37.6%.
| General Assumptions | |||||
| Year 1 | Year 2 | Year 3 | Year 4 | Year 5 | |
| Plan Month | 1 | 2 | 3 | 4 | 5 |
| Current Interest Rate | 8.40% | 8.40% | 8.40% | 8.40% | 8.40% |
| Long-term Interest Rate | 7.00% | 7.00% | 7.00% | 7.00% | 7.00% |
| Tax Rate | 36.97% | 37.60% | 36.97% | 37.60% | 36.97% |
| Other | 0 | 0 | 0 | 0 | 0 |
7.3 Key Financial Indicators
The following chart shows the projected benchmarks.

7.4 Break-even Analysis
Our break-even analysis is based on a rough estimate of fixed costs. We predict average fixed costs to include the cost to lease the building, equipment leases, and various other equipment costs and fees. Our variable costs include the cost of labor, food inventory, and other product-related costs. Our variable cost estimate is $1.14 per unit, although that number may be revised as we review our actuals in the coming months.
Our monthly break-even unit sales are 12,754. This includes units other than sandwiches, such as cookies, soda, chips and other add-ons. The basis for this break-even point is an average of entrees (sandwiches) and add-ons. The average per unit revenue is $3.26.

| Break-even Analysis | |
| Monthly Units Break-even | 12,754 |
| Monthly Revenue Break-even | $41,538 |
| Assumptions: | |
| Average Per-Unit Revenue | $3.26 |
| Average Per-Unit Variable Cost | $1.14 |
| Estimated Monthly Fixed Cost | $26,994 |
7.5 Projected Profit and Loss
The following table is the projected profit and loss for franchise Sub Shop.

| Pro Forma Profit and Loss | |||||
| Year 1 | Year 2 | Year 3 | Year 4 | Year 5 | |
| Sales | $1,401,048 | $1,541,154 | $1,695,269 | $1,864,796 | $2,051,276 |
| Direct Cost of Sales | $490,544 | $539,599 | $593,559 | $652,915 | $718,206 |
| Franchisor Royalty (7%) | $98,073 | $107,881 | $118,669 | $130,536 | $143,589 |
| Total Cost of Sales | $588,618 | $647,480 | $712,228 | $783,451 | $861,796 |
| Gross Margin | $812,430 | $893,674 | $983,041 | $1,081,346 | $1,189,480 |
| Gross Margin % | 57.99% | 57.99% | 57.99% | 57.99% | 57.99% |
| Expenses | |||||
| Payroll | $158,400 | $167,834 | $177,978 | $188,657 | $199,977 |
| Sales and Marketing and Other Expenses | $69,714 | $75,960 | $82,634 | $89,791 | $97,479 |
| Depreciation | $4,548 | $4,548 | $4,548 | $4,548 | $4,548 |
| Depreciation | $60,000 | $63,000 | $66,000 | $69,000 | $72,000 |
| Depreciation | $7,200 | $7,920 | $8,712 | $9,583 | $10,542 |
| Insurance | $1,200 | $1,320 | $1,452 | $1,597 | $1,757 |
| Cleaning Service | $3,600 | $3,960 | $4,356 | $4,792 | $5,271 |
| Cell Phone Service | $4,200 | $4,620 | $5,082 | $5,590 | $6,149 |
| Legal | $2,400 | $2,400 | $2,400 | $2,400 | $2,400 |
| Payroll Taxes | $12,672 | $13,427 | $14,238 | $15,093 | $15,998 |
| Other | $0 | $0 | $0 | $0 | $0 |
| Total Operating Expenses | $323,934 | $344,989 | $367,400 | $391,050 | $416,120 |
| Profit Before Interest and Taxes | $488,496 | $548,685 | $615,641 | $690,295 | $773,360 |
| EBITDA | $493,044 | $553,233 | $620,189 | $694,843 | $777,908 |
| Interest Expense | $18,156 | $15,848 | $13,439 | $11,031 | $8,623 |
| Taxes Incurred | $174,138 | $200,347 | $222,614 | $255,403 | $282,698 |
| Net Profit | $296,203 | $332,491 | $379,588 | $423,861 | $482,039 |
| Net Profit/Sales | 21.14% | 21.57% | 22.39% | 22.73% | 23.50% |
7.6 Projected Cash Flow
The following chart and table shows the projected cash flow.

| Pro Forma Cash Flow | |||||
| Year 1 | Year 2 | Year 3 | Year 4 | Year 5 | |
| Cash Received | |||||
| Cash from Operations | |||||
| Cash Sales | $1,401,048 | $1,541,154 | $1,695,269 | $1,864,796 | $2,051,276 |
| Subtotal Cash from Operations | $1,401,048 | $1,541,154 | $1,695,269 | $1,864,796 | $2,051,276 |
| Additional Cash Received | |||||
| Sales Tax, VAT, HST/GST Received | $0 | $0 | $0 | $0 | $0 |
| New Current Borrowing | $0 | $0 | $0 | $0 | $0 |
| New Other Liabilities (interest-free) | $0 | $0 | $0 | $0 | $0 |
| New Long-term Liabilities | $0 | $0 | $0 | $0 | $0 |
| Sales of Other Current Assets | $0 | $0 | $0 | $0 | $0 |
| Sales of Long-term Assets | $0 | $0 | $0 | $0 | $0 |
| New Investment Received | $0 | $0 | $0 | $0 | $0 |
| Subtotal Cash Received | $1,401,048 | $1,541,154 | $1,695,269 | $1,864,796 | $2,051,276 |
| Expenditures | Year 1 | Year 2 | Year 3 | Year 4 | Year 5 |
| Expenditures from Operations | |||||
| Cash Spending | $158,400 | $167,834 | $177,978 | $188,657 | $199,977 |
| Bill Payments | $922,938 | $1,036,091 | $1,130,375 | $1,244,014 | $1,361,367 |
| Subtotal Spent on Operations | $1,081,338 | $1,203,925 | $1,308,353 | $1,432,671 | $1,561,344 |
| Additional Cash Spent | |||||
| Sales Tax, VAT, HST/GST Paid Out | $0 | $0 | $0 | $0 | $0 |
| Principal Repayment of Current Borrowing | $12,000 | $12,000 | $12,000 | $12,000 | $12,000 |
| Other Liabilities Principal Repayment | $15,980 | $0 | $0 | $0 | $0 |
| Long-term Liabilities Principal Repayment | $20,004 | $20,004 | $20,004 | $20,004 | $20,004 |
| Purchase Other Current Assets | $0 | $75,000 | $0 | $0 | $0 |
| Purchase Long-term Assets | $35,000 | $250,000 | $0 | $0 | $0 |
| Dividends | $202,000 | $0 | $300,000 | $400,000 | $500,000 |
| Subtotal Cash Spent | $1,366,322 | $1,560,929 | $1,640,357 | $1,864,675 | $2,093,348 |
| Net Cash Flow | $34,726 | ($19,775) | $54,911 | $121 | ($42,072) |
| Cash Balance | $54,426 | $34,651 | $89,562 | $89,683 | $47,611 |
7.7 Projected Balance Sheet
The following table is the projected balance sheet for the franchise Sub Shop.
| Pro Forma Balance Sheet | |||||
| Year 1 | Year 2 | Year 3 | Year 4 | Year 5 | |
| Assets | |||||
| Current Assets | |||||
| Cash | $54,426 | $34,651 | $89,562 | $89,683 | $47,611 |
| Inventory | $47,468 | $52,215 | $57,437 | $63,180 | $69,498 |
| Other Current Assets | $4,000 | $79,000 | $79,000 | $79,000 | $79,000 |
| Total Current Assets | $105,894 | $165,866 | $225,999 | $231,864 | $196,109 |
| Long-term Assets | |||||
| Long-term Assets | $240,000 | $490,000 | $490,000 | $490,000 | $490,000 |
| Accumulated Depreciation | $4,548 | $9,096 | $13,644 | $18,192 | $22,740 |
| Total Long-term Assets | $235,452 | $480,904 | $476,356 | $471,808 | $467,260 |
| Total Assets | $341,346 | $646,770 | $702,355 | $703,672 | $663,369 |
| Liabilities and Capital | Year 1 | Year 2 | Year 3 | Year 4 | Year 5 |
| Current Liabilities | |||||
| Accounts Payable | $80,627 | $85,564 | $93,565 | $103,025 | $112,687 |
| Current Borrowing | $53,000 | $41,000 | $29,000 | $17,000 | $5,000 |
| Other Current Liabilities | $0 | $0 | $0 | $0 | $0 |
| Subtotal Current Liabilities | $133,627 | $126,564 | $122,565 | $120,025 | $117,687 |
| Long-term Liabilities | $179,996 | $159,992 | $139,988 | $119,984 | $99,980 |
| Total Liabilities | $313,623 | $286,556 | $262,553 | $240,009 | $217,667 |
| Paid-in Capital | $30,000 | $30,000 | $30,000 | $30,000 | $30,000 |
| Retained Earnings | ($298,480) | ($2,277) | $30,214 | $9,801 | ($66,338) |
| Earnings | $296,203 | $332,491 | $379,588 | $423,861 | $482,039 |
| Total Capital | $27,723 | $360,214 | $439,801 | $463,662 | $445,702 |
| Total Liabilities and Capital | $341,346 | $646,770 | $702,355 | $703,672 | $663,369 |
| Net Worth | $27,723 | $360,214 | $439,801 | $463,662 | $445,702 |
7.8 Business Ratios
Our ratios table shows industry numbers for SIC 5812, Eating Places. The SIC industry averages are generic and do not reflect our precise numbers.
| Ratio Analysis | ||||||
| Year 1 | Year 2 | Year 3 | Year 4 | Year 5 | Industry Profile | |
| Sales Growth | 0.00% | 10.00% | 10.00% | 10.00% | 10.00% | 7.60% |
| Percent of Total Assets | ||||||
| Inventory | 13.91% | 8.07% | 8.18% | 8.98% | 10.48% | 3.60% |
| Other Current Assets | 1.17% | 12.21% | 11.25% | 11.23% | 11.91% | 35.60% |
| Total Current Assets | 31.02% | 25.65% | 32.18% | 32.95% | 29.56% | 43.70% |
| Long-term Assets | 68.98% | 74.35% | 67.82% | 67.05% | 70.44% | 56.30% |
| Total Assets | 100.00% | 100.00% | 100.00% | 100.00% | 100.00% | 100.00% |
| Current Liabilities | 39.15% | 19.57% | 17.45% | 17.06% | 17.74% | 32.70% |
| Long-term Liabilities | 52.73% | 24.74% | 19.93% | 17.05% | 15.07% | 28.50% |
| Total Liabilities | 91.88% | 44.31% | 37.38% | 34.11% | 32.81% | 61.20% |
| Net Worth | 8.12% | 55.69% | 62.62% | 65.89% | 67.19% | 38.80% |
| Percent of Sales | ||||||
| Sales | 100.00% | 100.00% | 100.00% | 100.00% | 100.00% | 100.00% |
| Gross Margin | 57.99% | 57.99% | 57.99% | 57.99% | 57.99% | 60.50% |
| Selling, General & Administrative Expenses | 36.83% | 36.24% | 35.69% | 35.17% | 34.67% | 39.80% |
| Advertising Expenses | 2.20% | 2.20% | 2.20% | 2.20% | 2.20% | 3.20% |
| Profit Before Interest and Taxes | 34.87% | 35.60% | 36.32% | 37.02% | 37.70% | 0.70% |
| Main Ratios | ||||||
| Current | 0.79 | 1.31 | 1.84 | 1.93 | 1.67 | 0.98 |
| Quick | 0.44 | 0.90 | 1.38 | 1.41 | 1.08 | 0.65 |
| Total Debt to Total Assets | 91.88% | 44.31% | 37.38% | 34.11% | 32.81% | 61.20% |
| Pre-tax Return on Net Worth | 1696.57% | 147.92% | 136.93% | 146.50% | 171.58% | 1.70% |
| Pre-tax Return on Assets | 137.79% | 82.38% | 85.74% | 96.53% | 115.28% | 4.30% |
| Additional Ratios | Year 1 | Year 2 | Year 3 | Year 4 | Year 5 | |
| Net Profit Margin | 21.14% | 21.57% | 22.39% | 22.73% | 23.50% | n.a |
| Return on Equity | 1068.43% | 92.30% | 86.31% | 91.42% | 108.15% | n.a |
| Activity Ratios | ||||||
| Inventory Turnover | 10.91 | 10.83 | 10.83 | 10.83 | 10.83 | n.a |
| Accounts Payable Turnover | 12.07 | 12.17 | 12.17 | 12.17 | 12.17 | n.a |
| Payment Days | 28 | 29 | 29 | 29 | 29 | n.a |
| Total Asset Turnover | 4.10 | 2.38 | 2.41 | 2.65 | 3.09 | n.a |
| Debt Ratios | ||||||
| Debt to Net Worth | 11.31 | 0.80 | 0.60 | 0.52 | 0.49 | n.a |
| Current Liab. to Liab. | 0.43 | 0.44 | 0.47 | 0.50 | 0.54 | n.a |
| Liquidity Ratios | ||||||
| Net Working Capital | ($27,733) | $39,302 | $103,433 | $111,838 | $78,422 | n.a |
| Interest Coverage | 26.91 | 34.62 | 45.81 | 62.58 | 89.69 | n.a |
| Additional Ratios | ||||||
| Assets to Sales | 0.24 | 0.42 | 0.41 | 0.38 | 0.32 | n.a |
| Current Debt/Total Assets | 39% | 20% | 17% | 17% | 18% | n.a |
| Acid Test | 0.44 | 0.90 | 1.38 | 1.41 | 1.08 | n.a |
| Sales/Net Worth | 50.54 | 4.28 | 3.85 | 4.02 | 4.60 | n.a |
| Dividend Payout | 0.68 | 0.00 | 0.79 | 0.94 | 1.04 | n.a |
Appendix
| Sales Forecast | |||||||||||||
| Month 1 | Month 2 | Month 3 | Month 4 | Month 5 | Month 6 | Month 7 | Month 8 | Month 9 | Month 10 | Month 11 | Month 12 | ||
| Unit Sales | |||||||||||||
| Large Subs | 0% | 1,500 | 1,515 | 1,530 | 1,545 | 1,561 | 1,577 | 1,592 | 1,608 | 1,624 | 1,641 | 1,657 | 1,674 |
| Medium Subs | 0% | 11,000 | 11,110 | 11,221 | 11,333 | 11,447 | 11,561 | 11,677 | 11,793 | 11,911 | 12,031 | 12,151 | 12,272 |
| Small Subs | 0% | 4,000 | 4,040 | 4,080 | 4,121 | 4,162 | 4,204 | 4,246 | 4,289 | 4,331 | 4,375 | 4,418 | 4,463 |
| Entree Salads | 0% | 1,500 | 1,515 | 1,530 | 1,545 | 1,561 | 1,577 | 1,592 | 1,608 | 1,624 | 1,641 | 1,657 | 1,674 |
| Side Salads | 0% | 1,200 | 1,212 | 1,224 | 1,236 | 1,249 | 1,261 | 1,274 | 1,287 | 1,299 | 1,312 | 1,326 | 1,339 |
| Chips | 0% | 3,000 | 3,030 | 3,060 | 3,091 | 3,122 | 3,153 | 3,185 | 3,216 | 3,249 | 3,281 | 3,314 | 3,347 |
| Party Subs and/or Trays | 0% | 20 | 20 | 20 | 21 | 21 | 21 | 21 | 21 | 22 | 22 | 22 | 22 |
| Desserts | 0% | 1,300 | 1,313 | 1,326 | 1,339 | 1,353 | 1,366 | 1,380 | 1,394 | 1,408 | 1,422 | 1,436 | 1,450 |
| Cookies and Desserts | 0% | 5,000 | 5,050 | 5,101 | 5,152 | 5,203 | 5,255 | 5,308 | 5,361 | 5,414 | 5,468 | 5,523 | 5,578 |
| Soups and Chili | 0% | 1,400 | 1,414 | 1,428 | 1,442 | 1,457 | 1,471 | 1,486 | 1,501 | 1,516 | 1,531 | 1,546 | 1,562 |
| Drinks | 0% | 4,000 | 4,040 | 4,080 | 4,121 | 4,162 | 4,204 | 4,246 | 4,289 | 4,331 | 4,375 | 4,418 | 4,463 |
| Total Unit Sales | 33,920 | 34,259 | 34,601 | 34,948 | 35,297 | 35,650 | 36,007 | 36,367 | 36,730 | 37,098 | 37,468 | 37,844 | |
| Unit Prices | Month 1 | Month 2 | Month 3 | Month 4 | Month 5 | Month 6 | Month 7 | Month 8 | Month 9 | Month 10 | Month 11 | Month 12 | |
| Large Subs | $7.10 | $7.10 | $7.10 | $7.10 | $7.10 | $7.10 | $7.10 | $7.10 | $7.10 | $7.10 | $7.10 | $7.10 | |
| Medium Subs | $5.10 | $5.10 | $5.10 | $5.10 | $5.10 | $5.10 | $5.10 | $5.10 | $5.10 | $5.10 | $5.10 | $5.10 | |
| Small Subs | $3.89 | $3.89 | $3.89 | $3.89 | $3.89 | $3.89 | $3.89 | $3.89 | $3.89 | $3.89 | $3.89 | $3.89 | |
| Entree Salads | $5.10 | $5.10 | $5.10 | $5.10 | $5.10 | $5.10 | $5.10 | $5.10 | $5.10 | $5.10 | $5.10 | $5.10 | |
| Side Salads | $1.59 | $1.59 | $1.59 | $1.59 | $1.59 | $1.59 | $1.59 | $1.59 | $1.59 | $1.59 | $1.59 | $1.59 | |
| Chips | $0.89 | $0.89 | $0.89 | $0.89 | $0.89 | $0.89 | $0.89 | $0.89 | $0.89 | $0.89 | $0.89 | $0.89 | |
| Party Subs and/or Trays | $22.00 | $22.00 | $22.00 | $22.00 | $22.00 | $22.00 | $22.00 | $22.00 | $22.00 | $22.00 | $22.00 | $22.00 | |
| Desserts | $1.49 | $1.49 | $1.49 | $1.49 | $1.49 | $1.49 | $1.49 | $1.49 | $1.49 | $1.49 | $1.49 | $1.49 | |
| Cookies and Desserts | $1.39 | $1.39 | $1.39 | $1.39 | $1.39 | $1.39 | $1.39 | $1.39 | $1.39 | $1.39 | $1.39 | $1.39 | |
| Soups and Chili | $1.89 | $1.89 | $1.89 | $1.89 | $1.89 | $1.89 | $1.89 | $1.89 | $1.89 | $1.89 | $1.89 | $1.89 | |
| Drinks | $0.99 | $0.99 | $0.99 | $0.99 | $0.99 | $0.99 | $0.99 | $0.99 | $0.99 | $0.99 | $0.99 | $0.99 | |
| Sales | |||||||||||||
| Large Subs | $10,650 | $10,757 | $10,864 | $10,973 | $11,082 | $11,193 | $11,305 | $11,418 | $11,532 | $11,648 | $11,764 | $11,882 | |
| Medium Subs | $56,100 | $56,661 | $57,228 | $57,800 | $58,378 | $58,962 | $59,551 | $60,147 | $60,748 | $61,356 | $61,969 | $62,589 | |
| Small Subs | $15,560 | $15,716 | $15,873 | $16,031 | $16,192 | $16,354 | $16,517 | $16,682 | $16,849 | $17,018 | $17,188 | $17,360 | |
| Entree Salads | $7,650 | $7,726 | $7,804 | $7,882 | $7,961 | $8,040 | $8,121 | $8,202 | $8,284 | $8,367 | $8,450 | $8,535 | |
| Side Salads | $1,908 | $1,927 | $1,946 | $1,966 | $1,985 | $2,005 | $2,025 | $2,046 | $2,066 | $2,087 | $2,108 | $2,129 | |
| Chips | $2,670 | $2,697 | $2,724 | $2,751 | $2,778 | $2,806 | $2,834 | $2,863 | $2,891 | $2,920 | $2,949 | $2,979 | |
| Party Subs and/or Trays | $440 | $444 | $449 | $453 | $458 | $462 | $467 | $472 | $476 | $481 | $486 | $491 | |
| Desserts | $1,937 | $1,956 | $1,976 | $1,996 | $2,016 | $2,036 | $2,056 | $2,077 | $2,097 | $2,118 | $2,140 | $2,161 | |
| Cookies and Desserts | $6,950 | $7,019 | $7,090 | $7,161 | $7,232 | $7,305 | $7,378 | $7,451 | $7,526 | $7,601 | $7,677 | $7,754 | |
| Soups and Chili | $2,646 | $2,672 | $2,699 | $2,726 | $2,753 | $2,781 | $2,809 | $2,837 | $2,865 | $2,894 | $2,923 | $2,952 | |
| Drinks | $3,960 | $4,000 | $4,039 | $4,080 | $4,120 | $4,162 | $4,204 | $4,246 | $4,288 | $4,331 | $4,374 | $4,418 | |
| Total Sales | $110,471 | $111,576 | $112,691 | $113,818 | $114,956 | $116,106 | $117,267 | $118,440 | $119,624 | $120,821 | $122,028 | $123,249 | |
| Direct Unit Costs | Month 1 | Month 2 | Month 3 | Month 4 | Month 5 | Month 6 | Month 7 | Month 8 | Month 9 | Month 10 | Month 11 | Month 12 | |
| Large Subs | 0.00% | $2.49 | $2.49 | $2.49 | $2.49 | $2.49 | $2.49 | $2.49 | $2.49 | $2.49 | $2.49 | $2.49 | $2.49 |
| Medium Subs | 0.00% | $1.79 | $1.79 | $1.79 | $1.79 | $1.79 | $1.79 | $1.79 | $1.79 | $1.79 | $1.79 | $1.79 | $1.79 |
| Small Subs | 0.00% | $1.36 | $1.36 | $1.36 | $1.36 | $1.36 | $1.36 | $1.36 | $1.36 | $1.36 | $1.36 | $1.36 | $1.36 |
| Entree Salads | 0.00% | $1.79 | $1.79 | $1.79 | $1.79 | $1.79 | $1.79 | $1.79 | $1.79 | $1.79 | $1.79 | $1.79 | $1.79 |
| Side Salads | 0.00% | $0.56 | $0.56 | $0.56 | $0.56 | $0.56 | $0.56 | $0.56 | $0.56 | $0.56 | $0.56 | $0.56 | $0.56 |
| Chips | 0.00% | $0.31 | $0.31 | $0.31 | $0.31 | $0.31 | $0.31 | $0.31 | $0.31 | $0.31 | $0.31 | $0.31 | $0.31 |
| Party Subs and/or Trays | 0.00% | $7.70 | $7.70 | $7.70 | $7.70 | $7.70 | $7.70 | $7.70 | $7.70 | $7.70 | $7.70 | $7.70 | $7.70 |
| Desserts | 0.00% | $0.52 | $0.52 | $0.52 | $0.52 | $0.52 | $0.52 | $0.52 | $0.52 | $0.52 | $0.52 | $0.52 | $0.52 |
| Cookies and Desserts | 0.00% | $0.49 | $0.49 | $0.49 | $0.49 | $0.49 | $0.49 | $0.49 | $0.49 | $0.49 | $0.49 | $0.49 | $0.49 |
| Soups and Chili | 0.00% | $0.66 | $0.66 | $0.66 | $0.66 | $0.66 | $0.66 | $0.66 | $0.66 | $0.66 | $0.66 | $0.66 | $0.66 |
| Drinks | 0.00% | $0.35 | $0.35 | $0.35 | $0.35 | $0.35 | $0.35 | $0.35 | $0.35 | $0.35 | $0.35 | $0.35 | $0.35 |
| Direct Cost of Sales | |||||||||||||
| Large Subs | $3,728 | $3,765 | $3,802 | $3,840 | $3,879 | $3,918 | $3,957 | $3,996 | $4,036 | $4,077 | $4,117 | $4,159 | |
| Medium Subs | $19,635 | $19,831 | $20,030 | $20,230 | $20,432 | $20,637 | $20,843 | $21,051 | $21,262 | $21,475 | $21,689 | $21,906 | |
| Small Subs | $5,446 | $5,500 | $5,555 | $5,611 | $5,667 | $5,724 | $5,781 | $5,839 | $5,897 | $5,956 | $6,016 | $6,076 | |
| Entree Salads | $2,678 | $2,704 | $2,731 | $2,759 | $2,786 | $2,814 | $2,842 | $2,871 | $2,899 | $2,928 | $2,958 | $2,987 | |
| Side Salads | $668 | $674 | $681 | $688 | $695 | $702 | $709 | $716 | $723 | $730 | $738 | $745 | |
| Chips | $935 | $944 | $953 | $963 | $972 | $982 | $992 | $1,002 | $1,012 | $1,022 | $1,032 | $1,043 | |
| Party Subs and/or Trays | $154 | $156 | $157 | $159 | $160 | $162 | $163 | $165 | $167 | $168 | $170 | $172 | |
| Desserts | $678 | $685 | $692 | $698 | $705 | $713 | $720 | $727 | $734 | $741 | $749 | $756 | |
| Cookies and Desserts | $2,433 | $2,457 | $2,481 | $2,506 | $2,531 | $2,557 | $2,582 | $2,608 | $2,634 | $2,660 | $2,687 | $2,714 | |
| Soups and Chili | $926 | $935 | $945 | $954 | $964 | $973 | $983 | $993 | $1,003 | $1,013 | $1,023 | $1,033 | |
| Drinks | $1,400 | $1,414 | $1,428 | $1,442 | $1,457 | $1,471 | $1,486 | $1,501 | $1,516 | $1,531 | $1,546 | $1,562 | |
| Subtotal Direct Cost of Sales | $38,679 | $39,066 | $39,456 | $39,851 | $40,249 | $40,652 | $41,058 | $41,469 | $41,884 | $42,303 | $42,725 | $43,153 | |
| Personnel Plan | |||||||||||||
| Month 1 | Month 2 | Month 3 | Month 4 | Month 5 | Month 6 | Month 7 | Month 8 | Month 9 | Month 10 | Month 11 | Month 12 | ||
| Assistant Manager | 0% | $2,700 | $2,700 | $2,700 | $2,700 | $2,700 | $2,700 | $2,700 | $2,700 | $2,700 | $2,700 | $2,700 | $2,700 |
| Store Manager | 0% | $3,700 | $3,700 | $3,700 | $3,700 | $3,700 | $3,700 | $3,700 | $3,700 | $3,700 | $3,700 | $3,700 | $3,700 |
| Student Help (PT) | 0% | $1,360 | $1,360 | $1,360 | $1,360 | $1,360 | $1,360 | $1,360 | $1,360 | $1,360 | $1,360 | $1,360 | $1,360 |
| Student Help (PT) | 0% | $1,360 | $1,360 | $1,360 | $1,360 | $1,360 | $1,360 | $1,360 | $1,360 | $1,360 | $1,360 | $1,360 | $1,360 |
| Student Help (PT) | 0% | $1,360 | $1,360 | $1,360 | $1,360 | $1,360 | $1,360 | $1,360 | $1,360 | $1,360 | $1,360 | $1,360 | $1,360 |
| Student Help (PT) | 0% | $1,360 | $1,360 | $1,360 | $1,360 | $1,360 | $1,360 | $1,360 | $1,360 | $1,360 | $1,360 | $1,360 | $1,360 |
| Student Help (PT) | 0% | $1,360 | $1,360 | $1,360 | $1,360 | $1,360 | $1,360 | $1,360 | $1,360 | $1,360 | $1,360 | $1,360 | $1,360 |
| Total People | 7 | 7 | 7 | 7 | 7 | 7 | 7 | 7 | 7 | 7 | 7 | 7 | |
| Total Payroll | $13,200 | $13,200 | $13,200 | $13,200 | $13,200 | $13,200 | $13,200 | $13,200 | $13,200 | $13,200 | $13,200 | $13,200 | |
| General Assumptions | |||||||||||||
| Month 1 | Month 2 | Month 3 | Month 4 | Month 5 | Month 6 | Month 7 | Month 8 | Month 9 | Month 10 | Month 11 | Month 12 | ||
| Plan Month | 1 | 2 | 3 | 4 | 5 | 6 | 7 | 8 | 9 | 10 | 11 | 12 | |
| Current Interest Rate | 8.40% | 8.40% | 8.40% | 8.40% | 8.40% | 8.40% | 8.40% | 8.40% | 8.40% | 8.40% | 8.40% | 8.40% | |
| Long-term Interest Rate | 7.00% | 7.00% | 7.00% | 7.00% | 7.00% | 7.00% | 7.00% | 7.00% | 7.00% | 7.00% | 7.00% | 7.00% | |
| Tax Rate | 30.00% | 37.60% | 37.60% | 37.60% | 37.60% | 37.60% | 37.60% | 37.60% | 37.60% | 37.60% | 37.60% | 37.60% | |
| Other | 0 | 0 | 0 | 0 | 0 | 0 | 0 | 0 | 0 | 0 | 0 | 0 | |
| Pro Forma Profit and Loss | |||||||||||||
| Month 1 | Month 2 | Month 3 | Month 4 | Month 5 | Month 6 | Month 7 | Month 8 | Month 9 | Month 10 | Month 11 | Month 12 | ||
| Sales | $110,471 | $111,576 | $112,691 | $113,818 | $114,956 | $116,106 | $117,267 | $118,440 | $119,624 | $120,821 | $122,028 | $123,249 | |
| Direct Cost of Sales | $38,679 | $39,066 | $39,456 | $39,851 | $40,249 | $40,652 | $41,058 | $41,469 | $41,884 | $42,303 | $42,725 | $43,153 | |
| Franchisor Royalty (7%) | $7,733 | $7,810 | $7,888 | $7,967 | $8,047 | $8,127 | $8,209 | $8,291 | $8,374 | $8,457 | $8,542 | $8,627 | |
| Total Cost of Sales | $46,412 | $46,876 | $47,345 | $47,818 | $48,296 | $48,779 | $49,267 | $49,760 | $50,257 | $50,760 | $51,267 | $51,780 | |
| Gross Margin | $64,059 | $64,700 | $65,347 | $66,000 | $66,660 | $67,327 | $68,000 | $68,680 | $69,367 | $70,061 | $70,761 | $71,469 | |
| Gross Margin % | 57.99% | 57.99% | 57.99% | 57.99% | 57.99% | 57.99% | 57.99% | 57.99% | 57.99% | 57.99% | 57.99% | 57.99% | |
| Expenses | |||||||||||||
| Payroll | $13,200 | $13,200 | $13,200 | $13,200 | $13,200 | $13,200 | $13,200 | $13,200 | $13,200 | $13,200 | $13,200 | $13,200 | |
| Sales and Marketing and Other Expenses | $5,605 | $5,641 | $5,677 | $5,714 | $5,751 | $5,788 | $5,826 | $5,864 | $5,903 | $5,942 | $5,981 | $6,021 | |
| Depreciation | $379 | $379 | $379 | $379 | $379 | $379 | $379 | $379 | $379 | $379 | $379 | $379 | |
| Depreciation | $5,000 | $5,000 | $5,000 | $5,000 | $5,000 | $5,000 | $5,000 | $5,000 | $5,000 | $5,000 | $5,000 | $5,000 | |
| Depreciation | $600 | $600 | $600 | $600 | $600 | $600 | $600 | $600 | $600 | $600 | $600 | $600 | |
| Insurance | $100 | $100 | $100 | $100 | $100 | $100 | $100 | $100 | $100 | $100 | $100 | $100 | |
| Cleaning Service | $300 | $300 | $300 | $300 | $300 | $300 | $300 | $300 | $300 | $300 | $300 | $300 | |
| Cell Phone Service | $350 | $350 | $350 | $350 | $350 | $350 | $350 | $350 | $350 | $350 | $350 | $350 | |
| Legal | $200 | $200 | $200 | $200 | $200 | $200 | $200 | $200 | $200 | $200 | $200 | $200 | |
| Payroll Taxes | 8% | $1,056 | $1,056 | $1,056 | $1,056 | $1,056 | $1,056 | $1,056 | $1,056 | $1,056 | $1,056 | $1,056 | $1,056 |
| Other | $0 | $0 | $0 | $0 | $0 | $0 | $0 | $0 | $0 | $0 | $0 | $0 | |
| Total Operating Expenses | $26,790 | $26,826 | $26,862 | $26,899 | $26,936 | $26,973 | $27,011 | $27,049 | $27,088 | $27,127 | $27,166 | $27,206 | |
| Profit Before Interest and Taxes | $37,269 | $37,874 | $38,484 | $39,101 | $39,724 | $40,353 | $40,989 | $41,631 | $42,279 | $42,934 | $43,595 | $44,263 | |
| EBITDA | $37,648 | $38,253 | $38,863 | $39,480 | $40,103 | $40,732 | $41,368 | $42,010 | $42,658 | $43,313 | $43,974 | $44,642 | |
| Interest Expense | $1,605 | $1,588 | $1,571 | $1,555 | $1,538 | $1,521 | $1,505 | $1,488 | $1,471 | $1,454 | $1,438 | $1,421 | |
| Taxes Incurred | $10,699 | $13,643 | $13,879 | $14,117 | $14,358 | $14,601 | $14,846 | $15,094 | $15,344 | $15,596 | $15,851 | $16,109 | |
| Net Profit | $24,965 | $22,642 | $23,034 | $23,429 | $23,828 | $24,231 | $24,638 | $25,049 | $25,464 | $25,883 | $26,306 | $26,734 | |
| Net Profit/Sales | 22.60% | 20.29% | 20.44% | 20.58% | 20.73% | 20.87% | 21.01% | 21.15% | 21.29% | 21.42% | 21.56% | 21.69% | |
| Pro Forma Cash Flow | |||||||||||||
| Month 1 | Month 2 | Month 3 | Month 4 | Month 5 | Month 6 | Month 7 | Month 8 | Month 9 | Month 10 | Month 11 | Month 12 | ||
| Cash Received | |||||||||||||
| Cash from Operations | |||||||||||||
| Cash Sales | $110,471 | $111,576 | $112,691 | $113,818 | $114,956 | $116,106 | $117,267 | $118,440 | $119,624 | $120,821 | $122,028 | $123,249 | |
| Subtotal Cash from Operations | $110,471 | $111,576 | $112,691 | $113,818 | $114,956 | $116,106 | $117,267 | $118,440 | $119,624 | $120,821 | $122,028 | $123,249 | |
| Additional Cash Received | |||||||||||||
| Sales Tax, VAT, HST/GST Received | 0.00% | $0 | $0 | $0 | $0 | $0 | $0 | $0 | $0 | $0 | $0 | $0 | $0 |
| New Current Borrowing | $0 | $0 | $0 | $0 | $0 | $0 | $0 | $0 | $0 | $0 | $0 | $0 | |
| New Other Liabilities (interest-free) | $0 | $0 | $0 | $0 | $0 | $0 | $0 | $0 | $0 | $0 | $0 | $0 | |
| New Long-term Liabilities | $0 | $0 | $0 | $0 | $0 | $0 | $0 | $0 | $0 | $0 | $0 | $0 | |
| Sales of Other Current Assets | $0 | $0 | $0 | $0 | $0 | $0 | $0 | $0 | $0 | $0 | $0 | $0 | |
| Sales of Long-term Assets | $0 | $0 | $0 | $0 | $0 | $0 | $0 | $0 | $0 | $0 | $0 | $0 | |
| New Investment Received | $0 | $0 | $0 | $0 | $0 | $0 | $0 | $0 | $0 | $0 | $0 | $0 | |
| Subtotal Cash Received | $110,471 | $111,576 | $112,691 | $113,818 | $114,956 | $116,106 | $117,267 | $118,440 | $119,624 | $120,821 | $122,028 | $123,249 | |
| Expenditures | Month 1 | Month 2 | Month 3 | Month 4 | Month 5 | Month 6 | Month 7 | Month 8 | Month 9 | Month 10 | Month 11 | Month 12 | |
| Expenditures from Operations | |||||||||||||
| Cash Spending | $13,200 | $13,200 | $13,200 | $13,200 | $13,200 | $13,200 | $13,200 | $13,200 | $13,200 | $13,200 | $13,200 | $13,200 | |
| Bill Payments | $33,289 | $97,911 | $75,804 | $76,533 | $77,269 | $78,012 | $78,764 | $79,523 | $80,290 | $81,063 | $81,846 | $82,635 | |
| Subtotal Spent on Operations | $46,489 | $111,111 | $89,004 | $89,733 | $90,469 | $91,212 | $91,964 | $92,723 | $93,490 | $94,263 | $95,046 | $95,835 | |
| Additional Cash Spent | |||||||||||||
| Sales Tax, VAT, HST/GST Paid Out | $0 | $0 | $0 | $0 | $0 | $0 | $0 | $0 | $0 | $0 | $0 | $0 | |
| Principal Repayment of Current Borrowing | $1,000 | $1,000 | $1,000 | $1,000 | $1,000 | $1,000 | $1,000 | $1,000 | $1,000 | $1,000 | $1,000 | $1,000 | |
| Other Liabilities Principal Repayment | $1,332 | $1,332 | $1,332 | $1,332 | $1,332 | $1,332 | $1,332 | $1,332 | $1,332 | $1,332 | $1,332 | $1,328 | |
| Long-term Liabilities Principal Repayment | $1,667 | $1,667 | $1,667 | $1,667 | $1,667 | $1,667 | $1,667 | $1,667 | $1,667 | $1,667 | $1,667 | $1,667 | |
| Purchase Other Current Assets | $0 | $0 | $0 | $0 | $0 | $0 | $0 | $0 | $0 | $0 | $0 | $0 | |
| Purchase Long-term Assets | $35,000 | $0 | $0 | $0 | $0 | $0 | $0 | $0 | $0 | $0 | $0 | $0 | |
| Dividends | $1,000 | $1,000 | $15,000 | $15,000 | $15,000 | $15,000 | $15,000 | $25,000 | $25,000 | $25,000 | $25,000 | $25,000 | |
| Subtotal Cash Spent | $86,488 | $116,110 | $108,003 | $108,732 | $109,468 | $110,211 | $110,963 | $121,722 | $122,489 | $123,262 | $124,045 | $124,830 | |
| Net Cash Flow | $23,983 | ($4,534) | $4,688 | $5,087 | $5,488 | $5,895 | $6,304 | ($3,281) | ($2,865) | ($2,441) | ($2,017) | ($1,580) | |
| Cash Balance | $43,683 | $39,149 | $43,837 | $48,923 | $54,411 | $60,306 | $66,610 | $63,328 | $60,464 | $58,023 | $56,006 | $54,426 | |
| Pro Forma Balance Sheet | |||||||||||||
| Month 1 | Month 2 | Month 3 | Month 4 | Month 5 | Month 6 | Month 7 | Month 8 | Month 9 | Month 10 | Month 11 | Month 12 | ||
| Assets | Starting Balances | ||||||||||||
| Current Assets | |||||||||||||
| Cash | $19,700 | $43,683 | $39,149 | $43,837 | $48,923 | $54,411 | $60,306 | $66,610 | $63,328 | $60,464 | $58,023 | $56,006 | $54,426 |
| Inventory | $15,800 | $42,547 | $42,972 | $43,402 | $43,836 | $44,274 | $44,717 | $45,164 | $45,616 | $46,072 | $46,533 | $46,998 | $47,468 |
| Other Current Assets | $4,000 | $4,000 | $4,000 | $4,000 | $4,000 | $4,000 | $4,000 | $4,000 | $4,000 | $4,000 | $4,000 | $4,000 | $4,000 |
| Total Current Assets | $39,500 | $90,230 | $86,121 | $91,238 | $96,759 | $102,685 | $109,023 | $115,774 | $112,944 | $110,536 | $108,556 | $107,004 | $105,894 |
| Long-term Assets | |||||||||||||
| Long-term Assets | $205,000 | $240,000 | $240,000 | $240,000 | $240,000 | $240,000 | $240,000 | $240,000 | $240,000 | $240,000 | $240,000 | $240,000 | $240,000 |
| Accumulated Depreciation | $0 | $379 | $758 | $1,137 | $1,516 | $1,895 | $2,274 | $2,653 | $3,032 | $3,411 | $3,790 | $4,169 | $4,548 |
| Total Long-term Assets | $205,000 | $239,621 | $239,242 | $238,863 | $238,484 | $238,105 | $237,726 | $237,347 | $236,968 | $236,589 | $236,210 | $235,831 | $235,452 |
| Total Assets | $244,500 | $329,851 | $325,363 | $330,101 | $335,243 | $340,790 | $346,749 | $353,121 | $349,912 | $347,125 | $344,766 | $342,835 | $341,346 |
| Liabilities and Capital | Month 1 | Month 2 | Month 3 | Month 4 | Month 5 | Month 6 | Month 7 | Month 8 | Month 9 | Month 10 | Month 11 | Month 12 | |
| Current Liabilities | |||||||||||||
| Accounts Payable | $30,000 | $95,385 | $73,254 | $73,958 | $74,670 | $75,388 | $76,114 | $76,847 | $77,588 | $78,335 | $79,092 | $79,855 | $80,627 |
| Current Borrowing | $65,000 | $64,000 | $63,000 | $62,000 | $61,000 | $60,000 | $59,000 | $58,000 | $57,000 | $56,000 | $55,000 | $54,000 | $53,000 |
| Other Current Liabilities | $15,980 | $14,648 | $13,316 | $11,984 | $10,652 | $9,320 | $7,988 | $6,656 | $5,324 | $3,992 | $2,660 | $1,328 | $0 |
| Subtotal Current Liabilities | $110,980 | $174,033 | $149,570 | $147,942 | $146,322 | $144,708 | $143,102 | $141,503 | $139,912 | $138,327 | $136,752 | $135,183 | $133,627 |
| Long-term Liabilities | $200,000 | $198,333 | $196,666 | $194,999 | $193,332 | $191,665 | $189,998 | $188,331 | $186,664 | $184,997 | $183,330 | $181,663 | $179,996 |
| Total Liabilities | $310,980 | $372,366 | $346,236 | $342,941 | $339,654 | $336,373 | $333,100 | $329,834 | $326,576 | $323,324 | $320,082 | $316,846 | $313,623 |
| Paid-in Capital | $30,000 | $30,000 | $30,000 | $30,000 | $30,000 | $30,000 | $30,000 | $30,000 | $30,000 | $30,000 | $30,000 | $30,000 | $30,000 |
| Retained Earnings | ($96,480) | ($97,480) | ($98,480) | ($113,480) | ($128,480) | ($143,480) | ($158,480) | ($173,480) | ($198,480) | ($223,480) | ($248,480) | ($273,480) | ($298,480) |
| Earnings | $0 | $24,965 | $47,607 | $70,640 | $94,069 | $117,897 | $142,129 | $166,767 | $191,816 | $217,280 | $243,163 | $269,469 | $296,203 |
| Total Capital | ($66,480) | ($42,515) | ($20,873) | ($12,840) | ($4,411) | $4,417 | $13,649 | $23,287 | $23,336 | $23,800 | $24,683 | $25,989 | $27,723 |
| Total Liabilities and Capital | $244,500 | $329,851 | $325,363 | $330,101 | $335,243 | $340,790 | $346,749 | $353,121 | $349,912 | $347,125 | $344,766 | $342,835 | $341,346 |
| Net Worth | ($66,480) | ($42,515) | ($20,873) | ($12,840) | ($4,411) | $4,417 | $13,649 | $23,287 | $23,336 | $23,800 | $24,683 | $25,989 | $27,723 |


