
Concrete Fabricators
Executive Summary
Concrete Fabricators is a company that provides services for concrete fabrication, utilizing formwork, laying foundations, concrete placement, and excavation. The company has worked on several projects in the Norman and Southwestern Oklahoma areas, and plans to bid on contracts for commercial concrete projects at all levels throughout the state.
The company plans to develop into the leading formwork-services provider for reinforced concrete in the state. This means always having the best and most efficient facilities, processes, and people. To achieve this, Concrete Fabricators will invest in ways that will pay off in competitive advantages for its customers, such as structural plan review, including pre-job conferencing upon request, equipment, and a full line of forming, reinforcing, and aftermarket products. The company has developed a client evaluation form to gather feedback from our clients. The ultimate goal is to meet these needs and better the company.
The biggest concern within the concrete work industry is the health and safety of its employees. Concrete Fabricators has made safety its number one concern; our employees and our customers expect to be safe on the job. The company has recognized the need to keep taking steps to develop a comprehensive infrastructure designed to make us not just a company with a safety policy, but a “safe company.”
Concrete fabricators participates in the concrete work industry. This includes special trade contractors primarily engaged in concrete work, including portland cement and asphalt. Companies in this industry generated total annual sales of approximately $21 million, with an average sales per establishment of $.7 million. Establishments that are primarily engaged in manufacturing portland cement concrete generated sales of approximately $19 million, with an average sales per establishment of $6.5 million.

1.1 Mission
The mission of Concrete Fabricators is to become the leading contractor by providing the best quality cement and concrete masonry work.
Company Summary
Concrete Fabricators was founded in January, 1987. The company was formed by Mr. Lloyd James and Mrs. Anne James; and is an Oklahoma sole proprietorship with principal offices located in Norman, Oklahoma.

| Past Performance | |||
| 1997 | 1998 | 1999 | |
| Sales | $95,248 | $136,069 | $194,384 |
| Gross Margin | $87,342 | $127,224 | $185,248 |
| Gross Margin % | 91.70% | 93.50% | 95.30% |
| Operating Expenses | $7,000 | $10,500 | $14,000 |
| Collection Period (days) | 0 | 0 | 0 |
| Balance Sheet | |||
| 1997 | 1998 | 1999 | |
| Current Assets | |||
| Cash | $21,120 | $30,222 | $45,308 |
| Accounts Receivable | $11,430 | $16,328 | $23,326 |
| Other Current Assets | $7,867 | $8,345 | $8,830 |
| Total Current Assets | $40,417 | $54,895 | $77,464 |
| Long-term Assets | |||
| Long-term Assets | $439,098 | $472,149 | $507,687 |
| Accumulated Depreciation | $39,518 | $42,493 | $45,691 |
| Total Long-term Assets | $399,580 | $429,656 | $461,996 |
| Total Assets | $439,997 | $484,551 | $539,460 |
| Current Liabilities | |||
| Accounts Payable | $23,812 | $34,017 | $40,596 |
| Current Borrowing | $0 | $0 | $0 |
| Other Current Liabilities (interest free) | $19,707 | $21,190 | $22,785 |
| Total Current Liabilities | $43,519 | $55,207 | $63,381 |
| Long-term Liabilities | $15,689 | $16,700 | $17,766 |
| Total Liabilities | $59,208 | $71,907 | $81,147 |
| Paid-in Capital | $0 | $0 | $0 |
| Retained Earnings | $380,789 | $412,644 | $458,313 |
| Earnings | $0 | $0 | $0 |
| Total Capital | $380,789 | $412,644 | $458,313 |
| Total Capital and Liabilities | $439,997 | $484,551 | $539,460 |
| Other Inputs | |||
| Payment Days | 0 | 0 | 0 |
| Sales on Credit | $0 | $0 | $0 |
| Receivables Turnover | 0.00 | 0.00 | 0.00 |
Products
Background
Concrete Fabricators provides concrete fabrication, to include foundations (commercial and residential), road construction, and excavation (dirt work). The company also creates house slabs and driveways for residentials, trailer path foundations, and other roadwork. Jobs are solicited through bids from both business and personal ventures. We provide services to both commercial and individual customers. Geographically, the company offers its services to southwest Oklahoma and southeast Texas.
The Concrete Fabricators system can be adapted to almost any construction requirement that calls for forming and foundation work. The company’s expert staff has the capability to design and manufacture any custom component or accessory item that may be required to complete the formwork and foundation package.
3.1 Product Description
Concrete Fabricators’ formworks and foundations offer major advances and complete adaptability, high strength-to-weight ratio, and all at cost-effective prices. Accident prevention is the cornerstone of Concrete Fabricators’ safety commitment. The company strives to eliminate foreseeable hazards which could result in personal injury or illness. Concrete Fabricators focuses on health and safety, and neither will be compromised for cost or convenience. The company operates in two market segments as described below.
Commercial
- Foundations. Concrete Fabricators has the ability to safely erect any structure on a properly-built foundation.
- Parking Lots. Concrete is the superior paving material for parking lot projects. Whether it is a new parking area, or one in need of reconstruction, concrete offers the durability and beauty that asphalt just can’t match. Concrete’s advantages include:
- Durability. Concrete lasts longer than asphalt. A concrete parking area can serve your project for twenty or more years. The durability advantage means less maintenance, fewer repairs, and an end to the expensive reconstruction cycle.
- Beauty. Concrete’s durability means a surface free from ugly potholes, ruts, and damage from petroleum products. Add some colors or a pattern, and concrete turns a parking lot into the perfect showcase for your business.
- Safety and lighting. Concrete offers a brighter, more reflective surface than asphalt. Better use of light means a safer and more inviting parking area for your customers and employees.
- Load-carrying capacity. Trucks demand a structural pavement. Asphalt is no match for eighteen-wheelers and delivery vehicles. If product distribution is critical to your project, then concrete is your paving partner.
- Parking Garages. Concrete provides the same benefits for a garage as it does for a driveway. A structure made with concrete is strong enough to hold up under the pressure of many vehicles, and is also durable enough to last many years of heavy pressure.
Residential
Residential applications go beyond a solid foundation. Long lasting and low maintenance, concrete increases the value and performance of a very important investment: the home. Strong, durable, and safe, concrete will never burn or rot, and provides the best shelter against any storm. Residential applications are as follows:
- Basement Walls. A concrete basement is the most economical part of a home to build and is the best value for the dollar spent. Concrete basements offer a variety of benefits:
- Extra room for work or play. Consider a game room, den, guest bedroom, or office. Create a space as unique as your own family. Economical full basements can almost double the enclosed living space, at only a fraction of the cost of the home.
- Permanent finished look. Add a dramatic color or texture for a permanent, finished look.
- Extra storage. Storage that frees up other, more expensive floor space in the house and garage.
- Easy access to utilities. Better access to plumbing, heating, and wiring. All can be reached without crawling or breaking up floors.
- Concrete Homes. Concrete homes are energy efficient, resistant to strong winds, practically soundproof, and offer a broad range of design options. Concrete homes offer a variety of benefits over standard construction:
- Fast and easy construction. Using insulating concrete forms results in a faster and more efficient building cycle.
- Versatile and compatible. Stucco, wood siding, vinyl siding, brick, and other traditional exterior finishes can be easily used with insulating concrete forms.
- Environmentally responsible. Concrete and polystyrene foam are inert and can be recycled.
- Energy efficient. Energy savings are built into concrete homes. Many concrete homeowners report savings of more than 40% on their heating/cooling costs.
- Security. Secure concrete houses perform very well in hurricanes and other violent storms.
- No Rot or Rust. Neither concrete nor polystyrene will rot, rust, or corrode.
- Peace and Quiet. A concrete home built with insulating concrete forms has much greater noise reduction characteristics than wood or steel.
- Driveways. A concrete driveway can have a dramatic effect on the first impression, value, and resale potential for a home. Concrete driveways are preferred over other paving materials for a variety of reasons.
- Durability. A key component to the longevity of driveways. Concrete driveways stand up to traffic day in and day out, year after year, often for over 30 years.
- Maintenance. Concrete does not need to be seal coated every year, making its maintenance practically non-existent.
- Environmentally friendly. Cured concrete is an inert material and can be recycled.
- Homeowner satisfaction. Homeowners were surveyed, and of those already owning a concrete driveway, 96% said they would choose concrete again.
- Versatility. This is important, especially in today’s upscale housing market. Concrete can be colored, stamped, or stenciled to create a variety of textures and decorative finishes.
- Appearance. A critical component in selecting a driveway paving material, concrete, with it’s smooth, bright surface, provides an important safety feature by increasing the effectiveness of exterior lighting.

Market Analysis Summary
Target Markets and Market Description (information provided by Standard & Poor’s)
The housing industry has proceeded at a red-hot pace for several years running. An all-time record was set in 1998, when 886,000 new-site, single-family homes were sold. That represented a 10% gain from the robust total of 804,000 homes sold in 1997, and an 8.1% rise from the prior record of 819,000 units in 1977. Single-family housing construction accounted for approximately $48 million of the total $125 million generated in the industry.
Home sales were strengthened even further during the first ten months of 1999. In that period, new single-family home sales increased by 4.8% on a year-to-year basis, to 791,000 units, according to the U.S. Department of Commerce. Through October, 1999, seasonally adjusted sales had exceeded 800,000 on an annualized basis in every month since the start of 1998.
The record-setting string of home sales since the second half of 1997 has forced builders to pick up the pace of their construction activity. During 1998, total starts increased by 9.7% to 1.62 million units. Starts for single family units moved up 12% for the year, and those of multi-family units were ahead by 1.5%. As an indication of building activity at year-end 1999, housing starts in November, 1999 came in at a seasonally-adjusted annual rate of 1.6 million units.
4.1 Market Segmentation
Market size statistics–Single-family housing construction
General contractors primarily engaged in construction (including new work additions, alterations, remodeling, and repair) of single-family houses:
| Estimated number of U.S. establishments | 218,276 |
| Number of people employed in this industry | 831,158 |
| Total annual sales in this industry | $125 million |
| Average employees per establishment | 4 |
| Average sales per establishment | $.6 million |
Market size statistics–Residential construction, nec
General contractors primarily engaged in construction (including new work additions, alterations, remodeling, and repair) of residential buildings other than single-family houses. This includes hotels, motels, apartments, and multi-family homes:
| Estimated number of U.S. establishments | 25,201 |
| Number of people employed in this industry | 114,523 |
| Total annual sales in this industry | $26 million |
| Average employees per establishment | 5 |
| Average sales per establishment | $1.1 million |
Market size statistics–Heavy construction, nec
General and special trade contractors primarily engaged in the construction of heavy projects not elsewhere classified. This includes canal, drainage system, athletic and recreation facilities, land preparation, rock removal, waste, water and sewage treatment plants, and trenching construction:
| Estimated number of U.S. establishments | 16,914 |
| Number of people employed in this industry | 211,440 |
| Total annual sales in this industry | $51 million |
| Average employees per establishment | 13 |
| Average sales per establishment | $3.2 million |
Market size statistics–Bridge, tunnel, and elevated highway construction
General contractors primarily engaged in the construction of bridges, viaducts, elevated highways, and highway, pedestrian and railway tunnels:
| Estimated number of U.S. establishments | 1,414 |
| Number of people employed in this industry | 43,899 |
| Total annual sales in this industry | $14 million |
| Average employees per establishment | 34 |
| Average sales per establishment | $13 million |
Market size statistics–Highway and street construction
General and special trade contractors primarily engaged in the construction of roads, streets, alleys, public sidewalks, guardrails, parkways, and airports:
| Estimated number of U.S. establishments | 19,694 |
| Number of people employed in this industry | 302,944 |
| Total annual sales in this industry | $66 million |
| Average employees per establishment | 16 |
| Average sales per establishment | $3.8 million |
Market size statistics–Nonresidential construction, nec
General contractors primarily engaged in the construction (including new work additions, alterations, remodeling, and repair) of nonresidential buildings other than industrial buildings and warehouses. This includes commercial, institutional, religious, and amusement and recreational buildings:
| Estimated number of U.S. establishments | 44,505 |
| Number of people employed in this industry | 540,550 |
| Total annual sales in this industry | $205 million |
| Average employees per establishment | 12 |
| Average sales per establishment | $5 million |

| Market Analysis | |||||||
| 2000 | 2001 | 2002 | 2003 | 2004 | |||
| Potential Customers | Growth | CAGR | |||||
| Single Family Housing | 4% | 1,094,541 | 1,132,850 | 1,172,500 | 1,213,528 | 1,256,012 | 3.50% |
| Other Residential Housing | 3% | 670,848 | 687,619 | 704,809 | 722,429 | 740,490 | 2.50% |
| Commercial Construction | 2% | 82,623 | 84,275 | 85,961 | 87,680 | 89,434 | 2.00% |
| Total | 3.07% | 1,848,012 | 1,904,744 | 1,963,270 | 2,023,637 | 2,085,936 | 3.07% |
4.2 Target Market Segment Strategy
The Market Analysis table and chart represent the estimated number of single-family homes, other residential units, and commercial buildings within the state of Oklahoma. This information is derived from estimates given by the U.S. Census Bureau and represents the total number of possible clients within the local reach of Concrete Fabricators.
4.3 Industry Analysis
Market Size Statistics–Concrete work
Special trade contractors primarily engaged in concrete work, including portland cement and asphalt.
| Estimated number of U.S. establishments | 30,214 |
| Number of people employed in this industry | 230,338 |
| Total annual sales in this industry | $21 million |
| Average employees per establishment | 8 |
| Average sales per establishment | $.7 million |
Establishments primarily engaged in manufacturing portland cement concrete, manufactured and delivered to a purchaser in a plastic and unhardened steel.
| Estimated number of U.S. establishments | 5,798 |
| Number of people employed in this industry | 89,662 |
| Total annual sales in this industry | $19 million |
| Average employees per establishment | 17 |
| Average sales per establishment | $7 million |
4.4 Competition and Buying Patterns
Competition
Competitive threats come from other concrete fabrication companies in the area. Specifically, competitors include Jones Construction, James Boyd Construction, Jerry Manuel Construction, Quality Construction, and Charles Johnson, Inc.
Strategy and Implementation Summary
The company’s overall strategy is based on a continuous improvement process of setting objectives, measuring results, and providing feedback to facilitate further growth and progress. Included are detailed quarterly and annual reporting and crisis management plans for medical, product, and natural disaster emergencies.
**Note: Report has been removed from this sample plan for confidentiality.
The company plans to rapidly develop marketing alliances with industry leaders and pursue new sales of its services to residential and commercial builders. The market strategy is to capitalize on Concrete Fabricators’ alliances by securing city, parish, state, and government contracts.
Concrete Fabricators is committed to ensuring that the products used on its customers’ job sites are safe and approved by the Occupational Safety and Health Administration (OSHA). Along with its clients, the company believes in a health and safety initiative that is all pervasive, managing any potential loss in the work environment.
Concrete Fabricators has adopted a corporate strategy that is dedicated to improving the performance of activities on the critical path of its customers’ projects. The company does this by building on its core strengths, innovative equipment, design engineering expertise, and project and site management, within an environment of safety excellence.
From the customers’ point of view, this strategy translates into these benefits:
- Reduction of set-up time for trades.
- Increased site safety.
- Project cost reduction.
- Quality construction practices.
- Resolve punch list immediately after concrete placement.
- Review of structural plans.
5.1 Marketing Strategy
Marketing Strategy and Plan. The overall marketing plan for Concrete Fabricator’s service is based on the following fundamentals:
- Segmentation of the market(s) planned to reach.
- Distribution channels planned to reach market segments: television, radio, sales associates, and mailings.
- Share of the market expected to capture over a fixed period of time.
Market Responsibilities. Concrete Fabricators is committed to an extensive promotional campaign. This is done aggressively and on a broad scale. To accomplish initial sales goals, the company has implemented an effective promotional campaign to accomplish two primary objectives:
- Attract a quality work force that has a desire to be successful.
- Attract customers who will constantly look to Concrete Fabricators for their construction projects.
In addition, Concrete Fabricators advertises in the yellow pages, newspapers, radio, and on billboards throughout the state.
Promotion. In addition to standard advertisement practices, Concrete Fabricators gains considerable recognition through these additional promotional mediums:
- Caps and T-shirts.
- Signs located strategically throughout the state.
- Word of mouth from satisfied customers.
Incentives. As an extra incentive for customers (and potential customers) to remember the name, Concrete Fabricators plans to distribute coffee mugs, T-shirts, pens, and other advertising specialties with the company logo. This will be an ongoing program for the company, when appropriate and where it is identified as beneficial.
Brochures. The objective of brochures is to portray Concrete Fabricators’ goals and products as an attractive functionality. It is also to show customers how to use the latest in technology as it relates to construction and building services.
Investment in Advertising and Promotion. Concrete Fabricators hopes to allocate ten percent of revenues for the ongoing, state-wide advertising campaign.
5.2 Value Proposition
The company plans to become the leading provider of formwork and foundation services in the area. This means always having the best and most efficient facilities, processes, and people. To achieve this, Concrete Fabricators is investing in many ways that will pay off in competitive advantages for its customers, for example:
- Review of structural drawings. The company eliminates possible structural problems and delays.
- Pre-job conferencing upon request. The company thoroughly understands the construction business and the science of formwork and laying foundations. Recommendations are made, and customers are alerted when things could be done better. A partnership is based on trust and includes planning and teamwork.
- Delivery. Material placement is of cardinal concern to the company. Concrete Fabricators constantly upgrades and rotates its vehicles to maximize efficiency on the job.
- Forming, reinforcing, and aftermarket products. One of the things the company does for its customers is to help streamline the ordering process. Concrete Fabricators offers a large variety of concrete forming and foundation materials.
5.3 Sales Strategy
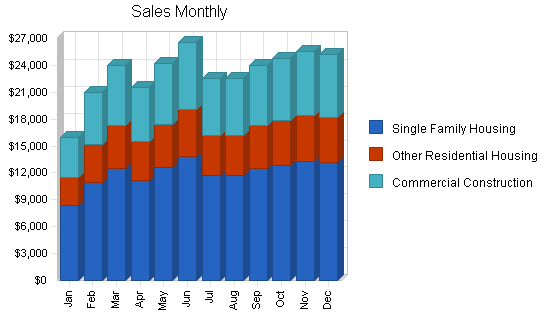
The following chart and table show our estimated sales forecast for this plan.
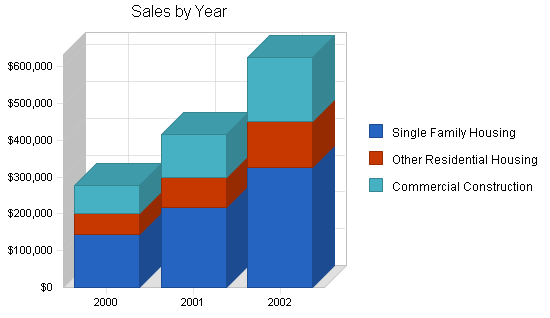
| Sales Forecast | |||
| 2000 | 2001 | 2002 | |
| Sales | |||
| Single Family Housing | $144,399 | $216,600 | $324,900 |
| Other Residential Housing | $55,538 | $83,308 | $124,961 |
| Commercial Construction | $77,755 | $116,631 | $174,946 |
| Total Sales | $277,692 | $416,539 | $624,807 |
| Direct Cost of Sales | 2000 | 2001 | 2002 |
| Single Family Housing | $5,200 | $10,400 | $20,800 |
| Other Residential Housing | $2,000 | $4,000 | $8,000 |
| Commercial Construction | $2,800 | $5,600 | $11,200 |
| Subtotal Direct Cost of Sales | $10,000 | $20,000 | $40,000 |
Management Summary
The company’s management philosophy is based on responsibility and mutual respect. Concrete Fabricators maintains an environment and structure that encourages productivity and respect for customers and fellow employees.
Concrete Fabricators’ employees and management are committed to:
- Providing a safe work environment to protect employees, the employees of customers and subcontractors, and the public.
- Supplying safe products for customers.
- Continuously improving the company’s safety program to reduce the risk of accidents and occupational illness in a changing work environment.
- Encouraging employees to participate in accident prevention programs, and take personal responsibility for their, and their co-workers’, health and safety.
- Employing properly trained personnel, equipment, and procedures necessary to enable regulatory compliance, and contribute to the high safety standards for our industry.
- Monitoring workplaces, enforcing safe work practices, and communicating the company’s safety performance to employees and other stakeholders.
- Making safety a value-added service that the company provides to its customers.
6.1 Management Team
Concrete Fabricators’ management is highly experienced and qualified. Its key management team includes Mr. Lloyd James, Mrs. Anne James, and Mr. Sam McDonald. Mr. James acts as general manager, construction consultant, and occasionally as a site manager. Mrs. James carries out office management duties and Mr. McDonald acts as the primary on-site manager.
6.2 Personnel Plan
The following table shows the Personnel Plan, with salaries, raises and additional employees.
| Personnel Plan | |||
| 2000 | 2001 | 2002 | |
| Lloyd James | $28,800 | $30,240 | $31,752 |
| Anne James | $18,000 | $18,900 | $19,845 |
| Sam McDonald | $26,400 | $27,720 | $29,106 |
| Cement Layer No. 1 | $22,104 | $23,209 | $24,370 |
| Cement Layer No. 2 | $22,104 | $23,209 | $24,370 |
| Cement Layer No. 3 | $22,104 | $23,209 | $24,370 |
| Part time Cement Layer No.4 | $0 | $5,688 | $12,000 |
| Part time Cement Layer No. 5 | $0 | $0 | $5,688 |
| Total People | 6 | 7 | 8 |
| Total Payroll | $139,512 | $152,176 | $171,500 |
Financial Plan
Summary of three-year financial projections
Financial projections are based on sales volume at the levels described in the revenue section; it presents, to the best of management’s knowledge and belief, the company’s expected assets, liabilities, capital, revenues, and expenses. Further, the projections reflect management’s judgement of the expected conditions and its expected course of action, given the hypothetical assumptions.
Financial notes and assumptions
- Revenues will be derived from sales of services for the installation of reinforced-concrete utilizing formwork, reinforcing steel, embedded items, concrete placement, and engineering. Concrete Fabricators plans to bid and receive contracts for commercial concrete projects at all levels throughout the state. Management also expects to achieve a small percentage of revenues resulting from consulting services arising out of training.
- Annual Growth The company expects annual growth to increase by 110%, on the basis that the company will be stepping up its sales efforts, as well as initiating new partnerships and alliances that will foster growth and extensions of our existing markets. These strategies are designed to build momentum and critical mass within the company and its overall sales results.
- Cost of Goods Concrete Fabricators expects that its services will bear a reasonably high markup, which translates to a relatively low cost of goods. Cost of goods includes consideration for cost of equipment, cost of products, bank charges due to credit card transactions (not passed along to the consumer), and labor.
- Operating Expenses Concrete Fabricators groups sales and marketing expenses, and general and administrative expense items under this category.
7.1 Break-even Analysis
The Break-even Analysis chart and table show that if the costs stay at the current, or relatively stable, level we will be able to make an increased profit by the second year.

| Break-even Analysis | |
| Monthly Revenue Break-even | $23,465 |
| Assumptions: | |
| Average Percent Variable Cost | 4% |
| Estimated Monthly Fixed Cost | $22,620 |
7.2 Projected Profit and Loss
The following table outlines our expected profit and loss for fiscal years 2000-2002.


| Pro Forma Profit and Loss | |||
| 2000 | 2001 | 2002 | |
| Sales | $277,692 | $416,539 | $624,807 |
| Direct Cost of Sales | $10,000 | $20,000 | $40,000 |
| Other | $3,000 | $6,000 | $12,000 |
| Total Cost of Sales | $13,000 | $26,000 | $52,000 |
| Gross Margin | $264,692 | $390,539 | $572,807 |
| Gross Margin % | 95.32% | 93.76% | 91.68% |
| Expenses | |||
| Payroll | $139,512 | $152,176 | $171,500 |
| Sales and Marketing and Other Expenses | $34,344 | $47,610 | $71,010 |
| Depreciation | $47,997 | $50,333 | $52,668 |
| Rent/Mortgage | $12,420 | $12,420 | $12,420 |
| Supplies and Equipment | $9,926 | $19,851 | $39,702 |
| Insurance | $14,459 | $21,688 | $32,533 |
| Services | $2,833 | $2,833 | $2,833 |
| Payroll Taxes | $9,947 | $10,800 | $12,600 |
| Other | $0 | $0 | $0 |
| Total Operating Expenses | $271,437 | $317,711 | $395,266 |
| Profit Before Interest and Taxes | ($6,745) | $72,828 | $177,541 |
| EBITDA | $41,252 | $123,160 | $230,209 |
| Interest Expense | $1,597 | $922 | $288 |
| Taxes Incurred | $0 | $17,977 | $45,052 |
| Net Profit | ($8,342) | $53,930 | $132,201 |
| Net Profit/Sales | -3.00% | 12.95% | 21.16% |
7.3 Projected Cash Flow
The following chart and table show our estimated cash flow for this plan.

| Pro Forma Cash Flow | |||
| 2000 | 2001 | 2002 | |
| Cash Received | |||
| Cash from Operations | |||
| Cash Sales | $69,423 | $104,135 | $156,202 |
| Cash from Receivables | $194,193 | $293,703 | $440,554 |
| Subtotal Cash from Operations | $263,616 | $397,838 | $596,755 |
| Additional Cash Received | |||
| Sales Tax, VAT, HST/GST Received | $0 | $0 | $0 |
| New Current Borrowing | $2,000 | $0 | $0 |
| New Other Liabilities (interest-free) | $0 | $0 | $0 |
| New Long-term Liabilities | $0 | $0 | $0 |
| Sales of Other Current Assets | $0 | $0 | $0 |
| Sales of Long-term Assets | $0 | $0 | $0 |
| New Investment Received | $3,000 | $0 | $0 |
| Subtotal Cash Received | $268,616 | $397,838 | $596,755 |
| Expenditures | 2000 | 2001 | 2002 |
| Expenditures from Operations | |||
| Cash Spending | $139,512 | $152,176 | $171,500 |
| Bill Payments | $131,211 | $154,852 | $259,534 |
| Subtotal Spent on Operations | $270,723 | $307,028 | $431,034 |
| Additional Cash Spent | |||
| Sales Tax, VAT, HST/GST Paid Out | $0 | $0 | $0 |
| Principal Repayment of Current Borrowing | $1,100 | $900 | $0 |
| Other Liabilities Principal Repayment | $6,000 | $6,000 | $6,000 |
| Long-term Liabilities Principal Repayment | $6,000 | $6,000 | $5,766 |
| Purchase Other Current Assets | $0 | $0 | $0 |
| Purchase Long-term Assets | $0 | $0 | $0 |
| Dividends | $0 | $0 | $0 |
| Subtotal Cash Spent | $283,823 | $319,928 | $442,800 |
| Net Cash Flow | ($15,207) | $77,910 | $153,955 |
| Cash Balance | $30,101 | $108,010 | $261,966 |
7.4 Projected Balance Sheet
The following table provides Concrete Fabricator’s projected balance sheets for 2000-2002.
| Pro Forma Balance Sheet | |||
| 2000 | 2001 | 2002 | |
| Assets | |||
| Current Assets | |||
| Cash | $30,101 | $108,010 | $261,966 |
| Accounts Receivable | $37,403 | $56,104 | $84,156 |
| Other Current Assets | $8,830 | $8,830 | $8,830 |
| Total Current Assets | $76,333 | $172,944 | $354,951 |
| Long-term Assets | |||
| Long-term Assets | $507,687 | $507,687 | $507,687 |
| Accumulated Depreciation | $93,688 | $144,021 | $196,689 |
| Total Long-term Assets | $413,999 | $363,667 | $310,999 |
| Total Assets | $490,332 | $536,611 | $665,950 |
| Liabilities and Capital | 2000 | 2001 | 2002 |
| Current Liabilities | |||
| Accounts Payable | $7,910 | $13,159 | $22,063 |
| Current Borrowing | $900 | $0 | $0 |
| Other Current Liabilities | $16,785 | $10,785 | $4,785 |
| Subtotal Current Liabilities | $25,595 | $23,944 | $26,848 |
| Long-term Liabilities | $11,766 | $5,766 | $0 |
| Total Liabilities | $37,361 | $29,710 | $26,848 |
| Paid-in Capital | $3,000 | $3,000 | $3,000 |
| Retained Earnings | $458,313 | $449,971 | $503,901 |
| Earnings | ($8,342) | $53,930 | $132,201 |
| Total Capital | $452,971 | $506,901 | $639,101 |
| Total Liabilities and Capital | $490,332 | $536,611 | $665,950 |
| Net Worth | $452,971 | $506,901 | $639,101 |
7.5 Business Ratios
The following table includes Industry Profile statistics for the concrete work industry, as determined by the Standard Industrial Classifications (SIC) Index code 1799. These statistics show a comparison of industry standards and the key ratios for this plan.
| Ratio Analysis | ||||
| 2000 | 2001 | 2002 | Industry Profile | |
| Sales Growth | 42.86% | 50.00% | 50.00% | 7.50% |
| Percent of Total Assets | ||||
| Accounts Receivable | 7.63% | 10.46% | 12.64% | 34.20% |
| Other Current Assets | 1.80% | 1.65% | 1.33% | 27.20% |
| Total Current Assets | 15.57% | 32.23% | 53.30% | 67.00% |
| Long-term Assets | 84.43% | 67.77% | 46.70% | 33.00% |
| Total Assets | 100.00% | 100.00% | 100.00% | 100.00% |
| Current Liabilities | 5.22% | 4.46% | 4.03% | 42.20% |
| Long-term Liabilities | 2.40% | 1.07% | 0.00% | 12.30% |
| Total Liabilities | 7.62% | 5.54% | 4.03% | 54.50% |
| Net Worth | 92.38% | 94.46% | 95.97% | 45.50% |
| Percent of Sales | ||||
| Sales | 100.00% | 100.00% | 100.00% | 100.00% |
| Gross Margin | 95.32% | 93.76% | 91.68% | 33.10% |
| Selling, General & Administrative Expenses | 77.24% | 65.33% | 58.70% | 18.10% |
| Advertising Expenses | 2.52% | 3.36% | 4.48% | 0.30% |
| Profit Before Interest and Taxes | -2.43% | 17.48% | 28.42% | 3.20% |
| Main Ratios | ||||
| Current | 2.98 | 7.22 | 13.22 | 1.63 |
| Quick | 2.98 | 7.22 | 13.22 | 1.30 |
| Total Debt to Total Assets | 7.62% | 5.54% | 4.03% | 54.50% |
| Pre-tax Return on Net Worth | -1.84% | 14.19% | 27.73% | 8.60% |
| Pre-tax Return on Assets | -1.70% | 13.40% | 26.62% | 18.80% |
| Additional Ratios | 2000 | 2001 | 2002 | |
| Net Profit Margin | -3.00% | 12.95% | 21.16% | n.a |
| Return on Equity | -1.84% | 10.64% | 20.69% | n.a |
| Activity Ratios | ||||
| Accounts Receivable Turnover | 5.57 | 5.57 | 5.57 | n.a |
| Collection Days | 59 | 55 | 55 | n.a |
| Accounts Payable Turnover | 12.46 | 12.17 | 12.17 | n.a |
| Payment Days | 39 | 24 | 24 | n.a |
| Total Asset Turnover | 0.57 | 0.78 | 0.94 | n.a |
| Debt Ratios | ||||
| Debt to Net Worth | 0.08 | 0.06 | 0.04 | n.a |
| Current Liab. to Liab. | 0.69 | 0.81 | 1.00 | n.a |
| Liquidity Ratios | ||||
| Net Working Capital | $50,738 | $149,000 | $328,103 | n.a |
| Interest Coverage | -4.22 | 79.02 | 615.82 | n.a |
| Additional Ratios | ||||
| Assets to Sales | 1.77 | 1.29 | 1.07 | n.a |
| Current Debt/Total Assets | 5% | 4% | 4% | n.a |
| Acid Test | 1.52 | 4.88 | 10.09 | n.a |
| Sales/Net Worth | 0.61 | 0.82 | 0.98 | n.a |
| Dividend Payout | 0.00 | 0.00 | 0.00 | n.a |
Appendix
| Sales Forecast | |||||||||||||
| Jan | Feb | Mar | Apr | May | Jun | Jul | Aug | Sep | Oct | Nov | Dec | ||
| Sales | |||||||||||||
| Single Family Housing | 0% | $8,320 | $10,920 | $12,480 | $11,180 | $12,610 | $13,790 | $11,700 | $11,700 | $12,455 | $12,870 | $13,260 | $13,114 |
| Other Residential Housing | 0% | $3,200 | $4,200 | $4,800 | $4,300 | $4,850 | $5,304 | $4,500 | $4,500 | $4,790 | $4,950 | $5,100 | $5,044 |
| Commercial Construction | 0% | $4,480 | $5,880 | $6,720 | $6,020 | $6,790 | $7,426 | $6,300 | $6,300 | $6,707 | $6,930 | $7,140 | $7,062 |
| Total Sales | $16,000 | $21,000 | $24,000 | $21,500 | $24,250 | $26,520 | $22,500 | $22,500 | $23,952 | $24,750 | $25,500 | $25,220 | |
| Direct Cost of Sales | Jan | Feb | Mar | Apr | May | Jun | Jul | Aug | Sep | Oct | Nov | Dec | |
| Single Family Housing | $433 | $433 | $433 | $433 | $433 | $433 | $433 | $433 | $433 | $433 | $433 | $433 | |
| Other Residential Housing | $167 | $167 | $167 | $167 | $167 | $167 | $167 | $167 | $167 | $167 | $167 | $167 | |
| Commercial Construction | $233 | $233 | $233 | $233 | $233 | $233 | $233 | $233 | $233 | $233 | $233 | $233 | |
| Subtotal Direct Cost of Sales | $833 | $833 | $833 | $833 | $833 | $833 | $833 | $833 | $833 | $833 | $833 | $833 | |
| Personnel Plan | |||||||||||||
| Jan | Feb | Mar | Apr | May | Jun | Jul | Aug | Sep | Oct | Nov | Dec | ||
| Lloyd James | 0% | $2,400 | $2,400 | $2,400 | $2,400 | $2,400 | $2,400 | $2,400 | $2,400 | $2,400 | $2,400 | $2,400 | $2,400 |
| Anne James | 0% | $1,500 | $1,500 | $1,500 | $1,500 | $1,500 | $1,500 | $1,500 | $1,500 | $1,500 | $1,500 | $1,500 | $1,500 |
| Sam McDonald | 0% | $2,200 | $2,200 | $2,200 | $2,200 | $2,200 | $2,200 | $2,200 | $2,200 | $2,200 | $2,200 | $2,200 | $2,200 |
| Cement Layer No. 1 | 0% | $1,842 | $1,842 | $1,842 | $1,842 | $1,842 | $1,842 | $1,842 | $1,842 | $1,842 | $1,842 | $1,842 | $1,842 |
| Cement Layer No. 2 | 0% | $1,842 | $1,842 | $1,842 | $1,842 | $1,842 | $1,842 | $1,842 | $1,842 | $1,842 | $1,842 | $1,842 | $1,842 |
| Cement Layer No. 3 | 0% | $1,842 | $1,842 | $1,842 | $1,842 | $1,842 | $1,842 | $1,842 | $1,842 | $1,842 | $1,842 | $1,842 | $1,842 |
| Part time Cement Layer No.4 | 0% | $0 | $0 | $0 | $0 | $0 | $0 | $0 | $0 | $0 | $0 | $0 | $0 |
| Part time Cement Layer No. 5 | 0% | $0 | $0 | $0 | $0 | $0 | $0 | $0 | $0 | $0 | $0 | $0 | $0 |
| Total People | 6 | 6 | 6 | 6 | 6 | 6 | 6 | 6 | 6 | 6 | 6 | 6 | |
| Total Payroll | $11,626 | $11,626 | $11,626 | $11,626 | $11,626 | $11,626 | $11,626 | $11,626 | $11,626 | $11,626 | $11,626 | $11,626 | |
| General Assumptions | |||||||||||||
| Jan | Feb | Mar | Apr | May | Jun | Jul | Aug | Sep | Oct | Nov | Dec | ||
| Plan Month | 1 | 2 | 3 | 4 | 5 | 6 | 7 | 8 | 9 | 10 | 11 | 12 | |
| Current Interest Rate | 10.00% | 10.00% | 10.00% | 10.00% | 10.00% | 10.00% | 10.00% | 10.00% | 10.00% | 10.00% | 10.00% | 10.00% | |
| Long-term Interest Rate | 10.00% | 10.00% | 10.00% | 10.00% | 10.00% | 10.00% | 10.00% | 10.00% | 10.00% | 10.00% | 10.00% | 10.00% | |
| Tax Rate | 30.00% | 25.00% | 25.00% | 25.00% | 25.00% | 25.00% | 25.00% | 25.00% | 25.00% | 25.00% | 25.00% | 25.00% | |
| Other | 0 | 0 | 0 | 0 | 0 | 0 | 0 | 0 | 0 | 0 | 0 | 0 | |
| Pro Forma Profit and Loss | |||||||||||||
| Jan | Feb | Mar | Apr | May | Jun | Jul | Aug | Sep | Oct | Nov | Dec | ||
| Sales | $16,000 | $21,000 | $24,000 | $21,500 | $24,250 | $26,520 | $22,500 | $22,500 | $23,952 | $24,750 | $25,500 | $25,220 | |
| Direct Cost of Sales | $833 | $833 | $833 | $833 | $833 | $833 | $833 | $833 | $833 | $833 | $833 | $833 | |
| Other | $250 | $250 | $250 | $250 | $250 | $250 | $250 | $250 | $250 | $250 | $250 | $250 | |
| Total Cost of Sales | $1,083 | $1,083 | $1,083 | $1,083 | $1,083 | $1,083 | $1,083 | $1,083 | $1,083 | $1,083 | $1,083 | $1,083 | |
| Gross Margin | $14,917 | $19,917 | $22,917 | $20,417 | $23,167 | $25,437 | $21,417 | $21,417 | $22,869 | $23,667 | $24,417 | $24,137 | |
| Gross Margin % | 93.23% | 94.84% | 95.49% | 94.96% | 95.53% | 95.92% | 95.19% | 95.19% | 95.48% | 95.62% | 95.75% | 95.70% | |
| Expenses | |||||||||||||
| Payroll | $11,626 | $11,626 | $11,626 | $11,626 | $11,626 | $11,626 | $11,626 | $11,626 | $11,626 | $11,626 | $11,626 | $11,626 | |
| Sales and Marketing and Other Expenses | $2,862 | $2,862 | $2,862 | $2,862 | $2,862 | $2,862 | $2,862 | $2,862 | $2,862 | $2,862 | $2,862 | $2,862 | |
| Depreciation | $4,000 | $4,000 | $4,000 | $4,000 | $4,000 | $4,000 | $4,000 | $4,000 | $4,000 | $4,000 | $4,000 | $4,000 | |
| Rent/Mortgage | $1,035 | $1,035 | $1,035 | $1,035 | $1,035 | $1,035 | $1,035 | $1,035 | $1,035 | $1,035 | $1,035 | $1,035 | |
| Supplies and Equipment | $827 | $827 | $827 | $827 | $827 | $827 | $827 | $827 | $827 | $827 | $827 | $827 | |
| Insurance | $1,205 | $1,205 | $1,205 | $1,205 | $1,205 | $1,205 | $1,205 | $1,205 | $1,205 | $1,205 | $1,205 | $1,205 | |
| Services | $236 | $236 | $236 | $236 | $236 | $236 | $236 | $236 | $236 | $236 | $236 | $236 | |
| Payroll Taxes | 15% | $829 | $829 | $829 | $829 | $829 | $829 | $829 | $829 | $829 | $829 | $829 | $829 |
| Other | $0 | $0 | $0 | $0 | $0 | $0 | $0 | $0 | $0 | $0 | $0 | $0 | |
| Total Operating Expenses | $22,620 | $22,620 | $22,620 | $22,620 | $22,620 | $22,620 | $22,620 | $22,620 | $22,620 | $22,620 | $22,620 | $22,620 | |
| Profit Before Interest and Taxes | ($7,703) | ($2,703) | $297 | ($2,203) | $547 | $2,817 | ($1,203) | ($1,203) | $249 | $1,047 | $1,797 | $1,517 | |
| EBITDA | ($3,703) | $1,297 | $4,297 | $1,797 | $4,547 | $6,817 | $2,797 | $2,797 | $4,249 | $5,047 | $5,797 | $5,517 | |
| Interest Expense | $161 | $156 | $151 | $146 | $141 | $136 | $131 | $126 | $121 | $116 | $111 | $106 | |
| Taxes Incurred | $0 | $0 | $0 | $0 | $0 | $0 | $0 | $0 | $0 | $0 | $0 | $0 | |
| Net Profit | ($7,864) | ($2,859) | $146 | ($2,349) | $406 | $2,681 | ($1,334) | ($1,329) | $128 | $931 | $1,686 | $1,411 | |
| Net Profit/Sales | -49.15% | -13.61% | 0.61% | -10.92% | 1.68% | 10.11% | -5.93% | -5.91% | 0.54% | 3.76% | 6.61% | 5.60% | |
| Pro Forma Cash Flow | |||||||||||||
| Jan | Feb | Mar | Apr | May | Jun | Jul | Aug | Sep | Oct | Nov | Dec | ||
| Cash Received | |||||||||||||
| Cash from Operations | |||||||||||||
| Cash Sales | $4,000 | $5,250 | $6,000 | $5,375 | $6,063 | $6,630 | $5,625 | $5,625 | $5,988 | $6,188 | $6,375 | $6,305 | |
| Cash from Receivables | $11,663 | $12,063 | $12,125 | $15,825 | $17,938 | $16,194 | $18,244 | $19,790 | $16,875 | $16,911 | $17,984 | $18,581 | |
| Subtotal Cash from Operations | $15,663 | $17,313 | $18,125 | $21,200 | $24,000 | $22,824 | $23,869 | $25,415 | $22,863 | $23,099 | $24,359 | $24,886 | |
| Additional Cash Received | |||||||||||||
| Sales Tax, VAT, HST/GST Received | 0.00% | $0 | $0 | $0 | $0 | $0 | $0 | $0 | $0 | $0 | $0 | $0 | $0 |
| New Current Borrowing | $2,000 | $0 | $0 | $0 | $0 | $0 | $0 | $0 | $0 | $0 | $0 | $0 | |
| New Other Liabilities (interest-free) | $0 | $0 | $0 | $0 | $0 | $0 | $0 | $0 | $0 | $0 | $0 | $0 | |
| New Long-term Liabilities | $0 | $0 | $0 | $0 | $0 | $0 | $0 | $0 | $0 | $0 | $0 | $0 | |
| Sales of Other Current Assets | $0 | $0 | $0 | $0 | $0 | $0 | $0 | $0 | $0 | $0 | $0 | $0 | |
| Sales of Long-term Assets | $0 | $0 | $0 | $0 | $0 | $0 | $0 | $0 | $0 | $0 | $0 | $0 | |
| New Investment Received | $3,000 | $0 | $0 | $0 | $0 | $0 | $0 | $0 | $0 | $0 | $0 | $0 | |
| Subtotal Cash Received | $20,663 | $17,313 | $18,125 | $21,200 | $24,000 | $22,824 | $23,869 | $25,415 | $22,863 | $23,099 | $24,359 | $24,886 | |
| Expenditures | Jan | Feb | Mar | Apr | May | Jun | Jul | Aug | Sep | Oct | Nov | Dec | |
| Expenditures from Operations | |||||||||||||
| Cash Spending | $11,626 | $11,626 | $11,626 | $11,626 | $11,626 | $11,626 | $11,626 | $11,626 | $11,626 | $11,626 | $11,626 | $11,626 | |
| Bill Payments | $40,871 | $8,238 | $8,233 | $8,228 | $8,223 | $8,218 | $8,213 | $8,208 | $8,203 | $8,198 | $8,193 | $8,188 | |
| Subtotal Spent on Operations | $52,497 | $19,864 | $19,859 | $19,854 | $19,849 | $19,844 | $19,839 | $19,834 | $19,829 | $19,824 | $19,819 | $19,814 | |
| Additional Cash Spent | |||||||||||||
| Sales Tax, VAT, HST/GST Paid Out | $0 | $0 | $0 | $0 | $0 | $0 | $0 | $0 | $0 | $0 | $0 | $0 | |
| Principal Repayment of Current Borrowing | $0 | $100 | $100 | $100 | $100 | $100 | $100 | $100 | $100 | $100 | $100 | $100 | |
| Other Liabilities Principal Repayment | $500 | $500 | $500 | $500 | $500 | $500 | $500 | $500 | $500 | $500 | $500 | $500 | |
| Long-term Liabilities Principal Repayment | $500 | $500 | $500 | $500 | $500 | $500 | $500 | $500 | $500 | $500 | $500 | $500 | |
| Purchase Other Current Assets | $0 | $0 | $0 | $0 | $0 | $0 | $0 | $0 | $0 | $0 | $0 | $0 | |
| Purchase Long-term Assets | $0 | $0 | $0 | $0 | $0 | $0 | $0 | $0 | $0 | $0 | $0 | $0 | |
| Dividends | $0 | $0 | $0 | $0 | $0 | $0 | $0 | $0 | $0 | $0 | $0 | $0 | |
| Subtotal Cash Spent | $53,497 | $20,964 | $20,959 | $20,954 | $20,949 | $20,944 | $20,939 | $20,934 | $20,929 | $20,924 | $20,919 | $20,914 | |
| Net Cash Flow | ($32,834) | ($3,651) | ($2,834) | $246 | $3,051 | $1,880 | $2,931 | $4,481 | $1,934 | $2,175 | $3,440 | $3,973 | |
| Cash Balance | $12,474 | $8,824 | $5,990 | $6,236 | $9,287 | $11,167 | $14,098 | $18,579 | $20,513 | $22,688 | $26,128 | $30,101 | |
| Pro Forma Balance Sheet | |||||||||||||
| Jan | Feb | Mar | Apr | May | Jun | Jul | Aug | Sep | Oct | Nov | Dec | ||
| Assets | Starting Balances | ||||||||||||
| Current Assets | |||||||||||||
| Cash | $45,308 | $12,474 | $8,824 | $5,990 | $6,236 | $9,287 | $11,167 | $14,098 | $18,579 | $20,513 | $22,688 | $26,128 | $30,101 |
| Accounts Receivable | $23,326 | $23,663 | $27,350 | $33,225 | $33,525 | $33,775 | $37,471 | $36,102 | $33,188 | $34,277 | $35,928 | $37,069 | $37,403 |
| Other Current Assets | $8,830 | $8,830 | $8,830 | $8,830 | $8,830 | $8,830 | $8,830 | $8,830 | $8,830 | $8,830 | $8,830 | $8,830 | $8,830 |
| Total Current Assets | $77,464 | $44,967 | $45,004 | $48,045 | $48,591 | $51,892 | $57,469 | $59,030 | $60,596 | $63,620 | $67,446 | $72,027 | $76,333 |
| Long-term Assets | |||||||||||||
| Long-term Assets | $507,687 | $507,687 | $507,687 | $507,687 | $507,687 | $507,687 | $507,687 | $507,687 | $507,687 | $507,687 | $507,687 | $507,687 | $507,687 |
| Accumulated Depreciation | $45,691 | $49,691 | $53,691 | $57,690 | $61,690 | $65,690 | $69,690 | $73,689 | $77,689 | $81,689 | $85,689 | $89,688 | $93,688 |
| Total Long-term Assets | $461,996 | $457,996 | $453,997 | $449,997 | $445,997 | $441,997 | $437,998 | $433,998 | $429,998 | $425,998 | $421,999 | $417,999 | $413,999 |
| Total Assets | $539,460 | $502,964 | $499,000 | $498,042 | $494,588 | $493,890 | $495,466 | $493,028 | $490,594 | $489,618 | $489,444 | $490,026 | $490,332 |
| Liabilities and Capital | Jan | Feb | Mar | Apr | May | Jun | Jul | Aug | Sep | Oct | Nov | Dec | |
| Current Liabilities | |||||||||||||
| Accounts Payable | $40,596 | $7,963 | $7,958 | $7,954 | $7,949 | $7,944 | $7,939 | $7,934 | $7,929 | $7,925 | $7,920 | $7,915 | $7,910 |
| Current Borrowing | $0 | $2,000 | $1,900 | $1,800 | $1,700 | $1,600 | $1,500 | $1,400 | $1,300 | $1,200 | $1,100 | $1,000 | $900 |
| Other Current Liabilities | $22,785 | $22,285 | $21,785 | $21,285 | $20,785 | $20,285 | $19,785 | $19,285 | $18,785 | $18,285 | $17,785 | $17,285 | $16,785 |
| Subtotal Current Liabilities | $63,381 | $32,248 | $31,643 | $31,039 | $30,434 | $29,829 | $29,224 | $28,619 | $28,014 | $27,410 | $26,805 | $26,200 | $25,595 |
| Long-term Liabilities | $17,766 | $17,266 | $16,766 | $16,266 | $15,766 | $15,266 | $14,766 | $14,266 | $13,766 | $13,266 | $12,766 | $12,266 | $11,766 |
| Total Liabilities | $81,147 | $49,514 | $48,409 | $47,305 | $46,200 | $45,095 | $43,990 | $42,885 | $41,780 | $40,676 | $39,571 | $38,466 | $37,361 |
| Paid-in Capital | $0 | $3,000 | $3,000 | $3,000 | $3,000 | $3,000 | $3,000 | $3,000 | $3,000 | $3,000 | $3,000 | $3,000 | $3,000 |
| Retained Earnings | $458,313 | $458,313 | $458,313 | $458,313 | $458,313 | $458,313 | $458,313 | $458,313 | $458,313 | $458,313 | $458,313 | $458,313 | $458,313 |
| Earnings | $0 | ($7,864) | ($10,722) | ($10,576) | ($12,925) | ($12,518) | ($9,837) | ($11,171) | ($12,499) | ($12,371) | ($11,440) | ($9,753) | ($8,342) |
| Total Capital | $458,313 | $453,449 | $450,591 | $450,737 | $448,388 | $448,795 | $451,476 | $450,142 | $448,814 | $448,942 | $449,873 | $451,560 | $452,971 |
| Total Liabilities and Capital | $539,460 | $502,964 | $499,000 | $498,042 | $494,588 | $493,890 | $495,466 | $493,028 | $490,594 | $489,618 | $489,444 | $490,026 | $490,332 |
| Net Worth | $458,313 | $453,449 | $450,591 | $450,737 | $448,388 | $448,795 | $451,476 | $450,142 | $448,814 | $448,942 | $449,874 | $451,560 | $452,971 |


