
What's For Dinner?
Executive Summary
What’s For Dinner? is an exciting, new business with a unique approach to helping people enjoy home cooked meals with their families. Customers will come to our Plano, TX location and prepare 12 meals that they pre-select from a menu in a party atmosphere. In two hours, they will have a month’s worth of meals to put in their freezer.
By focusing on our competitive edge (no direct competitors in the Dallas/Ft. Worth area), our customers, and their needs, What’s For Dinner? will increase sales to a point that exceeds $1.3M in three years.
What’s For Dinner? is owned jointly by Alan and Kim Kirby as an S Corporation. Alan and Kim have 15 years of experience in the food service and entertainment industries, as a party planner and personal chef, respectively. They know the kinds of food preparation available in the Collin County area. With two teenaged children, have experienced the frustration of trying to feed a whole family healthy food both cheaply and quickly. Alan’s existing contacts with local social and community groups, and Kim’s ongoing relationships with food distributors, specialty grocers, and high-end clients will all help to generate high sales from early in the first year.
What’s For Dinner offers several advantages to its target market:
- Relatively inexpensive meal preparation: ~$15 for a four-person meal.
- Fun, social, party atmosphere.
- Convenient: eat your prepared meals in your home, when you want.
- Saves time: no shopping, no prep, no clean up.
- For seniors, special menus and transportation assistance make meals easy.
- And, best of all, not having to decide “What’s For Dinner?”
The purpose of this plan is two-fold. The first is to acquire funding of $259,708. The second is to lay the foundations of the company’s vision, philosophy, and strategy, to ensure that we know where we are going and how to get there.

1.1 Mission
What’s For Dinner? is a specialized business that provides a variety of people with the opportunity to prepare health conscious, yet savory meals that can be frozen to take home and eat at a later time. The purpose of this process is to both optimize the time investment needed to prepare the quality of meals that What’s For Dinner? will become known for, within the clients’ current schedules, and also for them to practice the proper health conscious behavior that has become the target lifestyle of a health deficient society.
What’s For Dinner? will provide a unique and distinctive service that will unite a party-like atmosphere with professional food preparation that will attract a growing repeat customer base. What’s For Dinner? will allow families and busy professionals the ability to prepare a variety of meals quickly in a fun atmosphere, away from home, thus giving people more of what they are looking for – time.
Our goal is to be a self-sustaining corporate enterprise within 3 years from the company’s inception to begin expanding our menu offerings within 3 months and its location offerings within 4 years. What’s For Dinner? will employ 4 individuals full time within 3 years, and will hit net profit goals of $100,000 by the end of its second year of existence.
In short, we will be in the business of helping our customers to relieve their daily stresses of what to fix their families for dinner by providing them with a great menu choice of meals that they will prepare.
1.2 Keys to Success
The keys to success in this business are:
- Creating a high level of customer satisfaction in our service and products, which will lead to customer retention each month.
- Marketing: getting our name out to the public, primarily through an intensive marketing campaign driven by our customers (word of mouth) with a supplemental vehicle of standardized and conventional marketing tactics.
- Great product quality and variety that will be used to aid in customer retention and growth.
- Finances: as our customer base increases we will be better able to lower our supply costs by buying more in bulk through food service distributors.
- Variety of menus offered based on seasons, trends and customer preferences.
- Exceeding our customers’ expectations by offering them a higher quality of food for a competitive price.
- What’s For Dinner’s website will be an efficient and convenient place for customers to register and pay for parties.
1.3 Objectives
The objectives for What’s For Dinner? in the first three years of operation include:
- To exceed customers’ expectations for food service and food service products.
- To increase the number of clients served by 25% per year through superior service.
- To develop a sustainable start-up business that is profitable.
- To achieve an after tax net profit of $134K by year three.
- To achieve a net income of more than 10% of sales by the third year.
Company Summary
What’s For Dinner? is a unique business where customers come to our Plano, TX location and prepare twelve pre-chosen meals that will be taken home and frozen until they are ready to cook and serve. All of the planning, shopping, food preparation and containers are provided with no worries to the customer. The meals will be prepared in a party like atmosphere where customers will have separate workstations to prepare their meals and have a good time with friends, both new and old.
Our goal is to provide our customers with home cooked meals that their families will enjoy, while saving them time and effort and relieve stress from that age-old question of What’s For Dinner?
The scheduling aspect of our company will be combination of a standard walk-up scheduling procedure, a phone messaging service and an intensive highly-interactive e-commerce website that will allow the customer to not only schedule parties but also to pay online, using standard secure technology.
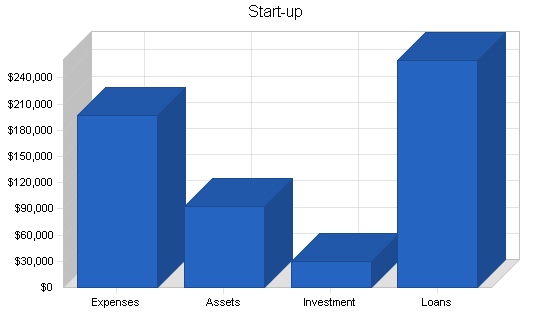
2.1 Start-up Summary
The start-up expenses include:
- Rent expenses include a deposit and rent for one month at $28.75 per square foot for 1,854 square feet, in the total amount of $5,182.
- Utilities expenses for one month.
- Insurance deposit and first month.
- Sales & Marketing expenses including stationery, brochures, outdoor signage.
- Website development.
- Office, kitchen and janitorial supply expenses.
- Leasehold improvements, including contractors fees and permits.
The required start-up assets of $50,000 include:
- Kitchen Equipment (long-term assets)
- Prep Tables (long-term assets)
- Cooking utensils
- Various Kitchen Utensils
- Computer and small business software
Please note that the long-term assets above will be depreciated using G.A.A.P. approved straight-line depreciation method.
The purpose of this business plan is to secure $259,708 in funding. This loan appears in the long-term liability row of the attached Start-up Funding table.
The following chart and table summarize the start-up assumptions.
| Start-up Funding | |
| Start-up Expenses to Fund | $196,708 |
| Start-up Assets to Fund | $93,000 |
| Total Funding Required | $289,708 |
| Assets | |
| Non-cash Assets from Start-up | $59,000 |
| Cash Requirements from Start-up | $34,000 |
| Additional Cash Raised | $0 |
| Cash Balance on Starting Date | $34,000 |
| Total Assets | $93,000 |
| Liabilities and Capital | |
| Liabilities | |
| Current Borrowing | $0 |
| Long-term Liabilities | $259,708 |
| Accounts Payable (Outstanding Bills) | $0 |
| Other Current Liabilities (interest-free) | $0 |
| Total Liabilities | $259,708 |
| Capital | |
| Planned Investment | |
| Alan Kirby | $15,000 |
| Kim Kirby | $15,000 |
| Other | $0 |
| Additional Investment Requirement | $0 |
| Total Planned Investment | $30,000 |
| Loss at Start-up (Start-up Expenses) | ($196,708) |
| Total Capital | ($166,708) |
| Total Capital and Liabilities | $93,000 |
| Total Funding | $289,708 |
| Start-up | |
| Requirements | |
| Start-up Expenses | |
| Legal | $1,500 |
| Stationery etc. | $400 |
| Office Supplies | $500 |
| Kitchen Supplies | $1,000 |
| Janitorial Supplies | $400 |
| Insurance | $719 |
| Rent | $5,182 |
| Utilities | $1,085 |
| Sales and Marketing | $2,800 |
| Website Development | $4,000 |
| Leasehold Improvements | $140,000 |
| Licenses/Permits | $422 |
| Construction Fees / Permits | $35,000 |
| Outdoor Sign | $3,500 |
| Miscellaneous | $200 |
| Total Start-up Expenses | $196,708 |
| Start-up Assets | |
| Cash Required | $34,000 |
| Start-up Inventory | $9,000 |
| Other Current Assets | $8,000 |
| Long-term Assets | $42,000 |
| Total Assets | $93,000 |
| Total Requirements | $289,708 |

2.2 Company Ownership
What’s For Dinner? is a privately held Sub Chapter S-corporation. This allows for the protection allowed by the corporate legal structure combined with the “fall through” Generally Accepted Accounting Principals that will make personal financial sense to the corporations principle owners. The principle owners of What’s For Dinner? are Alan and Kim Kirby; each owns a 50% stake in the company. This company operates under the jurisdiction of the State of Texas and the United States of America.
Services
What’s For Dinner? will provide its customers with twelve home cooked meals that they will freeze until customers are ready to serve them. These meals will be chosen from a set menu designed weekly by us and the meals will be prepared in our location. All of the planning, shopping, food preparation, recipe directions and containers will be provided to help make it as easy as possible for our customers to enjoy their time at our establishment.
Our customers will prepare their meals in a fun, party-like atmosphere where they can relax, meet new friends or spend time with old friends while preparing dinners for their families for the next month.
The Key benefits our customers will receive from using What’s For Dinner? are:
- Spend less time in the kitchen
- Less money on groceries & eating out – it keeps you from being tempted to eat out
- Home style meals & better eating
- Able to sit down at the table together as a family – including conversation and socialization
- Clean up is easy, because prep is done outside the home, and all meals come in disposable containers
- Less time spent on grocery shopping
- In 2 hours you will have 12 dinners for you and your family
- We create the menus – order the ingredients – slice, dice, chop and prepare
- Social hour preparing dinners
Our menus and portion sizes are tailored for the group and individual customers. Seniors get added benefits, with diabetic, low-cholesterol, and low-sodium choices. Families can increase portion sizes for a small fee to accommodate more children or guests.
Market Analysis Summary
The Dallas area’s meal preparation market is untapped. As a matter of fact, there is no other business of this kind in the Dallas/Ft. Worth area. Though there are no exact replicas of our company there are some types of companies that we would have to consider to be indirect competitors. These include such companies and service professionals as caterers and those that will come to your home and prepare meals for you to freeze. What’s For Dinner?, at this time, has few direct competitors, with exception to area restaurants and your basic home cooking. At the inception of What’s For Dinner?, there will be no type of company like ours in the area, thus giving us the overwhelming competitive advantage of first entry.
The What’s For Dinner? market is primarily in the Collin County area: Plano, Frisco, Allen and McKinney. We will be focusing on households in these areas that have more than one person. Primarily, those households whose income is over $50,000, with someone under the age of 18 living there. As a secondary target market, we will market to the elderly population in the aforementioned areas. Initially, the greater portion of our customers will be busy, working class people and the growing group of single-parent families, but it will be of great benefit now and in the future to market our services to the highest growing population demographic – senior citizens.
The following statistics were taken from Table DP-1 Profile of General Demographic Characteristics: 2000 for Collin County.
4.1 Market Segmentation
What’s For Dinner? has three distinct target populations:
- Family households with children under 18 years old. This group of people is generally busier than other families with their time split between work, home and their children’s activities. This group may be single parent households, which only adds to the stress resulting from lack of time, coupled with the need for proper meals for their children. This provides them with a desire to provide their families with good meals and free time to enjoy being together.
- Family households with no children living at their home. This group has a need for our services, as hectic schedules, professional careers, and daily demands on time come up against the need for tasty, healthy meals. Depending on their work and home situations this demographic could use our service to enhance their selection of meals all the while minimizing their time in the kitchen. This group does recognize the benefits of our service and want to enjoy making meals for themselves and socializing through our business.
- Senior and Elderly Citizens. This group (65 and older) is the fastest growing portion of the population, and needs our services for several reasons:
- A good portion of this group is simply unable to cook nutritious meals and does not have the knowledge or skills to continue to effectively maneuver themselves in the kitchen.
- Many seniors do not have the time, energy, or means to make it to the grocery store.
We will market several menus designed for the diet needs of the senior populace (diabetic, low cholesterol, low sodium), with pick-up and drop-off coordinated with a local senior-transportation center. All prep and measuring will be done beforehand, so they will need only to stir and combine ingredients. In addition to meeting their practical needs, we will create the social experience that this group consistently hunts for, and help them to enhance their lifestyle through a higher quality of health.

| Market Analysis | |||||||
| Year 1 | Year 2 | Year 3 | Year 4 | Year 5 | |||
| Potential Customers | Growth | CAGR | |||||
| Households with children | 10% | 73,864 | 81,250 | 89,375 | 98,312 | 108,144 | 10.00% |
| Households with no children | 10% | 58,404 | 64,244 | 70,668 | 77,735 | 85,509 | 10.00% |
| Seniors | 12% | 25,852 | 28,954 | 32,428 | 36,319 | 40,677 | 12.00% |
| Total | 10.33% | 158,120 | 174,448 | 192,471 | 212,366 | 234,330 | 10.33% |
4.2 Target Market Segment Strategy
These target market segments were chosen based on their greater need for our services. Families with children are very busy, and they can end up spending a great deal on fast food and junk food because they don’t have time to cook healthy meals at home. Busy working couples and individuals without children are also busy, and may not have the skills or desire to plan and cook entire meals at home just for themselves; they can spend a lot on going out to eat. Seniors have special challenges in obtaining and preparing quality ingredients to feed themselves, including the loneliness of cooking for oneself. Options like “Meals on Wheels” are generally last-resorts, and many would prefer alternate food preparation arrangements, if any were available at a reasonable price – fixed incomes can be hard on the palate.
Our marketing strategies for all groups will emphasize our relatively inexpensive, fun, and easy approach to preparing healthy meals. We will vary our serving sizes, menu options, and level of preparation for each group; the family-size entree just right for a family of four makes no sense for a single individual. Different sized families have different needs, and it will be our goal to look to accommodate most family sizes through our variations in serving size.
The main objection most potential customers will raise is cost – $144 seems like a lot of money, up front, for a new, untested service. This is why we are starting our marketing and sales campaigns with established groups (church groups, cooking clubs, local senior center restaurant clubs), at a price reduction. These consumers already have experience socializing with each other, and our service will be an exciting change of pace in their calendars. We anticipate that these initial positive experiences will generate significant word of mouth and produce referrals so we can say to potential customers, “don’t just take our word for it – go ask people who’ve tried us!”
4.3 Service Business Analysis
Our service is unique among Dallas meal preparation options. There are no direct competitors for What’s For Dinner? The closest competitors are personal chefs, who will come to your home and prepare your chosen meals for you and freeze them, at a very high price. Our target market segments cannot afford personal chefs.
Our indirect competitors are area restaurants. These include family-oriented, inexpensive diners and casual restaurants, as well as fast food and takeout. We will generally not be competing with upscale, adult-oriented restaurants, since those are “special occasion” locations, and do not fulfill local residents’ daily meal needs.
Our competitor restaurants compete on price, perceived convenience, and atmosphere. They succeed when they convince customers that going out to eat is an affordable “treat” that is easier and more pleasant than preparing meals at home. In truth, the restaurants with the lowest prices also offer poor quality food and atmosphere, and the struggle to get children ready, out the door, and have them behave in a restaurant setting can make these choices less appealing in families’ realities than in their imagination. For all customers, the time it takes to get ready, travel to a restaurant, order dinner, eat, pay, and get home make going out to a eat a full-evening’s commitment – hardly the convenience it claims.
With the introduction of What’s For Dinner? to the Dallas market, we will revolutionize the way that the community looks at cooking convenience. Our prices really are much lower than restaurant meals, with much higher quality meals. In addition, our “convenience” comes in two ways – preparing meals at a set time, outside the daily routine, so they are ready in advance, and eating and minimal clean-up right in the customer’s own home, which saves time and energy at the end of a long day.
4.3.1 Competition and Buying Patterns
Even though What’s For Dinner? has no direct competitors, we will set up our business as if we are entering an already aggressive and hostile market. This is aimed at helping us to become successful through a constant drive for increased service model efficiencies and marketing effectiveness. We will strive to excel in customer service excellence, continuing our menu varieties and achieving the highest standards for our food products. As owners, we feel that word of mouth and customer retention are significant factors in our success. Our convenient locations, sanitary facilities, competitive pricing structure and honorable reputation will all play a part in satisfying our customers and increasing our clientele at an accelerating rate. What’s For Dinner? will focus on these factors and always strive to improve our business model and service offerings. We will strive to be the very best in our industry and will not rest until we not only have the largest market share in our industry, but also have the most satisfied customers.
The buying patterns of our customer base will be affected by our initial meal prep party prices. We have concluded through our exhaustive focus market groups that we could set our prices high, since there is no direct competitor, but we feel that to attract and retain customers and be able to steadily grow our customer base, so we should price ourselves at a lower level first. By setting ourselves at the lower end of our pricing range, we will not only gain the attention of the vast majority of our target markets, but we will also be able to start our revenue streams off with an upward growth pattern. The price that we will choose will be reasonable for our customers and be adequate for the business to maintain a gross margin around 25%.
Strategy and Implementation Summary
What’s For Dinner? will gradually gain market share in the four focal geographic markets (Plano, Frisco, Allen and McKinney) by leveraging its competitive edges. These edges are superior attention to detail in the local food service market, a revolutionary food-servicing outlook and excellent nutritional meals at competitive price. These advantages have been unavailable in this market for some time. We will market our services with a targeted advertising campaign and networking.
5.1 Competitive Edge
What’s For Dinner? will begin with a critical competitive edge: we have no direct competitors in the Dallas/Ft. Worth area. By being the first-mover and (for at least a while) the only service of our kind, we will have the initial market buzz that is normally reserved for the first company of its kind into a given market. Our positioning is very hard to match, but only if we maintain focus on our strategy, marketing, business development, and fulfillment of quality and customer service will we be able to continually grow and outpace the “copy-cat” businesses that are sure to follow our market lead. We are aware that the tendency to relax due to lack of competition could weaken our competitive edge. What’s For Dinner? will be operated as if our direct competitors were conducting the same service business that we are in and we will be looking for additional enhancements to our operating procedures from day one.
In addition to our unique positioning, we offer the following advantages to our customers:
- High quality meals
- Relatively low prices
- Time saving meal preparation
- Reducing mess in customers’ kitchens
- Reducing stress around meal prep
- Saving them from that perennial problem of deciding, “What’s for Dinner?”
5.2 Marketing Strategy
As a food service business, our main goal is to provide high quality food with excellent customer service. Our challenge as a new company is to quickly establish a reputation for such quality among our potential markets. With this in mind, the initial focus of our marketing strategy will be to get our name and reputation out to the public to create “buzz.” Creating brand recognition for our new concept will be the first measurable milestone in our marketing strategy.
This will be one of the most important factors when measuring success within the first couple of months after inception. The basis for our ideology is simple; the more people that hear our name and become familiar with our services, the more people will use it. The marketing campaign will involve a targeted advertising campaign, different specials to entice the customers to try our business and a very intense networking campaign. All of these tactics will be used to help gain a loyal clientele aimed at fostering our happy customer base.
At start-up, we will begin a focused advertising campaign toward target segments in our geographical area. We will update our advertising campaign regularly to fill in gaps based on follow-up research: do people recognize our name? Do they know what we do? What is their impression of our services’ costs and quality?Marketing campaigns will work via:
- Local area newspapers that are viewed by our target market.
- Homeowner associations’, churches’ and specific groups’ newsletters.
- Direct mail advertisements/flyers to our target market purchased through a direct mailing company with lists specifically of our target market.
- Various flyers and pamphlets that will be available at many shopping centers and grocery stores throughout the area.
- Yellow pages advertisement.
- Dynamic website.
- Registered keyword searches that will lead to our website.
- Various Radio advertisements.
- Various event sponsorships.
Coupled with the advertising campaign will be a systematic offering of discounted specials to attract more customers. This could be very important to potential customers because the cost of $175 for 12 meals is very appealing to families that have used our service before, but families may be skeptical to buy this much food and invest that much money in something they have never tried. For that reason, our business will offer periodic specials to families to help limit their fears and open their eyes to the wonderful atmosphere at What’s For Dinner?
What’s For Dinner? will also have a networking campaign that will start with the owner’s contacts and friends attending our first months’ meal prep parties. This will be the “word of mouth” campaign that will feature:
- Private parties with discounts for the host/hostess of the party. This will encourage them to invite 11 friends that will be introduced to our business and will be return customers.
- Special discounts to return customers when referring new customers.
5.3 Sales Strategy
In the food service business, as in any customer service intensive business, sales revenue is our lifeblood. The way in which we present ourselves to our customers and deal with the public will determine the success of our business. The food service industry is facilitated by repeat business and referrals. In order to continuously compete against other food providers, we need to enhance our repeat customer service business by making this our main sales focus. We cannot expect to have a satisfied customer by selling them one month’s of meals and then never seeing them again. We must make our sales strategy revolve around making the customer’s experience with us the best it possibly can, and further, making every effort to get our current customer base to visit us again. It is much more expensive to get new customers than to keep the customers you already have. Our customers cannot stop eating, but they could stop using our services. We will be selling our service to our current customers each time they come, in order to have repeat business and new business through their word of mouth.
These are just a few of the ways we will sell to our customers to gain repeat business and word of mouth advertising:
- High levels of customer service; friendly, comforting and entertaining
- Good variety of menus from which to choose
- The best quality of foods and ingredients
- Creating a fun and social atmosphere for our customers, so they want to return
- Reminders at each party to sign up for the next month’s party, along with the next month’s menu and samples
- A follow up and reminder program for our current customers that will be done through email and mail.
- Focus a specific portion of our advertising campaign on getting our repeat customers to come back and visit us
- Allow our best repeat customers to get special quantity specific discounts.
- Enlist a comprehensive and highly interactive e-commerce initiative to help to accommodate our customer’s payment and scheduling options.
The What’s For Dinner? website will serve as a productive and consistent selling tool. Our website will be set up to explain what we offer and the many benefits customers will receive for using our meal prep services. The website will help “close the sale;” customers will be able to register for the meal prep party they would like to attend and accepting payments online. This will be our main source of registrations for parties. The ease of use allowed by the Internet will be key to driving our customer pipeline. Our sales and marketing campaigns will help focus our customer traffic through our website, so that people can see how easy it will be to interact with our company. This element of efficiency will also help enhance our bottom line by allowing for a 24 hour customer service mechanism without having to keep a customer rep staffed all the time.
5.3.1 Sales Forecast
Through our research of other businesses like ours in Seattle, WA and Omaha, NE, we found that all of them quickly increased their sales over their first year. All of these researched companies went from their first month of 100 customers on average to over 1,000 customers within their first year of business. One company opened in Seattle against two other competitors and now has over 2,000 customers with three different locations.
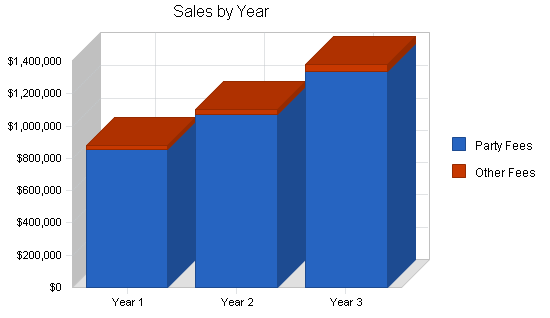
We are optimistic that What’s For Dinner? will grow and prosper just as these other companies have, but we want to set reasonable forecasts for growth. We have therefore taken a conservative approach in preparing our Sales Forecast Table.
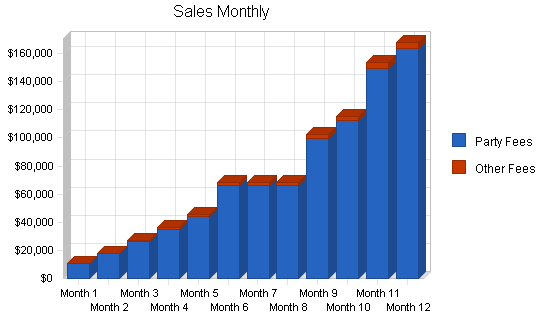
The following table and chart give a run-down on forecasted sales. We have forecasted that sales will increase each month with the exception of the summer months, when vacations and other seasonal activities may reduce purchases. Once we get our first few customers, our sales will increase through customer retention, and gaining new customers through networking. We expect sales to grow incrementally over the first year, reaching profitability by the fifth month of operation.
After the first year of operation, we expect sales to continue increasing, from 10% the first year up to 25% by the third year. As sales increase, we will make modifications to our facility and hire new employees to share in the work. Our proposed location allows room for expansion. Based on our research, and the size of our potential market, we expect to reach close to one million dollars in sales by the end of 2005.
Our direct costs of sales listed here are inventory used up in sales, including the meal ingredients and additional supplies, such as themed-party decorations, containers, napkins, and so on. Fixed operating expenses are listed in the Profit and Loss.
| Sales Forecast | |||
| Year 1 | Year 2 | Year 3 | |
| Sales | |||
| Party Fees | $857,674 | $1,072,093 | $1,340,116 |
| Other Fees | $24,505 | $30,631 | $38,289 |
| Total Sales | $882,179 | $1,102,724 | $1,378,405 |
| Direct Cost of Sales | Year 1 | Year 2 | Year 3 |
| Ingredients | $612,624 | $765,780 | $957,225 |
| Other Supplies | $44,109 | $55,136 | $68,920 |
| Subtotal Direct Cost of Sales | $656,733 | $820,917 | $1,026,146 |
5.4 Milestones
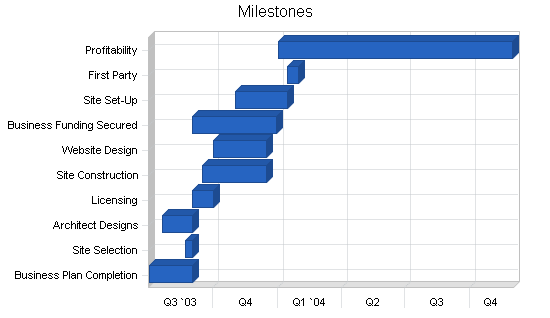
The accompanying table lists important program milestones, with dates and budgets for each. The milestone schedule indicates our emphasis on planning for implementation. What the table doesn’t show is the commitment behind it. Our business plan includes complete provisions for plan -vs. – actual analysis, and we will follow-up often to discover variances and course corrections.
What’s For Dinner? will have several milestones, including:
- Business plan completion. This will be done as a roadmap for the organization. This will be an indispensable tool for the ongoing performance and improvement of the company.
- Building set up.
- Our first meal prep party.
- Profitability.
| Milestones | |||||
| Milestone | Start Date | End Date | Budget | Manager | Department |
| Business Plan Completion | 7/1/2003 | 9/1/2003 | $250 | Alan Kirby | Administration |
| Site Selection | 8/22/2003 | 9/1/2003 | $0 | Alan Kirby | Administration |
| Architect Designs | 7/20/2003 | 9/1/2003 | $5,000 | Alan Kirby | Administration |
| Licensing | 9/1/2003 | 10/1/2003 | $500 | Alan Kirby | Administration |
| Site Construction | 9/15/2003 | 12/15/2003 | $0 | Alan Kirby | Administration |
| Website Design | 10/1/2003 | 12/15/2003 | $1,280 | Alan Kirby | Web |
| Business Funding Secured | 9/1/2003 | 12/30/2003 | $0 | Alan Kirby | Administration |
| Site Set-Up | 11/1/2003 | 1/15/2004 | $0 | Alan Kirby | Administration |
| First Party | 1/15/2004 | 1/30/2004 | $0 | Alan Kirby | Administration |
| Profitability | 1/1/2004 | 12/1/2004 | $0 | Alan Kirby | Administration |
| Totals | $7,030 | ||||
Web Plan Summary
The What’s For Dinner? website will be the virtual business card, party scheduler and payment acceptance source all rolled into one. It will showcase our services and highlight the benefits of using our company. The website will be a crucial portal for party scheduling, as well as having availability cross-referenced with party menus. Customers will also use this website to register for their parties and pay for them using PayPal, which accepts MasterCard, Discover Card, Visa, or e-checks.
6.1 Website Marketing Strategy
The What’s For Dinner? website will be a strategic and very important part of our marketing mix. It will be used as a marketing tool to attract new customers, and as a sales tool to schedule parties, select menus, and pay. We will be promoting our website in all marketing programs, including newspaper ads, yellow page ads, business cards and flyers. We will also purchase targeted key word searches to help potential customers find our website. In addition, our website will feature prominently on all napkins, packaging, and receipts which current customers bring home, making repeat business easy and convenient.
Our main internet strategy is to direct the majority of our potential clients to our website first, as the introduction to our services, prices, and availability. This will reduce the time necessary for staff to provide basic information over the phone, allowing them to answer customer questions and provide more details, once customers know who we are, what we do, and how we might help them.
To encourage customers to use the website, we will offering special discounts to those who register their parties with our website and pay online. Our website must be easy to access and navigate, and must answer every customer question we can anticipate. It must use a legitimate, well-respected security feature and a reliable payment method. If it is all these things, many of our repeat customers will be happy to save time by researching party options and scheduling them online.
Clearly, we expect website use to be highest among younger, internet-savvy customers. We anticipate that our senior customers will use phone and direct contacts for most scheduling and payment interactions.
6.2 Development Requirements
The What’s For Dinner? website will be developed with the technical resources of a local web design artist. He has designed websites for over 325 businesses, most with e-commerce capabilities. He is designing a database interface which will let us adjust the schedule and track click/sales ratios, and easily update menu offerings.
As the website development progresses, he will work with a local graphic artist we have hired to come up with the website logo and graphics. We are still researching hosting possibilities, but feel our needs will be best served by subcontracting out the hosting of the site and the technical back-end supporting.
Management Summary
The What’s For Dinner? management team will initially consist of the founders/owners themselves, Alan and Kim Kirby. We do not anticipate the need to hire anyone else on a full time basis during the first year, because all of the services that a normal small business needs will be outsourced. These services include the e-commerce infrastructure, accounting, marketing, and legal services. We do plan to employ one part-time employee from the beginning to help with cleaning and dishwashing.
Alan and Kim have 15 years of experience in the food service and entertainment industries, as a party planner and personal chef, respectively. Until the second year, Kim will continue to work part-time as a personal chef for several couples in Plano, doing the prep work and menu planning for What’s for Dinner? in the mornings. Alan will host the majority of the parties, after having prepared test batches of every menu item with Kim. The owners anticipate possibly hiring local high-school students as sous-chefs in years 2 and 3; Kim’s experience with local restaurants has shown that these students can often do quite well, paid only minimally in exchange for professional restaurant and food preparation training. Alan’s existing contacts with local social and community groups, and Kim’s ongoing relationships with food distributors, specialty grocers, and high-end clients will all help to generate high sales from early in the first year.
Throughout the first two years we will conduct an aggressive cost analysis as to what our capabilities are as owners and with what activities we need assistance.
7.1 Personnel Plan
The following table summarizes our personnel expenditures for the first three years, with compensation increasing from $34K the first year to about $60K in the third. We believe this plan is a fair compromise between fairness and expedience, and meets the commitment of our mission statement. The detailed monthly personnel plan for the first year is included in the appendices.
| Personnel Plan | |||
| Year 1 | Year 2 | Year 3 | |
| Alan Kirby | $24,000 | $30,000 | $40,000 |
| Kim Kirby | $5,000 | $7,500 | $10,000 |
| Part-time cleaner | $5,000 | $7,500 | $10,000 |
| Total People | 3 | 3 | 3 |
| Total Payroll | $34,000 | $45,000 | $60,000 |
Financial Plan
What’s For Dinner expects strong sales, based on research into our target market, similar businesses in other parts of the country, lack of direct competition, and the experience, reputations, and know-how of its owners/managers. By steadily repaying our long-term loan and holding down costs, we will generate a net profit midway through the first year and increase net worth dramatically by year 3. Our major fixed expenses are payroll and rent.
8.1 Important Assumptions
The financial plan depends on important assumptions, most of which are shown in the following table as annual assumptions. The monthly assumptions are included in the appendices.
Three of the more important underlying assumptions are:
- We assume a relatively strong economy, without major new recessions. Although an ailing economy would not allow us the growth that we anticipate, we believe that it would not drastically hurt the business because the service is economically feasible. The $175 session fee breaks down to $14.58 per meal – a deal hard to beat at even a fast-food restaurant for a family of four to six.
- We assume that our market needs will be seasonal, with a decrease in sales during the summer months.
| General Assumptions | |||
| Year 1 | Year 2 | Year 3 | |
| Plan Month | 1 | 2 | 3 |
| Current Interest Rate | 7.00% | 7.00% | 7.00% |
| Long-term Interest Rate | 7.00% | 7.00% | 7.00% |
| Tax Rate | 24.00% | 24.00% | 24.00% |
| Other | 0 | 0 | 0 |
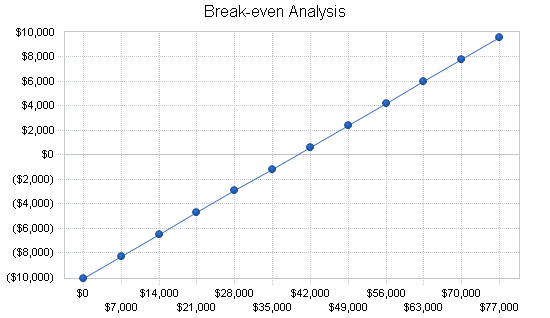
8.2 Break-even Analysis
The following chart and table summarize our break-even analysis. With fixed costs of $10,520 per month at the outset (to cover payroll and other operating costs), and variable costs (inventory) at 74% of sales, we need to bill $41,167 to cover our costs. We do not expect to reach break-even until the sixth month into the business operation.
| Break-even Analysis | |
| Monthly Revenue Break-even | $39,503 |
| Assumptions: | |
| Average Percent Variable Cost | 74% |
| Estimated Monthly Fixed Cost | $10,095 |
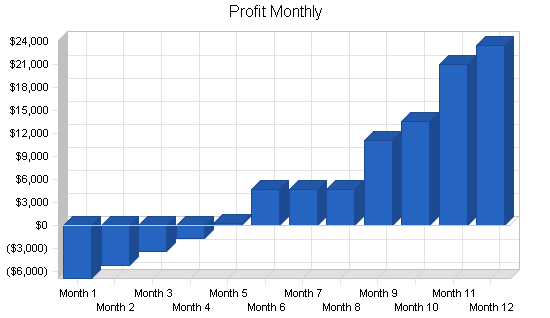
8.3 Projected Profit and Loss
What’s For Dinner?’s projected profit and loss is shown in the following table, with sales increasing from $10K the first month to close to $1.4M by the third year. We will reach profitability in the middle of our first year.
We are projecting very conservatively regarding cost of sales and gross margin. Our costs of sales are based on grocery store prices, which will decrease once we are to consistently able to buy our food in larger quantities from a food distributor. This will significantly lower our cost of sales, and increase our gross margin more than in this projection. We prefer to project conservatively so that we make sure we have enough cash.
The Sales and Marketing Expenses vary from the food preparation industry norms. Our Sales and Marketing Expenses will be to consistently maintain our advertising and promotions, while our biggest marketing will be word of mouth from our customers. We are budgeting for a high level of service from our website hosting company and payment processor, since the website is a key component of our Sales and Marketing Strategies.
The detailed monthly projections are included in the appendices.


| Pro Forma Profit and Loss | |||
| Year 1 | Year 2 | Year 3 | |
| Sales | $882,179 | $1,102,724 | $1,378,405 |
| Direct Cost of Sales | $656,733 | $820,917 | $1,026,146 |
| Other Costs of Sales | $0 | $0 | $0 |
| Total Cost of Sales | $656,733 | $820,917 | $1,026,146 |
| Gross Margin | $225,446 | $281,807 | $352,259 |
| Gross Margin % | 25.56% | 25.56% | 25.56% |
| Expenses | |||
| Payroll | $34,000 | $45,000 | $60,000 |
| Sales and Marketing and Other Expenses | $3,000 | $3,000 | $3,000 |
| Depreciation | $4,200 | $4,200 | $4,200 |
| Rent | $53,304 | $54,000 | $54,500 |
| Utilities | $13,160 | $14,476 | $15,924 |
| Office Supplies | $1,200 | $1,200 | $1,200 |
| Insurance | $3,000 | $3,000 | $3,000 |
| Payroll Taxes | $0 | $0 | $0 |
| Accountant | $3,000 | $3,200 | $3,500 |
| Lawyer | $1,000 | $1,100 | $1,100 |
| Bank Charges | $180 | $180 | $180 |
| Website Payment Fees | $600 | $700 | $800 |
| Website Hosting & Support | $1,500 | $1,600 | $1,650 |
| Repairs and Maintenance | $3,000 | $3,000 | $3,000 |
| Other | $0 | $0 | $0 |
| Total Operating Expenses | $121,144 | $134,656 | $152,054 |
| Profit Before Interest and Taxes | $104,302 | $147,151 | $200,205 |
| EBITDA | $108,502 | $151,351 | $204,405 |
| Interest Expense | $17,342 | $15,861 | $14,316 |
| Taxes Incurred | $20,870 | $31,510 | $44,614 |
| Net Profit | $66,089 | $99,780 | $141,276 |
| Net Profit/Sales | 7.49% | 9.05% | 10.25% |
8.4 Projected Cash Flow
The following cash flow projections show the annual amounts only. Cash flow projections are critical to our success. The monthly cash flow is shown in the illustration, with one bar representing the cash flow per month, and the other the monthly cash balance. The annual cash flow figures are included here and the more important detailed monthly numbers are included in the appendices.

| Pro Forma Cash Flow | |||
| Year 1 | Year 2 | Year 3 | |
| Cash Received | |||
| Cash from Operations | |||
| Cash Sales | $882,179 | $1,102,724 | $1,378,405 |
| Subtotal Cash from Operations | $882,179 | $1,102,724 | $1,378,405 |
| Additional Cash Received | |||
| Sales Tax, VAT, HST/GST Received | $0 | $0 | $0 |
| New Current Borrowing | $0 | $0 | $0 |
| New Other Liabilities (interest-free) | $0 | $0 | $0 |
| New Long-term Liabilities | $0 | $0 | $0 |
| Sales of Other Current Assets | $0 | $0 | $0 |
| Sales of Long-term Assets | $0 | $0 | $0 |
| New Investment Received | $0 | $0 | $0 |
| Subtotal Cash Received | $882,179 | $1,102,724 | $1,378,405 |
| Expenditures | Year 1 | Year 2 | Year 3 |
| Expenditures from Operations | |||
| Cash Spending | $34,000 | $45,000 | $60,000 |
| Bill Payments | $758,414 | $1,055,142 | $1,197,241 |
| Subtotal Spent on Operations | $792,414 | $1,100,142 | $1,257,241 |
| Additional Cash Spent | |||
| Sales Tax, VAT, HST/GST Paid Out | $0 | $0 | $0 |
| Principal Repayment of Current Borrowing | $0 | $0 | $0 |
| Other Liabilities Principal Repayment | $0 | $0 | $0 |
| Long-term Liabilities Principal Repayment | $22,080 | $22,080 | $22,080 |
| Purchase Other Current Assets | $0 | $0 | $0 |
| Purchase Long-term Assets | $0 | $0 | $0 |
| Dividends | $0 | $0 | $0 |
| Subtotal Cash Spent | $814,494 | $1,122,222 | $1,279,321 |
| Net Cash Flow | $67,685 | ($19,498) | $99,083 |
| Cash Balance | $101,685 | $82,187 | $181,270 |
8.5 Projected Balance Sheet
The balance sheet in the following table shows managed but sufficient growth of net worth, and a sufficiently healthy financial position. Our negative net worth, due to borrowed capital for start-up, makes a significant increase by the second year, and becomes positive in year three. It is common for start-up businesses to have a negative net worth their first few years.
The monthly estimates are included in the appendices.
| Pro Forma Balance Sheet | |||
| Year 1 | Year 2 | Year 3 | |
| Assets | |||
| Current Assets | |||
| Cash | $101,685 | $82,187 | $181,270 |
| Inventory | $137,714 | $172,142 | $215,178 |
| Other Current Assets | $8,000 | $8,000 | $8,000 |
| Total Current Assets | $247,399 | $262,329 | $404,448 |
| Long-term Assets | |||
| Long-term Assets | $42,000 | $42,000 | $42,000 |
| Accumulated Depreciation | $4,200 | $8,400 | $12,600 |
| Total Long-term Assets | $37,800 | $33,600 | $29,400 |
| Total Assets | $285,199 | $295,929 | $433,848 |
| Liabilities and Capital | Year 1 | Year 2 | Year 3 |
| Current Liabilities | |||
| Accounts Payable | $148,189 | $81,220 | $99,942 |
| Current Borrowing | $0 | $0 | $0 |
| Other Current Liabilities | $0 | $0 | $0 |
| Subtotal Current Liabilities | $148,189 | $81,220 | $99,942 |
| Long-term Liabilities | $237,628 | $215,548 | $193,468 |
| Total Liabilities | $385,817 | $296,768 | $293,410 |
| Paid-in Capital | $30,000 | $30,000 | $30,000 |
| Retained Earnings | ($196,708) | ($130,619) | ($30,838) |
| Earnings | $66,089 | $99,780 | $141,276 |
| Total Capital | ($100,619) | ($838) | $140,438 |
| Total Liabilities and Capital | $285,199 | $295,929 | $433,848 |
| Net Worth | ($100,619) | ($838) | $140,438 |
8.6 Business Ratios
Business ratios for the years of this plan are shown below. Industry profile ratios based on the Standard Industrial Classification (SIC) code 2099, Food Preparation, are shown for comparison.
The following table outlines some of the more important ratios from the Food Preparation industry. The final column, Industry Profile, details specific ratios based on the industry as it is classified by the Standard Industry Classification (SIC) code, 2099.
| Ratio Analysis | ||||
| Year 1 | Year 2 | Year 3 | Industry Profile | |
| Sales Growth | 0.00% | 25.00% | 25.00% | 5.54% |
| Percent of Total Assets | ||||
| Inventory | 48.29% | 58.17% | 49.60% | 11.58% |
| Other Current Assets | 2.81% | 2.70% | 1.84% | 22.16% |
| Total Current Assets | 86.75% | 88.65% | 93.22% | 53.03% |
| Long-term Assets | 13.25% | 11.35% | 6.78% | 46.97% |
| Total Assets | 100.00% | 100.00% | 100.00% | 100.00% |
| Current Liabilities | 51.96% | 27.45% | 23.04% | 27.29% |
| Long-term Liabilities | 83.32% | 72.84% | 44.59% | 20.18% |
| Total Liabilities | 135.28% | 100.28% | 67.63% | 47.47% |
| Net Worth | -35.28% | -0.28% | 32.37% | 52.53% |
| Percent of Sales | ||||
| Sales | 100.00% | 100.00% | 100.00% | 100.00% |
| Gross Margin | 25.56% | 25.56% | 25.56% | 30.90% |
| Selling, General & Administrative Expenses | 17.88% | 16.00% | 15.03% | 16.61% |
| Advertising Expenses | 0.00% | 0.00% | 0.00% | 1.28% |
| Profit Before Interest and Taxes | 11.82% | 13.34% | 14.52% | 1.33% |
| Main Ratios | ||||
| Current | 1.67 | 3.23 | 4.05 | 1.54 |
| Quick | 0.74 | 1.11 | 1.89 | 0.98 |
| Total Debt to Total Assets | 135.28% | 100.28% | 67.63% | 55.42% |
| Pre-tax Return on Net Worth | -86.42% | -15658.38% | 132.36% | 2.12% |
| Pre-tax Return on Assets | 30.49% | 44.37% | 42.85% | 4.76% |
| Additional Ratios | Year 1 | Year 2 | Year 3 | |
| Net Profit Margin | 7.49% | 9.05% | 10.25% | n.a |
| Return on Equity | 0.00% | 0.00% | 100.60% | n.a |
| Activity Ratios | ||||
| Inventory Turnover | 10.91 | 5.30 | 5.30 | n.a |
| Accounts Payable Turnover | 6.12 | 12.17 | 12.17 | n.a |
| Payment Days | 27 | 42 | 27 | n.a |
| Total Asset Turnover | 3.09 | 3.73 | 3.18 | n.a |
| Debt Ratios | ||||
| Debt to Net Worth | 0.00 | 0.00 | 2.09 | n.a |
| Current Liab. to Liab. | 0.38 | 0.27 | 0.34 | n.a |
| Liquidity Ratios | ||||
| Net Working Capital | $99,209 | $181,110 | $304,506 | n.a |
| Interest Coverage | 6.01 | 9.28 | 13.99 | n.a |
| Additional Ratios | ||||
| Assets to Sales | 0.32 | 0.27 | 0.31 | n.a |
| Current Debt/Total Assets | 52% | 27% | 23% | n.a |
| Acid Test | 0.74 | 1.11 | 1.89 | n.a |
| Sales/Net Worth | 0.00 | 0.00 | 9.82 | n.a |
| Dividend Payout | 0.00 | 0.00 | 0.00 | n.a |
Appendix
| Sales Forecast | |||||||||||||
| Month 1 | Month 2 | Month 3 | Month 4 | Month 5 | Month 6 | Month 7 | Month 8 | Month 9 | Month 10 | Month 11 | Month 12 | ||
| Sales | |||||||||||||
| Party Fees | 0% | $10,500 | $17,500 | $26,250 | $35,000 | $44,297 | $66,445 | $66,445 | $66,445 | $99,667 | $112,125 | $149,500 | $163,500 |
| Other Fees | 0% | $300 | $500 | $750 | $1,000 | $1,266 | $1,898 | $1,898 | $1,898 | $2,848 | $3,204 | $4,271 | $4,671 |
| Total Sales | $10,800 | $18,000 | $27,000 | $36,000 | $45,563 | $68,343 | $68,343 | $68,343 | $102,515 | $115,329 | $153,771 | $168,171 | |
| Direct Cost of Sales | Month 1 | Month 2 | Month 3 | Month 4 | Month 5 | Month 6 | Month 7 | Month 8 | Month 9 | Month 10 | Month 11 | Month 12 | |
| Ingredients | $7,500 | $12,500 | $18,750 | $25,000 | $31,641 | $47,461 | $47,461 | $47,461 | $71,191 | $80,089 | $106,786 | $116,786 | |
| Other Supplies | $540 | $900 | $1,350 | $1,800 | $2,278 | $3,417 | $3,417 | $3,417 | $5,126 | $5,766 | $7,689 | $8,409 | |
| Subtotal Direct Cost of Sales | $8,040 | $13,400 | $20,100 | $26,800 | $33,919 | $50,878 | $50,878 | $50,878 | $76,316 | $85,856 | $114,474 | $125,194 | |
| Personnel Plan | |||||||||||||
| Month 1 | Month 2 | Month 3 | Month 4 | Month 5 | Month 6 | Month 7 | Month 8 | Month 9 | Month 10 | Month 11 | Month 12 | ||
| Alan Kirby | 0% | $2,000 | $2,000 | $2,000 | $2,000 | $2,000 | $2,000 | $2,000 | $2,000 | $2,000 | $2,000 | $2,000 | $2,000 |
| Kim Kirby | 0% | $417 | $417 | $417 | $417 | $417 | $417 | $417 | $417 | $417 | $417 | $417 | $417 |
| Part-time cleaner | 0% | $417 | $417 | $417 | $417 | $417 | $417 | $417 | $417 | $417 | $417 | $417 | $417 |
| Total People | 3 | 3 | 3 | 3 | 3 | 3 | 3 | 3 | 3 | 3 | 3 | 3 | |
| Total Payroll | $2,833 | $2,833 | $2,833 | $2,833 | $2,833 | $2,833 | $2,833 | $2,833 | $2,833 | $2,833 | $2,833 | $2,833 | |
| General Assumptions | |||||||||||||
| Month 1 | Month 2 | Month 3 | Month 4 | Month 5 | Month 6 | Month 7 | Month 8 | Month 9 | Month 10 | Month 11 | Month 12 | ||
| Plan Month | 1 | 2 | 3 | 4 | 5 | 6 | 7 | 8 | 9 | 10 | 11 | 12 | |
| Current Interest Rate | 7.00% | 7.00% | 7.00% | 7.00% | 7.00% | 7.00% | 7.00% | 7.00% | 7.00% | 7.00% | 7.00% | 7.00% | |
| Long-term Interest Rate | 7.00% | 7.00% | 7.00% | 7.00% | 7.00% | 7.00% | 7.00% | 7.00% | 7.00% | 7.00% | 7.00% | 7.00% | |
| Tax Rate | 24.00% | 24.00% | 24.00% | 24.00% | 24.00% | 24.00% | 24.00% | 24.00% | 24.00% | 24.00% | 24.00% | 24.00% | |
| Other | 0 | 0 | 0 | 0 | 0 | 0 | 0 | 0 | 0 | 0 | 0 | 0 | |
| Pro Forma Profit and Loss | |||||||||||||
| Month 1 | Month 2 | Month 3 | Month 4 | Month 5 | Month 6 | Month 7 | Month 8 | Month 9 | Month 10 | Month 11 | Month 12 | ||
| Sales | $10,800 | $18,000 | $27,000 | $36,000 | $45,563 | $68,343 | $68,343 | $68,343 | $102,515 | $115,329 | $153,771 | $168,171 | |
| Direct Cost of Sales | $8,040 | $13,400 | $20,100 | $26,800 | $33,919 | $50,878 | $50,878 | $50,878 | $76,316 | $85,856 | $114,474 | $125,194 | |
| Other Costs of Sales | $0 | $0 | $0 | $0 | $0 | $0 | $0 | $0 | $0 | $0 | $0 | $0 | |
| Total Cost of Sales | $8,040 | $13,400 | $20,100 | $26,800 | $33,919 | $50,878 | $50,878 | $50,878 | $76,316 | $85,856 | $114,474 | $125,194 | |
| Gross Margin | $2,760 | $4,600 | $6,900 | $9,200 | $11,644 | $17,466 | $17,466 | $17,466 | $26,198 | $29,473 | $39,297 | $42,977 | |
| Gross Margin % | 25.56% | 25.56% | 25.56% | 25.56% | 25.56% | 25.56% | 25.56% | 25.56% | 25.56% | 25.56% | 25.56% | 25.56% | |
| Expenses | |||||||||||||
| Payroll | $2,833 | $2,833 | $2,833 | $2,833 | $2,833 | $2,833 | $2,833 | $2,833 | $2,833 | $2,833 | $2,833 | $2,833 | |
| Sales and Marketing and Other Expenses | $250 | $250 | $250 | $250 | $250 | $250 | $250 | $250 | $250 | $250 | $250 | $250 | |
| Depreciation | $350 | $350 | $350 | $350 | $350 | $350 | $350 | $350 | $350 | $350 | $350 | $350 | |
| Rent | $4,442 | $4,442 | $4,442 | $4,442 | $4,442 | $4,442 | $4,442 | $4,442 | $4,442 | $4,442 | $4,442 | $4,442 | |
| Utilities | $980 | $1,030 | $1,030 | $1,030 | $1,030 | $980 | $980 | $980 | $1,280 | $1,280 | $1,280 | $1,280 | |
| Office Supplies | $100 | $100 | $100 | $100 | $100 | $100 | $100 | $100 | $100 | $100 | $100 | $100 | |
| Insurance | $250 | $250 | $250 | $250 | $250 | $250 | $250 | $250 | $250 | $250 | $250 | $250 | |
| Payroll Taxes | 15% | $0 | $0 | $0 | $0 | $0 | $0 | $0 | $0 | $0 | $0 | $0 | $0 |
| Accountant | $250 | $250 | $250 | $250 | $250 | $250 | $250 | $250 | $250 | $250 | $250 | $250 | |
| Lawyer | $500 | $0 | $0 | $0 | $0 | $0 | $0 | $0 | $0 | $0 | $0 | $500 | |
| Bank Charges | $15 | $15 | $15 | $15 | $15 | $15 | $15 | $15 | $15 | $15 | $15 | $15 | |
| Website Payment Fees | $50 | $50 | $50 | $50 | $50 | $50 | $50 | $50 | $50 | $50 | $50 | $50 | |
| Website Hosting & Support | 0% | $125 | $125 | $125 | $125 | $125 | $125 | $125 | $125 | $125 | $125 | $125 | $125 |
| Repairs and Maintenance | 15% | $250 | $250 | $250 | $250 | $250 | $250 | $250 | $250 | $250 | $250 | $250 | $250 |
| Other | $0 | $0 | $0 | $0 | $0 | $0 | $0 | $0 | $0 | $0 | $0 | $0 | |
| Total Operating Expenses | $10,395 | $9,945 | $9,945 | $9,945 | $9,945 | $9,895 | $9,895 | $9,895 | $10,195 | $10,195 | $10,195 | $10,695 | |
| Profit Before Interest and Taxes | ($7,635) | ($5,345) | ($3,045) | ($745) | $1,698 | $7,570 | $7,570 | $7,570 | $16,003 | $19,278 | $29,102 | $32,282 | |
| EBITDA | ($7,285) | ($4,995) | ($2,695) | ($395) | $2,048 | $7,920 | $7,920 | $7,920 | $16,353 | $19,628 | $29,452 | $32,632 | |
| Interest Expense | $1,504 | $1,493 | $1,483 | $1,472 | $1,461 | $1,451 | $1,440 | $1,429 | $1,418 | $1,408 | $1,397 | $1,386 | |
| Taxes Incurred | ($2,193) | ($1,641) | ($1,087) | ($532) | $57 | $1,469 | $1,471 | $1,474 | $3,500 | $4,289 | $6,649 | $7,415 | |
| Net Profit | ($6,946) | ($5,198) | ($3,441) | ($1,685) | $180 | $4,651 | $4,659 | $4,667 | $11,084 | $13,581 | $21,056 | $23,481 | |
| Net Profit/Sales | -64.32% | -28.88% | -12.75% | -4.68% | 0.40% | 6.81% | 6.82% | 6.83% | 10.81% | 11.78% | 13.69% | 13.96% | |
| Pro Forma Cash Flow | |||||||||||||
| Month 1 | Month 2 | Month 3 | Month 4 | Month 5 | Month 6 | Month 7 | Month 8 | Month 9 | Month 10 | Month 11 | Month 12 | ||
| Cash Received | |||||||||||||
| Cash from Operations | |||||||||||||
| Cash Sales | $10,800 | $18,000 | $27,000 | $36,000 | $45,563 | $68,343 | $68,343 | $68,343 | $102,515 | $115,329 | $153,771 | $168,171 | |
| Subtotal Cash from Operations | $10,800 | $18,000 | $27,000 | $36,000 | $45,563 | $68,343 | $68,343 | $68,343 | $102,515 | $115,329 | $153,771 | $168,171 | |
| Additional Cash Received | |||||||||||||
| Sales Tax, VAT, HST/GST Received | 0.00% | $0 | $0 | $0 | $0 | $0 | $0 | $0 | $0 | $0 | $0 | $0 | $0 |
| New Current Borrowing | $0 | $0 | $0 | $0 | $0 | $0 | $0 | $0 | $0 | $0 | $0 | $0 | |
| New Other Liabilities (interest-free) | $0 | $0 | $0 | $0 | $0 | $0 | $0 | $0 | $0 | $0 | $0 | $0 | |
| New Long-term Liabilities | $0 | $0 | $0 | $0 | $0 | $0 | $0 | $0 | $0 | $0 | $0 | $0 | |
| Sales of Other Current Assets | $0 | $0 | $0 | $0 | $0 | $0 | $0 | $0 | $0 | $0 | $0 | $0 | |
| Sales of Long-term Assets | $0 | $0 | $0 | $0 | $0 | $0 | $0 | $0 | $0 | $0 | $0 | $0 | |
| New Investment Received | $0 | $0 | $0 | $0 | $0 | $0 | $0 | $0 | $0 | $0 | $0 | $0 | |
| Subtotal Cash Received | $10,800 | $18,000 | $27,000 | $36,000 | $45,563 | $68,343 | $68,343 | $68,343 | $102,515 | $115,329 | $153,771 | $168,171 | |
| Expenditures | Month 1 | Month 2 | Month 3 | Month 4 | Month 5 | Month 6 | Month 7 | Month 8 | Month 9 | Month 10 | Month 11 | Month 12 | |
| Expenditures from Operations | |||||||||||||
| Cash Spending | $2,833 | $2,833 | $2,833 | $2,833 | $2,833 | $2,833 | $2,833 | $2,833 | $2,833 | $2,833 | $2,833 | $2,833 | |
| Bill Payments | $480 | $14,790 | $26,201 | $34,869 | $42,144 | $51,001 | $78,542 | $60,501 | $62,351 | $115,990 | $110,789 | $160,756 | |
| Subtotal Spent on Operations | $3,314 | $17,624 | $29,034 | $37,703 | $44,977 | $53,834 | $81,375 | $63,334 | $65,184 | $118,824 | $113,622 | $163,589 | |
| Additional Cash Spent | |||||||||||||
| Sales Tax, VAT, HST/GST Paid Out | $0 | $0 | $0 | $0 | $0 | $0 | $0 | $0 | $0 | $0 | $0 | $0 | |
| Principal Repayment of Current Borrowing | $0 | $0 | $0 | $0 | $0 | $0 | $0 | $0 | $0 | $0 | $0 | $0 | |
| Other Liabilities Principal Repayment | $0 | $0 | $0 | $0 | $0 | $0 | $0 | $0 | $0 | $0 | $0 | $0 | |
| Long-term Liabilities Principal Repayment | $1,840 | $1,840 | $1,840 | $1,840 | $1,840 | $1,840 | $1,840 | $1,840 | $1,840 | $1,840 | $1,840 | $1,840 | |
| Purchase Other Current Assets | $0 | $0 | $0 | $0 | $0 | $0 | $0 | $0 | $0 | $0 | $0 | $0 | |
| Purchase Long-term Assets | $0 | $0 | $0 | $0 | $0 | $0 | $0 | $0 | $0 | $0 | $0 | $0 | |
| Dividends | $0 | $0 | $0 | $0 | $0 | $0 | $0 | $0 | $0 | $0 | $0 | $0 | |
| Subtotal Cash Spent | $5,154 | $19,464 | $30,874 | $39,543 | $46,817 | $55,674 | $83,215 | $65,174 | $67,024 | $120,664 | $115,462 | $165,429 | |
| Net Cash Flow | $5,646 | ($1,464) | ($3,874) | ($3,543) | ($1,254) | $12,669 | ($14,872) | $3,169 | $35,491 | ($5,335) | $38,309 | $2,742 | |
| Cash Balance | $39,646 | $38,183 | $34,309 | $30,766 | $29,512 | $42,181 | $27,309 | $30,478 | $65,969 | $60,633 | $98,942 | $101,685 | |
| Pro Forma Balance Sheet | |||||||||||||
| Month 1 | Month 2 | Month 3 | Month 4 | Month 5 | Month 6 | Month 7 | Month 8 | Month 9 | Month 10 | Month 11 | Month 12 | ||
| Assets | Starting Balances | ||||||||||||
| Current Assets | |||||||||||||
| Cash | $34,000 | $39,646 | $38,183 | $34,309 | $30,766 | $29,512 | $42,181 | $27,309 | $30,478 | $65,969 | $60,633 | $98,942 | $101,685 |
| Inventory | $9,000 | $8,844 | $14,740 | $22,110 | $29,480 | $37,311 | $55,966 | $55,966 | $55,966 | $83,948 | $94,441 | $125,922 | $137,714 |
| Other Current Assets | $8,000 | $8,000 | $8,000 | $8,000 | $8,000 | $8,000 | $8,000 | $8,000 | $8,000 | $8,000 | $8,000 | $8,000 | $8,000 |
| Total Current Assets | $51,000 | $56,490 | $60,923 | $64,419 | $68,246 | $74,822 | $106,146 | $91,274 | $94,444 | $157,917 | $163,075 | $232,864 | $247,399 |
| Long-term Assets | |||||||||||||
| Long-term Assets | $42,000 | $42,000 | $42,000 | $42,000 | $42,000 | $42,000 | $42,000 | $42,000 | $42,000 | $42,000 | $42,000 | $42,000 | $42,000 |
| Accumulated Depreciation | $0 | $350 | $700 | $1,050 | $1,400 | $1,750 | $2,100 | $2,450 | $2,800 | $3,150 | $3,500 | $3,850 | $4,200 |
| Total Long-term Assets | $42,000 | $41,650 | $41,300 | $40,950 | $40,600 | $40,250 | $39,900 | $39,550 | $39,200 | $38,850 | $38,500 | $38,150 | $37,800 |
| Total Assets | $93,000 | $98,140 | $102,223 | $105,369 | $108,846 | $115,072 | $146,046 | $130,824 | $133,644 | $196,767 | $201,575 | $271,014 | $285,199 |
| Liabilities and Capital | Month 1 | Month 2 | Month 3 | Month 4 | Month 5 | Month 6 | Month 7 | Month 8 | Month 9 | Month 10 | Month 11 | Month 12 | |
| Current Liabilities | |||||||||||||
| Accounts Payable | $0 | $13,927 | $25,047 | $33,474 | $40,476 | $48,362 | $76,525 | $58,484 | $58,476 | $112,355 | $105,422 | $155,646 | $148,189 |
| Current Borrowing | $0 | $0 | $0 | $0 | $0 | $0 | $0 | $0 | $0 | $0 | $0 | $0 | $0 |
| Other Current Liabilities | $0 | $0 | $0 | $0 | $0 | $0 | $0 | $0 | $0 | $0 | $0 | $0 | $0 |
| Subtotal Current Liabilities | $0 | $13,927 | $25,047 | $33,474 | $40,476 | $48,362 | $76,525 | $58,484 | $58,476 | $112,355 | $105,422 | $155,646 | $148,189 |
| Long-term Liabilities | $259,708 | $257,868 | $256,028 | $254,188 | $252,348 | $250,508 | $248,668 | $246,828 | $244,988 | $243,148 | $241,308 | $239,468 | $237,628 |
| Total Liabilities | $259,708 | $271,795 | $281,075 | $287,662 | $292,824 | $298,870 | $325,193 | $305,312 | $303,464 | $355,503 | $346,730 | $395,114 | $385,817 |
| Paid-in Capital | $30,000 | $30,000 | $30,000 | $30,000 | $30,000 | $30,000 | $30,000 | $30,000 | $30,000 | $30,000 | $30,000 | $30,000 | $30,000 |
| Retained Earnings | ($196,708) | ($196,708) | ($196,708) | ($196,708) | ($196,708) | ($196,708) | ($196,708) | ($196,708) | ($196,708) | ($196,708) | ($196,708) | ($196,708) | ($196,708) |
| Earnings | $0 | ($6,946) | ($12,144) | ($15,585) | ($17,270) | ($17,090) | ($12,439) | ($7,780) | ($3,113) | $7,972 | $21,553 | $42,608 | $66,089 |
| Total Capital | ($166,708) | ($173,654) | ($178,852) | ($182,293) | ($183,978) | ($183,798) | ($179,147) | ($174,488) | ($169,821) | ($158,736) | ($145,155) | ($124,100) | ($100,619) |
| Total Liabilities and Capital | $93,000 | $98,140 | $102,223 | $105,369 | $108,846 | $115,072 | $146,046 | $130,824 | $133,644 | $196,767 | $201,575 | $271,014 | $285,199 |
| Net Worth | ($166,708) | ($173,654) | ($178,852) | ($182,293) | ($183,978) | ($183,798) | ($179,147) | ($174,488) | ($169,821) | ($158,736) | ($145,155) | ($124,100) | ($100,619) |


